Coal fly ash: linking immersion freezing behavior and physicochemical particle properties - Atmos. Chem. Phys
←
→
Page content transcription
If your browser does not render page correctly, please read the page content below
Atmos. Chem. Phys., 18, 13903–13923, 2018
https://doi.org/10.5194/acp-18-13903-2018
© Author(s) 2018. This work is distributed under
the Creative Commons Attribution 4.0 License.

Coal fly ash: linking immersion freezing behavior and
physicochemical particle properties
Sarah Grawe1 , Stefanie Augustin-Bauditz1,a , Hans-Christian Clemen2 , Martin Ebert3 , Stine Eriksen Hammer3 ,
Jasmin Lubitz1 , Naama Reicher4 , Yinon Rudich4 , Johannes Schneider2 , Robert Staacke5 , Frank Stratmann1 ,
André Welti1,b , and Heike Wex1
1 Leibniz Institute for Tropospheric Research, Experimental Aerosol and Cloud Microphysics Department, Leipzig, Germany
2 Max Planck Institute for Chemistry, Particle Chemistry Department, Mainz, Germany
3 Darmstadt University of Technology, Institute of Applied Geosciences, Darmstadt, Germany
4 Weizmann Institute of Science, Department of Earth and Planetary Sciences, Rehovot, Israel
5 University of Leipzig, Felix Bloch Institute for Solid State Physics,

Division of Nuclear Solid State Physics, Leipzig, Germany
a now at: Deutscher Wetterdienst, Hamburg, Germany
b now at: Finnish Meteorological Institute, Helsinki, Finland

Correspondence: Sarah Grawe (grawe@tropos.de)

Received: 11 June 2018 – Discussion started: 3 July 2018
Revised: 29 August 2018 – Accepted: 7 September 2018 – Published: 2 October 2018

Abstract. To date, only a few studies have investigated the        ciency of wet-generated particles is in agreement with the
potential of coal fly ash particles to trigger heterogeneous ice   cold-stage measurements. In order to understand the reason
nucleation in cloud droplets. The presented measurements           behind the deactivation, a series of chemical composition,
aim at expanding the sparse dataset and improving process          morphology, and crystallography analyses (single particle
understanding of how physicochemical particle properties           mass spectrometry, scanning electron microscopy coupled
can influence the freezing behavior of coal fly ash particles      with energy dispersive X-ray microanalysis, X-ray diffrac-
immersed in water.                                                 tion analysis) were performed with dry- and wet-generated
   Firstly, immersion freezing measurements were performed         particles. From these investigations, we conclude that anhy-
with two single particle techniques, i.e., the Leipzig Aerosol     drous CaSO4 and CaO – which, if investigated in pure form,
Cloud Interaction Simulator (LACIS) and the SPectrometer           show the same qualitative immersion freezing behavior as
for Ice Nuclei (SPIN). The effect of suspension time on the        observed for dry-generated coal fly ash particles – contribute
efficiency of the coal fly ash particles when immersed in a        to triggering heterogeneous ice nucleation at the particle–
cloud droplet is analyzed based on the different residence         water interface. The observed deactivation in contact with
times of the two instruments and employing both dry and            water is related to changes in the particle surface proper-
wet particle generation. Secondly, two cold-stage setups, one      ties which are potentially caused by hydration of CaSO4 and
using microliter sized droplets (Leipzig Ice Nucleation Ar-        CaO. The contribution of coal fly ash to the ambient popula-
ray) and one using nanoliter sized droplets (WeIzmann Su-          tion of ice-nucleating particles therefore depends on whether
percooled Droplets Observation on Microarray setup) were           and for how long particles are immersed in cloud droplets.
applied.
   We found that coal fly ash particles are comparable to
mineral dust in their immersion freezing behavior when be-
ing dry generated. However, a significant decrease in im-
mersion freezing efficiency was observed during experiments
with wet-generated particles in LACIS and SPIN. The effi-

Published by Copernicus Publications on behalf of the European Geosciences Union.
13904                                    S. Grawe et al.: Immersion freezing behavior and particle properties of coal fly ash

1   Introduction                                                        A lot of research has already been conducted in the field
                                                                     of CFA sample characterization for identifying CFA parti-
It is known that naturally occurring aerosol such as bio-            cles in the atmosphere. This was mainly driven by concerns
logical particles (e.g., bacteria, pollen, spores) and mineral       about the negative effects of CFA particles on human health
dust are acting as ice-nucleating particles (INPs; Hoose and         (e.g., Davison et al., 1974; Damle et al., 1982; Yi et al.,
Möhler, 2012 and references therein). In contrast, there is          2006; and references therein). These studies show that CFA
an ongoing discussion about the impact of anthropogenic              has a complex and highly variable composition. Except for
aerosol emissions on the concentration of atmospheric INPs           some trace elements whose contents are heterogeneously dis-
(e.g., Szyrmer and Zawadzki, 1997; Chen et al., 2018). The           tributed among different size fractions, CFA composition is
strongest source of anthropogenic aerosol is the combustion          comparable to mineral dust, making it difficult to identify via
of fossil fuels, where primary particles such as carbonaceous        single particle mass spectrometry (Cziczo et al., 2004, 2006;
aerosol and ash, as well as secondary particles from gaseous         Kamphus et al., 2010). CFA particles are, in contrast to irreg-
precursors, are generated.                                           ularly shaped mineral dust particles, often spherical because
   Carbonaceous aerosol, such as soot, which is a product of         of their generation process, where minerals melt and form
incomplete combustion of organic material, has been shown            spherical droplets that retain their shape upon solidification
to act as INPs (e.g., DeMott, 1990; Diehl and Mitra, 1998;           (Damle et al., 1982; Flagan and Seinfeld, 1988a). However,
Fornea et al., 2009). However, there are large discrepancies         shape is not a perfect criterion for identifying CFA, as other
between studies investigating the ice nucleation ability of          high-temperature processes such as fuel-oil combustion or
soot, which might be related to the source and/or mixing state       metal processing also emit spherical fly ash particles. In addi-
of the particles (Kanji et al., 2017). Hoose and Möhler (2012)       tion, there are various aerosol types which occur in spherical
summarize that “soot is a generally worse ice nucleus than           shapes, e.g., biological particles (Huffman et al., 2012), tar
mineral dust”. In contrast to soot and other carbonaceous            balls (Laskin et al., 2006; Sedlacek III et al., 2018), or del-
aerosol types, ash only contains a limited amount of carbon.         iquesced salt particles (Freney et al., 2009). In conclusion,
Defined as the solid remains from the combustion of organic          a reliable identification of CFA particles is not trivial and
substances, e.g., wood or fossil fuels, it mostly consists of        requires a combination of chemical composition and mor-
the noncombustible constituents in the fuel, i.e., mineral in-       phology analyses (e.g., DeMott et al., 2003; Weinbruch et al.,
clusions and atoms other than C and H, e.g., K, Ca, Mn, Fe,          2010, 2012).
etc. (Flagan and Seinfeld, 1988a). A distinction is made be-            Concerning the ice nucleation activity of ash particles,
tween the fine ash fraction, i.e., fly ash, that is emitted during   only few studies have been published so far. Early investi-
combustion together with flue gases, and the coarse ash frac-        gations of aerosol from coal-fired power plant plumes were
tion, i.e., bottom ash. The latter is defined as the fraction that   contradictory as to whether the particles are able to act as
remains in the power plant, fireplace, or on the ground after        INPs (Parungo et al., 1978) or not (Schnell et al., 1976).
a wildfire and can be emitted due to wind erosion.                   More recent studies (Havlíček et al., 1993; Umo et al., 2015;
   Coal is difficult to substitute in the energy mix of most in-     Garimella, 2016; Grawe et al., 2016) agreed that ash parti-
dustrial countries and hence it is only slowly replaced by re-       cles indeed trigger heterogeneous ice nucleation. Havlíček
newable energy sources (U. S. Energy Information Adminis-            et al. (1993) investigated chemical composition and ice nu-
tration, 2017). In total, 6711 coal-fired power plants (30 MW        cleation characteristics of CFA from nine different power
and larger; endcoal.org, 2017; status: July 2017) are in opera-      plants in the former Czechoslovakia focusing on the effect of
tion worldwide, producing 600 Mt a−1 of coal ash (Ahmaruz-           water-soluble material in the samples. The chemical compo-
zaman, 2010). The vast majority of this mass is not emitted          sition analysis showed that the water-soluble fraction of the
into the atmosphere, as coal-fired power plants are equipped         samples varied between 0.43 and 1.34 wt % and mainly con-
with different types of particle removal technology to clean         sisted of anhydrite (anhydrous CaSO4 ). Ice nucleation ex-
flue gases of coal fly ash (CFA). Estimating CFA emissions           periments were carried out with two methods. Firstly, poly-
is not trivial, because filtering systems show varying efficien-     disperse CFA particles were aerosolized in a thermodiffu-
cies and part of the collected CFA is emitted during disposal        sion chamber subsaturated with respect to liquid water at
(Mueller et al., 2013). A rough assessment was given by Smil         −15 ◦ C, i.e., only deposition nucleation was investigated.
(2008), estimating that 30 Mt a−1 of CFA are released into           Secondly, suspensions of CFA in distilled water were used
the atmosphere worldwide. Reff et al. (2009) state that coal         to produce droplets onto a cooled plate (cold stage), i.e., im-
combustion causes PM2.5 emissions of ∼ 0.5 Mt a−1 in the             mersion freezing was investigated. The water-soluble com-
USA. In addition to a large uncertainty in these estimates,          ponents were separated from all samples and ice nucleation
there is no detailed information about temporal and spatial          experiments were carried out with the original samples, the
variability in CFA emission and dispersion, which is impor-          water-insoluble components, and the water-soluble compo-
tant for assessing the effect of CFA particles on cloud forma-       nents. Immersion freezing was found to be less efficient than
tion and glaciation.                                                 deposition nucleation in all cases. The water-insoluble com-
                                                                     ponents were up to 3 orders of magnitude less efficient in the

Atmos. Chem. Phys., 18, 13903–13923, 2018                                            www.atmos-chem-phys.net/18/13903/2018/
S. Grawe et al.: Immersion freezing behavior and particle properties of coal fly ash 13905 deposition mode than the untreated samples. However, when Garimella (2016) that the size dependent enrichment of trace the water-soluble components alone were investigated, they elements causes the discrepancy between measurements with showed surprisingly low efficiency. This finding illustrates single particle instruments and cold stages. the complex interplay of physicochemical particle properties The presented study intends to function as a follow-up to and freezing behavior, as the water-soluble components in- our previous paper and aims at answering the following ques- creased the ice nucleation efficiency only when associated tions: with the CFA particles. Four ash samples including CFA, coal bottom ash, wood – Do CFA samples from different power plants feature a bottom ash, and bottom ash from a domestic oven were in- similar immersion freezing behavior? vestigated by Umo et al. (2015). The immersion freezing be- – Is the deactivation of the ice nucleation properties in the havior was quantified using a cold-stage setup (Whale et al., transition from dry to wet particle generation observable 2015). In comparison to the bottom ashes, CFA was more ef- for different CFA samples? ficient at nucleating ice between −17 and −27 ◦ C, showing a strong increase starting at −16 ◦ C and an apparent plateau – Is it possible to find a connection between physico- below roughly −24 ◦ C. The bottom ashes behaved similar to chemical sample properties and the observed immersion one another, with a slight trend of coal bottom ash being less freezing behavior? efficient and wood bottom ash being more efficient. Garimella (2016) investigated the freezing behavior of – Which particle generation technique (dry or wet particle four different CFA samples from the USA using the SPec- generation) or measurement method (single particle or trometer for Ice Nuclei (SPIN; Droplet Measurement Tech- cold stage) is appropriate for representing atmospheric nologies Inc., Boulder, CO, USA). In this study, particles processes after CFA emission? were dry-generated and size selected. Activated fractions of Four CFA samples from German power plants were inves- 1 % were observed at T < − 30 ◦ C (1.25
13906                                                       S. Grawe et al.: Immersion freezing behavior and particle properties of coal fly ash

      +   -
                                                                                                  2.2.1   Dry particle generation
                                                                             Inlet   Saturator
       LINA                         DMA           CPC

                                                                              L      Sheath air
                                                                                                  The dry CFA samples were placed into an aerosol generator
                                  Neutralizer           SPIN
                                                                             A                    operating via pressurized air and an electric imbalance mo-
                                                               Multi-         C      TOPS-Ice     tor (Grawe et al., 2016). The samples were not sieved prior
                        Dryer                   Cyclone        MINI
                                                                              I
                       Atomizer                 Generator          ALABAMA
                                                                                                  to aerosol generation. The aerosol was sent through a mixing
      +   -                                                                   S
                                                                                                  bottle and a cyclone (D50 = 500 nm) to reduce the amount
                      Ash water                  Dry ash
                     suspension                  sample                                           of large particles in the flow. Further downstream, a neu-
                                                                                                  tralizer was passed, before a differential mobility analyzer
                                                                                                  (DMA, Vienna type, medium) was used for size selection. A
      WISDOM       Fresh / after 24 h                                                             mobility diameter of 300 nm was chosen for the immersion
                                                                                                  freezing experiments with LACIS and SPIN for two reasons.
Figure 1. Instrumental setup during the INUIT campaign.                                           Firstly, electrostatic precipitators have a minimum collection
                                                                                                  efficiency for particle sizes between 0.1 and 1 µm (Flagan
                                                                                                  and Seinfeld, 1988b; Nóbrega et al., 2004; Kim et al., 2012),
                                                                                                  meaning that CFA particles in this size range are more likely
2.1   Origin of the samples
                                                                                                  to be emitted compared to smaller or larger particles. Sec-
                                                                                                  ondly, 300 nm particles will experience relevant atmospheric
The CFA samples were taken from the electrostatic precipi-                                        residence times once emitted (Jaenicke, 1978).
tators1 of four coal-fired power plants in Germany. It is un-                                        Afterwards, the quasi-monodisperse aerosol was dis-
known which flue gas desulfurization technique is applied in                                      tributed to a condensation particle counter (CPC, model
the power plants or whether the electrostatic precipitators are                                   3010, TSI Inc., St. Paul, MN, USA), LACIS, SPIN, multi-
installed up- or downstream of the flue gas desulfurization                                       MINI, and ALABAMA. ALABAMA measurements of vac-
systems. This technical information could either not be ob-                                       uum aerodynamic diameter were used for multiply charged
tained, or is unknown to us because the sample origin must                                        fraction determination. The multiple charge correction was
remain anonymous. CFA1 is identical to the CFA sample                                             made using frozen fraction values (fice , number of frozen
from Grawe et al. (2016) and originates from the Lippen-                                          hydrometeors divided by total number of hydrometeors). The
dorf power plant situated 15 km south of Leipzig, Germany.                                        method and results are described in Sect. S7 in the Supple-
CFA1, CFA2, and CFA4 are from brown (sub-bituminous)                                              ment. Unfortunately, only data acquired in parallel to AL-
coal combustion, CFA3 is from black (bituminous) coal com-                                        ABAMA measurements could be corrected. Data without
bustion.                                                                                          multiple charge correction are indicated.
   Quicklime (CaO), anhydrite (CaSO4 ), and gypsum
(CaSO4 q2H2 O) from Merck KGaA (Darmstadt, Germany)                                               2.2.2   Preparation of CFA suspensions for cold stages
were used for additional investigations.                                                                  and wet particle generation

2.2   Sample preparation and particle generation                                                  The CFA–water suspensions for LACIS, SPIN, and LINA
                                                                                                  measurements were prepared following the description in
Two different kinds of particle generation were used in con-                                      Umo et al. (2015). Briefly, a certain amount of CFA was
nection with the LACIS and SPIN immersion freezing ex-                                            mixed with distilled water (LINA: 0.1 g CFA in 100 mL wa-
periments: dry particle generation, i.e., aerosolization of par-                                  ter, LACIS and SPIN: 0.5 g CFA in 100 mL water) and ultra-
ticles from dry ash powder, and wet particle generation, i.e.,                                    sonicated (RK100H Sonorex Super, BANDELIN electronic
atomization of a CFA–water suspension. Suspensions were                                           GmbH & Co. KG, Berlin, Germany) for 10 min. Afterwards,
also used for the experiments with LINA and WISDOM.                                               the suspension was stirred with a magnetic stirrer for 24 h.
                                                                                                  This approach was chosen to allow comparability to results
                                                                                                  by Umo et al. (2015) and Grawe et al. (2016). The procedure
                                                                                                  helps with breaking up large aggregates and hence prevents
    1 Electrostatic precipitators work on the principle of charging
                                                                                                  fast sedimentation that would lead to an uneven distribution
the particles and subsequently sending the flow through an elec-                                  of material in the droplets on LINA. As sedimentation is not
tric field. Particles then migrate to the oppositely charged electrode
                                                                                                  a limiting factor for wet particle generation (a flask shaker
and hence particulate matter is removed from the flue gas (Flagan
and Seinfeld, 1988b). The precipitator itself does not alter particle
                                                                                                  was used), LACIS measurements were performed with both
properties like morphology or chemical composition, only number                                   the standard suspensions (ultrasonification and 24 h stirring)
and mass size distributions are changed (Yi et al., 2006). However,                               and suspensions that were prepared right before the experi-
it has been argued that particles which are not captured potentially                              ment by simply mixing 0.5 g CFA with 100 mL distilled wa-
contain a larger amount of species condensing from the gas phase                                  ter. In this way, particles were in suspension for no more than
onto the CFA surface upon cooling (Parungo et al., 1978).                                         5 min before being used for LACIS measurements. Due to in-

Atmos. Chem. Phys., 18, 13903–13923, 2018                                                                         www.atmos-chem-phys.net/18/13903/2018/
S. Grawe et al.: Immersion freezing behavior and particle properties of coal fly ash 13907
strument availability, SPIN measurements could only be per- fice error is indicated by the standard deviation of the sep-
formed with the standard suspensions. The suspensions, ei- arate measurements. Otherwise, a Poisson error is given de-
ther fresh or standard, were sprayed with an atomizer (similar pending on the total number of classified hydrometeors in a
to Model 3076, TSI Inc., St. Paul, MN, USA) and resulting single measurement. The temperature error of ±0.3 K is de-
droplets were sent through a diffusion dryer. Then, size selec- fined by the temperature stability of the thermostats. The ice
tion of the particles by the DMA and distribution to LACIS, nucleation active surface site density ns was calculated from
SPIN, CPC, multi-MINI, and ALABAMA took place. Eq. (1) assuming the particle surface area Ap to be equal to
In contrast to LINA measurements, size selection of the the surface area of a sphere with a diameter of 300 nm.
CFA samples was necessary for WISDOM because large par-
ticles that are present in the original sample would clog the
ln(1 − fice (T ))
microfluidic device which is used for droplet production (see ns (T ) = − (1)
Sect. 2.3.4). Size selection took place by running dry parti- Ap
cle generation (aerosol generator, mixing bottle, cyclone) for
2.3.2 SPIN
several hours and collecting the accumulated material from
the cyclone (D50 = 450 nm). During this procedure, coarse SPIN is a continuous flow diffusion chamber (CFDC) that
material was deposited inside the mixing bottle and a sub- has been described in detail by Garimella et al. (2016). In
fraction of the bulk, hereafter referred to as fine CFA, re- contrast to LACIS, the fraction of particles active as INPs
mained in the cyclone. Suspensions of 0.1 g fine CFA in (activated fraction, AF) is calculated by dividing the number
100 mL distilled water were mixed for three cycles of 30 s of ice crystals detected with an optical particle counter (OPC)
each with 10 s break in a small-volume sonicator (UP200St, by the total number of aerosol particles measured with a CPC
Hielscher Ultrasonics GmbH, Teltow, Germany) and were (model 3772, TSI Inc., St. Paul, MN, USA). A threshold size
used for droplet production and immersion freezing exper- of 3 µm was used to identify ice crystals in the OPC signals.
iments within 2 min. The uncertainty in AF is 14 % due to 10 % uncertainty in
both CPC and OPC. The temperature uncertainties represent
2.3 Immersion freezing instrumentation the highest and lowest deviations from the average lamina
temperature in the chamber. When compared to LACIS mea-
2.3.1 LACIS surements, SPIN data provide information on how immer-
sion freezing results are affected by the different residence
LACIS is a laminar flow tube consisting of seven 1 m long times in the two instruments. Ice nucleation times in SPIN
sections, each temperature controlled by individual ther- depend on thermodynamic conditions and are between 8 and
mostats. At the inlet, the aerosol flow is enclosed by a hu- 12 s. In addition to the cyclone, an impactor (0.071 cm ori-
midified sheath flow. As a result, a stable 2 mm wide particle fice, TSI Inc., St. Paul, MN, USA) with D50 = 500 nm was
beam is created along the LACIS centerline, ensuring that used upstream of the SPIN inlet to reduce the amount of mul-
all particles experience identical thermodynamic conditions. tiply charged particles in the CFA aerosol. Hence, no multi-
Supersaturation is created by adjusting the dew point of the ple charge correction was applied to the SPIN data.
sheath air and the wall temperature. Like this, each particle
is activated to a droplet before being cooled down for immer- 2.3.3 LINA
sion freezing investigation. The ice nucleation time in LACIS
is 1.6 s. Based on the Bielefeld Ice Nucleation ARraY (BINARY;
Supercooled liquid droplets and ice particles coexist at Budke and Koop, 2015), the newly developed LINA is
the outlet of the tube in a certain temperature range above a cold-stage setup for investigating immersion freezing.
the homogeneous freezing limit. The thermo-stabilized Opti- Ninety suspension droplets, each 1 µL in volume, were
cal Particle Spectrometer for the detection of Ice (TOPS-Ice; placed into separate compartments onto a hydrophobic glass
Clauß et al., 2013) is used to determine the phase state of the slide. The compartments, formed by a perforated aluminum
hydrometeors and from this fice . The measurement principle plate covered with a second glass slide, prevent interac-
exploits the difference in scattering properties, i.e., depolar- tion between the droplets, e.g., via the Wegener–Bergeron–
ization, between nonspherical ice particles and spherical liq- Findeisen process or splintering while freezing. Also, the
uid droplets. compartments suppress evaporation of the droplets. A cool-
At least 2000 hydrometeors were classified for each ing stage (LTS120, Linkam Scientific Instruments, Water-
LACIS data point presented in this study. The only excep- field, UK) with a 40 mm×40 mm Peltier element is used for
tion to this is the measurement with the fresh CFA3 suspen- cooling the sample array at a rate of 1 K min−1 . A thin layer
sion where, due to low particle number concentrations, only of squalene oil on top of the Peltier element guarantees di-
∼ 500 hydrometeors were considered (see Fig. 5). Occasion- rect contact to the glass slide and improves heat transfer away
ally, three or more data points of separate measurements un- from the droplets. The setup is situated in an aluminum hous-
der the same conditions were averaged. In these cases, the ing that is purged with particle-free, dry air during the exper-
www.atmos-chem-phys.net/18/13903/2018/ Atmos. Chem. Phys., 18, 13903–13923, 201813908 S. Grawe et al.: Immersion freezing behavior and particle properties of coal fly ash
iment. See Chen et al. (2018) for details on the temperature and crystallography of the CFA samples. The most impor-
calibration routine. tant findings, which will be referred to in the discussion of
The determination of fice is almost fully automated. A dig- the immersion freezing results (see Sect. 3), are summarized.
ital camera coupled with an LED dome light takes images For more details concerning sample characterization, see the
every 6 s, which is equal to a temperature resolution of 0.1 K Supplement.
at a cooling rate of 1 K min−1 . Parts of the LED light are
shielded with a cardboard ring to cause ring-shaped struc- 2.4.1 Size-selected CFA
tures to be reflected from the liquid droplets. As the reflec-
tive properties of a droplet change upon freezing, the reflec-
tion of the ring vanishes directly after the phase change. The ALABAMA
images, each relating to a certain temperature, are later im-
ported into a computer program that detects the number of ALABAMA, which was originally developed for aircraft op-
rings. From this, fice (T ) can be derived. See Appendix A for eration (Brands et al., 2011) but is also used in ground-based
details on the correction of LINA data with respect to back- campaigns (Roth et al., 2016; Schmidt et al., 2017), is a sin-
ground INPs, calculation of ns , and error estimation. gle particle laser ablation instrument using a Z-shaped time-
of-flight mass spectrometer. After entering the instrument,
2.3.4 WISDOM aerosol particles are focused to a narrow particle beam by
an aerodynamic lens. In the following, the particles pass two
The WISDOM setup (Reicher et al., 2018) was used to study subsequent detection lasers (wavelength of 405 nm). Infor-
the immersion freezing of the fine CFA fraction. WISDOM mation about the time-of-flight between the detection lasers
is a freezing array of monodisperse nanoliter droplets that are is needed to trigger the ablation laser. In addition, the time-
produced by a microfluidic device and subsequently arranged of-flight can be used to calculate the particle vacuum aerody-
into an array of chambers based on Schmitz et al. (2009). namic diameter for particles in a size range between ∼ 200
Droplets are suspended in an oil mixture, consisting of min- and 2500 nm. The ablation laser, a Nd:YAG operating at a
eral oil (Sigma Aldrich, St. Louis, MO, USA) stabilized wavelength of 266 nm, evaporates the particles and ionizes
with 2 wt % non-ionic surfactant (span80® , Sigma Aldrich, the molecule fragments. The resulting ions are analyzed in
St. Louis, MO, USA). Pure water droplets within the device the bipolar mass spectrometer such that one anion and one
can be supercooled to below −35 ◦ C, where first freezing cation spectrum is obtained for each single particle, yielding
occurs, i.e., above this temperature no correction regarding information about their chemical composition. Single parti-
background INPs is necessary. The temperature accuracy of cle mass spectra were averaged, resulting in a mean chemical
WISDOM is 0.34 ◦ C. Freezing is observed by a microscope composition of each CFA sample for both dry and wet parti-
(BX51 with 10× objective and transmission mode, Olympus cle generation.
Optical, Tokyo, Japan) and detected for each droplet individ- The overall composition of the CFA samples is compara-
ually when the optical brightness of the droplet decreases due ble to mineral dust, as elements like Al, Ca, K, Fe, Si, S, P,
to the formation of ice crystals. The microfluidic devices are Na, and Mg frequently occur. Some trace elements seem to
fabricated in the laboratory from polydimethylsiloxane and be characteristic for the sampled CFA particles. Especially
attached to a 1 mm microscope slide using oxygen plasma Ti-, Sr-, and Ba-related mass-to-charge ratios occur in more
treatment. Freezing experiments are conducted in a commer- than 50 % of all dry-sampled particles (see Figs. S1 and S2)
cial cryostage (THMS600, Linkam Scientific Instruments, and could potentially be used as indicators for CFA parti-
Waterfield, UK) at a cooling rate of 1 K min−1 . cles in the atmosphere, together with the overall fingerprint
ns was determined according to Eq. (2), with the droplet of their mass spectra. There are some features that could ex-
volume Vdrop = 478 ± 78 pL, the Brunauer–Emmett–Teller plain differences in immersion freezing behavior between the
(BET; Brunauer et al., 1938) specific surface area of the fine different samples (see Fig. S4). For example, CFA1 has the
CFA fraction ABET (see Sect. S8), and the concentration of highest concentration of Ca and S in 300 nm particles and
CFA in suspension C. The ns error was estimated by prop- CFA3 has the lowest concentration of Ca and S in 300 nm
agating the uncertainties in the measurements of Vdrop and particles, whereas CFA3 has the highest concentration of Si
ABET , and the Poisson distribution of particles in suspension. in 300 nm particles and CFA1 has the lowest concentration of
Si in 300 nm particles. Furthermore, CFA1 is the sample with
ln(1 − fice (T )) the highest concentration of Pb in 300 nm particles. The com-
ns (T ) = − (2) parison of averaged mass spectra of dry- and wet-generated
Vdrop · ABET · C
CFA particles indicates the hydration of oxides, e.g., CaO,
2.4 Sample characterization SrO, and BaO, in suspension (see Fig. S3). S-containing sub-
stances are present to a lower extent in wet-generated CFA
In the following sections, we describe the instrumentation compared to dry-generated particles. A more detailed de-
used for the analyses of chemical composition, morphology, scription of the ALABAMA results is given in Sect. S1.
Atmos. Chem. Phys., 18, 13903–13923, 2018 www.atmos-chem-phys.net/18/13903/2018/S. Grawe et al.: Immersion freezing behavior and particle properties of coal fly ash 13909
Multi-MINI – ESEM/EDX reference patterns from the Crystallography Open Database
(Gražulis et al., 2009).
Particles were collected on boron substrates behind the DMA The XRD patterns indicate quartz (SiO2 ) as the major
with the multi-MINI (Ebert et al., 2016), using one stage crystalline phase in all CFA samples (see Figs. S7 to S10).
with D50 = 1 µm. Sampling durations ranged from 30 s to Furthermore, anhydrite and quicklime occur in all samples,
6 min, depending on average particle number concentrations but to the largest extent in CFA1. CFA1 is also the only sam-
of the different samples (80 to 300 cm−3 ). Chemical compo- ple where a definite change can be seen between the original
sition, size, and morphology were investigated with a Quanta dry sample and the sample that was produced by evaporat-
400 FEG ESEM (FEI Company, Hillsboro, OR, USA). No ing all water from the suspension. Here, the conversion of
coating was applied to the substrates prior to the ESEM/EDX anhydrite (CaSO4 ) to gypsum (CaSO4 q2H2 O, see R1) and
investigations. Particles impacted on the substrate located the conversion of quicklime (CaO) to calcite (CaCO3 , see
in the impaction spot were randomly selected for analy- R2 and R3) can be observed. CFA3 is the sample with the
sis. Chemical elements with an atomic number larger than highest amorphous, i.e., noncrystalline, fraction in bulk, and
5 were detected with an EDX detector and analyzed with likely also in 300 nm particles, as an increase in the amor-
the AZtec software (version 3.3 SP1, Oxford Instruments, phous fraction in CFA towards smaller particle sizes has been
Abingdon, UK). All measurements were carried out with reported in a previous study (Matsunaga et al., 2002). A more
12.5 keV, 10 mm working distance, and 20 s acquisition time detailed description of the XRD results is given in Sect. S3.
per particle.
The ESEM images (see Figs. S5 and S6) show that CFA1
is special in terms of particle morphology. Dry-generated CaSO4 (s) + 2H2 O(l) → CaSO4 q2H2 O(s) (R1)
CFA1 particles consist of irregularly shaped agglomerates of CaO(s) + H2 O(l) → Ca(OH)2 (s) (R2)
small spherules, which were not observed to this extent for
Ca(OH)2 (s) + CO2 (aq) → CaCO3 (s) + H2 O(l) (R3)
the other samples. Wet-generated CFA1 particles appear to
be an external mixture of spherules and needle-shaped parti-
cles. CFA1 is the only sample for which needle-shaped par- Chemical composition
ticles were observed in connection with wet particle genera-
tion, and also the only sample for which a clear difference in The bulk chemical composition analysis was performed us-
morphology was observed between the dry and wet particle ing inductively coupled plasma-sector field mass spectrom-
generation methods. The major elements detected by EDX etry (ICP-SFMS) at ALS Scandinavia AB (Luleå, Sweden).
agree with the ones identified in the ALABAMA mass spec- Measured mass fractions of major ions were recalculated into
tra (see Table S1). However, trace elements, e.g., Ti, Sr, and their most common oxide forms (see Fig. S11). Because of
Ba, could not be found, presumably for statistical reasons. A its high CaO content of 26 wt %, CFA1 is classified as class
more detailed description of the ESEM/EDX results is given C CFA according to the American Society for Testing Ma-
in Sect. S2. terials (ASTM, 2015, standard C618). Class C CFA is ce-
mentitious, i.e., self-hardening in contact with water. The oc-
currence of needle-shaped particles in wet-generated CFA1
2.4.2 Bulk CFA
could cause this cementitious property. CFA2, CFA3, and
CFA4 are class F CFA, meaning that additives are needed to
XRD induce hardening of a CFA–water mixture. Loss on ignition
(LOI) values were determined by heating a defined amount
For the crystallographic characterization of the CFA samples, of the CFA samples to 1000 ◦ C and comparing pre- and post-
X-ray diffraction (XRD) analyses were performed with both ignition weights. LOI values are proportional to the amount
dry particles and suspension particles. Dry particles were of unburnt fuel resulting from incomplete combustion in the
ground using a mortar and pestle before being pressed into a power plants. No weight change within measurement uncer-
sample holder as densely as possible. CFA suspensions were tainty was registered for CFA1, CFA2, or CFA3. CFA4 still
prepared as for the LACIS measurements (see Sect. 2.2.2) contains a relevant amount of unburnt fuel (LOI = 8.1±5 %).
and then left in a desiccator (steady flow of particle-free, dry A more detailed description of the bulk chemical composi-
air) until all water was evaporated. The remaining dry pow- tion results is given in Sect. S4.
der was pressed into a sample holder. Both procedures were In addition to the ICP-SFMS and LOI measurements, wa-
applied to all four samples, resulting in eight measurements. ter activity and pH values of CFA suspensions were deter-
A Bragg–Brentano diffractometer with a Cu anode (Philips mined. The water activity of the CFA samples was ∼ 1, i.e.,
X’Pert, PANalytical, Almelo, the Netherlands) was used to no difference to pure water could be detected. The CFA2,
perform 2Theta-Omega scans from 10 to 70◦ with a step CFA3, and CFA4 suspensions were neutral to slightly alka-
size of 0.03◦ and an integration time of 20 s. Quantitative line (pH ∼ 7–8). The CFA1 suspension was strongly alkaline
phase identification was done by Rietveld refinement using (pH ∼ 11), likely due to the high CaO content and the for-
www.atmos-chem-phys.net/18/13903/2018/ Atmos. Chem. Phys., 18, 13903–13923, 201813910 S. Grawe et al.: Immersion freezing behavior and particle properties of coal fly ash
mation of portlandite (Ca(OH)2 , see R2) which dissociates CFA4. This was done for greater clarity in the case of CFA1
into Ca2+ and OH− ions. and CFA3, for which more data are available and tempera-
ture uncertainties are comparable to the values shown in the
CFA2 and CFA4 panels. Only towards the warmer end of
3 Results and discussion the examined temperature range, ns of the samples from the
USA is comparable to what we found for the German ones.
In the following, refer to Fig. 2 for comparing LACIS mea-
At −36.5 ◦ C, the lowest temperature at which both instru-
surements of individual CFA samples with measurements of
ments have been operated, ns of the samples from the USA
different substances contained in CFA. Figure 3 shows SPIN
is up to 2 orders of magnitude lower than ns of the German
results of measurements with our German CFA samples and
samples. In general, the ns spectra of the samples from the
four CFA samples from the USA (Garimella, 2016). Figure 4
USA have a much shallower slope than the German CFA ns
shows the comparison of CFA results from LACIS, LINA,
spectra. As the same type of instrument was used for both in-
and WISDOM and the intercomparison between samples.
vestigations, we conclude that differences between the Ger-
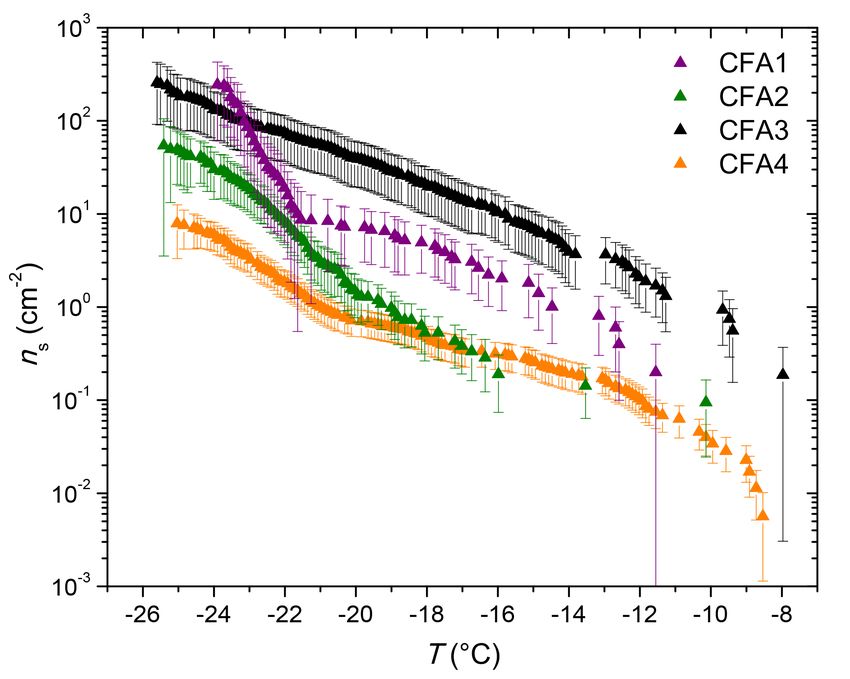
3.1 Dry particle generation man samples and the samples from the USA originate from
differences in physicochemical particle properties, and not
3.1.1 CFA from differences in methodology. Both SPIN experiments,
ours and that of Garimella (2016), have in common that no
LACIS measurements with dry-generated CFA particles are large inter-sample variability was observed. This is in con-
reported between −26 ◦ C, where the first signal above the trast to LACIS, where the class C CFA (CFA1) clearly has
limit of detection could be observed, and −37 ◦ C, where ho- the highest efficiency. SPIN results have earlier been shown
mogeneous ice nucleation starts to contribute. Data showing to differ from results obtained with instruments specially de-
measurements with dry-generated particles from CFA1 have veloped to measure immersion freezing (DeMott et al., 2015;
previously been published in Grawe et al. (2016). Compar- Burkert-Kohn et al., 2017). See Sect. 4 for details on the in-
ing the ns spectra of all four CFA samples (see full circles tercomparison between SPIN and LACIS in the framework
in Fig. 4) shows variation within a factor of 37 (difference of the present study.
between CFA2 and CFA3 at −28 ◦ C). CFA1 has the high-
est ns , followed by CFA2, CFA4, and CFA3. This order is 3.1.2 Comparison of CFA with anhydrite, quicklime,
valid throughout the whole examined temperature range, ex- and quartz
cept for T > − 29 ◦ C, where ns decreases rapidly in case of
CFA1. The curve shape for T < − 29 ◦ C with the relatively From the comparison of ns to chemical information from
shallow increase is comparable for all samples. The broad ALABAMA measurements, it was concluded that compo-
temperature range, in which the increase in ns is observed, nents containing Ca and S could contribute to the observed
hints at a variety of different types of ice nucleation active differences in immersion freezing behavior between the CFA
sites at the surface of the CFA particles. In case of uniform samples (see Fig. S4a). The occurrence of the Ca cation clus-
ice nucleation properties, a steep increase would be observed. ter series ((CaO)n , (CaO)n H, and partially Ca(CaO)n ) to-
To put the efficiency of the CFA particles into perspec- gether with the S anion cluster series (SOn , see Fig. S1)
tive, Fig. 2 includes fits to LACIS measurements with a K- could be an indication for the presence of anhydrite, as sug-
feldspar sample (76 % microcline, 24 % albite) and different gested by Gallavardin et al. (2008). Therefore, anhydrite and
kinds of mineral dust that featured a similar immersion freez- also quicklime were chosen as test substances for additional
ing behavior after coating with sulfuric acid (clay mineral LACIS measurements. To our knowledge, these are the first
baseline) by Augustin-Bauditz et al. (2014). Dry-generated immersion freezing measurements using dry-generated an-
CFA particles are not as efficient as the K-feldspar sample, hydrite and quicklime particles. Both substances are known
which is also the most efficient mineral dust sample investi- to occur in CFA and are enriched in submicron CFA parti-
gated with LACIS so far, but CFA1 is only 1 order of mag- cles (Enders, 1996; Querol et al., 1996). Anhydrite is of spe-
nitude below. All of our dry-generated CFA samples are at cial interest because Havlíček et al. (1993) found that water-
least 1 order of magnitude above the clay mineral baseline for soluble material on the CFA particle surface is mainly anhy-
T < − 29 ◦ C. In conclusion, the dry-generated CFA particles drite and suggested that it is responsible for initiating hetero-
are comparable to mineral dust in their immersion freezing geneous freezing on the particles.
behavior. Both anhydrite and quicklime are efficient INPs in the im-
Figure 3 shows a comparison of SPIN measurements with mersion mode when being dry generated (see Fig. 2). Note
300 nm CFA particles between this study and Garimella that multiple charge correction was not possible for LACIS
(2016), who performed immersion freezing measurements measurements with anhydrite and quicklime (in contrast to
with four CFA samples from the USA, two class C and two CFA). The correction would shift the ns spectra of anhydrite
class F samples. Note that horizontal error bars indicating and quicklime towards lower ns values but the slope would
the temperature uncertainty are only included for CFA2 and stay the same. Generally, multiple charge correction lowers
Atmos. Chem. Phys., 18, 13903–13923, 2018 www.atmos-chem-phys.net/18/13903/2018/S. Grawe et al.: Immersion freezing behavior and particle properties of coal fly ash 13911
Similarly shown in all panels:
4
Anhydrite Quartz
Lime Clay mineral baseline
Figure 2. ns from LACIS measurements with dry-generated CFA particles. Measurements with dry-generated anhydrite and quicklime are
included for comparison in all panels but are (in contrast to CFA) not corrected with respect to multiple charges. Measurements with quartz
shown in all panels are taken from Atkinson et al. (2013). Fit lines to LACIS measurements with a K-feldspar sample and different kinds of
mineral dust coated with sulfuric acid (clay mineral baseline) are taken from Augustin-Bauditz et al. (2014).
ns values for the dry-generated CFA particles by less than CFA results to cold-stage measurements of quartz by Atkin-
a factor of 3.5 and we expect that it would be comparable son et al. (2013) here because this dataset spans the relevant
for the anhydrite and quicklime particles. Anhydrite is more temperature range and because there is a lack of immersion
efficient than quicklime at T = −35 ◦ C (a factor of 2) and freezing results of dry-generated quartz in the literature. The
less efficient at T = −30 ◦ C (a factor of 5), i.e., there is a ns spectrum of CFA3, which contains the highest concentra-
slightly steeper slope of the anhydrite ns spectrum. The shape tion of Si (presumably quartz) in 300 nm particles is higher
and magnitude of the anhydrite ns spectrum are comparable by a factor of 2 to 10 compared to the quartz ns spectrum.
within measurement uncertainty to what was found for CFA2 This indicates that quartz might contribute to some of the ob-
and CFA4. CFA3, which contains the lowest concentration of served immersion freezing behavior, especially in the case
Ca and S, and presumably the lowest concentration of anhy- of CFA3, but it is not the most active component in CFA1,
drite in 300 nm particles, is less efficient than pure anhydrite. CFA2, and CFA4; ALABAMA results showing that 300 nm
CFA1 is more efficient than pure anhydrite, indicating that particles in CFA1 contain the lowest concentration of Si com-
other compounds might influence the immersion freezing ef- pounds, followed by CFA2 and CFA4, support this hypothe-
ficiency of this sample. A possible component contributing to sis (see Fig. S4b).
ns of CFA1 might be Pb, which occurs in 20 % of 300 nm par- The hypothesis that the amorphous material in CFA has a
ticles from CFA1 (in ≤10 % of particles from CFA2, CFA3, promoting effect on its immersion freezing efficiency (Umo
and CFA4, see Fig. S2) and has been discussed previously et al., 2015) cannot be confirmed for our samples. XRD in-
as a potential INP, or as amplifying the ice nucleation effi- vestigations show that CFA3, which was the least efficient of
ciency of other compounds (Cziczo et al., 2009; Kamphus the four dry-dispersed samples, contains the highest amor-
et al., 2010). phous fraction.
Quartz – which is the main crystalline phase of all our CFA
samples according to XRD measurements and likely also oc-
curs in 300 nm CFA particles (Si was identified by both AL-
ABAMA and ESEM/EDX) – is at least 1 order of magnitude
less efficient than CFA1, CFA2, and CFA4. We compared the
www.atmos-chem-phys.net/18/13903/2018/ Atmos. Chem. Phys., 18, 13903–13923, 201813912 S. Grawe et al.: Immersion freezing behavior and particle properties of coal fly ash
(see Fig. B1), i.e., close to the limit of detection. As a result,
the error in fice and ns is larger than for the dry-generated
particles at the same temperature.
Note that data for wet-generated CFA1 particles differ
from those published in Grawe et al. (2016), which needed
ns
to be corrected due to the identification of a sample-specific
ns
artifact (see Appendix B). ESEM images from both Grawe
et al. (2016) and the present study show two different parti-
cle types sampled after wet particle generation and size se-
lection of CFA1, i.e., spheroidal particles and needle-shaped
particles (see Figs. S5 and S6).
ns
The occurrence of needle-shaped particles suggests that
ns
compounds are dissolved from the particles in suspension.
During LACIS measurements, purely water-soluble parti-
cles, i.e., particles which do not contain water-insoluble ma-
This study: Garimella (2016):
terial, would activate to droplets that then would only freeze
CFA1 dry CFA2 dry CFA dry
homogeneously, causing an underestimation of fice . To make
CFA3 dry CFA4 dry Fit curve: ns = 310451 exp(-0.101T)
sure that no purely water-soluble particles with a size of
300 nm were produced when spraying the suspensions, size
Figure 3. ns from SPIN measurements with dry-generated 300 nm distributions of particles from all CFA suspensions were
CFA particles. Horizontal error bars are omitted in the CFA1 and
measured before LACIS experiments took place. From the
CFA3 panels for greater clarity but are comparable to the values
shown in the CFA2 and CFA4 panels. Measurements with CFA
size distribution measurements (see Sect. S5), we conclude
samples from the USA (Garimella, 2016) are included for compar- that a negligibly small number of purely water-soluble parti-
ison. cles with a size of 300 nm was produced from CFA2, CFA3,
and CFA4, i.e., the decrease we observe in the transition from
dry to wet particle generation is not caused by a measurement
3.2 Suspension methods artifact. The evaluation of the CFA1 size distribution is not
unambiguous because of the superimposition of size distri-
3.2.1 CFA butions of spheroidal and needle-shaped particles.
A decrease in immersion freezing efficiency from dry to
Figure 4 summarizes ns derived from LACIS measurements wet particle generation was already reported for CFA and
with dry- and wet-generated CFA particles (full and open cir- coal bottom ash in Grawe et al. (2016). A possible expla-
cles), ns from WISDOM measurements with the fine CFA nation for the observed discrepancy was presented follow-
fraction (squares), and ns from LINA measurements with ing previous investigations of Hiranuma et al. (2015), who
the bulk CFA (triangles). Firstly, LACIS results will be de- conducted immersion freezing measurements with both dry-
scribed and then compared to those of the other two instru- dispersed mineral dust and mineral dust suspensions. There
ments. Secondly, we will compare these to measurements it was hypothesized that the increased time that the particles
with the hydration products of anhydrite and quicklime by spend in contact with water leads to a change in chemical par-
Zolles et al. (2015), and finally to measurements with a CFA ticle properties. For our previous study (Grawe et al., 2016),
sample of different origin by Umo et al. (2015). A compari- it was not possible to identify relevant processes because in-
son to measurements by Havlíček et al. (1993) is unfeasible formation on the chemical composition of 300 nm particles
because no specific surface area values of the samples are was missing. In the framework of the present study, differ-
given in this publication. ences in chemical composition of dry- and wet-generated
CFA particles were identified (see Sects. 2.4 and S1), and
LACIS will be discussed in relation with the immersion freezing re-
sults in Sect. 3.2.2.
When comparing ns from LACIS measurements with dry-
generated particles (full circles in Fig. 4) to measurements Comparison of LACIS, LINA, and WISDOM results
with wet-generated particles (open circles), a significant de-
crease can be seen. The ns values at −35 ◦ C were lowered by LINA measurements (triangles in Fig. 4) were performed
between 1 (CFA3) and 4 (CFA2) orders of magnitude. The between 0 and −26 ◦ C. In the temperature range from −8
ns values of wet-generated particles vary by up to 2 orders to −23 ◦ C, CFA3 has the highest, and CFA4 the lowest ns
of magnitude between the four CFA samples. This can pos- values of all samples, with those being 2 orders of magni-
sibly be attributed to low values of fice that are only slightly tude apart. According to LOI measurements (see Sect. S4),
above values usually measured for homogeneous nucleation CFA4 contains the highest amount of unburnt fuel, which is
Atmos. Chem. Phys., 18, 13903–13923, 2018 www.atmos-chem-phys.net/18/13903/2018/S. Grawe et al.: Immersion freezing behavior and particle properties of coal fly ash 13913
Quartz
Gypsum
Calcite
Quartz
Figure 4. ns from LACIS measurements with dry- and wet-generated 300 nm particles. ns from WISDOM measurements with the fine CFA
fraction and ns from LINA measurements with bulk material are included for comparison. Measurements with gypsum, calcite, and quartz
are taken from Zolles et al. (2015) and Atkinson et al. (2013), measurements with a CFA sample of different origin from Umo et al. (2015).
presumably made up of carbonaceous particles. The low im- Good agreement can be observed for WISDOM and
mersion freezing efficiency of CFA4 in the investigated tem- LACIS at T ≈ −35 ◦ C with CFA1. At this temperature, the
perature range could hence be related to the occurrence of contribution of homogeneous nucleation is still minor in
carbonaceous particles, which have previously been found WISDOM measurements and hence we conclude that the
to be inefficient at nucleating ice in the immersion mode major contribution to the observed freezing behavior is due
(e.g., Chen et al., 2018). CFA1 shows a steep increase in to immersion freezing triggered by CFA particles. The good
ns between −21 and −24 ◦ C, below which all droplets were agreement between WISDOM and LACIS firstly implies that
frozen. In contrast, the last droplets of CFA2, CFA3, and there is no pronounced effect of size-dependent composition
CFA4 suspensions froze below −25 ◦ C. Note that coagula- on the immersion freezing behavior of CFA1. This finding
tion of particles in the suspensions, which was observed to could be specific to CFA1, as it is in contrast to Garimella
some extent for CFA suspensions with higher concentrations (2016), who found that ns increases with decreasing parti-
(see Fig. S13), might have a reducing effect on the surface cle size. Secondly, the successful instrument intercompari-
area available for ice nucleation in the cold-stage measure- son indicates that drying of the CFA1 suspension droplets
ments (Emersic et al., 2015). after atomization (which does not take place in WISDOM
WISDOM measurements (squares in Fig. 4) were per- experiments) does not have a strong effect on the immersion
formed as an attempt to close the temperature gap be- freezing efficiency of the CFA1 particles.
tween LACIS measurements with wet-generated particles
(T ≤ −35 ◦ C) and LINA measurements (T ≥ −26 ◦ C). This Comparison to Umo et al. (2015)
could not be realized for two reasons. Firstly, WISDOM
measurements with suspensions of 0.1 g CFA in 100 mL dis-
Cold-stage measurements with a CFA sample of different
tilled water were only possible with CFA1, because the other
origin by Umo et al. (2015, see Fig. 4) yielded results that
samples showed no immersion freezing activity. Increasing
differ substantially from what we measured in the frame-
the concentration to a level, for which signals above the ho-
work of the present study. The efficiency of the sample
mogeneous freezing limit could be expected, led to strong
investigated by Umo et al. (2015) increases strongly for
settling of particles in the CFA2, CFA3, and CFA4 suspen-
−20 ◦ C < T < −15 ◦ C and levels off from T < − 25 ◦ C. This
sions. Secondly, freezing was only observed for T ≤ −29 ◦ C
is in contrast to the gradual increase over a broad temper-
for CFA1, i.e., there is no temperature overlap between LINA
ature range that we observed for our samples. Our suspen-
and WISDOM. However, extrapolation suggests that both in-
sions were prepared in the same way as described by Umo
struments could yield similar results.
et al. (2015), and LINA and the microliter Nucleation by Im-
mersed Particles Instrument (µL-NIPI; Whale et al., 2015)
www.atmos-chem-phys.net/18/13903/2018/ Atmos. Chem. Phys., 18, 13903–13923, 201813914 S. Grawe et al.: Immersion freezing behavior and particle properties of coal fly ash
used by Umo et al. (2015) have successfully been intercom- The formation of calcite occurs via the hydration of quick-
pared with a different ash sample (not shown). Therefore, we lime to portlandite (Ca(OH)2 ) which is then carbonated (see
infer that the CFA samples are really different in their im- R2 and R3). It is possible that this process causes the pre-
mersion freezing behavior and we do not observe artifacts re- cipitation of needle-shaped particles in suspension, but only
lated to methodology. The comparison to Umo et al. (2015), if the quicklime content is sufficiently high (as for CFA1).
and the results by Garimella (2016) shown in Figs. 3 and 4, It cannot be ruled out that calcite is also formed in the
suggest that CFA samples from different geographical origin other CFA suspensions; however, in contrast to CFA1, cal-
show a highly variable immersion freezing behavior. cite could not be clearly identified in the other samples by
XRD.
3.2.2 Comparison of CFA with gypsum and calcite Possibly, both above-described mechanisms, and poten-
tially even more hydration reactions, cause the observed de-
A comparison of ALABAMA measurements of dry- and crease in immersion freezing efficiency in the transition from
wet-generated CFA particles hints at hydration of several dry to wet particle generation. Additional LACIS measure-
oxides (see Fig. S3). It is difficult to say which hydration ments with different sample treatments were performed to
reactions in the complex mixture cause the decrease in im- verify this hypothesis (see Sect. 3.3).
mersion freezing behavior in measurements with the suspen-
sion methods. However, for bulk CFA1 there is clear evi- 3.2.3 Comparison of CFA with quartz
dence from XRD measurements that anhydrite and quick-
lime, which were already identified as species potentially in- In addition to quartz measurements by Atkinson et al. (2013),
fluencing immersion freezing of the dry-generated particles, we now include quartz measurements by Zolles et al. (2015)
are hydrated in suspension, resulting in the formation of gyp- in our discussion because they cover T > − 28 ◦ C, which is
sum and calcite (see Fig. S7). In the following, we compare the more relevant temperature range for our cold-stage mea-
immersion freezing results of CFA suspension particles to surements with CFA. We compare these to the most efficient
measurements presented in Zolles et al. (2015) of gypsum of the quartz samples investigated by Zolles et al. (2015).
and calcite (see Fig. 4). The ns spectra of the quartz samples used by Zolles et al.
Both hydration products, i.e., gypsum and calcite, are (2015) and Atkinson et al. (2013) agree in the narrow tem-
lower in their immersion freezing efficiency by 3 orders of perature overlap (−26 ◦ C < T < − 28 ◦ C). It is obvious that
magnitude compared to anhydrite and quicklime, i.e., as for quartz is significantly more efficient in the immersion mode
CFA there is a significant decrease in efficiency of the hy- than suspended particles of CFA1, CFA2, and CFA4, with
dration products compared to their anhydrous precursors. ns being at least 1 order of magnitude higher over the com-
In general, gypsum and calcite are similar in their immer- plete investigated temperature range. The deviation is small-
sion freezing efficiency. LACIS measurements with wet- est for CFA3 which contains the highest concentration of Si
generated CFA and WISDOM measurements agree with the species (quartz) and lowest concentration of Ca and S species
gypsum and calcite results within 1 order of magnitude. The in 300 nm particles. For this sample, we assume the small-
only exception to this is CFA3 which will be discussed below est effect of the hydration reactions and a larger influence of
in relation to quartz. quartz on the immersion freezing behavior compared to the
The hydration of anhydrite inevitably takes place once other samples. The fact that the other samples also contain
CFA comes into contact with water, because anhydrite is significant amounts of quartz – both in 300 nm particles and
present at the particle surface (Enders, 1996). Sievert et al. in bulk, and, nevertheless, feature a much lower efficiency
(2005) described the hydration of pure anhydrite particles – supports the hypothesis of the particles being covered by
in the following way. Firstly, anhydrite is dissolved from a layer which suppresses the ice nucleation efficiency of the
the particles and Ca2+ and SO2− 4 ions are hydrated in the quartz. In the case of the dry particle generation method, the
solution. The hydrated ions are then adsorbed to the sur- layer is more efficient at initiating immersion freezing than
face of the anhydrite particles due to electrostatic attraction. quartz. In the case of the suspension methods, the layer is
From this point on, further dissolution and interaction of less efficient than quartz, with this change brought on by the
water molecules with the anhydrite surface is reduced be- above-described hydration reactions.
cause of the adsorbed layer of hydrated ions. Secondly, as the
thickness of the adsorbed layer increases, cracks are formed 3.3 Effect of sample treatment on the immersion
through which water molecules migrate to the anhydrite sur- freezing efficiency of CFA
face. Only then, nuclei of gypsum are formed and crystalliza-
tion takes place. The first process (formation of the adsorbed Additional LACIS measurements with differently treated
layer of hydrated ions) is thought to happen rather quickly; CFA and anhydrite samples, as well as pure gypsum, were
the second process (formation of gypsum) can take several performed in order to test the hypothesis that the hydra-
hours up to days. See Sects. 3.3 and 4 for details on the du- tion of anhydrite leads to a decrease in immersion freez-
ration of hydration. ing efficiency in suspension (see Fig. 5). All measurements
Atmos. Chem. Phys., 18, 13903–13923, 2018 www.atmos-chem-phys.net/18/13903/2018/You can also read