Pluto's Haze as a Surface Material - Lowell Observatory
←
→
Page content transcription
If your browser does not render page correctly, please read the page content below
Pluto’s Haze as a Surface Material
W.M. Grundy1, T. Bertrand2, R.P. Binzel3, M.W. Buie4, B.J. Buratti5, A.F. Cheng6, J.C. Cook7,
D.P. Cruikshank2, S.L. Devins5, C.M. Dalle Ore2,8, A.M. Earle3, K. Ennico2, F. Forget9, P. Gao10,
G.R. Gladstone11, C.J.A. Howett4, D.E. Jennings12, J.A. Kammer11, T.R. Lauer13, I.R. Linscott14,
C.M. Lisse6, A.W. Lunsford12, W.B. McKinnon15, C.B. Olkin4, A.H. Parker4, S. Protopapa4, E.
Quirico17, D.C. Reuter12, B. Schmitt16, K.N. Singer4, J.A. Spencer4, S.A. Stern4, D.F. Strobel17,
M.E. Summers18, H.A. Weaver6, G.E. Weigle II11, M.L. Wong10, E.F. Young4, L.A. Young4, and X.
Zhang19

1.    Lowell Observatory, Flagstaff AZ
2.    NASA Ames Research Center, Moffett Field CA
3.    Massachusetts Institute of Technology, Cambridge MA
4.    Southwest Research Institute, Boulder CO
5.    NASA Jet Propulsion Laboratory, La Cañada Flintridge CA
6.    Johns Hopkins University Applied Physics Laboratory, Laurel MD
7.    Pinhead Institute, Telluride CO
8.    SETI Institute, Mountain View CA
9.    Laboratoire de Météorologie Dynamique (CNRS/UPMC), Paris France
10.   California Institute of Technology, Pasadena CA
11.   Southwest Research Institute, San Antonio TX
12.   NASA Goddard Space Flight Center, Greenbelt MD
13.   National Optical Astronomy Observatory, Tucson AZ
14.   Stanford University, Stanford CA
15.   Washington University of St. Louis, St. Louis MO
16.   Université Grenoble Alpes, CNRS, IPAG, Grenoble France
17.   Johns Hopkins University, Baltimore MD
18.   George Mason University, Fairfax VA
19.   University of California, Santa Cruz CA

                                       In press in Icarus

Keywords: Pluto; Pluto, surface; Pluto, atmosphere; Geological processes; Ices; Photochemistry

                                               1
Abstract
     Pluto’s atmospheric haze settles out rapidly compared with geological timescales. It needs
to be accounted for as a surface material, distinct from Pluto’s icy bedrock and from the volatile
ices that migrate via sublimation and condensation on seasonal timescales. This paper explores
how a steady supply of atmospheric haze might affect three distinct provinces on Pluto. We pose
the question of why they each look so different from one another if the same haze material is
settling out onto all of them. Cthulhu is a more ancient region with comparatively little present-
day geological activity, where the haze appears to simply accumulate over time. Sputnik Planitia
is a very active region where glacial convection, as well as sublimation and condensation rapidly
refresh the surface, hiding recently deposited haze from view. Lowell Regio is a region of
intermediate age featuring very distinct coloration from the rest of Pluto. Using a simple model
haze particle as a colorant, we are not able to match the colors in both Lowell Regio and
Cthulhu. To account for their distinct colors, we propose that after arrival at Pluto’s surface, haze
particles may be less inert than might be supposed from the low surface temperatures. They
must either interact with local materials and environments to produce distinct products in
different regions, or else the supply of haze must be non-uniform in time and/or location, such
that different products are delivered to different places.

1. Introduction
     The discovery of extensive haze in Pluto’s atmosphere was one of numerous striking
findings from NASA’s New Horizons Pluto encounter (Stern et al. 2015). The ultraviolet solar
occultation data showed haze at altitudes up to at least 350 km above Pluto’s surface (L.A.
Young et al. 2018) and it can be seen in high phase visible wavelength images up to well over
200 km altitude (Gladstone et al. 2016; Cheng et al. 2017). The images reveal it to be divided
into as many as 20 distinct layers, possibly due to the influence of orographic gravity waves.
The haze is thought to have a relatively short residence time in Pluto’s thin atmosphere before it
settles to the surface, where it can be expected to accumulate. This paper explores the potential
influence of haze particles on three very distinct terrain types on Pluto’s encounter hemisphere,
where the highest spatial resolution images and compositional maps were obtained (see Fig. 1).
Cthulhu1 is the largest of a group of dark, red patches that form a discontinuous belt along Pluto’s
equator. Portions of Cthulhu are heavily cratered and ancient, and it is mostly free of the
seasonally mobile volatile ices that cover most of Pluto’s surface. It thus offers a view of a thick,
long-term accumulation of haze particles. In contrast, Sputnik Planitia is a smooth, bright, low-
lying plain where convective overturn of volatile ice along with diurnal and seasonal cycles of
sublimation and condensation refresh the surface on geologically short timescales. Lowell Regio
is Pluto’s northern polar region, where thick deposits rich in methane ice (Grundy et al. 2016a;

1   Names of Pluto system regions and features mentioned in this paper include a mix of official and informal
    names.

                                                        2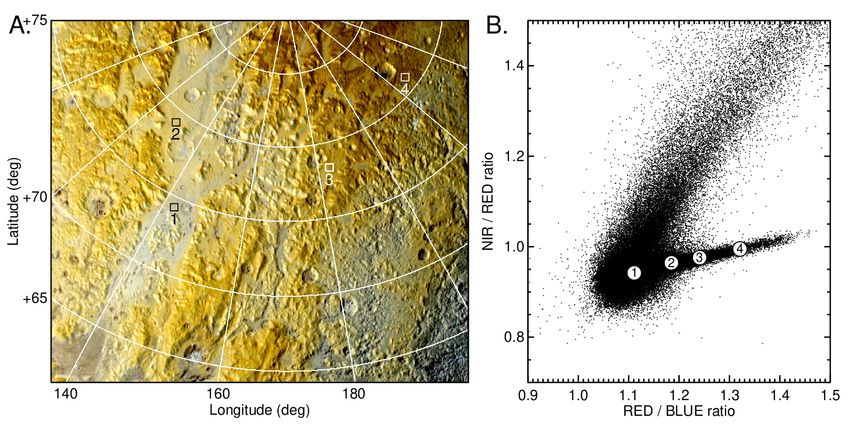
Howard et al. 2017) appear to have accumulated over intermediate timescales, possibly
associated with Pluto’s three million year Milankovitch-like seasonal cycles (Dobrovolskis et al.
1997; Earle & Binzel 2015; Hamilton et al. 2016; Earle et al. 2017; Stern et al. 2017).

                                                     Fig. 1: The MVIC P_COLOR_2 Pluto
                                                     observation with BLUE, RED, and NIR filter
                                                     images displayed in blue, green, and red color
                                                     channels, respectively (in color in the on-line
                                                     version only). This “enhanced color”
                                                     mapping of filters to display colors is used
                                                     throughout the paper. The three main regions
                                                     discussed in the text are indicated.

2. Haze Production and Composition
     Pluto’s haze originates in photolysis and radiolysis of gases in the upper atmosphere: chiefly
CH4, N2, and CO. N2 is the dominant atmospheric species near the surface, but CH4 becomes
increasingly abundant with altitude, matching the abundance of N2 at an altitude of ~1400 km
(Gladstone et al. 2016; L.A. Young et al. 2018). Methane is the primary chemical feedstock for
haze production and is also the dominant molecular species escaping to space. Various energetic
radiation sources produce radicals and ions from Pluto’s atmospheric molecules, leading to
creation of new compounds and eventually haze particles.
     Solar ultraviolet light drives photochemistry, with Ly α photons (1216 Å, 10.2 eV) being an
especially important source. The solar Ly α flux at Pluto’s 39.5 AU mean heliocentric distance is
~3 × 10¹² photons m−2 s−1 (Gladstone et al. 2015). Ly α photons readily break C-H bonds in
methane through various pathways (to CH3(X) + H, 5.7 eV; to CH2(a) + H2, 5.2 eV; and to
CH(X) + H2 + H, 1.14 eV) and are thus strongly absorbed by CH4 in Pluto’s upper atmosphere.
In addition to direct solar illumination of Pluto’s day side, Ly α photons are resonantly scattered
by neutral H in the interplanetary medium, leading to diffuse irradiation of Pluto’s night side by
scattered Ly α comparable to the flux received on the day side (Gladstone et al. 2016; L.A.
Young et al. 2018). Over Myr and longer timescales this resonantly scattered flux can be
expected to vary as the Sun passes through different galactic environments. Ly α photons are not
able to photodissociate the strong triple bonds N≡N in N2 or C≡O in CO (9.8 and 11.1 eV,

                                                 3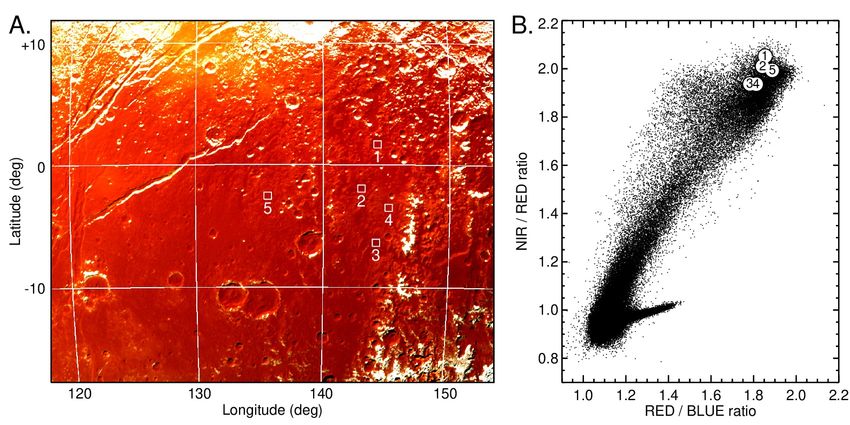
respectively). In the case of N2, this is because there are no dipole-allowed transitions to
repulsive states below the ionization threshold (15.6 eV). But shorter wavelength UV photons
can break up N2 through ionization and subsequent ion-molecule reactions, although their fluxes
are lower. Higher energy x-ray photons (wavelengths < 1 nm) are scarcer still (Lisse et al. 2017),
and highly variable with solar activity. They are more penetrating, and so contribute relatively
little to atmospheric chemistry except near the surface, with the higher energy x-rays (< 0.1 nm)
affecting Pluto’s surface.
     Another contributor to atmospheric chemistry is the plasma of protons and electrons
streaming radially away from the Sun. Typical solar wind energies are in the keV range, though
the distribution also includes higher energy particles (e.g., Cooper et al. 2003; Mewaldt et al.
2007). At Pluto’s heliocentric distance during the 2015 New Horizons encounter, the flux of
solar wind particles was highly time-variable, on the order of 109 to 1010 particles m−2 s−1
(Bagenal et al. 2016). Details of the plasma interaction with Pluto’s atmosphere are uncertain,
and much of it is diverted around Pluto due to the existence of a highly-conducting day-side
ionosphere (Cravens & Strobel 2015), but it could be an important additional driver of radiolytic
chemistry, with each keV particle delivering ~100 × the energy of a Ly α photon.
     Cosmic rays provide yet another source of energetic particles, impinging on Pluto’s
atmosphere isotropically, with energies in the MeV through GeV range being especially
important (e.g., Padovani et al. 2009). When one of these highly energetic particles collides with
a molecule in the atmosphere (or on the surface, since the atmosphere is not thick enough to stop
the more energetic particles) it triggers a cascade of lower energy secondary and tertiary particles
that penetrate further, creating a substantial swath of damage: broken chemical bonds and excited
radicals and ions that react to create new chemical species. At lower energies, this cascade is
dominated by the component nuclei and electrons of the target atoms (elastic collisions), while at
higher energies, atomic nuclei themselves can be disrupted, producing a shower of more exotic
particles (inelastic collisions) (e.g., Johnson 1990). Estimates of cosmic ray penetration into the
heliosphere suggest that Pluto currently receives relatively low fluxes of 100 keV to 10 MeV
protons compared with objects orbiting closer to the heliopause (Cooper et al. 2003), but above
~100 MeV, the cosmic ray flux is less diminished by the heliosphere. Although cosmic ray
fluxes are relatively low, the energies delivered by individual particles can be enormous, and
over time they contribute to chemistry, too. Their fluxes also vary considerably as the Sun
moves through different galactic environments.
    Radicals, ions, and free electrons in Pluto’s upper atmosphere/ionosphere interact to build
heavier molecules, in much the same way as occurs on Titan, helped by attraction between
oppositely charged ions (Quirico et al. 2008; Vuitton et al. 2009a; Lavvas et al. 2013). Macro-
molecules as large as thousands of Da (atomic mass units), corresponding to sizes in the tens of
nanometer range, are thought to form before they coagulate and settle out (Cheng et al. 2017).

                                                 4
Following Khare et al. (1984), we use the term tholin to refer to this complex, organic,
macromolecular material.
     The greater brightness of Pluto’s haze at blue wavelengths is consistent with Rayleigh
scattering by very small particles, but the strongly forward scattering phase function implies
larger particles. These observational constraints can be reconciled if the tens of nm monomers
join up to form micron-sized aggregates (e.g., Gladstone et al. 2016; Cheng et al. 2017). Particle
settling times depend strongly on size. For the 1 µm size range favored by observations of
forward scattering, they are relatively short, in the range of Earth days to months (Cheng et al.
2017; Gao et al. 2017; Zhang et al. 2017), though it may take of order a few Earth years for them
to grow to that size before they settle out.
    At altitudes above a few hundred km, New Horizons found Pluto’s atmosphere to be ~70 K,
cooler than had been expected (e.g., Gladstone et al. 2016; Hinson et al. 2017). The dominant
cooling mechanism appears to be thermal infrared radiation from the haze particles themselves
(Zhang et al. 2017). Below about 700 km altitude, frequent collisions with gas molecules keep
haze particles thermally coupled to the atmosphere.
     Additional cooling comes from emission from gaseous hydrogen cyanide (HCN), acetylene
(C2H2), water (H2O), and possibly other species (Gladstone et al. 2016; Strobel and Zhu 2017).
Although these are not thermodynamically stable as gases at such low temperatures, they could
be resupplied through photochemistry and/or meteoritic infall. They go on to react with other
species or stick to the growing haze particles
through condensation or more likely adsorption Table 1
(e.g., Gao et al. 2017; Luspay-Kuti et al. 2017;                                   Production
                                                   Species name and formula
Strobel and Zhu 2017). The details are highly                                     (g cm−2 Gyr−1)
uncertain as to how these molecules are            Acetylene           C2H2            179
incorporated into the haze particles and whether
                                                   Ethylene            C2H4             95
they retain their identities as distinct molecules
                                                   Ethane              C2H6             62
or are chemically bonded into the macro-
molecular tholin. From photochemical models, Propyne                   CH3C2H           48
Wong et al. (2017) estimated the present-day       Hydrogen cyanide HCN                 35
production of species contributing to the growth Benzene            C6H6             34
of the haze particles, finding them to be        Diacetylene        C4H2             26
dominated by C2 hydrocarbons acetylene
                                                 Propene            C3H6              8
(C2H2), ethylene (C2H4), and ethane (C2H6),
                                                 Methyl-
along with a variety of other hydrocarbons and                      CH3C3N            6
                                                 cyanoacetylene
nitriles (see Table 1). Since the Wong et al.
                                                 Cyanoacetylene HC3N                  4
model neglected ionospheric chemistry, these
                                                 Table adapted from Wong et al. (2017).
production rates may be underestimates.

                                                5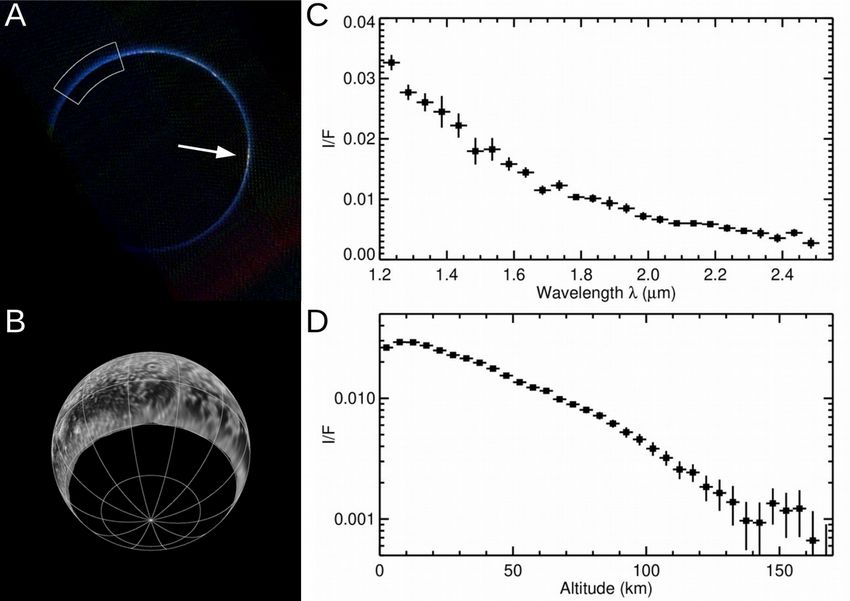
Lower down, the atmospheric temperature reaches a maximum of ~110 K around 30 km
altitude (Hinson et al. 2017). Some evolution as haze particles settle through this warm zone
seems inevitable. The temperature is high enough to cause sublimation of more volatile
hydrocarbons and nitriles that condensed onto the haze particles higher up in the atmosphere, but
only if they condensed rather than being more strongly adsorbed or even chemically bonded into
the macromolecular tholin (e.g., Luspay-Kuti et al. 2017). Sublimation loss would shrink the
haze particles and slow their settling, as well as modifying their compositions by distilling off the
more volatile constituents. 110 K also exceeds the zero pressure melting points of some of the
constituent hydrocarbon species, specifically C2H4 (104 K), C2H6 (90 K), and C3H6 (88 K).
Unmelted species may partly dissolve into those that do melt, and melting point depression can
be expected in such mixtures (for instance, the CH4-C2H6 eutectic melting point is 18 K below
the melting points of the pure species; Hanley et al. (2017)). Partial melting could allow
particles to evolve from fractal aggregate shapes into more compacted spherical forms, due to
surface tension, with implications for their scattering properties and settling rates. Warmed haze
particles might also be more sticky and could coalesce into even larger aggregates if they contact
one another.
     In the last few km above the planet’s surface, the atmospheric temperature declines quickly
toward ~40 K, approaching vapor pressure equilibrium with N2 ice on the surface. Haze
particles descending through this much colder near-surface region will refreeze any partial
melting and return to accreting gaseous hydrocarbon and nitrile molecules, growing larger again,
and falling out even more quickly. Cheng et al. (2017) report altitude-dependent photometric
properties for the haze in the lower atmosphere that are likely related to the abruptly changing
thermal environment the settling haze particles experience on their descent through the last few
tens of km above the surface.
    Summing up the present-day production rates in Table 1, we obtain ~500 g cm−2 Gyr−1, all of
which is presumed to accumulate on Pluto’s surface. Those numbers were for production rates
during the 2015 encounter, when Pluto was 32.9 AU from the Sun. Production should scale with
the UV flux, which falls off approximately as the square of distance from the Sun, so a seasonal
average of ~350 g cm−2 Gyr−1 can be obtained by scaling by the square of the encounter distance
divided by the square of Pluto’s mean distance from the sun of 39.5 AU. Assuming an average
density of 1 g cm−3 and neglecting porosity, this material would coat the surface to a thickness of
3.5 m in 1 Gyr, or about 14 m over the age of the solar system. A one-micron thick monolayer of
haze particles would take about 3 Earth centuries to accumulate, roughly a Pluto year.
     It is unclear how time-variable the haze production would have been over Pluto’s history.
The UV flux at Pluto varies from perihelion to aphelion and with the solar cycle, and the
geometric cross section and CH4 content of Pluto’s atmosphere likely also varies seasonally. So
this estimate of ~14 m of haze produced over the age of the solar system must be regarded as
highly uncertain. This tally also omits the macromolecular tholin component of the haze

                                                 6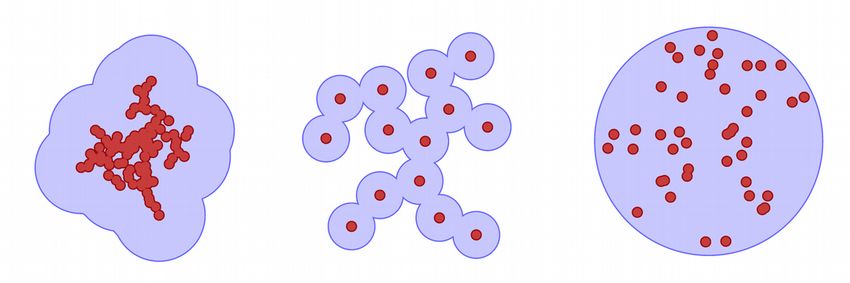
particles, unless all of the light hydrocarbons and nitriles are consumed in production of tholin.
It is unknown what fraction of Pluto’s haze particles would be composed of tholin. In Titan
haze, Lavvas et al. (2013) estimate it to be 7 to 10%. Critical to formation of tholin in haze is the
presence of CH4 at altitudes where ion chemistry occurs, ensuring the formation of the nitriles
and negative nitrile ions that are precursors to tholin formation. This condition holds in Pluto’s
current upper atmosphere, unlike in Triton’s (Strobel & Zhu 2017), but Pluto’s atmosphere might
not always be suitable for tholin production.
    Small amounts of additional material arrive at Pluto’s surface in the form of dust particles
from the Kuiper Belt (Poppe 2015), and ejecta debris from the small satellites (Porter & Grundy
2015). The composition of this material is probably dominated by H2O ice, though some
carbonaceous and silicate material is likely also present. These sources are estimated to
contribute of order 5 mm and 10 mm of dust over the age of the solar system, for Kuiper belt and
small satellite sources, respectively (Poppe 2015; Porter & Grundy 2015). These quantities are
very small compared with a ~14 m accumulation of haze particles, but they could still be
important contributors to haze production as sources of oxygen and in providing potential
nucleation sites in the upper atmosphere.

3. Model Haze Particle
     To simulate potential effects of haze particles on the observable characteristics of Pluto’s
various surface regions using multiple-scattering radiative transfer models, we would need to
know the wavelength-dependent single scattering albedo w and single scattering phase function
P(g) of the haze particles, which in turn depend on their size, composition, shape, and internal
configuration. Considering the numerous uncertainties associated with their formation,
composition, and subsequent modification on descent through Pluto’s atmosphere, no definitive
model is possible. But a crude model haze particle can be constructed for use in radiative
transfer models by considering that we expect the ingredients to include some amount of
macromolecular tholin as well as some lighter hydrocarbons and nitriles, and that we expect
these ingredients to be mixed on spatial scales in the nanometer to micrometer size range. At
visible wavelengths, light hydrocarbon and nitrile ices are generally transparent and colorless,
while unsaturated linkages in tholins absorb strongly at blue wavelengths (e.g., Rao et al. 1975;
Imanaka et al. 2004; Quirico et al. 2008). The tholin component should thus dominate visible
wavelength spectral behavior. We can treat the haze particles as being effectively a combination
of just 2 ingredients: a pigment plus a transparent matrix. Fig. 2 illustrates some potential
configurations. For materials mixed at spatial scales below the wavelength of light, effective
optical constants of the aggregate mixture can be approximated using effective medium theory
(e.g., Garnett 1904). For the transparent ice, we assume n = 1.4 and k = 0 for the real and
imaginary parts of its refractive index, respectively, over the visible to near-infrared wavelengths
observed by New Horizons. For the tholin, plausible candidates would be the Titan analog tholin

                                                 7
optical constants measured by
several groups (e.g., Khare et al.
1984; Ramirez et al. 2002;
Imanaka et al. 2004; Vuitton et al.
2009; Sciamma-O’Brien et al.
2012). These materials are
laboratory analogs for macro- Fig. 2: Cartoon showing potential haze particle internal
molecular material produced in configurations with 10 nm tholin monomers (small dots)
Titan’s upper atmosphere under surrounded by transparent hydrocarbon ice. From left to
right: aggregates of tholin form first and then accrete ice;
conditions similar to those in
tholin monomers accrete ice first and then coalesce into
Pluto’s upper atmosphere (e.g., aggregates; partial melting enables aggregates to reform
Cheng et al. 2017). The mixing into less irregular shapes.
ratio of tholin to ices in Pluto’s
haze particles is unknown and thus is left as a free parameter in our model haze particle.
4. Data
This paper focuses on Pluto’s encounter hemisphere, where relatively high spatial resolution
data sets were obtained during the last few hours prior to New Horizons’ closest approach to
Pluto on 2015 July 14. We primarily consider data from the Ralph instrument, which consists of
two separate focal planes fed by a single 75 mm aperture f/8.7 telescope (Reuter et al. 2008).
Visible and near-infrared light out to 1.1 µm is reflected by a dichroic beamsplitter to the
Multispectral Visible Imaging Camera (MVIC). Longer infrared wavelengths are transmitted to
the Linear Etalon Imaging Spectral Array (LEISA).
MVIC is Ralph’s visible and near infrared imager. Its focal plane has seven CCD arrays, six
of which are 5024 × 32 pixel devices operated in Time Delay Integration (TDI) mode. In this
mode, MVIC’s field of view is swept across the scene, perpendicular to the long axis of the
CCDs, and the charges are read out at rates matched to the scan motion. The result is an image
strip 5024 pixels wide and arbitrarily long. Two of the TDI CCDs are panchromatic, covering
wavelengths from 400 to 975 nm. Four have color filters affixed to them and are operated
simultaneously as a group, enabling 4-color images to be recorded. The filter names and
wavelengths are “BLUE” 400-550 nm, “RED” 540-700 nm, “NIR” (near-infrared) 780-975 nm,
and “CH4” (methane) 860-910 nm.
The primary MVIC data set used in this paper is P_COLOR_2 (Fig. 1). This observation
was obtained 2015 July 14 at 11:10:52 UT (observation mid-time), when the spacecraft was at a
range of 34,000 km from Pluto and the mean phase angle was 39°. The image scale was 650 m
pixel−1. This dataset’s unique Mission Elapsed Time (MET) identifier is 0299178092. The four
MVIC filter images were processed separately through the standard New Horizons Science
Operations Center (SOC) pipeline for flat fielding, and then radiometrically calibrated to specific
8intensity (I/F; Chandresekhar 1960) and destriped as described by Howett et al. (2017) and Olkin
et al. (2017). MVIC’s RED, NIR, and CH4 filter images were geometrically registered to the
contemporaneous BLUE image using version 3.5.0.7383 of the Integrated Software for Images
and Spectrometers (ISIS3) package from the United States Geological Survey, and the geometry
of the BLUE image adopted for subsequent analysis. The four color CCDs are adjacent to one
another on the focal plane, so they do not view the same point on the target exactly
simultaneously. Owing to spacecraft and target
motion during the scan, each CCD sees slightly
different geometry. Neglecting those differences
introduces little error, however, since at the scan
rate of 1045 µrad s−1, all four CCDs are swept
across a point in the scene in just six seconds.
LEISA is Ralph’s infrared imaging
spectrometer. It has a 256 × 256 HgCdTe detector
array with a pair of linear variable interference
filters mounted directly onto it such that each row
of the detector is sensitive to a different
wavelength of infrared light. The primary filter
covers wavelengths from 1.25 to 2.5 µm spanning
about 200 rows of the array. The resulting spectral
resolution (λ/Δλ) is about 240. A higher spectral
resolution filter covering wavelengths from 2.1 to
2.25 µm occupies the remaining rows, but data
from that portion of the array have proved more
difficult to calibrate and were not used in this
paper. In order to build up a spectral image cube,
the detector array is swept across the target scene
while a series of frames is recorded. The frame
rate and scan rate are coordinated such that the
scene shifts by about a pixel from one frame to the
next.
For LEISA, the highest spatial resolution
Pluto observation is P_LEISA_HIRES, obtained
2015 July 14 at 10:56:19 UT, from a mean range
of 45,000 km and a mean phase angle of 33°. The
mean image scale was 2.7 km pixel−1. The
dataset’s MET unique identifier is 0299176809. Fig. 3: The P_LEISA_HIRES observation,
At the mid-time of the scan, LEISA’s 256 pixel showing the median of all LEISA
wavelengths.
9field of view covered ~690 km at the distance of Pluto, so only a strip of the encounter
hemisphere was observed, extending toward the south and east from the lit limb, over Piri
Planitia, eastern Cthulhu, and Tenzing Montes to the terminator, as illustrated in Fig. 3. The
standard SOC pipeline (e.g., Peterson et al. 2013; Howett et al. 2017; Olkin et al. 2017) provides
radiometrically calibrated data points, each with a distinct wavelength and spatial footprint.
These points can be projected onto a map using ISIS3. We projected them to the point-
perspective view from the spacecraft’s location at the mid-time of the scan, with 1 km sample
spacing at image center, and adopted the mid-scan geometry. This is a worse approximation for
LEISA than it is for MVIC since LEISA scans take much longer to complete. The
P_LEISA_HIRES scan was done a factor of ten slower, at 105 µrad s−1. The entire scan lasted
16 minutes, of which at least some portion of Pluto was within the field of view for almost 10
minutes. Latitude and longitude angles are unaffected, since ISIS3 projects each pixel to its
correct location in latitude and longitude (assuming a spherical Pluto with radius 1,188.3 km;
Nimmo et al. 2017). But incidence angles change slightly over the time of the scan due to
Pluto’s rotation. Pluto rotates through 0.39° of longitude in 10 minutes. Emission and phase
angles are even more affected, since they depend on the spacecraft’s location. Over the portion
of the scan when Pluto was being observed, the spacecraft traveled 7,900 km relative to Pluto.
During that time, the phase angle changed by 3.2°, and the sub-spacecraft point’s latitude and
longitude shifted by 2.4° and 2.0°, respectively. The effect of assuming fixed mid-scan geometry
instead of time-varying geometry over the course of the scan is to tacitly accept emission and
phase angle errors on the scale of a few degrees.
We also use data from one other LEISA scan that has not previously been published,
P_MULTI_DEP_LONG_1. This observation was done about four hours after closest approach,
looking back at the night side of Pluto at a mean phase angle of 169°. The mid-scan time was
2015 July 14 15:27:22 UT, corresponding to a 181,000 km range and an image scale of 11 km
pixel−1. The MET unique identifier is 0299193339.
5. Three Provinces
Pluto’s encounter hemisphere features a number of very distinct regions, with diverse
compositions, morphologies, and ages (see Fig. 1). We consider three of the most prominent
provinces here, exploring how each might be influenced by fallout and accumulation of haze
particles.
In all cases, we assume constant haze production at rates scaled from present-day estimates,
and that surface deposition is spatially uniform, at least when averaged over time. These
uniformitarian assumptions are likely oversimplifications, but perhaps not egregiously so. To the
extent that haze production is limited by the flux of solar Ly α, it might not vary all that much
over time. Of course, if there were past epochs when Pluto’s atmosphere collapsed, or when its
CH4 content was negligible, removing the main source of Ly α opacity and also the main
10feedstock for photochemistry, haze production could have ceased or been greatly diminished and
the energetic radiation no longer blocked by the atmosphere would act directly on Pluto’s surface
ices (e.g., Kim & Kaiser 2012; Wu et al. 2012; Materese et al. 2014). With settling rates being
slow compared with wind speeds, haze deposition should also be relatively evenly distributed,
though local factors could complicate this picture, such as the diurnal cycles of sublimation/
condensation and katabatic winds predicted by global circulation models (e.g., Bertrand & Forget
2017; Forget et al. 2017).
5.1 Cthulhu
Pluto’s equatorial latitudes feature a prominent belt of large, dark, reddish maculae (Latin
for spots or stains). The largest of these is Cthulhu, which extends more than a third of the way
around the planet, from longitude 20° E through 160° E. Cthulhu is mostly depleted in volatile
ices, apart from a few bright, possibly seasonal deposits localized on mountain peaks and crater
rims (e.g., Grundy et al. 2016a). Portions of Cthulhu are densely cratered, implying an ancient
surface (Moore et al. 2016; Robbins et al. 2017), though many areas, especially towards the core
of Cthulhu, look smooth and uniformly dark at spatial scales below a few tens of km. Towards
Cthulhu’s periphery, the ubiquetous dark material appears to become less concentrated and H2O
ice is increasingly detectable from its absorptions at 1.5 and 2 µm. The H2O ice could be Pluto’s
bedrock, revealed by the dark material becoming patchy and/or thinner toward the periphery of
Cthulhu, perhaps due to erosive action of seasonal volatile ice deposits. Or the H2O ice could be
superposed on top of the dark material, though it is not clear what mechanism would do that just
along the periphery. There is no obvious morphological or topographic contrast between
Cthulhu and adjacent terrains (Schenk et al. 2018). These aspects are suggestive of a superficial
coating of highly pigmented material in Cthulhu, rather than a distinct geological stratum being
exposed there (e.g., Sekine et al. 2017).
From the estimated haze production rates discussed earlier, ~3.5 kg settles onto each square
meter of otherwise inert surface in 1 Myr. This would produce a ~3.5 mm thick coating in 1
Myr, and over 4 Gyr, a ~14 m thick blanket of haze particles would accumulate. A variety of
processes could affect the accumulating haze particles after their arrival at the surface. In the
remainder of this section, we consider thermal processes such as sublimation and sintering,
effects of energetic radiation, and the apparent absence of craters that expose substrate material.
We also examine the photometric and spectral characteristics of Cthulhu’s surface.
Low albedo, volatile-free regions on Pluto’s equator may get relatively warm, especially if
they have low thermal inertias. An upper limit can be estimated by assuming negligible thermal
inertia such that a region is in instantaneous thermal equilibrium between insolation and
emission. When Pluto’s equinox coincides with its perihelion (as it does at present; Earle &
Binzel 2015), an equatorial region with a bolometric bond albedo of 0.1 (Buratti et al. 2017) and
emissivity assumed to be 0.9 can be calculated to reach 72 K at perihelion. Vapor pressures at
11that temperature for potential haze constituents C2H4 and C2H6 are 0.0009 and 0.0046 Pa,
respectively (Fray & Schmitt 2009). Comparing these non-negligible vapor pressures with
Pluto’s present-day surface pressure of ~1 Pa suggests that the haze particles on the ground in
Cthulhu could evolve via sublimation loss of their more volatile constituents, potentially leading
to greater concentration of tholins over time. Another possibility is sintering (e.g., Eluszkiewicz
et al. 1998), considering that 72 K is not far below the zero pressure melting points of pure
simple hydrocarbons like C2H6 (90 K), C3H8 (85 K), and C2H4 (104 K), and that partial melting
of hydrocarbon mixtures can occur at even lower temperatures (Hanley et al. 2017). Sintering
could bind the deposited material into a more durable surface and reduce the possibility of
aeolian transport (e.g., Telfer et al. 2018). But it would also increase the thermal conductivity
and thus the thermal inertia, reducing the maximum temperature reached, so it could be a self-
limiting process. It is worth noting that Buratti et al. (2017) estimated Cthulhu’s bond albedo as
0.1 from visible wavelength LORRI images (350-850 nm; Cheng et al. 2008), but considering
Cthulhu’s steep rise in albedo toward longer wavelengths, that figure should probably be taken as
a lower limit for the bolometric bond albedo. A higher value would translate to lower maximum
temperatures reached.
Unlike Ly α photons and lower energy solar wind particles, cosmic rays with energies above
~30 MeV can penetrate through Pluto’s present-day atmosphere and drive chemical evolution on
the surface. X-rays could also contribute to processing of surface material, though their fluxes
are low (Lisse et al. 2017). Estimates of cosmic ray radiolysis at Pluto (Strazzulla et al. 1984)
find that depths down to ~5 mm will receive chemically significant doses in 100 Myr, during
which time a much greater ~350 mm of new haze particles would be deposited. A comparable
estimate can be arrived at by integrating the flux at 40 AU in protons over the energy range from
30 MeV up through 10 GeV from Cooper et al. (2003; Fig.3A). This totals ~2 GeV cm−2 s−1,
which will affect chemistry in a layer of ice many cm thick. The degree of processing reached
prior to burial depends on how this energy is distributed versus depth, but simplistically
assuming it to be distributed uniformly over the uppermost 10 cm, we find that these cosmic rays
deliver around 4% of the radiation needed to process the material to the 6 eV Da−1 dose
considered to be chemically significant by Cooper et al. (2003) during the ~30 Myr that it takes
for another 10 cm of haze to accumulate. From these estimates, it appears that while cosmic rays
can enable some further processing of Cthulhu’s accumulating haze, that processing does not
progress particularly far before the products are buried by the arrival of additional fresh haze
particles. The implication is that there must already be appreciable tholin present in the haze by
the time it arrives at the surface, since there does not appear to be enough radiation reaching the
surface to create much of it from the light hydrocarbon component of Pluto’s haze, unless there
are episodes when the atmosphere fails to screen out UV. Astrophysical events such as nearby
supernovae or the Sun’s passage through a region of dense galactic gas that compresses the
heliosheath could also play a role in increasing energetic radiation at Pluto’s surface, but with
new haze accumulating as fast as we estimate that it does, there would have to have been a recent
12event to have modified the optically active uppermost stratum of Cthulhu observed by New
Horizons.
On Iapetus, small, fresh craters with bright ejecta were seen in high resolution (~10 m
pixel−1) images of the dark exogenous material that coats the equatorial and mid-latitude regions
of its leading side (Denk et al., 2009). The small, bright craters were used to determine that the
dark material was a relatively thin coating. The fact that no fresh craters are seen in Cthulhu
exposing bright ice from below probably attests to the darkening being a relatively rapid and
ongoing process, consistent with accumulating dark haze particles. The lack of such craters
could also mean that the dark material is relatively thick, but high resolution images comparable
to those for Iapetus are not available for Cthulhu. A few small craters do expose bright substrate
material in Mordor Macula, Charon’s dark red northern polar deposit (Grundy et al. 2016b),
indicating that the accumulation rate of dark material in Cthulhu is likely much more rapid than
it is in Mordor. That observation is consistent with our estimate of ~14 m accumulation over 4
Gyr in Cthulhu versus just ~0.3 m in Mordor (Grundy et al. 2016b).
One quantitative technique to understand the origin of the low albedo material on Cthulhu is
to derive the macroscopic roughness of the surface. Icy and rocky surfaces with little infall of
exogenously-produced material tend to have rough surfaces, with mean slope angles of ~30°
(Buratti 1985; Helfenstein and Veverka 1987; Verbiscer and Veverka 1992; Domingue et al.
1995). In contrast, the low-albedo hemisphere of Iapetus, which is coated by dust from the
Phoebe ring (Buratti and Mosher 1995; Verbiscer et al. 2009; Tamayo et al. 2011) is smooth, with
a mean slope angle of only 6°, presumably due to infilling of rough facets by exogenic dust (Lee
et al. 2010). Similarly, an analysis of high and low albedo terrains on Titan showed that the low
albedo terrain was only about half as rough as the high albedo terrain, presumably due to
deposits of organic particles formed in Titan’s haze layers (Buratti et al. 2006).
To model the roughness of Cthulhu, we employed a crater roughness model (Buratti and
Veverka 1985), which is similar to the more widely used mean slope model of Hapke (1984).
The former model places paraboloidal craters defined by a depth-to-radius ratio on the surface: it
can easily be compared to the Hapke roughness
model by taking the first derivative of the equation
that defines the shape of the crater and equating it
to a mean slope angle. Scans of I/F were
extracted from Cthulhu with associated values of
the solar phase angle and radiance incident and
emission angles. The scans were fit to the model
by a least-squares method to derive the best depth- Fig. 4: Best fit crater roughness model
to-radius ratio, as shown in Fig. 4. The best-fit (smooth curve) compared with visible
ratio is 0.04 ± 0.01, corresponding to a mean slope wavelength I/F values extracted from
Cthulhu.
angle of 2° ± 1°. This number is not only
13exceedingly low, but similar to the best-fit depth-to-radius value of of 0.084 (corresponding to a
mean slope angle of 6°) for the low albedo hemisphere of Iapetus (Lee et al. 2010).
The smoothness of Cthulhu is also attested to by its forward scattering at near infrared
wavelengths as observed in the P_LEISA_HIPHASE observation at a mean phase angle of 169°
(see Fig. 5). This observation shows enhanced brightness where the illuminated crescent slices
across Cthulhu. It also shows that the blue coloration of Pluto’s haze reported by Cheng et al.
(2017) extends into near-infrared wavelengths, and that infrared scattering by haze particles is
detectable up to as high as ~150 km altitude before being lost in the noise.
Fig. 5: A: P_LEISA_HIPHASE
observation with wavelengths from
1.2-1.5 µm shown in blue, 1.5-1.9
µm in green, and 1.9-2.5 µm in red
(see the on-line version for color).
The arrow indicates enhanced
surface reflection from Cthulhu, the
brightest signal from the lit crescent.
Haze extends all the way around
Pluto’s limb, but this observation did
not cover the lower left quadrant.
B: Geometry at the mean time of the
observation. C: Mean haze
spectrum for the pie slice in panel A,
averaged over the lowest 40 km. D:
Radial profile in the same sector, averaged over wavelengths 1.2-1.5 µm.
With its relatively low rates of radiolytic and thermal processing, at least during present-day
climate and radiation conditions, Cthulhu may be an ideal place to study Pluto’s haze particles.
They appear to form a deep accumulation on this ancient surface that is relatively
uncontaminated by the spectral signatures of Pluto’s seasonally-mobile volatile ices or bedrock
H2O ice. The appearance is generally dark and red, but it is not perfectly homogeneous. Fig. 6
shows a hard stretch on P_COLOR_2 in eastern Cthulhu. Slightly darker shades are evident in
many crater floors and also following the courses of valley floors. This distribution of shading is
suggestive of preferential accumulation of the reddish material in topographic lows, perhaps
under the influence of winds (e.g., Telfer et al. 2018) or through the erosive action of seasonally
deposited volatile ices. But the difference in color between smooth plains and darker, low-lying
areas is subtle, as indicated by the color ratios in the right panel of Fig. 6.
As reported by Olkin et al. (2017), some of the reddest colors in Cthulhu occupy a core
region extending approximately from 120° to 145° E longitude and from −8° to +4° in latitude.
With lower resolution LEISA data, Schmitt et al. (2017) show a well-populated mixing trend
between the spectral characteristics of the core of Cthulhu and more H2O-rich compositions
along its periphery. The LEISA data place the core region further to the east than the MVIC
14Fig. 6: A: hard stretch on the P_COLOR_2 observation of Cthulhu, with five regions of
interest (ROIs) identified. ROIs 1-3 are topographic lows showing slightly darker shades. ROI
4 is a plains region that is slightly more pale. ROI 5 is near the center of a region of maximum
redness identified by Olkin et al. (2017). B: color ratio plot, showing the mixing curve
between Cthulhu colors at upper right and more typical Pluto colors at lower left, as well as the
colors of the five ROIs, which are among the reddest colors seen on Pluto’s encounter
hemisphere.
colors do, at ~160° E longitude. The longitudinal difference between maximum redness in
MVIC images and maximum tholin spectral signature in LEISA data is not yet understood, but
could perhaps be a photometric effect of the incidence and emission angles that vary across the
scene. Both instruments show the material becoming progressively more diluted with substrate
material towards the northern and southern boundaries of the macula, suggesting that the Cthulhu
core region is the place to look for haze particles with the least contamination by other materials.
ROI 5 was selected to represent that region. The colors there are quite similar to those of ROIs 1
and 2, corresponding to topographic lows toward the eastern edge of the reddest core zone based
on MVIC colors.
Cook et al. (2018) analyzed lower spatial resolution LEISA Pluto spectra of the entire
encounter hemisphere, specifically looking for signatures of non-volatile materials. They
reported evidence for H2O ice absorption bands at 1.5 and 2 µm towards the periphery of
Cthulhu, possibly material from Pluto’s mantle mixed up into the reddish material through
erosion by seasonally deposited volatile ices or some other geological process, or simply exposed
in outcrops below the resolution limit of New Horizons’ cameras. They also found evidence for
absorption by C2H6 ice, especially in eastern Cthulhu, including the region where the Schmitt et
al. (2017) LEISA compositional maps place the Cthulhu “core”. Ethane was proposed as
representative of all alkanes heavier than methane, but confidence in that interpretation is
15boosted by its identification in higher spectral resolution ground-based observations around the
same longitude (Holler et al. 2014). Interestingly, Cook et al. also found tentative evidence for
methanol ice (CH3OH), also mostly in eastern Cthulhu. Wong et al. (2017) did not report
expected abundances for oxygenated species among the photochemical constituents of haze
particles, but they mention the possibility of oxygenated compounds, since oxygen is potentially
available for photochemistry and ion-molecule chemistry, both from Pluto’s atmospheric CO and
from infalling H2O-rich dust particles from the Kuiper belt and from the small satellites.
With its higher spatial resolution, the P_LEISA_HIRES observation has the potential to
reveal details of regional variation in the materials
that make up Cthulhu’s reddish coating. But after
excluding isolated patches of volatile ices, the
LEISA spectra do not show a great deal of spectral
variability within Cthulhu beyond the trends
already reported by Schmitt et al. (2017) and Cook
et al. (2018), consistent with the homogeneity seen
in MVIC colors. Figure 7 compares spectra of the
five ROIs, relative to a mean Cthulhu spectrum.
ROI 1 might show a hint more of H2O absorption
at 2 µm, while ROI 5 might show a hint more
hydrocarbon absorption around 2.4 µm, but the
differences are not especially striking.
We next consider whether Cthulhu’s colors Fig. 7: Top panel: MVIC and LEISA
can be reproduced using our simple haze particle combined mean I/F spectrum of eastern
Cthulhu. Bottom panel: spectral ratios for
model. Using effective medium theory, we
the five ROIs in Fig. 6 relative to the top
computed effective n and k for a range of tholin panel spectrum, with vertical offsets as
content from 1% through 90% relative to noted.
transparent hydrocarbon ice and then adjusted the
particle size in a Hapke model (e.g., Hapke 1993) to get the right I/F range for the relevant
illumination and observation geometry. Smaller particle sizes make the surface brighter while
larger ones make it darker. We used grain sizes larger than the 1 µm generic haze particle size,
since Hapke models assume the ray optics regime with grain sizes larger than the wavelength,
and, as mentioned earlier, it is possible that haze particles could become sintered into larger
aggregates. Even allowing this degree of freedom, the match to MVIC colors of these models
was generally poor, being too dark in the BLUE filter and too bright in the NIR filter. This
mismatch shows that the Titan tholin is too strongly pigmented for the assumed model
configuration. The excess coloration could be remedied by introducing an additional neutral
absorber, such as carbonaceous material. A material that absorbs more strongly at MVIC NIR
wavelengths would also work. Although continuing radiolysis or photolysis of tholins is known
16to produce dark, neutral material similar to amorphous carbon, such a high degree of processing
seems difficult to reconcile with the limited residence time of macromolecular material in Pluto’s
atmosphere and its rapid burial rate on the surface. Spectrally neutral, non-absorbing scatterers
can similarly suppress color contrast, and are perhaps more plausible, since voids in an aggregate
(such as the middle cartoon in Fig. 2) behave as neutral scatterers if they are large compared to
the wavelength, λ, and like Rayleigh scatterers if they are much smaller. Neutral scattering can
be introduced via Hapke’s s parameter in the equivalent slab single particle model, with units of
inverse length, and Rayleigh scattering by microscopic voids can be simulated by making s
proportional to λ−4. A simulation with 25% tholin haze in a matrix of transparent hydrocarbon
ice, aggregated into 100 µm grains, and with s = 10,000 cm−1 (for all wavelengths) matched the
MVIC colors reasonably well, but is by no means a unique solution, and this and other models
using Titan tholin all fail to match the high reflectance at LEISA wavelengths.
Fig. 8: Dashed lines show effective values of the
imaginary part of the refractive index, k, for Pluto
haze suggested by MVIC-LEISA colors, for 1 µm
and 5 µm grain sizes, and also for the tholin
component if it is diluted 9:1 in transparent ice
aggregates that behave like 20 µm grains. The
solid black curve is k for Titan tholin, gray curve
is k for Triton tholin, and dotted curve is k for
C2H6-H2O ice tholin.
An alternate approach is to ask what effective optical constants of the haze particles could
produce the observed Cthulhu colors. For isotropic single scattering, we would need single
scattering albedo, w, of 0.30, 0.47, and 0.71 to match I/F at BLUE, RED, and NIR wavelengths
respectively. By 1.3 microns, w would need to have risen to around 0.96. Assuming a particle
size, we can invert the equivalent slab single particle approximation in Hapke’s model to say
what value of the imaginary part of the refractive index, k, would be needed to match w at these
wavelengths. These values are compared with k for various tholins in Fig. 8. The Khare et al.
(1984) Titan tholin shows too steep of a gradient through the MVIC wavelength range, as do
other Titan tholins (not shown). Tholins produced by irradiation of ices, rather than gases (e.g.,
Khare et al. 1993, 1994; Materese et al. 2014), show a gentler slope at MVIC wavelengths, more
consistent with MVIC colors, but they do not match the steep decline in absorption between
MVIC and LEISA wavelengths. Only the Titan tholins drop off quickly enough over that
wavelength range. Our assumption of isotropic single scattering may be part of the problem.
More plausibly, the single scattering phase function, P(g), should be forward scattering, and also
wavelength-dependent. Whether or not the observed spectral behavior can be reconciled with
existing tholin optical constants by including such effects is left to future analysis.
175.2 Sputnik Planitia
Sputnik Planitia (SP) is a vast, 1,000 by 1,300 km deposit of volatile ice filling what has
been interpreted as an ancient impact basin (Moore et al. 2016; McKinnon et al. 2016). From
LEISA spectroscopy, the composition of the optically active surface is dominated by N2 ice, with
admixtures of CO and CH4 ices (Protopapa et al. 2017; Schmitt et al. 2017). As mapped by
White et al. (2017), much of SP’s surface features a cellular pattern of irregular polygons a few
tens of km across that have been interpreted as the surface expression of convection cells
(McKinnon et al. 2016; Trowbridge et al. 2016). Rheological models assuming a pure nitrogen
ice composition show that for a plausible internal radiogenic heat flow of 3 mW m−2, solid state
convection should occur in N2 ice for deposits thicker than ~500 m or so, with convective
overturn timescales on the order of 105 to 106 years (McKinnon et al. 2016; Trowbridge et al.
2016). The thickness of the convecting volatile ice deposit is uncertain, but it could be as
shallow as ~1 km or as deep as ~10 km, with the depth-to-width aspect ratio of the convection
cells being sensitively dependent on boundary conditions and the temperature-dependent
viscosity of the ice (McKinnon et al. 2016).
Haze particles deposited on the surface of SP should be transported along with the
convective motion until they reach a down-welling zone after some 105 to 106 years. By that
time, something like 0.35 to 3.5 mm of material should have accumulated, based on our
estimated haze production rate. If the haze particles have appreciable tholin content, as we
concluded they must in the previous section, the presence of such a thick coating of them should
impart a very strong coloration in MVIC’s color images, yet there does not appear to be much of
Fig. 9: A: Hard stretch of P_COLOR_2 showing convection cells in Sputnik Planitia, with
ROIs selected to search for color contrasts between younger, up-welling zones in the centers of
cells (ROIs 1 and 3) and older, down-welling zones near their peripheries (ROIs 2 and 4).
B: Color ratio plot zoomed in on the dense clump of near-neutral bulk Pluto colors.
18a color gradient from the up-welling centers to the down-welling edges of the cells. A hard color
stretch of part of Sputnik is shown in Fig. 9. In some cells, especially toward the east, there is
evidence for increasing redness from center to edge, as would be expected for increasing
abundance of haze particles accumulating on the older terrain toward the edge of each cell. But
in terms of color ratios, the color difference is quite small, as shown in the right panel. Such a
subtle color difference could easily be a texture effect, unrelated to haze accumulation. To the
north and west of Fig. 9, regions currently undergoing sublimation (Protopapa et al. 2017;
Bertrand et al. 2018), some of the upwelling central regions appear darker, though not
appreciably redder.
Several possible mechanisms may explain the absence of stronger color differences between
up-welling and down-welling regions in Sputnik Planitia, despite rapid deposition of strongly-
pigmented haze particles. Haze particles may be quickly buried by the diurnal (6.4 Earth-day
period) or annual (248 Earth-year period) cycles of volatile ice sublimation and condensation.
One dimensional global volatile transport models predating the New Horizons flyby had
anticipated deposition and sublimation rates as great as a few cm per Earth year (e.g., Spencer et
al. 1997; Hansen et al. 2015). Accounting for the actual topography and albedo of Sputnik
Planitia, and using a Global Circulation Model (GCM), Forget et al. (2017) and Bertrand et al.
(2018) confirm sublimation and deposition rates as high as tens of microns per Pluto day, and
locally as high as 5 cm per Pluto year, far in excess of the haze accumulation rate. Additionally,
a dark haze particle resting on or near the surface of the volatile N2 ice will absorb more sunlight
than adjacent N2 ice does. The resulting additional heating will accelerate N2 sublimation in the
immediate vicinity of the haze particle, possibly excavating a cavity into which it could sink
(e.g., Kieffer 1990; Grundy & Stansberry 2000; Keiffer et al. 2000; Piqueux et al. 2003; Keifer
2006; Keiffer et al. 2007; Portyankina et al. 2010). If more dark haze particles accumulate in the
cavity thus produced, it could grow into a larger pit over time. Complex wind patterns are
expected to occur in and around Sputnik due to sublimation and condensation in response to the
diurnal insolation cycle and to katabatic downslope flows, according to global circulation models
(e.g., Forget et al. 2017). It is not clear whether these winds would be sufficient to prevent haze
accumulation in Sputnik, or would concentrate its deposition into certain regions, but depending
on the sizes of the haze particles, wind speeds could exceed haze settling speeds and thus
transport haze particles over large distances horizontally before they reach the surface (Bertrand
& Forget 2017). Winds may also mobilize haze particles after they settle onto the surface (e.g.,
Telfer et al. 2018), transporting them to nearby pits or fractures, where they would not be so
easily seen. Potential dunes mapped by Telfer et al. in northwest Sputnik have high albedos and
show CH4 ice absorption so they are clearly not dominated by tholin-rich haze, but even aeolian
activity involving CH4 ice particles could be expected to refresh the surface in that region much
faster than haze can accumulate.
19Wherever haze particles accumulate on SP, though they may be hidden from view through
burial or other mechanisms, they will be carried along with the convective flow toward down-
welling regions, and ultimately mixed into the bulk ice via the convective churning. If the
glacier is 1 km thick and 4 Gyr old, and haze has been accumulating at our estimated rate and
mixing into the glacier over that entire time, then about ~1.4% of the glacier’s present-day bulk
would have its origin in atmospheric haze. If the glacial ice deposit is 10 km thick, reflecting the
higher end of estimates (e.g., Trowbridge et al. 2016), then the haze would only have contributed
a tenth as much, fractionally. Depending on the tholin content of the haze, even such a small
admixture should be enough to alter the coloration of the bulk ice, since tholin is so strongly
pigmented and N2 ice is highly transparent. Even a fraction of a percent of haze should make
exposed slab ice look dark rather than bright. Indeed, this may account for the dark floors of
sublimation pits in southern Sputnik Planitia (e.g., White et al. 2017) as well as the darker ice
along the northwest margin of Sputnik where climate models suggest sublimation has recently
been most active (Bertrand et al. 2018). Whether such quantities of heavier hydrocarbons and
nitriles would significantly alter the phase behavior or rheology of N2:CO:CH4 ice is unclear, but
laboratory studies are clearly called for. Though their contribution may be volumetrically small,
relatively non-volatile particles could act as pinning points and thus influence the rheologically
important grain size distribution.
5.3 Lowell Regio
Pluto has a variety of regions that have been identified as being especially rich in CH4 ice.
These are highlighted in maps of the equivalent width of absorption in the MVIC CH4 filter
covering 860-910 nm (Grundy et al. 2016; Earle et al. 2018) as well as in LEISA maps
(Protopapa et al. 2017; Schmitt et al. 2017). CH4-rich regions include Lowell Regio (the north
polar zone), the bladed terrain of Tartarus Dorsa, various bright mid-latitude crater rims and
scarps, and the ridge crest of Enrique Montes in eastern Cthulhu.
This section will focus on Lowell Regio. Parts of this high-latitude region show
geomorphological evidence for kilometer thick mantling of underlying topography (Howard et
al. 2017). Such thick ice deposits would require many Pluto seasons to accumulate and so could
perhaps be related to the ~3 Myr cycle of mega-seasons (Dobrovolskis et al. 1997; Earle &
Binzel 2015; Bertrand et al. 2018), or maybe much longer, as suggested by the existence of a few
small impact craters. Bertrand et al. (manuscript in preparation) estimate km thick CH4-
dominated polar deposits would require time scales of order 100 Myr to form. A deposit that
took 1 Myr to form could be expected to incorporate 3.5 mm of haze, assuming steady state haze
production and deposition. For a 1 km thick deposit, that would be 3.5 parts per million of its
bulk volume, which sounds negligible, but if it arrives in the form of 1 µm haze particles, they
would add up to ~3.5 million particles per cubic centimeter of deposited ice. They could alter
the bulk ice’s rheological behavior by pinning grain boundaries. Or, some of the haze
20You can also read