SOUTH EAST QUEENSLAND REGION - Impacts and adaptation strategies for a variable and changing climate in the - USQ
←
→
Page content transcription
If your browser does not render page correctly, please read the page content below
Climate Impact and Adaptation Series

                                                            Courtesy of Tourism Queensland

    Impacts and adaptation strategies
for a variable and changing climate in the
   SOUTH EAST QUEENSLAND REGION

                                  This summary describes the likely
                                  impacts of a variable and
                                  changing climate on the major
                                  primary industries of the South
                                  East Queensland (SEQ) region
                                  including grazing, dairy, cropping,
                                  horticulture, sugar, fisheries and
                                  aquaculture, and the potential
                                  adaptation strategies, which can
                                  be implemented to minimise
                                  climate risks.
Major Primary Industries
                                                                            Land use is very diverse in this region, with urban and industrial
                                                                            areas, forestry in native and plantation forests, national parks and
                                                                            conservation areas. The area supports production of dryland and
                                                                            irrigated sugar, as well as dairy, beef, broadacre crops, fruit and
                                                                            vegetables. The majority of the region’s agricultural area is used
                                      Courtesy of Tourism Queensland
                                                                            for grazing of beef cattle, with some dairy farming located on
                                                                            productive grazing land. The rich alluvial soils along the valleys in
 Regional Profile                                                           the west and south of the region including the Brisbane, Lockyer,
                                                                            Fassifern and the Albert-Logan valleys support a vast array of
 South East Queensland (SEQ) is Australia’s fastest growing                 cropping industries. Close to the coast, horticulture and cropping
 region and includes 11 regional and city councils including                industries thrive in the Gold Coast, Redlands and Sunshine Coast
 Brisbane, the Gold and Sunshine Coasts, Ipswich, and the                   districts. The gross value production (GVP) in 2014-15 of
 Lockyer Valley. In 2012, the region’s population was 3.2 M                 agricultural commodities in the region was $1.4 B or 11% of the
 and is projected to be above 4.1 M by 2026.                                state total GVP for agricultural commodities ($11.9 B, ABS
 The region has a sub-tropical climate (i.e. hot wet sum-                   2016a).
 mers with cooler dry winters) and the key climate systems
 affecting this region include the tropical systems from
 the north and the sub-tropical high pressure ridges to the
 south. Temperatures have an average historical annual
 minimum of 13.5°C and an average annual maximum of
 25.6°C at Nambour on the Sunshine Coast; and 14.4°C and
 27.4°C at Ipswich. The average historical annual rainfall is
 1714 mm at Nambour (1894-2015) and 866 mm at Ipswich
 (1870-2015). The fast growing population and coastal lo-
 cation make SEQ particularly vulnerable to extreme events
 associated with a more variable and changing climate.
                                                                                                                       Courtesy of Tourism Queensland

Climate Trends and Projections
  Historical changes in the key climate variables relevant to agricultural production including temperature, evaporation, rainfall,
  sea surface temperature, hot days, duration of cold periods and growing season length are summarised in Table 1. Table 2
  provides information on the historical means for the key variables and the projected changes for 2030. Projections of rainfall
  changes are less clear than those of temperature. In SEQ changes by 2030 are within the bounds of existing natural climate
  variability, and by 2090 models show either little change or a slight decrease in rainfall (Dowdy et al 2015).

Table 1: Historical Climate Trends (Interpreted and summarised from BOM 2016)

                                         Trend Since                                           Change per decade
              Variable
                                            (year)
                                                                     Annual                        Summer                             Winter
      Maximum Temperature
                                             1950                +0.05 to +0.20                 +0.05 to +0.15                    0.15 to +0.30
             (°C)
      Minimum Temperature
                                             1950                +0.10 to +0.15                 +0.10 to +0.30           +0.20 (north) to +0.10 (south)
             (°C)
         Mean Temperature                                        +0.10 (east) to
                                             1950                                               +0.10 to +0.15                    +0.15 to +0.20
               (°C)                                               +0.20 (west)
          Pan Evaporation
                                             1970                   -5 to -2.5                    -2.5 to NSC                      -2.5 to NSC
               (mm)
               Rainfall
                                             1950           -60 (east) to -20 (west)        -20 (east) to -5 (west)          -20 (east) to -10 (west)
                (mm)
     Sea Surface Temperature
                                             1950                +0.08 to +0.12                 +0.08 to +0.12                    +0.08 to +0.12
               (°C)
         Number of Hot Days                  1970                                                    +2.5 days
         Cold Spell Duration                 1970                                                      0 days
      Growing Season Length                  1970                                                     +8 days
 NSC - No significant change | Unknown Growing Season Length | Pan Evaporation = the amount of water evaporated from an open pan per day | Hot Days =
 annual count of days with maximum temperature >35°C | Cold Spell Duration = Annual count of nights with at least 4 consecutive nights when daily minimum
 temperature < 10th percentile | Growing Season Length = Annual (01 July to 30 June) count between first span of 6 or more days with daily mean temperature
 >15°C and first span of 6 or more days with daily mean temperature
Climate Impact and Adaptation Series

  Additional climate projections for Queensland
• Global atmospheric carbon dioxide concentration (CO2) is rapidly increasing. In March 2015, the monthly global average
  carbon dioxide concentration exceeded 400 ppm, well above the natural historical range from the last 800,000 years of
  172 ppm to 300 ppm (CSIRO and BOM 2012a). Global CO2 levels are projected to reach 540 ppm by 2050 and 936 ppm by
  2100 (RCP8.5 high emissions) (IPCC 2013).
• Queensland can expect longer dry periods interrupted by more intense rainfall events. The frequency of both extreme El
  Niño and extreme La Niña events are likely to nearly double in response to greenhouse warming (Cai et al. 2014, 2015).
• Although there is some uncertainty about future tropical cyclone potential in Queensland, there is confidence in the
  projections of a future decrease in the number of tropical cyclones, an increase in the proportion of high intensity tropical
  cyclones and a decrease in the proportion of mid-range intensity storms: more than 50% of models project a decrease in the
  frequency of tropical cyclones of between 15 to 35% by 2090 (CSIRO and BoM 2015).
• Along the Queensland Coast, sea level is expected to rise 13 cm (the model range is 8 – 18 cm) by 2030 and 65 cm by 2090
  under the highest emissions (CSIRO and BoM 2015). The Statutory erosion prone areas are declared under section 70 of the
  Coastal Protection and Management Act 1995 (Coastal Act) and include the effect of a projected 80 cm sea level rise. An
  80 cm rise in sea level is expected to inundate about 1.25 Mha of Queensland (which is 173 Mha in size); or about 65,825 ha
  (3%) of the SEQ region land (2.23 Mha) consisting mainly of existing marsh/wetland/rivers/lakes (1%), dryland cropping
  (0.45%), nature conservation areas (0.4%), natural grazing (0.3%) and residential land (0.2%) (DSITIA 2012, Witte et al. 2006).
• Since 1750, atmospheric CO2 dissolving in the oceans has lowered the global average ocean pH by 0.1 units, representing a
  30% increase in hydrogen ion (acid) concentration (Howard et al. 2012). Ocean pH is expected to decrease a further 0.2-0.5
  units by 2100 lowering rates of calcification for shelled marine organisms (Caldeira and Wickett 2005).
• Ocean circulations are expected to change, including a possible intensification and strengthening of the East Australian
  Current by a further 20% by 2100 (Poloczanska et al. 2009, Cai et al. 2005). However, a more recent study showed
  differences in strengthening between regions with most of the strengthening likely to occur south of the Great Barrier Reef
  (Sun et al. 2012).
• Sea surface temperature off the Queensland coast is most likely going to be between 0.4-1°C warmer in 2030 and 2.5-3.0°C
  warmer by 2090 than the 1986-2005 baseline (CSIRO and BOM 2015).
• The amount of time spent in extreme drought will increase in the highest emission scenarios (CSIRO and BOM 2015).

Table 2: Historical means for the period 1986-2005 and climate projections for 2030 (2020-2039) under the RCP8.5 emissions scenario relative
to the model base period of 1986-2005

                    Variable                        Annual          Summer                Autumn                Winter                 Spring
                               Historical mean       19.4             23.9                  20.1                  14.0                  19.6
      Temperature
         (°C)                  Projections for        +0.9            +0.9                 +0.9                  +0.8                  +0.9
                                    2030          +0.6 to +1.3    +0.6 to +1.3         +0.6 to +1.2          +0.6 to +1.2          +0.6 to +1.4
                               Historical means      1135              431                  317                   148                   227
         Rainfall
          (mm)                 Projections for        -3%             0%                  -3%                    -5%                   -5%
                                    2030          -11% to +5%     -10% to +9%         -14% to +10%           -15% to +4%           -15% to +6%
                               Historical mean       1553
  Potential Evaporation                                                               Historical means from 1986-2005
          (mm)                 Projections for       +3%
                                    2030          +2% to +5%               Projections for 2030 (20-year period centred on 2030)
                               Projections for       0%                                        Best Estimate
    Relative Humidity
                                    2030            ±0.5%                                Range of Change (5th - 95th)
                                                                   For more information, including projections for 2050 and 2070, please refer to
                               Projections for        0%
       Wind Speed                                                      http://www.climatechangeinaustralia.gov.au/en/ or Moise et al. 2015.
                                    2030             ±2%

                                                                                                                                                Page 3
Impacts of a variable and changing climate in the
South East Queensland Region
Whilst a more variable and changing climate will impact the key primary industries in the region, the population and natural
environment will also feel the effects.
Human Well-Being
The variable and changing climate of the region will have both direct and indirect impacts on health, location and living arrange-
ments.
 Likely Impacts                                                      Potential Strategies for Adaptation
Extremes of weather and climate (drought, flood, cyclones, heatwaves etc.) on human well-being (Smith et al. 2014, TCI 2011,
Hughes and McMichael 2011, NCCARF 2011a)
• Direct effects of extremes of weather include injury and • Adapt existing buildings and plan any new infrastructure to
   death during floods and cyclones, heat stress during heat-     take into account climate impacts and extreme events such
   waves, and a reduction of cold-related deaths.                 as flooding, tropical cyclones and sea level rise.
• Indirect effects of extremes of weather could include an in- • Implement control measures to reduce the impact of bush-
   crease in the:                                                 fires, heatwaves, mosquitoes, water-borne and food-borne
  οο number of bushfires due to extreme heat and aridity;         diseases, infectious and contagious diseases and injuries.
  οο risk of mosquito-borne, water-borne and food-borne dis-    • Continue to obtain information on the expected effects of a
     eases;                                                       changing climate.
  οο number of infectious and contagious diseases with an in- • Develop agreements with your workers on how to manage
     crease in the number of injuries; and                        extreme hot days, or identify periods of time where weather
                                                                  and climate affect working conditions.
  οο incidence of disease from microbial food poisoning with an
     increase in temperature.                                   • Develop social support networks.

• Increases in extreme events can lead to increased pressure • Contact your local council or relevant government
   on health systems, including an increased demand for health    department to find information on social and health
   professionals, ambulance and hospital workers.                 support programs.
•   Rural, regional and remote communities are particularly
    exposed in a changing climate compounding the chronic
    difficulties and inequities that already face many
    communities. Many parts of the country already find it hard
    to recruit dedicated health care and social service
    professionals. A changing climate will also increase the
    demand for social support and mental health services, and,
    at the same time, make it harder to recruit and retain staff
    in affected areas.
•   Infrastructure assets along the Queensland coast and islands
    are at risk from the combined impact of sea level rise,
    inundation, shoreline recession, coastal erosion and
    extreme events (DCCEE 2011).
•   Severe weather events can destroy places and disrupt
    livelihoods and communities leading to long-term mental
    health effects. According to Bonanno et al. (2010), a
    significant part of the community, as many as one in five,
    will suffer the debilitating effects of extreme stress,
    emotional injury and despair.
•   The emotional and psychological toll of disasters can linger
    for months, even years, affecting whole families, the capacity
    for people to work and the wellbeing of the community.
•   Evidence is beginning to emerge that drought and heatwaves
    lead to higher rates (by about 8%) of self-harm and suicide
    (Doherty and Clayton 2011).
•   Those most vulnerable to extremes of weather and climate
    include children, the elderly, Indigenous communities and
    people with pre-existing diseases and disabilities.

Page 4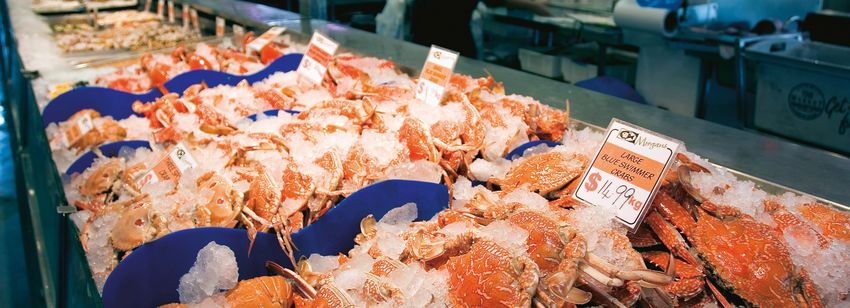
Climate Impact and Adaptation Series

Biodiversity
The South East Queensland (SEQ) bioregion covers the entire SEQ region and is rich in biodiversity with many species
vulnerable to a changing climate, including some that reach their northern limits on mountains and plateaus, and some with
very small populations (Williams et al. 2014). Genera endemic to the SEQ bioregion include the satinay sand skink (Coggeria
sp.), the amorous skink (Eroticoscincus sp.), the Nangur spiny skink (Nangura sp.) and the Australian lung fish (Neoceratodus
sp.). Wallum vegetation found on the coastal sandmarshes is also rich in endemic plants and animals such as crustaceans,
insects, fish, frogs and reptiles. The region is very rich in eucalypts. The degree of ecological change caused by climate change is
more likely to be greater in the plant biological group than that of mammals, amphibians or reptiles (Williams et al. 2014).

 Likely Impacts                                                    Potential Strategies for Adaptation
Extremes of weather and climate (drought, flood, cyclones, heatwaves etc.) on Biodiversity (Low 2011)
• Extended distributions – Within the bioregion, dominant • Fire management.
  eucalypts have distributions extending far to the north and • Weed management including community education, nursery
  west into drier regions. This suggests good prospects for       liaison and restrictions on weedy plants grown and sold are
  survival under a changing climate.                              needed to reduce weed invasion due to escape from home
• Threats to flora – Under a scenario of more extreme             gardens.
  droughts, fires or flooding killing native plants, weeds may • Pig control to protect ground dwelling species.
  take their place.
                                                                • Pollinator conservation.
• Altered mangrove area – There may be an increase in
                                                                • Reduce development around coastal wetlands to ensure
  mangroves due to large areas of saltmarsh available for
                                                                  fauna and flora can migrate upslope in response to rising
  colonisation and due to sea level rise and sedimentation,
                                                                  sea level.
  enhanced atmospheric carbon dioxide, increased rainfall
  and nutrient enrichment promoting plant growth (Low           • Increase conservation of forests on fertile soil for koala,
  2011). Other factors, such as increased temperature, aridity,   sugar glider and other foliage-feeding fauna.
    increased storm intensity and infrastructure barriers may
    reduce growth.
•   Threats to fauna – Changed climate conditions will increase
    the risk of further damage from hot fires. Droughts of
    greater intensity may decrease seepage flows and food
    for the frogs and increase pig wallowing and grubbing.
    Higher temperatures may directly disadvantage the frogs.
•   Threats to fauna – More severe droughts and declining food
    quality from rising carbon dioxide levels will contribute to
    ongoing declines in koala and greater glider numbers.
•   Threats from increased temperatures – Rising temperatures
    will benefit exotic fish in south-eastern waters. Most
    aquarium fish prefer high temperatures, and several escaped
    exotic species present in the bioregion are probably limited
    in numbers by cool temperatures.

                                                                                                         Courtesy of Tourism Queensland

                                                                                                                                Page 5
Climate Impact and Adaptation Series

Grazing Industry
Cattle, sheep and wool are important primary industries in Queensland. In 2014-15 their combined GVP was $5.2 B (44% of the
total Queensland GVP of agricultural commodities, ABS 2016a) which is made up of the production and marketing of beef cattle
($5.1 B), sheep and lambs ($66.4 M) and wool ($66.2 M).
Cattle numbers in SEQ were 355,000 in 2014-15 which was 3% of the total cattle numbers for Queensland (ABS 2016b). In
2014-15 the GVP for cattle, sheep and wool for SEQ was $158 M (ABS 2016a) or 1% of state and 12% of the value of SEQ
agricultural commodities.
The majority of beef, sheep and wool production come from native pastures which cover about 85% of Queensland. The main
pasture communities in SEQ are Black spear grass (40% of region) and Blady grass (3%) (Tothill and Gillies 1992). The soil fertility
is good (Black spear grass) to poor (Blady grass) and growth of pastures is usually limited by inadequate rainfall (Black spear grass)
or low nitrogen availability (Blady grass).
Case Study - Impacts in the South East Queensland Region
The impacts of a changing climate are complex because of interacting and opposing forces operating within the biophysical
system (McKeon et al. 2009). The process of assessing the impacts of a changing climate often involves deriving the ‘best
estimate’ projections of future climate, simulating the grass growth and grazing strategies under changing climate
conditions using well-calibrated grass/grazing system models, and combining the simulation output with successful
producer and researcher experience in regional Queensland. A good example of a proven process of assessing the impacts,
adaptive responses, risks and vulnerability associated with a changing climate is the ‘risk matrix’ approach (http://
www.longpaddock.qld.gov.au/products/matrix/index.html, Cobon et al. 2009, 2016) which is customised for primary industries
and is based on the Australian and New Zealand Risk Management Standards (Standards Australia 2004).
There are many gaps in knowledge, for example, the future climate projections are uncertain (particularly for rainfall) and in some
cases the projected changes in rainfall and temperature appear smaller than to year-to-year variability. Nonetheless, a risk-averse
approach to grazing management based on the ‘best estimate’ projections in combination with short-term management of
climate variability is likely to take advantage of any opportunities and reduce the risk of adverse impacts. There are major
known uncertainties in identifying the impacts of a changing climate in the grazing industry in relation to:
         1) carbon dioxide and temperature effects on pasture growth, pasture quality, nutrient cycling and competition between
         grass, trees and scrubs;
         2) the future role of woody plants including the effects of fire, climatic extremes and management of stored carbon (see
         McKeon et al. 2009 for more detail); and
         3) carbon dioxide effects on diet quality and liveweight gain of cattle (Stokes 2011).
Modelling analyses of native pasture grasses (C4 tropical and sub-tropical grasses) for the SEQ region were undertaken for
the Laidley, Kilcoy and Beaudesert areas (Cobon et al. 2012 unpublished data, Table 3). The average impacts of future climate
scenarios from the three locations were examined for pasture growth, pasture quality (% nitrogen of growth), liveweight gain of
cattle (LWG kg/ha), frequency of burning and frequency of green pasture growing days (GPGD). The baseline climate period was
1960-1990 and carbon dioxide concentration was 350 ppm. Improvements in water and nitrogen use efficiency resulting from
doubling of carbon dioxide levels were accounted for in the modelling as per Stokes 2011. The impacts were either positive or
negative, and as a guide were also classified as being of either High (>20% change from baseline, H), Medium (5%-20%, M) or of
little or no impact (5 to -5%, LC). The soils were of average fertility (20 kgN/ha) and the density of trees (16.73 m2/ha tree basal
area) resembled that of open woodland.
Table 3: Matrix showing potential opportunities and risks associated with the average impacts of future climate scenarios from
Laidley, Kilcoy and Beaudesert for modelled pasture growth (kg/ha), pasture quality (% nitrogen in growth), liveweight gain of
cattle (LWG kg/ha), frequency of burning and green pasture growing days (GPGD) (Source: Cobon et al. 2012 unpublished data).
 Future climate                                                 Growth     Quality        LWG        Burning       GPGD
 +3°C                                                             LC          LC           +M           +M           +M
 2xCO2                                                           +M          -M            +M           +H           LC
 +3°C, 2xCO2                                                     +M          -M            +H           +H           +M
 +3°C, 2xCO2, +10% rainfall                                      +H           -H           +H           +H           +M
 +3°C, 2xCO2, -10% rainfall                                      +M          -M            +M           +H           +M
 H= high, M= medium, LC = little change
 Shading indicates positive and negative impacts
 Positive impacts showing either High or Medium opportunities
 Negative impacts showing either High or Medium risks

Page 6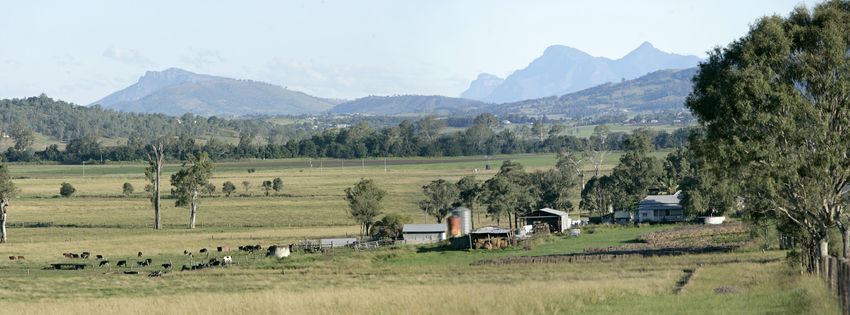
Climate Impact and Adaptation Series
This study found that there are likely to be:
    • positive impacts of a changing climate including increased pasture growth and liveweight gain, a higher frequency of
         burning providing more opportunity for prescribed burning to control weeds, regrowth and dry vegetation, and more
         green pasture growing days; and
    • negative impacts including a reduction in pasture quality with doubled carbon dioxide and the combined impacts of a
         3°C rise in temperature, doubled carbon dioxide and either 10% more or less rainfall.

 Mt Barney, Near Rathdowney, Gold Coast, Queensland                                                      Courtesy of Tourism Queensland

 Opportunities for the Grazing Industry
 Many of the impacts and opportunities of a changing climate for the grazing industry in SEQ are detailed in Taylor et al. 2015a.
 Selected opportunities include:
 • Increased production of biomass will result from rising carbon dioxide levels as plants use water, nutrients and light resources
    more efficiently (Nowak et al. 2004).
 • Improved plant water use efficiency will allow pastures to produce more biomass using the same amount of water (Stokes
    et al. 2011).
 • Elevated carbon dioxide will increase the efficiency of water and nitrogen use by the pastures (Stokes et al. 2008), but
    this increase in growth of pastures is likely to be offset by a reduction in overall pasture quality (lower protein and lower
    digestibility) (Stokes et al. 2011).

Case Study - Using past records to help understand future impacts
Projected changes in rainfall of the order of ±10% appear low compared to year-to-year variability, or even in the difference between
the average of El Niño and La Niña years (-20% and 20% rainfall respectively in eastern Australia) (McKeon et al. 2004). However,
when the historical range of variation is analysed for a 25-year (climate change time-scale) moving average then a change in rain-
fall of ±10% is relatively high. For example, the 25-year moving average of rainfall at Laidley has fluctuated between -11 and +13%
compared with the long-term average since 1890 (Figure 1). The extended periods of lower rainfall (1920s to 1950s, 1990s to 2000s)
have been associated with extensive droughts, degradation events, reduced profits and greater debt and human hardship. It is likely
that under drier climatic conditions these circumstances will become more familiar with shorter and less frequent recovery periods.

Figure 1: 25-year moving average rainfall (12 months, April in year 1 to March in year 2) at Laidley, Qld (Source: Clewett et al.
2003).

                                                                                                                                 Page 7
Likely Impacts                                                     Potential Strategies for Adaptation
Changed rainfall patterns
•   Longer and more frequent droughts associated with more         •    Manage perennial grass cover using ‘best management
    extremes of climate, fewer recovery events, changes in              practice’ for the pasture community. For example, set the
    decadal rainfall variability and ENSO will decrease forage          annual stocking rate at the end of each growing season to
    production, surface cover, livestock carrying capacity,             utilise a safe proportion (10-20%) of available pasture and
    animal production and cause major changes in plant and              make adjustments accordingly for beneficial or spoiling
    animal species composition (Cobon et al. 2009, McKeon et            rainfall in winter or spring, early breaks to the dry season,
    al. 2009).                                                          locust plagues and forecasts of rainfall for the coming
•   Erosion risks are likely to increase due to greater year-to-        summer.
    year variability in rainfall.                                  •    Monitor trends in rainfall.
•   Rising tree densities and declining pasture condition raise    •    Use climate indicators to make early adjustments in animal
    the sensitivity of pastures to climate induced water stress.        numbers.
                                                                   •    Manage non-domestic grazing pressure.
                                                                   •    Use wet season spelling of pastures.
                                                                   •    Manage invasive plant species.
                                                                   •    Maintain refugia especially around wetlands (Cobon et al.
                                                                        2009).
                                                                   •    Manage climate variability and change by using forecasts of
                                                                        rainfall (and temperature) in decision making.
                                                                   •    Manage intra-seasonal (MJO, 30-60 day cycle), inter-annual
                                                                        (ENSO, 2-7 year cycle) and decadal rainfall variability (PDO/
                                                                        IPO, 20-30 year cycle) using indicators of MJO, ENSO (SOI,
                                                                        SST) and PDO, and climate analysis tools to adjust animal
                                                                        numbers commensurate with past and projected climate
                                                                        trends, such as:
                                                                       o LongPaddock (http://www.longpaddock.qld.gov.au);
                                                                       o AussieGRASS (http://www.longpaddock.qld.gov.au/
                                                                          about/researchprojects/aussiegrass/index.html);
                                                                       o ClimateArm http://www.armonline.com.au/ClimateArm

                                                                       o Bureau of Meteorology Website http://www.bom.gov.au,
                                                                         http://reg.bom.gov.au/climate/mjo
                                                                   •   Use supplementary feeding, early weaning and culling
                                                                       animals at risk to reduce mortalities in dry conditions
                                                                       (Fordyce et al. 1990).
                                                                   •   Increase or maintain Bos indicus content in herd to increase
                                                                       cattle tick and buffalo fly resistance/resilience.
                                                                   •   Monitor spread of pests, weeds and disease.
                                                                   •   Introduce more species of dung fauna (control of buffalo fly
                                                                       larvae).
                                                                   •   Promote greater use of traps and baits (buffalo and sheep
                                                                       blowflies) and vaccines (cattle ticks and worms).
                                                                   •   Use fire to control woody thickening.

 Crows Nest - Landscape, Toowoomba, Gold Coast, Queensland                                                Courtesy of Tourism Queensland

Page 8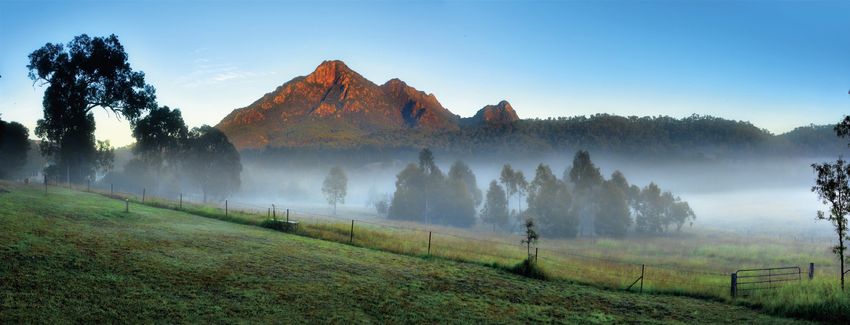
Climate Impact and Adaptation Series

 Likely Impacts                                                   Potential Strategies for Adaptation
 Increased temperatures
 • Warming will be greatest toward the interior of the            •   Arrange water points to reduce distance to water and even
   continent away from the moderating influence of the                out grazing pressure.
   ocean. Each 1°C increase in temperature will cause a           •   Select the time of mating to optimise nutritional require-
   warming that would be roughly equivalent to moving                 ments and reduce the risk of mortality in new-borns.
   about 145 km (or about 2o in latitude) closer to the
                                                                  •   Select cattle lines with effective thermoregulatory controls,
   equator (Stokes et al. 2011). For example, Clermont under
                                                                      efficient feed conversion and lighter coat colour (Finch et al.
   warming of 3°C is likely to receive temperatures currently
                                                                      1984, King 1983).
   experienced at Kowanyama (Figure 2).
                                                                  •   Proactively control disease by targeting known sources of
 • Grazing suitability is predicted to shift and contract south
                                                                      disease and vectors (Sutherst 1990).
   and east (Hosking et al. 2014)
                                                                  •   Maintain high standards of animal welfare to build
 • Livestock will be exposed to a greater risk of heat stress.
                                                                      domestic and export meat and fibre markets (Mott and
   They are unlikely to travel as far to water which
                                                                      Edwards 1992).
   concentrates grazing pressure and increases the risk of
   adverse pasture composition changes and soil degradation       •   Incorporate greater use of prescribed burning to reduce the
   (Howden et al. 2008).                                              risk of wildfires and control woody thickening.
 • Increased day time temperatures increases water turn-over      •   Rotate paddocks of heavier grazing for use as fire breaks.
   and evaporative heat loss resulting in reduced rate of         •   Maintain or improve quarantine capabilities, monitoring
   passage and forage intake in livestock (Daly 1984).                programs and commitment to identification and
 • Increased night time temperatures can reduce recovery              management of pests, disease and weed threats.
   time of livestock and increase the effects of heat stress      •   Develop species resistant to pests and disease, and use
   during the day.                                                    area-wide improved management practices.
 • Increased heat stress reduces fertility, conception, peri-
   partum survival and follicle development in sheep.
 • Warmer conditions favour vectors and the spread of animal
   disease (White et al. 2003).
 • Pastures could cure earlier under warmer climates shifting
   the timing of fires to earlier in the season.
 • Warmer drier conditions with higher frequency of storms
   could increase the risk of wildfires.

Figure 2: Annual average temperature in Australia (Source: Bureau of Meteorology). One degree of warming is roughly equivalent
to moving 145 km toward the equator.

                                                                                                                               Page 9
Likely Impacts                                                           Potential Strategies for Adaptation
 Increased temperature, higher carbon dioxide concentration and changed rainfall
 • Pastures growing under a climate characterised by                      •   Maintain land in good condition to reduce potential declines
   consistent water stress appear to benefit most from                        in forage production under a warmer drier climate.
   increased plant water use efficiency under elevated carbon             •   To compensate for declining forage quality, increase the use
   dioxide.                                                                   of supplements (N, P and energy) and rumen modifiers.
 • The fertilisation effects of doubled carbon dioxide (700 ppm)          •   Destock earlier in the season to make greater use of feedlots
   were found to offset declines in forage production under 2°C               to finish livestock.
   warming and a 7% decline in rainfall (Webb et al. 2011).
                                                                          •   Explore alternative land use in marginal areas.
 • The combined effects of elevated carbon dioxide (650 ppm),
                                                                          •   Apply safe carrying capacity of ~10-15% utilisation of
   higher temperature (3°C) and lower rainfall (10%) resulted
                                                                              average long-term annual pasture growth.
   in 10-20% lower forage production (McKeon et al. 2009). In
   this study increased temperature and declining rainfall                •   Undertake risk assessments to evaluate needs and
   outweigh the conservatively represented benefits of                        opportunities for changing species, management of land
   increasing carbon dioxide.                                                 and land use.
 • Rising carbon dioxide will result in a reduction in overall            •   Support assessments of the benefits and costs of
   pasture quality (lower protein and lower digestibility)                    diversifying property enterprises.
   (Stokes et al 2011).                                                   •   Introduce pasture legumes to improve nitrogen status.
 More intense storms
 •   Rainfall intensity is expected to increase as temperature and        •   Maintain pasture cover for optimal infiltration of rainfall.
     moisture content of the atmosphere increase.                         •   Adjust livestock numbers to maintain good coverage of
 •   A 1°C increase in temperature may result in an increase in               perennial pastures during the storm season.
     rainfall intensity of 3-10% (SAG 2010).
 •   More intense storms are likely to increase runoff, reduce
     infiltration, reduce soil moisture levels and pasture growth,
     and increase the risk of soil erosion.
 Higher temperature humidity index (combination of maximum temperature and dewpoint temperature)
 •   Temperature humidity index (THI) is an indicator of heat             •   Select cattle lines with effective thermoregulatory controls,
     stress. Heat stress in beef cattle is significant at a THI of over       efficient feed conversion and lighter coat colour (Finch et al.
     80. Frequency of days per year above this level is shown in              1984, King 1983).
     Figure 3 for historical and projected climate. Rising
     temperature by 2.7°C increases the occurrence of heat
     stress by about 30% points (Howden et al. 1999).
 •   Heat stress reduces liveweight gain and reproductive
     performance in beef cattle, and increases mortality rates
     (see Howden et al. 1999).
 •   Heat stress reduces the development of secondary wool
     follicles in sheep, reducing lifetime wool production in
     sheep (Hopkins et al. 1978).

     a)                                                                       b)

Figure 3: Frequency of days per year that the THI>80 for a) 1957-97 and b) a future climate scenario of +2.7°C. Thermal stress is
significant in beef cattle when the THI exceeds 80 (Source: Howden et al. 1999).

Page 10
Climate Impact and Adaptation Series
Dairy Industry
In 2014-15 the Queensland dairy industry had a herd of about 168,000 dairy cattle of which 91,000 are cows in milk (ABS 2016b).
The Queensland dairy industry produced 411 million litres of milk from 448 farms, which was 4.2% of Australia’s milk production
(Dairy Australia 2015). In 2014-15 SEQ produced nearly 21% of the value of Queensland’s whole milk ($236 M, ABS 2016a).
Much of the information below on the impacts of a changing climate for the dairy industry is drawn from Dairy Australia (2011).
Opportunities for the Dairy Industry Case Study - The effects of increased temperature on
• Increased plant photosynthesis and associated increased dairy cows.
production with increases in carbon dioxide. Cows have the ability to off-load heat; however, prolonged
• Increased pasture growth during cooler months due to periods of heat, particularly above 25°C, may lead to heat
increased minimum temperatures and less frosts. stress. Heat stress reduces the cows’ ability to produce milk and
get in calf. There may also be health and welfare problems.
• Lower water availability will favour short rotation pasture
systems. Management and adaptation tools to minimise the risk of
heat stress include increased provisions of shade, active
cooling sprays and breed selection.
Likely Impacts Potential Strategies for Adaptation
Increased temperatures
• Rising temperatures may cause an increase in the incidence • Provide more cooling mechanisms for dairy cows e.g. shade
of heat stress to dairy cows. Impacts include reduced milk and active cooling sprays.
yield, reduced conception rates, and increased mortality • Selectively breed stock, pasture and feedstock for their
rates. ability to withstand higher temperatures.
• Lower pasture growth and quality. • Switch to pasture species that will adapt to changing
• Higher temperatures may make C4 pasture species more conditions.
competitive at the expense of nutritious C3 species, how- • Sow pastures earlier to match warmer conditions.
ever higher carbon dioxide is expected to favour C3 species
• Use nitrogen fertiliser during winter months.
more than C4.
• Use short rotation pasture systems and winter fodder crops.
• Water and irrigation requirements may be increased with
higher temperatures.
Decreased rainfall
• There may be associated lower runoff and reduced soil • Decrease evaporation rates in water storage and in the soil.
moisture. • Install more efficient irrigation systems and improve
• Less water will be available causing more competition for water use efficiency.
water. • Change feed system.
• Apply more emphasis to crops.
• Lower growth of rain-fed pastures and crops.
• Switch to pasture species that will adapt to changing
conditions.
More intense and frequent storms with increased seasonal variability
• Livestock could be injured by more intense storms and hail, • Use summer housing for dairy cows.
particularly in intensive production systems where animals • Develop and implement a risk management plan when long
are concentrated. range weather forecasts indicate a higher than average
• Extreme wet seasons can negatively impact milk production, probability for either a wet or dry season ahead.
herd health and property infrastructure.
© Ray Cash Photography. Courtesy of Department of State Development Infrastructure and Planning
Page 11Cropping Industry
Broadacre cropping in Queensland produces a range of cereal, oilseed and legume crops, including wheat, maize, barley, sorghum,
chickpea, mungbean, soybean, sunflowers and peanuts (QFF 2012). In Queensland the most commonly grown winter crop is wheat
(1 M tonnes in 2014-15, ABS 2016b) and summer crop is sorghum (1.6 M tonnes in 2009-10, ABS 2016b). In 2014-15 the value of
broadacre crops, excluding crops harvested for hay, cotton and sugar was $1.1 B (ABS 2016a) in Queensland and $6 M in SEQ (ABS
2016a). In 2014-15 the value of pasture and cereal crops cut for hay was $40 M in SEQ (ABS 2016a)
Much of the information below on the impacts and opportunities of a changing climate on the cropping industry are drawn from
Taylor et al. (2015b) and Stokes and Howden (2010) and references therein.
Opportunities for the Cropping Industry
• Increased carbon dioxide may result in higher crop yields and biomass due to increased carbon dioxide fertilisation and
photosynthesis.
• C3 plants (cereal grain crops like wheat) respond better to increased carbon dioxide than C4 plants (tropical-origin crops
such as sugar cane and maize).
• The effect of increased temperature may, however, have the opposite effect due to increased water stress. Therefore, the
net results remain uncertain (NCCARF 2011b).
• In cooler months, increased temperatures may reduce frost risk.
Likely Impacts Potential Strategies for Adaptation
Increased temperatures and carbon dioxide concentration
• Rising carbon dioxide may increase biomass production and • Adjust planting times of summer crops (e.g. mung beans,
grain yields which will in turn reduce both the average sunflower and maize) so that they are not flowering during
nitrogen level of grain and the frequency of achieving key the hottest months.
nitrogen thresholds. • To maintain grain nitrogen content at historical levels, there
• Warmer temperatures and increased rainfall are likely to will be a need to increase fertiliser application rates by up
favour the slower-maturing cultivars (greater thermal time to 50% depending on the yield expectations. Therefore,
requirements) that could benefit from an earlier date of increase nitrogenous fertiliser application or increase use
flowering and a longer period of photosynthesis (with of pasture legume rotations may be needed to maintain
adequate moisture). grain yields and protein content.
• Heat stress during the summer months is likely to cause • Increase application rates of other crop nutrients (e.g. P, K).
poor seed set in summer grain crops, such as mung bean,
sunflower and maize because higher temperatures lead to
earlier flowering crops and poor pollination.
• Heat stress during spring may decrease yield of winter crops
(e.g. wheat).
• Warmer temperatures in spring may allow earlier planting of
summer crops with lower frost risk.
• Decreased frost incidence may benefit winter crops because
of less chance of frost at flowering, however, this will be
complicated by the fact that they will flower earlier.
Changed rainfall patterns and increased storm frequency
• Increased risk of storm damage and erosion. • Optimise availability of all resources (e.g. through precision
• Increased occurrence of some pests and diseases. agriculture).
• Heavy rainfall can increase leaching of nutrients and • Adopt efficient irrigation technology to control water table,
movement of salts, although total rainfall is likely to monitor water table position and improve catchment
decline. vegetation distribution and ground cover to increase
infiltration rate.
• Decreased yields as a result of increased crop water stress.
• Apply fungicides to wheat crops to decrease leaf disease
(Meinke and Hochman 2000 in Stokes and Howden 2010).
• Reduce soil moisture loss by:
ο increasing residue cover by minimal or no-tillage;
ο establishing crop cover in high loss periods;
ο weed control; and
ο maximising capture and storage of excess rainfall on-farm.
• Establish a higher percentage of summer crops relative to
winter crops as rainfall changes point towards the largest
decreases being in winter and spring.
• In mixed farming systems, where cropping is marginal and
may become more so, consider incorporating a greater pro-
portion of livestock into the farm business for profitability.
Page 12Climate Impact and Adaptation Series
Likely Impacts Potential Strategies for Adaptation
Increased temperatures and decreased rainfall
• Warmer temperatures and a significant decrease in rainfall • Incorporate ‘best practice’ farm management by constantly
are likely to favour winter crop varieties (e.g. wheat and varying crops and inputs based on the availability of limited
barley) with earlier-flowering characteristics which allow and variable resources and signals from the operating en-
grainfill to occur in the cooler, wetter parts of the year in vironment (Rodriguez et al. 2011a, Rodriguez et al. 2011b).
dry areas. Varieties with characteristics such as higher • Use varieties that incorporate the traits of appropriate
response to elevated carbon dioxide conditions, rapid thermal time (degree days) and vernalisation (exposure to
germination, early vigour and increased grain set in hot/ cold temperatures required for flowering) requirements and
windy conditions may also be favoured. with increased resistance to heat shock and drought.
• Increased temperatures and evaporation may reduce the • Diversify the farm enterprise (e.g. using opportunistic
yield of dryland crops like wheat and sorghum (Potgieter et planting).
al. 2004); however, this may be offset by increased carbon
• Increase the use of legume-based pastures and leguminous
dioxide.
crops or further increase nitrogen fertiliser application to
• Irrigated crops may be adversely affected due to a reduction maintain grain quality, especially protein content.
in supply of irrigation water.
• Adjust planting times to cater for changes in crop maturity
• There will be more pressure and challenges for managing and the duration and timing of heatwaves.
groundcover, crop choice (winter or summer), soil nutrient
• Adopt efficient irrigation technology.
requirements, pest and weed control, soil carbon etc.,
especially from higher temperature, increased soil • Increase use of supplementary water.
moisture stress and higher rainfall variability. • Optimise irrigation scheduling.
• Lower rainfall may reduce deep drainage in dryland • Use more effective irrigation water delivery technologies
cropping systems. (i.e. trickle tape).
• In general, in the SEQ region, areas currently suitable for • Construct on-farm water storage facilities.
cropping are predicted to remain suitable, with the highest • Use drought-tolerant or more water efficient varieties.
suitability remaining the central SEQ (Hosking et al. 2014).
• Modify row spacing.
• Minimise tillage.
• Use cover crops.
• Manage water resources and improve efficiency of irrigation
systems.
• Integrate cropping into regions of higher rainfall.
• Make crop planting decisions based on seasonal climate
forecasting, soil tests and other climate related information
obtained from tools such as Rainman, Whopper Cropper
and APSIM.
• Use adaptive crop management techniques such as:
ο zero-tillage practices, minimum disturbance planting
techniques (e.g. seed pushing);
ο controlled traffic;
ο responding to planting opportunities when they occur; ο
widening row spacing or skip-row planting;
ο lowering plant populations;
ο using efficient on-farm irrigation management with
effective scheduling, application and transfer systems; and
ο assessing fertiliser inputs.
• Reduce surface soil erosion by:
ο increasing residue retention;
ο maintaining erosion control infrastructure (e.g. contour
banking); and
ο using controlled traffic systems.
• Control pests and diseases.
Farm Crops, Boonah, Queensland Courtesy of Tourism Queensland
Page 13Horticulture Industry
Horticulture is Queensland’s second largest primary industry (QFF 2012). Queensland grows approximately one third of Australia’s
horticulture produce, with more than 120 different types of fruit and vegetables being grown in 16 defined regions covering a total
area of 100,000 hectares and 2800 farms (QFF 2012, HAL 2012). In 2014-15 the value of production for Queensland was about $2.5
B which was made up of $1 B for vegetables, $1.2 B for fruit and nuts and $290 M for nurseries, cut flowers and turf (ABS 2016a).
In 2014-15 SEQ produced about 27% of the total value of the state’s horticulture, including 35% of the value of vegetables, 14% of
the value of fruit and nuts, and 49% of the value of nurseries, cut flowers and turf (ABS 2016a). The region is a major producer of
Queensland’s pineapples, strawberries and a variety of vegetables (HAL 2012).
Much of the information below on the impacts and opportunities of a changing climate for the horticulture industry is drawn Taylor
et al. (2015c) and from reports commissioned for the Garnaut Review (Deuter 2008).
Opportunities for the Horticulture Industry Case Study – Adaptable Cultivars
• Increased minimum temperature, reduced frost frequency More adaptable cultivars for lettuce and brassica are needed as
and shortened frost period during the growing season may the winter season (mid-April to October) will be shortened by
increase the area climatically suitable to optimum growth of 2030 (Deuter 2008). In the case of iceberg lettuce, about two
frost sensitive sub-tropical crops such as avocado. weeks before harvest the heart starts developing but mean
• Vegetable growers producing summer crops in temperate maximum temperatures above 28°C will produce soft hearts
regions will have the additional option of planting earlier, and reduce quality. The climate projections for 2030 suggest
and later, therefore extending the production season. that mean maximum temperatures in the Lockyer Valley are
expected to exceed 28°C from early October to mid-April,
• Increased runoff (from higher intensity rainfall events) may
which is likely to shorten the lettuce season by 3-4 weeks.
provide opportunities for growers to capture more water
for irrigation.
Likely Impacts Potential Strategies for Adaptation
Increased temperatures
• Changes to the suitability and adaptability of some crops. • Select for, or change to, cultivars which are more adaptable
• Potential shift in the optimum growing regions from the to a changing and variable climate.
current hotter producing areas towards areas currently re- • Select and review growing site/location to avoid unsuitable
garded as too cool. Avocado production in SEQ will shift and climate factors through identifying threshold temperatures
contract eastwards and southwards (Hosking et al. 2014). or other climate conditions for crops.
• Change the timing and reliability of plant growth, flowering, • Choose optimal timing of planting.
fruit growth, fruit setting, ripening and product quality; fruit • Use chemical treatments such as hydrogen cyanamide to
size, quality and pollination. induce bud break to manage the variable and non-uniform
• Change harvesting times for different areas. budburst and to protract full bloom of pip, stone fruit and
• Reduce the time to reach maturity (earlier in the season). nut trees if dormancy is affected.
• Change the occurrence and distribution patterns of fruit fly, • Start breeding programs for heat tolerant, low chill, and
Helicoverpa and diamond back moth. more adaptable varieties of various horticultural crops.
Varieties with higher quality under enhanced carbon
• Potentially downgrading product quality.
dioxide and elevated temperatures will need to be
• Result in pollination failures. evaluated then considered in breeding programs.
• Increase active soil-borne diseases and insect infestation for • Apply the latest research results and best management
longer periods during the year. techniques to maintain product quality.
• May cause fruit yellowing of tomatoes, and affect the • Use crop protection treatments including solar radiation
post-harvest processing for some crops such as beans, mel- shading and evaporative cooling through overhead
ons and strawberries that are required to be cooled quickly. irrigation to maintain fruit quality.
• May induce fruit abscission in citrus during the bloom or • Use tools/models associated with managing climate
early fruit set period. variability to improve both quality and quantity of
• Potential influence on fruit quality and pollination of some horticulture products.
sub-tropical crops e.g. avocado. • Plant varieties with chilling requirements below 1000 hours.
• Reduced diurnal temperature range will potentially reduce
the overlap between open stages of male and female flower
parts thus decreasing the chances for pollination and
resulting in more pollination failures, fruit drop and
sunburn to fruit.
• Increased minimum temperatures and reduced occurrence
of frost may benefit the growth of pineapples and
negatively impact vegetable growers in tropical and sub-
tropical regions producing winter crops as the winter
production season will be shortened.
• Changes in disease and pest distribution ranges.
Page 14Climate Impact and Adaptation Series
Likely Impacts Potential Strategies for Adaptation
Changed rainfall patterns
• Increased risk to crops reliant on irrigation where irrigation • Adopt more efficient irrigation monitoring and scheduling
water availability is reduced especially during dry periods. technologies which provide further water-use efficiencies.
• Changes to the reliability of irrigation supplies, through • Apply the latest research results and best management
impacts on recharge to surface and groundwater storages. techniques to maintain product quality, including fertiliser
timing and amounts according to crop requirements.
• Use tools/models associated with managing climate
variability to improve both quality and quantity of
horticulture products.
More intense storms
• Increased runoff may provide opportunities for growers to • Improve Integrated Pest and Disease Management practices
capture more water for irrigation. to adapt to a changing climate and encourage disease
• Lead to conditions favouring foliar diseases and some root suppressive soil techniques.
invading fungi, for example, the fungus Phytophthora • Improve on-farm water storage linked to drainage and
cinnamomi, which affects avocado. water harvesting systems.
• Improve sediment runoff protection via grassed waterways
• Increase the likelihood of damage and waterlogging, de-
and erosion control structures.
creasing quality and production.
• Improve plant nutrition management.
• Affect the timing of cultural practices and ability to harvest, • Improve all-weather access to cropping areas.
as well as negative effects on yield and product quality.
• Increase the risk of the spread and proliferation of soil borne
diseases; soil erosion and off-farm effects of nutrients and
pesticides; affected water quality and impacts on other
ecosystems.
Mushrooms, Eumundi Markets, Queensland Courtesy of Tourism Queensland
Sugar Industry
Australian sugarcane is grown in Queensland and northern New South Wales and the industry consists of 4000 cane farming
businesses, 24 mills and six bulk storage ports (Canegrowers 2011). Ninety-five percent of Australian sugarcane is grown in
Queensland and 85% is exported (QLDDAFF 2010). In 2014-15, 30 M tonne of cane was produced in Queensland (ABS 2016b)
with a value of $1.2 B of which $10 M was produced in SEQ (ABS 2016a).
Much of the information below on the impacts of a changing climate on the sugar industry is drawn from Stokes and Howden
(2010) and references therein.
Opportunities for the Sugar Industry Case Study – The delayed impact of the 2010 (extremely) wet
• Increased temperatures and carbon dioxide are likely to season on sugarcane
lead to accelerated crop development, increased yield and In September 2011, canefarmers were starting to feel the full
an extended growing season. impact of the 2010 wet season. The 2010 wet conditions meant
that a large amount of cane was unable to be crushed and was
left in the field as standover. As a result, the overall tonnage for
2011 was 23 M tonnes, about 10 M tonnes less than average.
Page 15Likely Impacts Potential Strategies for Adaptation
Increase in atmospheric carbon dioxide
• Increased growth of stalk and total biomass. • Optimise supply of all necessary resources to the crop.
• Increased competitiveness from C3 weeds (e.g. temperate • Use bio-control agents, cultural practices and expert sys-
grasses). tems for improved weed and crop management.
• Increased growth of vegetative plant parts (i.e. increased • Adopt or breed suitable varieties with characteristics of
volume of trash). high-partitioning sucrose.
• Higher carbon to nitrogen ratio of leaves. • Adopt the integrated pest management system.
Increased temperatures
• Yields may decrease as a result of increased heat and • Lengthen the period of harvest time to increase yield, or
evaporation, stomatal closure and leaf damage. grow additional fallow or cash crops.
However, increased carbon dioxide may override these • Reduce excessive biomass accumulation by planting later
effects. and emphasising erect growth habit in breeding and variety
• Sucrose content may decrease as a result of higher selection.
temperatures during the harvest season. • Use varieties with greater tolerance to higher temperatures.
• Incidence of pests and diseases may increase through better • Optimise supply of all necessary resources.
survival of populations during winter periods, the spread of
• Alter the duration of the harvest season to coincide with
exotic populations into wider climatic windows and altered
cooler temperatures.
ecological interactions with natural enemies.
• Use adapted varieties and management practices, i.e.
• Increased carbon decomposition and soil nitrogen
irrigation scheduling in favour of sucrose accumulation
mineralisation.
and use ripeners to better manage sugar accumulation.
• Increased crop energy diverted into producing trash and
• Change cultural practices to reduce pests and disease (e.g.
fibre.
use legume crops to break soil pest and disease cycles) and
• Limits to crop growth in frost-prone areas in the western reduce vegetative growth (e.g. reduce water use from
districts. irrigation).
• Change insecticides, fungal and bacterial bio-pesticides.
• Use varieties with improved resistance to pests and
diseases.
• Use integrated pest management.
• Use decision support software.
• Revise quarantine boundaries.
• Consider implementing pest strategies presently used by
more northerly regions.
• Review soil carbon and nitrogen management practices.
• Use precision agriculture and legume crops to boost soil
organic carbon and nitrogen stores.
• Use varieties with low vegetative growth habits and stalk
fibre content.
Changes in rainfall
• Limited supply of irrigation water. • Optimise availability of all resources (possibly through
• Reduced soil anaerobic conditions and nutrient loss through precision agriculture).
less leaching and erosion. • Adopt efficient irrigation technology to control water table
• Increased commercial cane sugar through more effective and monitor water table position.
drying-off period. • Adopt efficient irrigation technology.
• Increased traffic-ability for harvest machinery and the • Increase use of supplementary water.
timeliness of operating. • Optimise irrigation scheduling.
• Poor crop establishment. • Use more effective irrigation water delivery technologies
• Decreased yields as a result of increased crop water stress. (i.e. trickle tape).
• Reduced quality of supplementary water. • Construct on-farm water storage.
• Reduced rate of early leaf area and canopy development. • Use drought-tolerant or more water efficient varieties.
• Reduced photosynthesis, tillering and stalk length. • Modify row spacing.
• Minimise tillage.
• Use cover crops.
• Improve catchment vegetation distribution and ground
cover to increase infiltration rate.
Page 16Climate Impact and Adaptation Series
Likely Impacts Potential Strategies for Adaptation
More intense storms, increases in rainfall intensity and rising sea levels
• Increased physical damage to crops and infrastructure. • Plant trees around the paddock to act as a windbreak.
• Increased soil erosion and nutrients and sediment load to • Use harvesting machinery suitable for harvesting a lodged
the Great Barrier Reef. crop.
• Decreased yield through reduced infiltration of rainfall into • Use varieties with reduced propensity to lodging and adopt
the soil. cultural practices to reduce lodging (e.g. hilling up).
• Increased flooding, land degradation and damage to • Diversify crops with a shorter duration.
infrastructure. • Utilise insurance and reinsurance options to offset risk.
• Exacerbation of storm and cyclone damage. • Use trash blanketing to intercept rainfall, inhibit lateral
• Increased intrusion of saltwater into coastal aquifers. movement of water, reduce evaporation, improve soil struc-
ture and water infiltration, and increase soil carbon stores.
• Use conservation tillage to reduce soil compaction.
• Alter row configurations.
• Use drainage ditches and laser levelling to control localised
flooding and retain surface water, nutrients and sediment.
• Increase use of precision farming and adopt conservation
tillage methods.
• Construct man-made seawater defences.
• Restrict groundwater pumping.
• Abandon bores already impacted by saltwater intrusion.
• Monitor water quality in aquifers.
• Investigate new regions to plant sugarcane.
Fish Stall at Morgans Seafood, Scarborough, Queensland Courtesy of Tourism Queensland
Fishing Industry
The majority of Queensland Fisheries extend the entire length of the east coast, with a few fisheries also located in the Gulf of
Carpentaria. The highest value Queensland fishery, the East Coast Otter Trawl Fishery, targets nine prawn species, two bug
species, two lobster species, two crab species and a variety of other crustaceans, plus several species of molluscs and fish
(Fisheries Queensland 2016). In the 2014 season, the total harvest for this fishery (including recreational, indigenous and
charter fishing) was 6,681 tonnes with a gross value of production (GVP) of $86 M. The next highest value fisheries are three line
fisheries which cover the entire Queensland coast line, including the Gulf of Carpentaria. These fisheries target a variety of fish
species and have an approximate total harvest of 6,300 tonnes and GVP of $38 M.
Much of the information below on the impacts of a changing climate on the fishing industry is drawn from Holbrook and Johnson
(2014), Hobday et al. (2008), Johnson and Marshall (2007), and NCCARF (2011c).
Opportunities for the Fishing Industry Case Study – Climate effects on Prawns in Southern
• Increased nutrient influx, multiple spawning events and Queensland
participation in fishing. The catch rates of Banana Prawns and Greasyback Prawns in
• Increased abundance and catch rates of some target prawn Moreton Bay increase as freshwater flow increases, especially
and bug species due to possible biomass and growth from the Brisbane River. Higher temperatures also influence
increases with rising temperatures. the abundance of prawns: as temperatures increase, the trop-
ical species, Banana Prawn increase, whereas the temperate
Eastern King Prawn decreases. (Courtney et al. 2012).
Page 17You can also read