DELTA ADAPTS: CREATING A CLIMATE RESILIENT FUTURE - TECHNICAL MEMORANDUM - Delta Stewardship Council
←
→
Page content transcription
If your browser does not render page correctly, please read the page content below
Delta Stewardship Council
                     A CALIFORNIA STATE AGENCY

DELTA ADAPTS: CREATING A CLIMATE
        RESILIENT FUTURE
           TECHNICAL MEMORANDUM
   CROP YIELD AND AGRICULTURAL PRODUCTION
                 MAY 2021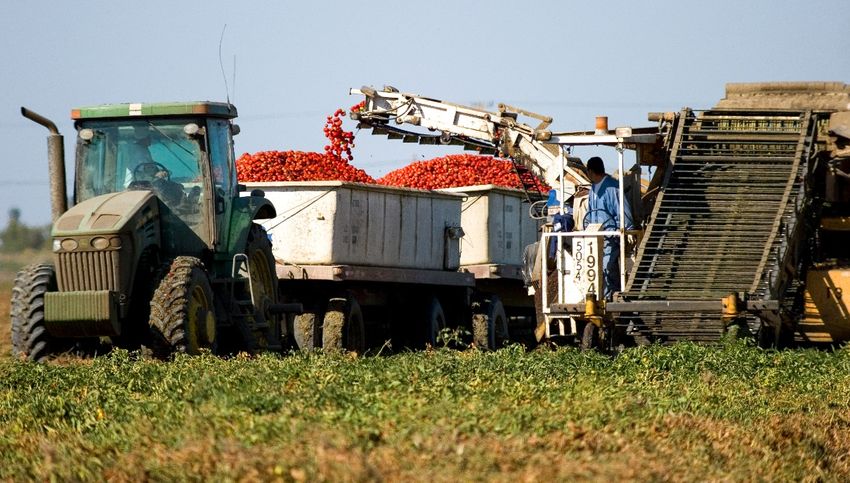
DELTA STEWARDSHIP COUNCIL
             A California State Agency

TABLE OF CONTENTS
CHAPTER 1.        Background ........................................................................................... 1-1
     1.1          Overview ................................................................................................................. 1-1
     1.2          Delta Agriculture: Setting and Ongoing Challenges ............................................... 1-2
     1.3          Planning and Regulatory Setting ............................................................................ 1-5
CHAPTER 2.        Biophysical Impacts to Crop Yields .................................................... 2-1
     2.1          Climate Change Science and Agriculture ............................................................... 2-1
     2.2          Projected Climate Change Impacts to Delta Crops ................................................ 2-2
                  2.2.1 Air Temperature ......................................................................................... 2-2
                  2.2.2 Precipitation Patterns and Sea Level Rise .................................................. 2-6
                  2.2.3 Frequency of Extreme Events .................................................................. 2-10
       2.3        Secondary Stressors .............................................................................................. 2-11
                  2.3.1 Atmospheric Carbon Dioxide Concentration ........................................... 2-11
                  2.3.2 Pests, Weeds, and Disease ....................................................................... 2-11
                  2.3.3 Impacts to Animal Pollinators .................................................................. 2-12
CHAPTER 3.        Agro-Social Vulnerability ..................................................................... 3-1
     3.1          Decision-making: Balancing Economic and Climate Change Threats .................... 3-1
     3.2          Risk-mitigating Structures and Institutional Incentives ......................................... 3-2
     3.3          Impacts of Climate Change on Agricultural Employment in the Delta .................. 3-3
     3.4          Health and Safety Impacts to Agricultural Laborers .............................................. 3-5
CHAPTER 4.        Key Findings ......................................................................................... 4-2
     4.1          Impacts on Crop Yields ........................................................................................... 4-2
     4.2          Governance, Policy, and Social Vulnerability ......................................................... 4-2
CHAPTER 5.        Knowledge Gaps ................................................................................... 5-1
     5.1          Data and Knowledge Gaps...................................................................................... 5-1
     5.2          Science, Policy, and Management Questions ........................................................ 5-1
CHAPTER 6.        References ............................................................................................ 6-2

May 2021                                                                                                                                       i
Delta Adapts: Crop Yield and Agricultural Production Technical Memorandum
Contents
LIST OF FIGURES
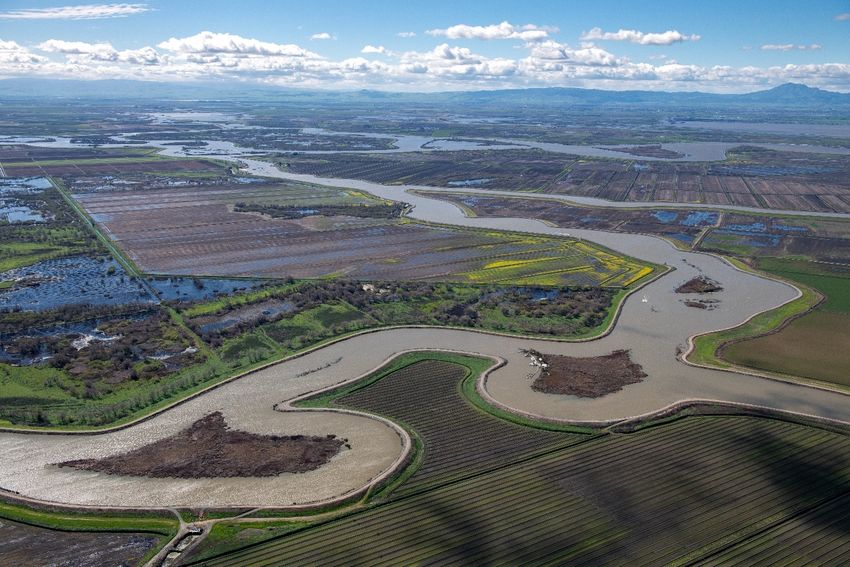
Figure 1: Agriculture in the Context of the Delta ........................................................................... 1-3
Figure 2: Farmland in the Suisun Marsh area ................................................................................. 2-4
Figure 3: Delta crop yield impacts under climate change, based on predictive modeling
for temperature change in the greater Central Valley....................................................... 2-6
Figure 4: Outdoor agricultural workers will be impacted by climate change ................................ 3-5
LIST OF TABLES
Table 1: Land use and soil categories in the Delta ......................................................................... 1-4
Table 2: Delta crop yield impacts under climate change, based on predictive modeling for
temperature change in the greater Central Valley. ........................................................... 2-5
ii May 2021DELTA STEWARDSHIP COUNCIL
A California State Agency
CHAPTER 1. BACKGROUND
1.1 Overview
Climate change presents a great risk to global food security (IPCC 2019). California agriculture,
which produces much of the vegetables, fruits, and nuts in the United States (Pathak et al. 2018)
and is a significant part of California’s economy, is also at risk from climate change. Recent
climate change syntheses and vulnerability assessments for California highlight that statewide
agricultural diversity and productivity will be broadly impacted by climate change. The most
substantial changes include shifts in the timing and volume of water flow in winter, warmer and
longer summers, fewer winter chill hours, decreased soil moisture and increased soil salinity,
increased frequency and intensity of extreme events (flood events, multiyear droughts), and
increased atmospheric carbon availability (Houlton et al. 2018, Medellín-Azuara et al. 2018).
Climate change threats more unique to agriculture in the Sacramento–San Joaquin Delta and
Suisun Marsh (hereafter, the Delta) also include sea level rise and salinity intrusion, which will
challenge the usability of irrigation water, reduce arability, and increase flood risk to subsided
Delta islands (Dettinger et al. 2016, Deverel et al. 2015, Council 2018, Medellín-Azuara et al.
2014). California statewide vulnerability assessments and scientific research suggest that climate
change will affect the yields of predominant Delta crops, with some perennial crops experiencing
significant yield decline (e.g., almonds and cherries; Lobell et al. 2006, Pathak et al. 2018).
Additionally, the Delta Protection Commission recently completed a regional synthesis of climate
change-induced biophysical impacts on crop production and crop suitability (Fairbanks et al.
2019). The Delta Stewardship Council’s climate change initiative, called Delta Adapts: Creating a
Climate Resilient Future will quantify the amount of agricultural land by crops that are
anticipated to be flooded under various climate change scenarios, and the cost of flooded
agricultural land on the regional economy in the vulnerability assessment prepared under
separate cover. This Crop Yield and Agricultural Production Technical Memorandum (TM)
summarizes potential biophysical impacts of climate change to crop production and suitability
and discusses agro-social and agro-economic considerations particular to the Delta.
While projecting climate is not without challenge, projecting social and economic vulnerabilities
to changing conditions can be even harder. This becomes more evident in agriculture, where
decisions are often made on shorter-term scales, and social and market factors may have a
stronger influence than long-range climate projections. Nonetheless, climate changes and their
indirect effects will likely increase crop production vulnerability.
May 2021 1-1Delta Adapts: Crop Yield and Agricultural Production Technical Memorandum
Chapter 1. Background
1.2 Delta Agriculture: Setting and Ongoing Challenges
Agriculture is the dominant land use in and cultural backbone of the Delta, driving the local
economy and surrounding communities, and providing most of the employment in the Primary
Zone (Medellín-Azuara et al. 2012). Agriculture adds great cultural value for Delta residents,
farmers, and visitors, a value that often spans generations. Beginning in the 1850s, the Delta’s
islands were reclaimed from tidal marshes for agricultural development, and the Delta rapidly
became California’s first developed agricultural region. The Delta—and Suisun Marsh, to a lesser
degree—was and continues to be suitable for farming because of its high-quality soils, nearby
water supply through its channels, and a moderate Mediterranean climate mediated by
proximity to the Pacific Ocean. Although California’s climate is characterized by frequent
extremes (Swain et al. 2018) and vulnerable to multiyear droughts, the Delta has typically mild,
wet winters and hot, dry summers combined with the fertile soils from former wetlands. With
these factors combined, most of the Delta is considered Prime Farmland, and a significant
remainder of the land is termed Farmland of Statewide Importance, or Farmland of Local
Importance (Table 1, DOC 2016).
Delta agriculture covers most of the Delta landscape and provides food for local and state
markets. Dozens of crops are currently grown in the Delta, covering approximately 55 percent of
its land (about 415,000 out of 800,000 acres, DPC 2020). In 2016, about 50 percent of the Delta
was dominated by alfalfa, corn, and pasture, but the region is also a prominent source of
specialty crops: wine grapes, truck crops (processing tomatoes and squashes), wheat, tree nuts
and fruits, and rice (DPC 2020). Some Delta farmers are turning to carbon market farming with
crops such as rice or managed wetlands (Deverel et al. 2017). While still a distinct minority, the
Delta currently supports about 7,500 acres of rice and 1,600 acres of carbon-farming managed
wetland (Pitzer 2020). Higher-value permanent crops, such as vineyards and orchards, are
increasingly covering more acreage in the Delta, replacing annual crops (DPC 2020). The pace is
extreme for some crops; from 2009 to 2016 almonds increased acreage by 400 percent, walnuts
82 percent, and wine grapes by 38 percent. In the same period, corn (-22 percent), oats (-57
percent), and asparagus (-73 percent) are among the declining crops by acreage (DPC 2020).
Climate change impacts should be of special concern to farmers when investing in crops that
require years to become viable and may also become subject to yield loss due to climate or
water quality.
Land subsidence, flood risk, irrigation and drainage, and pumping costs, are unique challenges to
Delta farming that may be exacerbated by a changing climate. Oxidation of peat soil, wind
erosion, and use of heavy equipment has caused significant land subsidence (up to 25 feet on
some islands), which increases pressure on levees in a system already vulnerable to winter and
spring flooding. In addition to affecting levee integrity, subsidence also leads to under-levee
water seepage and waterlogged soils, requiring farmers to regularly pump water off islands
(Water Education Foundation 2014). Droughts do not generally impact surface water levels in
tidally influenced parts of the Delta, but loss of channel capacity due to sedimentation coupled
with severe multiyear droughts can decrease water depths in some parts of the Delta. Loss of
channel capacity can affect access to irrigation water, raising costs for some farmers who must
adjust their intakes and/or pump water onto islands instead of relying on passive water
1-2 May 2021DELTA STEWARDSHIP COUNCIL
A California State Agency
transportation. Further, reduced channel depth promotes invasive weeds, reduces dissolved
oxygen, and increases the extent and duration of harmful algae blooms. The State and Federal
Water Projects (water conveyance systems that transfer water from the Delta to other service
areas in California) are required to release water to prevent intrusion of saline water eastward
into the Delta. However, decreased freshwater flows during severe droughts can allow salinity
intrusion further east, which can harm crops with low tolerance for salinity (Maas and Grattan
1999). Emerging regulatory prescriptions include increased flows from the watershed through
the Delta, which could substitute for some currently required Project reservoir releases,
however, decreasing the risk for salinity intrusion under current hydrological and sea level
conditions. All these challenges will interact and potentially compound with the changing climate
and affect climate vulnerability for Delta agriculture.
Figure 1: Agriculture in the Context of the Delta
May 2021 1-3Delta Adapts: Crop Yield and Agricultural Production Technical Memorandum
Chapter 1. Background
Table 1: Land use and soil categories in the Delta
Land Use and Soil Acres Percentage
Definition
Categories (2016) of total
Best quality farmland for sustained high
Prime Farmland 377,613 45.0%
yields
Farmland of Statewide Similar to prime farmland, but with minor
32,182 3.8%
Importance shortcomings
Farmland of Local
Land of importance to the local economy 52,492 6.2%
Importance
Farmland of lesser quality soils used to
Unique Farmland 25,236 3.0%
produce the state's leading crops
Farmland of Local Land that if cultivated, would contribute to
2,300 0.3%
Potential the local economy
Land on which the existing vegetation is
Grazing Land 59,626 7.1%
suited for grazing
Confined Animal Lands that include poultry facilities,
1,292 0.2%
Agriculture feedlots, dairy facilities, and fish farms
Residential areas of one to five structures
Rural Residential Land 1,776 0.2%
per 10 acres
Includes farmsteads, non-cultivation
Semi-Agricultural and
agricultural or equine structures, unpaved 2,331 0.3%
Rural Commercial Land
parking areas, and campgrounds
Developed land with a building density of at
Urban and Built-Up Land 79,130 9.4%
least one unit per 1.5 acres
Channelized canals and open field areas
Vacant or Disturbed that are used for various industrial or 3,693 0.4%
recreational activities
Nonagricultural and Natural vegetation communities, managed
16,450 2.0%
Natural Vegetation wetlands, and small water bodies
Perennial water bodies with an extent of at
Water 82,530 9.8%
least 40 acres
Land not included in any other mapping
Other Land 103,284 12.3%
category
Source: Adapted from California Department of Conservation’s Farmland Mapping and
Monitoring Program, DOC 2016. The first four categories (totaling 487,523 acres) have the
highest soil ratings and current land use and are thus the highest valued categories.
1-4 May 2021DELTA STEWARDSHIP COUNCIL
A California State Agency
1.3 Planning and Regulatory Setting
The Delta Adapts Initiative will address the Council’s legislative charge to achieve the coequal
goals for management of the Delta (Water Code section 85020), and “reduce risks to people,
property, and state interests in the Delta by effective emergency preparedness, appropriate land
uses, and investments in flood protection” (Wat. Code section 85020(g)) as these goals relate to
climate change impacts. "'Coequal goals' means the two goals of providing a more reliable water
supply for California and protecting, restoring, and enhancing the Delta ecosystem. The coequal
goals shall be achieved in a manner that protects and enhances the unique cultural, recreational,
natural resource, and agricultural values of the Delta as an evolving place." (CA Wat. section
85054).
The Delta Plan (Council 2013) contains a set of regulatory policies pertaining to agriculture:
G P1. Detailed Findings to Establish Consistency with the Delta Plan (23 Cal. Code of Regs.
section 5002)
(b) Certifications of consistency must include detailed findings that address each of
the following requirements:
(2). Covered actions not exempt from CEQA must include all applicable
feasible mitigation measures adopted and incorporated into the Delta Plan
as amended April 26, 2018 (unless the measure(s) are within the exclusive
jurisdiction of an agency other than the agency that files the certification
of consistency), or substitute mitigation measures that the agency that
files the certification of consistency finds are equally or more effective.
There are several mitigation measures protecting agriculture in the Delta Plan, including
requiring design of projects to minimize the loss of the highest valued agricultural land to the
greatest extent feasible, and mitigating the permanent conversion of farmland at a target ratio
of 1:1. These mitigation measures are required to be incorporated per Policy G P1(b)(2).
DP P1. Locate New Urban Development Wisely (23 Cal. Code of Regs. section 5010)
(a) New residential, commercial, and industrial development must be limited to
the following areas, as shown in Appendix 6 and Appendix 7:
(1) Areas that city or county general plans as of May 16, 2013, designate
for residential, commercial, and industrial development in cities or their
spheres of influence;
(2) Areas within Contra Costa County’s 2006 voter-approved urban limit
line, except no new residential, commercial, and industrial development
may occur on Bethel Island unless it is consistent with the Contra Costa
County general plan effective as of May 16, 2013;
(3) Areas within the Mountain House General Plan Community Boundary in
San Joaquin County; or
May 2021 1-5Delta Adapts: Crop Yield and Agricultural Production Technical Memorandum
Chapter 1. Background
(4) The unincorporated Delta towns of Clarksburg, Courtland, Hood, Locke,
Ryde, and Walnut Grove.
(b) Notwithstanding subsection (a), new residential, commercial, and industrial
development is permitted outside the areas described in subsection (a) if it is
consistent with the land uses designated in county general plans as of May 16,
2013, and is otherwise consistent with this Chapter.
(c) For purposes of Water Code section 85057.5(a)(3) and section 5001(j)(1)(E) of
this Chapter, this policy covers proposed actions that involve new residential,
commercial, and industrial development that is not located within the areas
described in subsection (a). In addition, this policy covers any such action on Bethel
Island that is inconsistent with the Contra Costa County general plan effective as
of May 16, 2013. This policy does not cover commercial recreational visitor-serving
uses or facilities for processing of local crops or that provide essential services to
local farms, which are otherwise consistent with this Chapter.
(d) This policy is not intended in any way to alter the concurrent authority of the
Delta Protection Commission to separately regulate development in the Delta’s
Primary Zone.
Policy DP P1 essentially limits urban development of residential, commercial, and industrial uses
to areas that were designated for such uses in adopted regulatory documents as of 2013, and as
a result, protects existing land designated for agricultural use.
DP P2. Respect Local Land Use When Siting Water or Flood Facilities or Restoring Habitats
(23 Cal. Code of Regs. section 5011)
(a) Water management facilities, ecosystem restoration, and flood management
infrastructure must be sited to avoid or reduce conflicts with existing uses or those
uses described or depicted in city and county general plans for their jurisdictions or
spheres of influence when feasible, considering comments from local agencies and
the Delta Protection Commission. Plans for ecosystem restoration must consider
sites on existing public lands, when feasible and consistent with a project’s
purpose, before privately owned sites are purchased. Measures to mitigate
conflicts with adjacent uses may include, but are not limited to, buffers to prevent
adverse effects on adjacent farmland.
Policy DP P2 protects agriculture by requiring that new water facilities, flood management
structures, and habitat restoration respect local land uses such as existing agricultural land and
operations.
In the time since the 2013 adoption of the Delta Plan, research on climate change has advanced
significantly and has implications for the Council as it seeks to achieve the coequal goals. Delta
Adapts provides critical support to the Council and interested stakeholders in improving the
understanding of climate change risks and potential adaptation strategies for the Delta region to
continue to protect agricultural use
1-6 May 2021DELTA STEWARDSHIP COUNCIL
A California State Agency
CHAPTER 2. BIOPHYSICAL IMPACTS TO
CROP YIELDS
2.1 Climate Change Science and Agriculture
Climate change is expected to intensify current climate variabilities and extremes in California,
including in the Delta (Dettinger et al. 2016). The biophysical component of agricultural
production will be most impacted by increases in annual temperatures, increases in winter
minimum temperatures, and exposure to extreme precipitation events– both floods and
droughts. The Council’s Climate Change and the Delta: A Synthesis provides a full review of
expected climate changes in the Delta (Council 2018). The economic impacts of arable land loss
to sea level rise, storm surge, and levee maintenance are discussed in the economics analysis
within the Vulnerability Assessment.
This Crop Yield and Agricultural Production TM synthesizes the potential changes that could
occur between 2030 to 2100 that are most impactful to agricultural performance and crop yield
outcomes including:
1. Changing air temperatures
Hotter and longer summers
Warmer winters and fewer chilling hours
2. Changing precipitation patterns and sea level rise
Watershed water supply and Delta irrigation water
Frequency and intensity of multiyear droughts, sea level rise, and impacts
to water quality
3. Increasing Extremes
• Increased frequency and intensity of extreme heat
• Increased frequency and intensity of extreme high precipitation and flood
risk
4. Indirect impacts and interactions
Carbon availability and CO2 fertilization
Pests, weeds, and diseases
Impacts to animal pollinators
May 2021 2-1Delta Adapts: Crop Yield and Agricultural Production Technical Memorandum
Chapter 2. Biophysical Impacts to Crop Yield
2.2 Projected Climate Change Impacts to Delta Crops
The climate change factors listed above will contribute to yield response in Delta crops. Crop
models are specific to a region and set of parameters. Models for the greater Sacramento and
San Joaquin river valleys are the closest approximation when studies particular to the Delta are
not available. However, Delta’s open water and San Francisco Bay influence result in relatively
mild climate changes compared to the rest of the Central Valley. Regional yield models based on
predicted changes across the Central Valley indicate that yield changes vary by crop, with losses
expected for crops that occupy over half of current acreages (Table 2 , Figure 3). Across the
state, changing water management and a less predictable water supply will drive yields (Jackson
et al. 2011, Medellín-Azuara et al. 2018), but extreme heat and flood events will also contribute
to yield losses, especially in the latter half of the century (Deschenes and Kolstad 2011, Pathak et
al. 2018). Rising air temperatures and changing precipitation patterns will increase physiological
stress, thereby increasing susceptibility to pests, disease, and weeds (Pathak et al. 2018). Despite
these risks, some studies suggest that abundant carbon dioxide supply may boost yields and
lessen some of the negative consequences of climate change, but these gains may not be
substantial (Blanc and Reilly 2017). These climate change–crop yield studies, summarized below,
were developed for crops statewide but can apply to crop vulnerability in the Delta.
2.2.1 Air Temperature
Agricultural processes in the Delta are optimized with irrigation through California’s variable
rainfall and hot summers but may not withstand climate changes through 2100. Depending on
emissions scenarios, models, and sub-region, Delta seasonal temperatures are likely to increase
4°F (summer maximum) and 2.3°F (winter minimum) by 2030 and 9.7°F (summer maximum) and
8.6°F (winter minimum) by 2100 (ensemble mean of four models on Emissions Scenario 8.5,
Fairbanks et al. 2019). By 2100, the Delta’s mean annual maximum temperature could increase
between 2.2°F and 4°F (Fairbanks et al. 2019). Throughout the century, the western and
northern Delta regions are estimated to have the highest summer temperatures, and the
southern and northern Delta regions are predicted to have the highest winter temperatures
(Fairbanks et al. 2019). For the greater Central Valley, the mean annual maximum temperature
by 2100 is projected to be warmer than the Delta and Suisun Marsh by about 2.0°F (Cal-Adapt
2017). In this way, the Delta and Suisun Marsh may serve as a thermal refuge for crops that
would otherwise be subject to more temperature stress elsewhere in the Central Valley.
Temperature influences metabolic processes and photosynthesis rates that control
evapotranspiration and water needs, overall growth, leaf morphology and development,
nutritional quality and flavor, flowering and pollination timing, and fruit production (Cavagnaro
et al. 2006, Tabari et al. 2011). By 2100, rising air temperatures will influence each crop
differently, but will likely result in overall reduced yields of the current crop assemblage in the
Delta. In addition, increased temperature variability tends to reduce yields, such as with
almonds, wine grapes, hay, walnuts, table grapes, and cherries (Lobell et al. 2006).
A literature review of climate change impacts on California crops suggests that temperature is a
major factor , and will impact crops grown in the Delta (Table 2 and Figure 3).
2-2 May 2021DELTA STEWARDSHIP COUNCIL
A California State Agency
2.2.1.1 Hotter and Longer Summers
Hotter, longer summers will extend the growing period and accelerate growth by increasing the
rate of metabolic processes if other environmental stresses are controlled for. Accelerated
growth occurs if the increased temperatures are within the optimal range for the crop species,
but exposure to super-optimal temperatures reduces yields. Positive effects of warmer daytime
temperatures may be offset by increased water demands through accelerated crop
evapotranspiration, increased overnight respiration rates, and reduced soil moisture (Lobell et al.
2006, Pathak et al. 2018). Crop models suggest that reduced yield from high temperatures is
typically caused by water stress. Increased irrigation would buffer against yield declines
(Schauberger et al. 2017). The Delta’s water supply availability, relative to other agricultural
areas in the Central Valley, may set it up as uniquely able to compensate for higher air
temperatures if water quality remains favorable. Warm nighttime temperatures can also reduce
fruit or grain quality or productivity (Walthall et al. 2012).
Accelerated growth may positively influence plant size and time to harvest for many crops, but
quality may be negatively impacted. For example, alfalfa, which covers about 19 percent of Delta
farmland, may experience improved yields with hotter summers, but with reduced quality
(Medellín-Azuara et al. 2018, DPC 2020). Higher minimum temperatures may decrease rice
yields, while higher maximum temperatures may lead to yield increases but also increases in rice
grain chalkiness, which decreases the amount of marketable rice (Zhao and Fitzgerald 2013).
While wine grape yields may be negligibly affected by hot temperatures, extreme heat negatively
impacts flavor, aroma, and color (Nicholas et al. 2011).
Delta crops are variably vulnerable to rising air temperatures. Warmer temperatures will favor
some Delta crop yields, including alfalfa, tomatoes, and sweet potatoes (Cavagnaro et al. 2006,
Fairbanks et al. 2019). Tomato yields may increase or be less affected by warmer summers once
fruit has set, with a longer growing season and accelerated time to harvest (Jackson et al. 2011,
Lee et al. 2011, Pathak and Stoddard 2018). More research is needed to draw conclusions on
various truck vegetables (e.g., onion, garlic) climate vulnerability (Kerr et al. 2018, Pathak et al.
2018). Fruits generally respond negatively to hotter summers, especially during fruit
development stages. Delta fruits, including, cherries, and table grapes, are expected to have
reduced yields of 5 to40 percent as modeled in the Central Valley (Pathak et al. 2018, Kerr et al.
2018). Corn, a Delta crop with significant acreage, has yield reductions at temperatures above
84.2°F (Schlenker and Roberts 2009). Notable heat-tolerant fruits include wine grapes, almonds,
and walnuts, which may have little change or improved yields with warmer summers, yet
reduced time to maturity (Lobell et al. 2006, Webb et al. 2012).
May 2021 2-3Delta Adapts: Crop Yield and Agricultural Production Technical Memorandum
Chapter 2. Biophysical Impacts to Crop Yield
2.2.1.2 Warmer Winters and Fewer Chilling Hours
Warm winters will negatively impact many perennial crops currently established in the Delta, but
also reduce the incidence of frost damage (Reilly and Graham 2001). Olives and citrus, which are
limited by minimum temperatures, may benefit from warmer winters in the Delta, resulting in
yield increases (Reilly and Graham 2001, Denney et al. 1985). Warm winters are expected to
reduce yields in wine grapes, strawberries, and most fruit and nut trees (Lobell and Field 2011).
Winter minimums are expected to increase faster than seasonal averages or maximums, which
will be detrimental to crops that require a certain number of chilling hours below 45°F. Most
fruit and nut trees require a threshold of chilling hours to break dormancy, achieve simultaneous
flowering and pollination, and maintain predictable high-quality yields. Chilling hours may better
predict yields than growing season temperatures (Lobell and Field 2009, Pathak et al. 2018).
Annual accumulation of winter chill hours in California has already decreased (Baldocchi and
Wong 2008). By 2050, it is suggested that the Delta may have 550 to 650 chilling hours, which is
suitable for almond, fig, olive, persimmon, pomegranate, chestnut, pecan, and quince trees, but
not pear, cherry, apple, apricot, kiwifruit, peach, nectarine, plum, or walnut trees (Luedeling et
al. 2009). By 2100, the Delta is not likely to have sufficient chilling hours to ensure viability of
many orchards and is projected to range from 250 to 400 chilling hours. Therefore, by 2100, the
remaining fruit and nut trees that may be viable in the Delta are almond, fig, olive, persimmon,
and pomegranate trees (Ibid). Given long lead times, farming may able to adapt with crop
choices that reflect climate change predictions.
Warmer winters will decrease the occurrence of tule fog, a thick wintertime ground fog which
farmers historically relied on to limit evapotranspiration November to March (Gray et al. 2019).
Tule fog is also a critical factor in winter chill that fruit trees require in the Central Valley (Ibid).
A summary of anticipated climate change impacts (as predicted for the greater Central Valley,
which is anticipated to be about 2°F higher than the Delta) on current Delta crops, largely driven
by temperature, is illustrated below in Table 2 and Figure 3.
Figure 2: Farmland in the Suisun Marsh area
2-4 May 2021DELTA STEWARDSHIP COUNCIL
A California State Agency
Table 2: Delta crop yield impacts under climate change, based on predictive modeling for
temperature change in the greater Central Valley.
Land Use Yield Under Expected
Acres Source
Type Climate Change Timeframe
Alfalfa 77,576 Small growth End-of-century Pathak et al. 2018
Mid-century Lobell and Field 2011,
Almonds 15,651 Medium declineⵣ
End-of-century Pathak et al. 2018
Asparagus 1,964 Medium declineⵣ Mid-century Medellín-Azuara et al. 2018
Bush Berries 1,253 Unknown Not applicable Not applicable
Carrots 182 Medium decline Mid-century Medellín-Azuara et al. 2018
Cherries 2,927 Large decline Mid-century Lobell and Field 2011
Citrus 6 No change Mid-century Lobell and Field 2011
Corn 82,392 Small decline End-of-century Lee et al. 2011
Cucurbit 3,593 Medium decline Mid-century Medellín-Azuara et al. 2018
Forage Grass 5,874 Small growth Mid-century Izaurralde et al. 2011
Olives 1,628 Unknown Not applicable Not applicable
Pasture 46,878 Small decline Mid-century Medellín-Azuara et al. 2018
Pears 5,429 Decline* Mid-century Luedeling et al. 2009
Pistachios 274 Decline† End-of-century Pathak et al. 2018
Potatoes 4,054 Small decline Mid-century Medellín-Azuara et al. 2018
Rice 7,468 Small decline End-of-century Pathak et al. 2018
Safflower 12,852 Small decline End-of-century Pathak et al. 2018
Sunflower 591 Small/large decline End-of-century Pathak et al. 2018
Tomatoes 29,181 No/small decline End-of-century Pathak et al. 2018
Truck Crops 2,773 Medium declineⵣ Mid-century Medellín-Azuara et al. 2018
No/small decline
(wine)
Vineyards 41,613 End-of-century Pathak et al. 2018
Small/medium
decline (table)
Walnuts 4,580 Small decline End-of-century Pathak et al. 2018
Young
214 Small growth Mid-century Medellín-Azuara et al. 2018
orchard
Source: Acres of land use type are adapted from 2016 CACASA and 2016 LandIQ from DPC 2020.
Yields key: Small growth -10%, Medium decline >-20%, Large declineDelta Adapts: Crop Yield and Agricultural Production Technical Memorandum
Chapter 2. Biophysical Impacts to Crop Yield
†In Pathak et al. 2018, the authors predict pistachio yield declines based on declining winter chills, but do not make
predictive modeling on the percentage of the decline.
Figure 3: Delta crop yield impacts under climate change, based on predictive modeling for
temperature change in the greater Central Valley.
2,927 acres
2,881 acres
24,163 acres
5,703 acres 84,255 acres
Small Growth
No Change
29,187 acres
Small Decline
Decline
Medium Decline
Large Decline
199,837 acres
Unknown
Source: Acres of land use type are adapted from 2016 CACASA and 2016 LandIQ (DPC 2020); see
Table 2 for peer-reviewed sources of predictive change and expected timeframe.
2.2.2 Precipitation Patterns and Sea Level Rise
In the Delta and its watershed, timing and volume of precipitation is expected to be constricted
within a shorter period in winter, with a greater percentage of precipitation falling as rain within
extreme events instead of being stored as snow at high elevations, elevating flood risk,
increasing summer water scarcity in the watershed, and potentially decreasing water quality in
the Delta (Rhoades et al. 2018). Multiyear droughts will become more frequent and
unpredictable, suggesting that surface water conservation and efficiency measures previously
required during drought years may always be advised (Diffenbaugh et al. 2015). The success of
California agriculture in the greater Central Valley is dependent on water applications from
interdependent storage and irrigation systems that will be affected by changing precipitation
patterns. Even during the most severe droughts, water availability in the Delta is not affected,
however, because of the Delta’s tidal influence, water quality may wane during droughts if
freshwater flows are reduced and sea water penetrates further into the Delta. Earlier timing of
runoff and greater precipitation variability will alter water storage and management regimes,
which may negatively affect water quality for users in the Delta.
2-6 May 2021DELTA STEWARDSHIP COUNCIL
A California State Agency
2.2.2.1 Delta Irrigation Water and Rainfall Patterns
Most agricultural water diversions in the Delta rely on senior water rights (primarily riparian
water rights). However, scarcity throughout the watershed, especially during an extended
drought, may affect Delta farmers through reduced Delta water quality that increases salinity
levels in Delta water beyond the tolerance of irrigated crops. The changing climate will pressure
not only our existing physical infrastructure, but the statutory and regulatory infrastructure
adapted to historic climate and weather patterns. For additional research and regulations on the
unique water rights and usage of Delta water users, please see reports published by the Office of
the Delta Watermaster of the State Water Resources Control Board (SWRCB 2020).
Farming on Delta islands is not limited by water availability because islands are surrounded by
water and many are intensely subsided. Land that is below sea level requires water to be
regularly pumped off to avoid saturation from damaging roots of some perennial crops, such as
orchards. Farms on the fringes of the Delta that are set back from the main channels of the Delta
might be more susceptible to water shortages and employ stress irrigation in droughts. Although
changing rainfall patterns in the watershed are not likely to limit in-Delta water users, rainfall in
the Delta is likely to become more unpredictable and variable. Unexpected downpours may
disrupt agricultural schedules or compound winter water impacts (Pathak et al. 2018). Later
spring extreme precipitation events can wash away pollen on fruit trees during flowering (Ibid).
Most Delta agriculture does not have to institute stress irrigation because of the shallow
groundwater, but some areas in the upslope fringes of the Delta may have to use such methods
in dry years. Stress irrigation diminishes yields for many crops, although some plants have
strategies to tolerate stress irrigation (hereafter referred to as drought stress) for a time, and
quality of some crops may increase with stress irrigation. Drought stress impacts germination
and growth rate, total vegetative growth, and reproduction. Drought-stressed growth is limited
by decreased photosynthetic rates, reduced nutrient uptake and allocation efficiency, reduced
water-use efficiency, and injury from a buildup of reactive oxygen species (Farooq et al. 2009,
Fahad et al. 2017). As a result, stressed plants tend to have reduced leaf size and limited stem
and root growth (Farooq et al. 2009). Yield response to drought depends on timing, severity, and
co-occurrence with other stresses (Plaut 2003). Insects and diseases can take advantage of crops
that are in a drought-stressed state (Pathak et al. 2018). Drought-tolerant plants can grow,
flower, and maintain yields through adjusted physiological, molecular, and morphological
processes. Some are able to increase their root-shoot ratio to uptake more water, make smaller
leaves more hairy, waxy, and succulent, adjust biochemical mechanisms to maintain cell
functions and improve cell water balance, or escape drought by growing in a shorter period and
reproducing earlier in the season (Farooq et al. 2009).
Many Delta crops, listed below, are vulnerable to drought and water stress, but as mentioned,
most land in the Delta is not limited by water availability. Delta crops that have high water
demand and evapotranspiration rates include alfalfa, tomatoes, pasture, rice, and corn (Jackson
et al. 2011). Alfalfa can be a relatively good perennial crop choice for drought-prone areas
because it has deep roots and can go dormant over the summer, resuming growth when water
becomes more available (Putnam 2015). Corn quality and yields are diminished with water stress
May 2021 2-7Delta Adapts: Crop Yield and Agricultural Production Technical Memorandum
Chapter 2. Biophysical Impacts to Crop Yield
at any time, but yields are especially vulnerable the two weeks before and after silk emergence
(University of California, Davis Drought Management 2019). Any reductions to water applications
can also reduce yields of processing tomatoes, but several strategies exist to cope with specific
land and irrigation types (University of California, Davis Drought Management 2019). Other Delta
crops that may be vulnerable to water stress include nut and fruit orchards. Most Delta orchards
are in the north along the Sacramento River corridor, which more reliably maintains inflows and
low salinities compared to the San Joaquin River corridor (Chaudry et al. 2020). Wine grape
quality benefits from reduced water applications, but strong drought combined with elevated
temperatures can reduce vegetative growth and grape yield (Kizildeniz et al. 2015). Soils that are
too dry can encourage early grape maturity (Webb et al. 2012).
2.2.2.2 Multiyear Droughts, Sea Level Rise, and Salinity
Through 2100, severe multiyear droughts and significant water shortages are projected to
become more common. Droughts will interact with sea level rise to expose Delta water users to
more frequent and widespread salinity problems. The waterways of the Delta and eastern Suisun
Marsh contain fresh water during the wet season in non-drought years. During dry or drought
periods, reservoir releases are necessary to limit salinity intrusion further into the Delta. Intense
droughts and water shortages force water managers to make difficult choices about how to
manage very limited water supplies. Historically during these episodes, water quality regulations
in the Delta have been relaxed, allowing salinity to penetrate further into the Delta to manage
water within the State’s water supply system. During the 2012 to 2016 drought, some Delta
farmers were forced to use lower quality water, fallow, or institute conservation measures to
reduce crop damages (Durand et al. 2020).
Higher salinity leads to stunted growth due to osmotic stress or ion toxicity injury (Läuchi and
Epstein 1984). Delta crops range from salt-tolerant to sensitive, with the highest acreage
considered moderately sensitive (Chaudhry et al. 2020). Truck crops, corn, alfalfa, corn, melons,
and squash are moderately sensitive to salt, while vineyards, fruit and nut orchards, berries, and
beans are sensitive, and grains, field crops, and olives tend to be moderately tolerant (Ibid).
Episodic salinity increases are not new to Delta farmers, who already adjust irrigation methods
and timing with soil type, draining conditions, and twice daily tidal changes. Soil types, water
salinity, and drainage management are spatially and temporally variable in the Delta. Overall,
salinity is lower in wet years compared to dry years, but salinity varies by region within the Delta
more than by water year type (Chaudhry et al. 2020). Across all water year types, salinity is lower
in the northern Delta than the eastern and southern regions (Ibid). Delta farmers in some parts
of the Delta can limit long-term soil salinity accumulations through drainage management,
(Medellín-Azuara et al. 2014). However, some Delta soils have low permeability and shallow
groundwater, making soil salt accumulation a problem for some farmers, especially in the
summer season (Aegerter and Leinfelder-Miles 2016). During times of poor water quality
coinciding with drought, water application management can mitigate damage to crops, but the
soil will require leaching to limit future crop production impacts as salts build up over time (Ibid).
Leaching in the Delta is typically achieved with winter rainfall (Ibid), which become less reliable
with climate change (Ibid).
2-8 May 2021DELTA STEWARDSHIP COUNCIL
A California State Agency
By 2100, sea level at the San Francisco Golden Gate is likely to rise between 2.4 and 10 feet
higher than levels measured in 2000, and diffused rises in the Delta are even more uncertain
(Kopp et al. 2014, Sweet et al. 2017). Modeling for the Delta Adapts Water Supply TM shows that
current regulatory water quality requirements can be met in most year types for future
conditions for up to at least two feet of sea level rise. Meeting these requirements requires
trade-offs with water storage and Delta exports. However, acute short-term (scale of months)
increases in salinity into the Delta during droughts are likely to increase. During multiyear
droughts and as sea level rises, salinity levels may change unevenly throughout the Delta,
impacting yields, irrigation methods, drainage requirements, and crop choice in some regions. If
future multiyear droughts are handled similarly to those of the past, repeated salinity intrusions
could cause significant loss of productivity and damage to agricultural assets. Towards the end of
the century, conservative flow releases to sustain demand throughout multiyear droughts may
not be enough to keep ocean salinity, intensified by sea level rise, from intruding further into the
Delta and degrading water supplies (Wang et al. 2018).
Through mid-century, increases in episodic salinity events or salinity variability may necessitate
transitions from more salt-sensitive higher-value truck and vineyard crops to less salt-sensitive
lower-value crops in some regions. Although large revenue losses are not expected through mid-
century, small to moderate changes in crop productivity or operating costs could determine
profitability and economic viability for some farmers. Even if salinity can be actively managed, it
may increase management costs.
Modeling suggests that areas currently exposed to more salinity (particularly in the west Delta)
are most vulnerable to salinity increases related to sea level rise (Medellín-Azuara et al. 2014).
The western Delta currently supports more salt-tolerant and less-valuable crops (Ibid), but it is
unclear if these crops can withstand salinity intrusion towards the end-of-century. A 2020 Delta
Protection Commission study suggests that, regardless of water year type, Delta regions with
lower growing season salinity are more likely to invest in vineyards and tree crops, and regions
with higher growing season salinity tend to select moderately tolerant and tolerant crop groups
(Chaudhry et al. 2020). For growers that switched crops during the study period (2009 to 2016),
which included a significant multiyear drought, they favored more salt tolerant and moderately
tolerant crops if water salinity had increased in their region (Ibid). Updated models for
precipitation, flow, sea level rise, and water management strategies will improve predictions of
salinity impacts with climate change that can help growers decide how to handle these impacts.
May 2021 2-9Delta Adapts: Crop Yield and Agricultural Production Technical Memorandum
Chapter 2. Biophysical Impacts to Crop Yield
2.2.3 Frequency of Extreme Events
2.2.3.1 Extreme Heat Events
Extreme heat days and heat waves on top of increased seasonal averages cause yield losses due
to heat stress, and by cueing early development. Heat stress reduces the rate of photosynthesis,
increases respiration, and can accumulate protective but off-tasting metabolites in plant tissues,
resulting in reduced plant growth and decreased quality (Pathak et al. 2018). The impact of
extreme heat on yields may depend on timing, especially during germination or reproductive
stages (i.e., pollination, fruit set; Medellín-Azuara et al. 2018). As a result, heat waves early in
spring or summer can be more detrimental than later in summer (Jackson et al. 2011).
Prematurely hot days can damage plants early in development or spur rapid bolting, which may
not align with timing cues for pollinators and affect crop quality. Early heat waves cause yield
decreases in corn, rice, sunflowers, and tomatoes (Jackson et al. 2011, Pathak et al. 2018).
Sporadic midsummer heat waves do not appear to influence yields of these crops, but iterative
summer heat waves decrease yields severely (Jackson et al. 2011).
2.2.3.2 Increased Frequency and Intensity of Extreme High Precipitation and
Flood Risk
The reduction of the precipitation period, with a greater proportion of precipitation falling in the
Sierras as rain (often within large atmospheric river events), and warmer temperatures will cause
faster snowmelt (Dettinger 2011, DWR 2015, Rhoades et al. 2018). These factors are shifting
peak runoff earlier and will increase flood risk in winter and early spring, impacting the water
management system’s capability to store water for later use (including maintenance of Delta
water quality through longer dry spells) and flood management (DWR 2015). Delta farmers will
face increasing costs associated with maintaining levees and pumping water out of subsided
islands. Perennial crops, such as alfalfa, orchards, and vineyards may be most vulnerable to the
brunt of winter flooding. Inundation stress reduces survival and yields through root anoxia and
increased vulnerability to disease and nitrogen losses (Pathak et al. 2018). For annual crops,
earlier spring flooding may ruin furrows, waterlog and deplete oxygen in soil, lose nutrients and
soil to runoff, delay crop plantings, and shorten the growing season, thus reducing yields
(Rosenzweig et al. 2002).
Later spring flooding can severely damage or destroy recently planted crops, and by that time it
may be too late to replant (Jackson et al. 2011). Successive rainfall events on fully saturated soil
may lead to additional soil erosion and nutrient loss. Conditions following flooding can greatly
affect recovery; cool conditions can encourage fungal disease spread while hot conditions can
cause accelerated soil drying and crusting that resists root recovery. Flooding can also
incapacitate roads, irrigation structures, and other agricultural infrastructure, inhibiting farmers’
ability to remediate damage to crops, grow, harvest, or undertake farming operations.
2-10 May 2021DELTA STEWARDSHIP COUNCIL
A California State Agency
2.3 Secondary Stressors
Effects of climate change on Delta crop yields are made more complex by interactions between
direct impacts on plant productivity and indirect impacts that exacerbate existing issues such as
pests, weeds, disease, and increasing salinity of Delta waters.
2.3.1 Atmospheric Carbon Dioxide Concentration
Elevated CO2 may enhance crop yields through ‘fertilization’ of photosynthesis, but interactions
with temperature, water, and available nutrients determine overall impact on growth, and
accelerated growth may be at the expense of nutrition and quality (Cavagnaro et al. 2006, Blanc
and Reilly 2017). In a laboratory setting, CO2 boosts photosynthetic and growth rates and
decreases water loss from stomata, especially for C3 species such as alfalfa, wheat, and soybeans
(Deryng et al. 2016). Decreased water loss from stomata in some plants may impact evaporative
water requirements and therefore reduce water needed in irrigation. The carbon sequestration
farming system, the valuation of the carbon that plants can store in soil, may benefit from CO2
fertilization. Crops will not be the only plants to respond to the CO2 fertilization effect;
herbaceous weeds that compete with crops may become more intense competitors (Cavagnaro
et al. 2006). However, photosynthetic rates can become acclimated via enzymatic feedbacks and
is regulated by biological nitrogen fixation and nitrogen fertilizer applications (Meyerholt et al.
2016). In the future, atmospheric CO2 will reach a saturation point for plants, and other climate
change impacts will likely offset benefits from CO2 fertilization.
Additionally, increased carbon availability without a proportionate increase in soil-based
nutrients can lead to increased carbohydrate content but decreased nutritional quality, including
reduced protein and mineral content, and/or increases in unpalatable secondary compounds
(Taub et al. 2007, Myers et al. 2014). Shifts in nutritional quality can be attributed to reduced
transpiration rates, reduced mineral uptake and changes in nutrient allocation between tissues
(McGrath and Lobell 2014). Without adaptation, heat stress will likely overwhelm yield-
enhancing effects of CO2 fertilization.
2.3.2 Pests, Weeds, and Disease
Temperature influences biotic stresses such as invasive weeds, animal pests, and disease spread.
Animal pests, weeds, and diseases can cause large economic losses in production. Invasive pests
cost California agriculture $3 billion annually, and nationwide invasive weeds cost $33 billion
annually in agricultural losses (Bebber et al. 2013, Cal-IPC 2019, CDFA 2019, Pimental et al.
2000). Efforts to control nuisance species may substantially increase production costs. Climate
change could affect the efficacy of chemical pesticides and biocontrol methods (Cavagnaro et al.
2006). Many invasive species lack natural control mechanisms in their novel ranges, making
climate a primary limiting factor in spread, establishment, and impacts (Ziska and Dukes 2011).
Weather extremes, precipitation, and carbon dioxide availability can affect distribution,
invasibility, and agricultural impacts of invasive weeds, pathogens, and pests. Warming
temperatures are likely to contribute most to invasive range expansion and damage (Ibid).
May 2021 2-11Delta Adapts: Crop Yield and Agricultural Production Technical Memorandum
Chapter 2. Biophysical Impacts to Crop Yield
Warming temperatures facilitate expansion of geographic ranges of weeds, pests, and diseases
by increasing winter survival rates and number of degree days (degree days are conceptualized
as number of days that are warm enough to positively affect pest and plant development;
Cavagnaro et al. 2006, Bebber et al. 2013). There is an estimated poleward shift of crop pests
and pathogens of almost 1.7 miles per year, keeping pace with climate change-driven
temperature increases (Bebber et al. 2013). Warmer temperatures also increase metabolism,
which may augment pathogen and insect growth rates, herbivory rates, reproduction, and
number of generations per year (Yamamura and Kiritani 1998, Pathak et al. 2018). Weed
proliferation and success is particularly influenced by temperature; many of the biggest nuisance
weeds in North American agriculture are from warm or tropical areas and could gain more
advantage in competition with crops (Ziska and Dukes 2011).
Pest pressure can interact with other effects of climate change in ways that are difficult to
predict. Elevated baseline stress from water quality degradation or excessive heat can make
crops more susceptible to pests and pathogens (Mattson and Haack 1987), but droughts can also
limit the spread of pathogens and infection rates (Huber et al. 1999). Carbon dioxide abundance
may also manifest in changes in leaf/tissue characteristics or defense compounds, thereby
mediating plant-pathogen interactions in positive or negative ways (as reviewed by Ziska and
Dukes 2011). Plant diseases may negate potential yield boons from carbon dioxide fertilization
(Butterworth et al. 2010), but it is also possible that CO2-fertilized plants could better tolerate
infections (Ziska and Dukes 2011). Consideration of holistic agroecosystem-wide shifts and new
adaptation strategies will improve Delta agricultural resistance to pests, weeds, and disease.
2.3.3 Impacts to Animal Pollinators
Climate change may also disrupt crop-pollinator interactions through spatial, temporal, and
behavioral mismatches (Hegland et al. 2009). Climate-induced range shifts of crops and current
mutualistic partners may occur unevenly, making some crops vulnerable as new mutualisms
develop (CDFA 2013). Earlier spring warming may elicit earlier flowering time when pollinators
are not yet active, although flowering and pollinators appear to generally track together with
warming (Hegland et al. 2009). Air temperature also mediates pollinator behavior and
interactions with flowers. For example, some bees preferentially visit cooler flowers when air
temperatures are high. The capability of plants to cool their flowers may affect bee visitation
(Shrestha et al. 2018). Delta fruit and nut production is especially linked to managed honeybee
pollinators whose populations are already vulnerable to perturbations, while other crops rely on
native pollinator communities that are redundant, diverse, and likely more resilient (CDFA 2013).
2-12 May 2021DELTA STEWARDSHIP COUNCIL
A California State Agency
CHAPTER 3. AGRO-SOCIAL VULNERABILITY
3.1 Decision-making: Balancing Economic and Climate
Change Threats
Farmer decision-making processes, financial risk, employment, and culture will be affected by
climate change and climate change policies. Globally, and in California, agricultural profits are
projected to decline because of climate change in the latter half of the 21st Century (Deschenes
and Kolstad 2011). Farmers face significant barriers to adopting technologies to prepare for
climate change in the long term, such as high start-up costs and associated risk to adopting
technology (Bowman and Zilberman 2013). Current issues such as technology or equipment
capacity, credit limitations, a shrinking farm labor market, and crop market demands are more
pertinent constraints than the threat of long-term, climate-related factors (Ibid). As sea level
rises in the Delta, the cost of pumping water out of subsided islands or raising and maintaining
levees (much of which is borne by the State and Reclamation Districts) will likely increase and
factor into farmer decision-making on crop type.
Today, crop choices vary from year to year and decisions are usually driven by economic factors
and risk aversion. Temporary crop-switching is a relatively feasible short-term adaptation
strategy that increases some farmers’ resilience to a changing climate, especially with respect to
water supply. However, this may not be economically feasible for some farmers or crops. Crop
changes also come with challenge– farmers must learn and train workers in cultivation practices,
acquire new equipment, and establish new value chain connections. Advanced irrigation
practices and crop choices, diversity, and acreage allocation can be implemented in response to
multiyear droughts. Conversely, farmers may also plant water-intensive perennial crops to
improve expected revenues (Marston and Konar 2017). Annual-to-perennial crop switches may
add revenue initially but are usually more vulnerable to future water shortages than annual
crops. Additionally, the 2014 Sustainable Groundwater Management Act, which requires more
sustainable groundwater use by 2042, may also limit alternative water sources during drought.
Belief in climate change and perception of the potential impacts involved influence farmer
behavior and vulnerability (O’Connor et al. 1999). Willingness to adopt climate change mitigation
strategies and management practices may be driven by climate change beliefs. Willingness to
adapt farming practice or crop choices to climate changes, such as to water supply shortages,
may be more motivated by immediate local impact concerns (Haden et al. 2012). However, most
farmers believe climate change is occurring (Niles et al. 2013), but there is less agreement that it
is human-caused or will significantly impact local agriculture (Prokopy et al. 2015). The
psychological barrier to either climate change or its potential local impacts can reduce
motivation to adopt climate adaptation strategies, especially those that are costly, challenging,
or complex. Additionally, farmers may perceive climate change policy risk (how regulations
adjust to or ameliorate climate change might impact agricultural activities) as more of a threat
than biophysical impacts (Niles et al. 2013). A study in Yolo County suggests that farmers in the
May 2021 3-1You can also read