THE CRITICAL DECADE Queensland climate impacts and opportunities - Climate Council
←
→
Page content transcription
If your browser does not render page correctly, please read the page content below
THE CRITICAL DECADE Queensland climate impacts and opportunities
The Critical Decade: Queensland climate impacts and opportunities

  Summary
  Queensland’s climate is already changing and is likely       Queensland’s tourism industry is at risk from
  to change further in the future, posing significant risks    climate change.
  for the state. The next chapter of the climate story is
                                                               – Tourism is a key industry for Queensland, employing
  about how Queenslanders, and Australians, can find
                                                                  120,000 people and attracting tourists from around
  solutions that minimise the risks of climate change
                                                                  the world. Queensland’s tourism industry relies on
  while providing extra benefits for our health, community,
                                                                  its unique local attractions including sandy beaches,
  economy and environment.
                                                                  the Great Barrier Reef, and World Heritage rainforests.
  Queensland’s agricultural industries are at risk             – In the last three months of 2011, visitors to tropical
  from climate change.                                            North Queensland spent $735 million. Higher
                                                                  temperatures and changing rainfall will place the
  – Agricultural productivity is affected by climate change
                                                                  rainforests in a highly stressed situation towards
     through: higher temperatures; changes in the amount,
                                                                  the end of the century.
     intensity, seasonality and variability of rainfall; and
     changes in the frequency and/or intensity of extreme      – The Great Barrier Reef is threatened by higher sea
     events such as droughts, bushfires and floods.               surface temperatures and more acidic oceans.
  – As a result of climate change, beef, sugar and cereal     – Queensland’s natural environment supports 70% of
     production in Queensland is expected to decline.             Australia’s native birds, 85% of its mammals and more
                                                                  than 50% of the nation’s reptiles and native frogs.
  – Queensland farmers are accustomed to dealing with
                                                                  Many of Queensland’s species and ecosystems are
     a highly variable climate, but in the future, new risk
                                                                  already threatened and climate change poses a serious
     management and adaptation strategies will be even
                                                                  additional threat to Queensland’s unique biodiversity.
     more important as the climate changes.
                                                               Sea-level rise threatens Queenslanders’ property
                                                               and lifestyle.
                                                               – Long stretches of sandy beaches in southeast
                                                                  Queensland – the Gold Coast, Moreton Bay,
                                                                  Brisbane and the Sunshine Coast – are threatened
                                                                  by the increased coastal erosion resulting from rising
                                                                  sea levels.
                                                               – The Gold Coast has more houses than any other
                                                                  region in Queensland within 110 m of erodible
                                                                  coastline, with more than 4,000 residential buildings
                                                                  at risk.
                                                               – Moreton Bay and the Sunshine Coast follow with
                                                                  around 2,000 residential buildings at risk in each
                                                                  region.

Climate Commission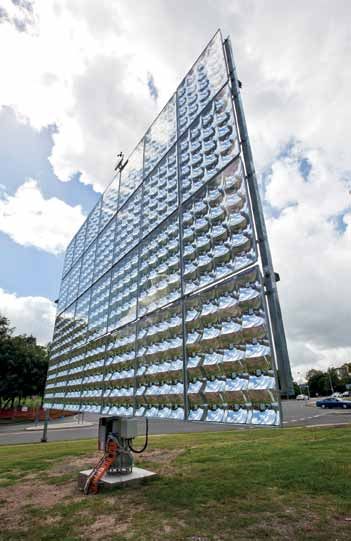
The Critical Decade: Queensland climate impacts and opportunities (continued)

 Using energy more efficiently can provide new                  With thanks to the Science Advisory Panel,
 opportunities for Queenslanders.                               Dr Paul Marshall, Professor Ove Hoegh-Guldberg,
                                                                Dr Mark Howden, Mr Alan Pears and Dr Steven Crimp
 – Making our cities more sustainable can also make
                                                                for their comments on the report.
    them healthier and more liveable, while reducing
    energy costs and greenhouse gas emissions.
                                                                This report draws on the Climate Commission’s
 – Improving the environmental performance of buildings        reports The Critical Decade: Climate science,
    – for instance, by using more energy-efficient lighting,    risks and responses and The Critical Decade:
    heating, cooling and refrigeration – offers opportunities   Climate change and health, and is the Climate
    to save energy costs and provide healthier conditions       Commission’s 14th report.
    for workers.
 – Many businesses are already cutting energy costs
    and pursuing new business opportunities, such as
    using waste products to produce energy. This area
    will continue to grow with a changing climate.

 Queensland is an ideal location for harnessing
 solar energy.
 – Queensland is truly the Sunshine State with some
    of the world’s highest levels of solar exposure.            Professor                   Professor
 – Queensland is leading Australia in solar photovoltaic       Will Steffen                Lesley Hughes
    system installation, and has doubled its use of solar       Climate Commissioner        Climate Commissioner
    energy in less than two years. By July 2012, more than
    200,000 Queensland households and businesses had
    installed solar panels.
 – While use of solar energy has grown rapidly,
    Queensland can take more advantage of its solar
    resources. Solar photovoltaic systems currently
    provide around 4% of the state’s total electricity
    generation capacity.
 – Around the world, investment in renewable energy
    is growing strongly and costs are rapidly coming
                                                                Professor                   Mr Gerry Hueston
    down. In remote areas of Australia the cost of solar
                                                                Veena Sahajwalla            Climate Commissioner
    electricity is estimated to already be cheaper than
                                                                Climate Commissioner
    retail electricity.

                                                                                                                    1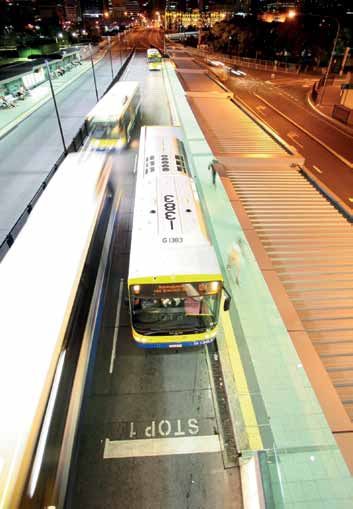
The Critical Decade: Queensland climate impacts and opportunities

1. Changes in Queensland’s climate                              While the observed small shift to higher average
                                                                temperatures may seem modest, sustained warming trends
    – Queensland has been getting hotter over the              lead to relatively large increases in the number of extreme
      past 50 years.                                            hot weather events. The average temperature across
                                                                Australia has risen by 0.9°C since 1910 and has been
                                                                associated with the number of record hot days more than
1.1 Temperature
                                                                doubling (CSIRO and BoM, 2007; Figure 2).
Temperatures are expected to continue rising this century.
The average temperature for Queensland has risen by about
1°C since early last century, with most of the warming
occurring since the 1950s (BoM, 2012a; Figure 1). The central
and southwest regions of the state have experienced the
largest increase in average temperature since the 1950s.

Figure 1. Annual average temperature anomaly for Queensland. The black line indicates the 11 year
running average and shows that the average temperature across Queensland has been increasing over the
past 60 years. Note: The annual average temperature anomaly is measured as the difference from the long-term (1961–
1990) climate average.
Source: BoM (2012a)

Figure 2. Average number of hottest-day-of-the-month records each year across Australia. Yearly average
shown by black line and 10 year average shown by purple bars. The average for the most recent 10-year
period (2002–2011) is shown in red.
Source: BoM (2012b)

2   Climate Commission
The Critical Decade: Queensland climate impacts and opportunities (continued)

Average temperatures are expected to continue to rise            1.2 Rainfall
across Queensland. By 2030, average temperature is
expected to have risen by 1°C above the 1961–1990 baseline         – Rainfall patterns in Queensland are changing,
and by 2070, the increase could be 1 to 5°C, depending                with evidence that some areas are getting drier
on the level of global emissions (CSIRO and BoM, 2007).               and some are getting wetter.
The temperature rises are very likely to be larger in the
inland areas compared to coastal regions.
                                                                 Over the past 110 years, Queensland has become slightly
                                                                 wetter apart from the coastal region stretching from the
The number of very hot days is likely to increase further in
                                                                 southeast northwards to Townsville (Figure 3). This coastal
the future. While the number of hot days is likely to increase
                                                                 drying trend has become more obvious over the 1970–2011
modestly in the next few decades, it could increase
                                                                 period (Figure 3). However, unlike southwest and southeast
significantly by the end of the century. Brisbane currently
                                                                 Australia, where research shows the rainfall declines are
experiences on average around 1 hot day per year (over
                                                                 at least partly attributed to human-induced climate change,
35°C). In the Brisbane area this is projected to increase to
                                                                 scientists cannot yet say the extent to which observed trends
around 2 days by 2030, 8 days by 2070 and 21 days by 2100
                                                                 in Queensland are linked to human-induced climate change.
(CSIRO, 2008). Across northern Australia extremely hot
weather is expected to occur more frequently. In this region
                                                                 What will future rainfall patterns look like across
extremely hot days – those that currently occur on average
                                                                 Queensland? This is a difficult question, as there is not
only once in every 20 years – are projected to occur every
                                                                 yet consensus among scientists on either the scale or
2–5 years by mid-century, and every year or two by the end
                                                                 direction of the changes. This is in part due to uncertainty
of the century (IPCC, 2012).
                                                                 about the response of the El Niño Southern Oscillation
                                                                 and the Interdecadal Pacific Oscillation – two important
                                                                 features of natural variability – to higher temperatures.
                                                                 However, there is some agreement that the tropics are likely
                                                                 to extend further south (Allen et al., 2012; Lucas et al., 2012).

Figure 3. Trend in total yearly rainfall for the periods 1900–2011 and 1970–2011.
Source: BoM (2012c)

                                                                                                                                 3
The Critical Decade: Queensland climate impacts and opportunities

                                                                    1.3 Tropical cyclones
                                                                    Tropical cyclones are important extreme events in north
                                                                    Queensland. Rainfall rates and maximum wind speeds
                                                                    that occur during tropical cyclones are likely to increase
                                                                    but the number of cyclones may decrease or remain
                                                                    unchanged (IPCC, 2012). That is, there may be fewer
                                                                    cyclones, but they are likely to be stronger and thus pose
                                                                    a larger risk to people, infrastructure and ecosystems.
                                                                    A southward shift in the starting and finishing locations
                                                                    of tropical cyclones is likely off the Queensland coast.
                                                                    This may result in an increase in tropical cyclones affecting
                                                                    regions of southeast Queensland (Abbs, 2012).

                                                                    1.4 Sea-level rise

                                                                      – Global sea level is on track to rise further over
                                                                         this century and beyond, posing challenges for
                                                                         Queensland’s coastal towns and cities.
                                                                      – Sea-level rise is now tracking near the highest
                                                                         levels that scientists have predicted in the past.

                                                                    Global sea level rose at a rate of 1.7 mm per year over the
                                                                    20th century. This rate has increased to about 3.2 mm per
                                                                    year over the last two decades. Rates of sea-level rise vary
                                                                    regionally, as has been observed along Queensland’s coasts.
                                                                    Depending on the region, the sea level along Queensland’s
                                                                    coasts is rising at, or above, the global average.

                                                                    The observed global sea level is tracking close to the upper
Heavy rainfall in Queensland caused widespread                      range of the Intergovernmental Panel on Climate Change
flooding, including across many residential areas                   (IPCC) model projections. The IPCC projections for the end
of Brisbane.                                                        of this century, compared to the 1990 baseline, range from
Source: PMBO                                                        about 20 cm to 80 cm but higher levels cannot be ruled out
                                                                    (IPCC, 2007; DCC, 2009). Most experts agree that a rise
Heavy rainfall events are a natural feature of the Queensland       within the range of 50 cm to 100 cm is most likely by 2100.
climate, as experienced in 2010 and 2011. The extremely             However, depending on the stability of the major ice sheets
wet weather was largely due to the influence of La Niña,            in Greenland and the Antarctic, a sea-level rise over 100 cm
a climate phenomenon bringing warmer sea surface                    is a distinct possibility.
temperatures to eastern Australia. Climate change may be
a factor due to its influence on rising sea surface temperatures,
which influence evaporation rates and the amount of
moisture in the atmosphere (Evans and Boyer-Souchet,
2012). Heavy rainfall events may increase across northern
Australia throughout the rest of this century but there is a
low level of confidence in this projection (IPCC, 2012).

4   Climate Commission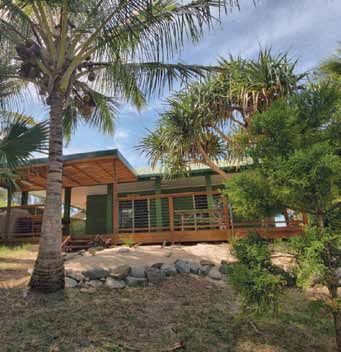
The Critical Decade: Queensland climate impacts and opportunities (continued)

2. Impacts of climate change                                   Rising temperatures are likely to make heatwaves more
   on Queensland                                                severe. Brisbane has already experienced the impact of
                                                                very hot days on human health. During the February 2004
This section considers issues that matter to all of us: our
                                                                heatwave, temperatures on 21 and 22 February peaked at
health, our cities, our biodiversity and industries that rely
                                                                41.7°C, resulting in a 53% increase in ambulance call-outs
on the natural environment. Many of the impacts of climate
                                                                (Steffen et al., 2006).
change are often the consequence of multiple aspects of
the changing climate system, rather than any single change
                                                                Other extreme weather events such as cyclones, storms,
in isolation, such as the higher sea levels and hotter
                                                                floods, bushfires and droughts also affect human health
temperatures described above.
                                                                through injury, disease and death. Thirty-three people died
                                                                during intense floods in December 2010 and January 2011.
2.1 Human health
                                                                The flooding, along with tropical cyclones Anthony and
                                                                Yasi, caused more than 78% of Queensland to be declared
  – More frequent and/or intense extreme weather
                                                                a disaster zone (QFCI, 2012). These events demonstrate the
     events pose risks to human health, both immediately
                                                                effects that extreme weather events can have on human
     and after the event.
                                                                health and infrastructure.
  – The geographic region suitable for transmission
     of mosquito-borne diseases is expected to extend
     further south.

Changes in climate, particularly increasing temperatures
and increasing frequency and/or intensity of extreme
weather events, can pose serious risks to human health.

Changes in temperature, rainfall and humidity in Australia
may allow mosquito-borne infectious diseases, such as
dengue fever and Ross River virus, to become more
widespread. The main carrier of dengue fever, the mosquito
Aedes aegypti, is typically confined to northern Queensland
where outbreaks occur almost annually (Ritchie, 2009;
Russell et al., 2009). The geographic region suitable for the
transmission of dengue is expected to expand southwards
along the Queensland coast and into northern NSW over
this century, if the climate becomes hotter and wetter
(Bambrick et al., 2008; Figure 4).

Hot days and heatwaves put significant pressure on the
body, leading to greater incidence of lethargy, heatstroke,
organ failure and death. Heat-related mortality in Queensland
could increase (Bambrick et al., 2008), even taking into
account population changes as well as efforts to reduce
greenhouse gas emissions. Children, the elderly, those in
heat-exposed jobs (such as construction workers, those
on outside mine sites, farmers and emergency service
providers) and low-income earners are all at greater risk
from heat extremes.
                                                                Figure 4. Potential spread of dengue fever by 2100,
                                                                shown by shaded area.
                                                                This diagram is indicative only and is drawn from the
                                                                in-text references. The actual future distribution of the
                                                                mosquito carrying dengue fever will be determined by
                                                                climate as well as other changes, for example, in
                                                                technology and population.
                                                                                                                              5
The Critical Decade: Queensland climate impacts and opportunities

2.2 Agriculture                                                 Beef and dairy
                                                                Queensland is Australia’s largest beef-producing state,
    – Risks of increasing temperature, changes in rainfall     supplying nearly 50% of the nation’s beef for domestic
       and increasing severity of extreme weather mean that     consumption and export (DEEDI, 2010). Queensland
       the climate of the future will not be the same as that   provides about 5% of national milk production (Dairy
       in the past. The risks to Queensland’s agricultural      Australia, 2012).
       industries from changes in climate include:
      – heat stress for livestock and plants                   Modelling by ABARE (2007), based on CSIRO/BoM
                                                                projections, indicates that beef production in Queensland
      – some fruit and vegetable crops no longer being
                                                                could decline substantially by 2050 due to climate change.
         able to be grown where they are now due to less
                                                                Cattle are likely to suffer heat stress more frequently,
         chilling and maturing time
                                                                especially in feedlots. Animals with heat stress have
      – salinity related to rising sea levels adversely        reduced appetite, produce less milk and milk of lower
         affecting crops in coastal areas                       quality, grow more slowly, and are less likely to breed
      – potential increases in rainfall in the north           (QFF, 2008; DEEDI, 2010). Heat stress can also lead to
         increasing waterlogging in crops like sugar            mortality in extreme circumstances. Recent efforts to
      – reduced cereal production with increases in            maximise milk production through selection of larger
         temperature or changes in rainfall.                    animals have also served to increase the susceptibility
                                                                of dairy cows to heat stress. Any decline in rainfall could
                                                                result in reduced forage production and increased pressure
Agriculture contributed more than $14 billion to the            at watering points, leading to land degradation.
Queensland economy in 2011–2012 (DAFF, 2012).
                                                                Increasing temperatures could also shift the distribution of
Queensland farmers are accustomed to dealing with
                                                                pests and parasites such as cattle ticks and buffalo fly in a
a highly variable climate, but new risk management
                                                                southerly direction, increasing the risk of infection, disease
and adaptation strategies will be even more important
                                                                and reduced production (QFF, 2008). Cattle ticks alone have
as the climate continues to change.
                                                                been estimated to cost more than $40 million each year in
Future productivity will be affected by climate change          control measures, and more than $90 million from lost
through higher temperatures; changes in the amount,             production (McLeod, 1995). Climate change is expected to
intensity, seasonality and variability of rainfall; and         result in a reduction in tick numbers in the northern parts of
changes in the frequency and/or intensity of extreme            the state and an increase in the south, with accompanying
events such as droughts, floods and bushfires. Agricultural     impacts on weight gain (White et al., 2003).
productivity is already sensitive to changes in rainfall
amounts and distribution and other climatic extremes.
Recent flooding across central, western and southwest
Queensland is estimated to have cost primary producers
up to $70 million from crop and livestock losses alone
(DAFF, 2012).

There may be some limited benefits for agricultural
industries from rising atmospheric carbon dioxide (CO2),
as some plants can become more efficient at using water
in a high CO2 environment. However, any benefits are likely
to be outweighed by the negative impacts of a changing
climate. For example, higher CO2 concentration means
that plant matter is less nutritious (Taub et al., 2008).
Even a doubling of CO2 concentrations in the atmosphere,
which would cause dramatic changes to the global
climate, is unlikely to offset rainfall declines of greater
than 10% of the annual totals (Crimp et al., 2002).
                                                                Beef cattle in Queensland are likely to suffer heat
                                                                stress more frequently.
6   Climate Commission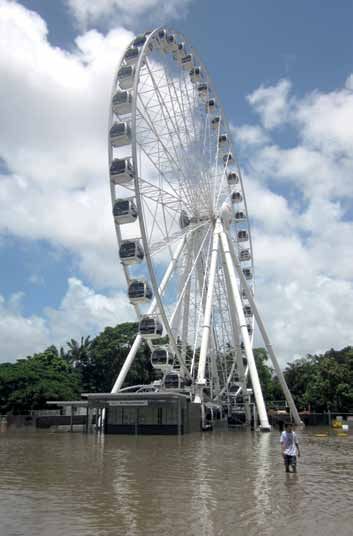
The Critical Decade: Queensland climate impacts and opportunities (continued)

Sugar                                                             Fruit and vegetables
The sugar industry contributes more than $1.7 billion per         One third of Australia’s fruit and vegetable production
year to the Queensland economy and accounts for over              comes from Queensland – more than 120 types of fruit and
90% of all sugar produced in Australia (QSL, 2012). Overall,      vegetables in total – and the industry employs around
sugar production in Australia is expected to decline as a         25,000 people (QFF, 2008). Horticultural industries are more
result of climate change (ABARE, 2007). In the north,             sensitive than many other agricultural sectors to climate
potential increases in rainfall may increase waterlogging,        change, particularly changes to temperature and reduced
limit paddock access and reduce yields and sugar content          rainfall (Deuter et al., 2006). As the climate changes, some
through reduced sunshine, physical damage, and leaching           crops will not be able to be grown where they are grown
of nutrients. Crops in coastal areas may be affected by           now. Heat stress, increased irrigation demand, reduced
rising water tables and salinity, made worse by rising sea        chilling and maturing times, and increased pest and
levels (QFF, 2008). There may be limited benefits to sugar        disease problems are likely (QFF, 2008). Rising temperatures
production from increasing atmospheric CO2 and higher             will affect yield, quality, and the length of the growing
temperatures (QFF, 2008; Park et al., 2010). Overall, the story   season for crops such as tomatoes and lettuce, although
for the sugar industry is that climate change poses               development of more heat-tolerant cultivars may offset some
significant and damaging risks.                                   of these impacts (Deuter et al., 2010a; Deuter et al., 2010b).

                                                                  Cotton
                                                                  Queensland normally produces about 30% of the nation’s
                                                                  cotton crop but drought can cut production dramatically
                                                                  (QFF, 2008). In the Queensland part of the Murray-Darling
                                                                  Basin, any significant reductions in average rainfall in the
                                                                  winter growing period could reduce availability of water
                                                                  for irrigation in spring and summer, resulting in lower
                                                                  production in the region (QFF, 2008). Fibre quality and
                                                                  quantity of both irrigated and dryland cotton is significantly
                                                                  affected by temperature and water availability. Decreases
                                                                  in the number of cold days due to climate change may
                                                                  prove beneficial to cotton production in some regions, but
                                                                  increasingly hot temperatures may also adversely affect
                                                                  production (QFF, 2008).

                                                                  Winter and summer cereals
                                                                  Assessments of cereal production by 2030 predict a
                                                                  7–15% decline as a consequence of climate change
                                                                  (Potgieter et al., 2012). Winter cereals used in intensive
                                                                  livestock industries (e.g. wheat and barley) are worth
                                                                  $2.5 billion to the state´s economy, while other broadacre
                                                                  field crops are estimated to be worth an additional
                                                                  $675 million (DEEDI, 2011). Increased temperatures and
                                                                  changes to seasonal rainfall are expected to have an overall
                                                                  negative impact on cereal production in Queensland.

                                                                  Fisheries and aquaculture
                                                                  80% of Australia’s prawn farms are located in flat coastal
                                                                  areas of Queensland. Prawn farms are at risk of damage
                                                                  from rising sea levels, increased floods, and increased
Extreme weather events can have a significant                     cyclone intensity (QFF, 2008). Coastal fisheries may be
impact on the availability and cost of Queensland                 affected directly by rising ocean temperatures and changes
fruit and vegetables. The destruction of banana                   in ocean productivity, as well as indirectly by changes in
crops after Cyclones Yasi and Larry led to significant            the runoff from land due to altered rainfall (Meynecke and
increases in banana prices around Australia.                      Lee 2011; Munday et al., 2012).
                                                                                                                                 7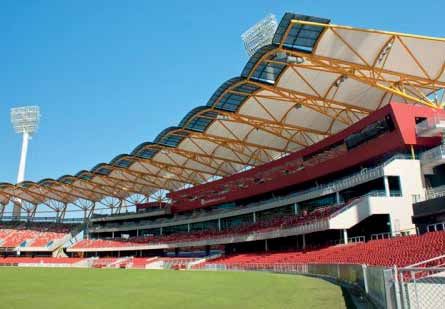
The Critical Decade: Queensland climate impacts and opportunities

2.3 Coasts at risk

    – The risks of coastal flooding and beach erosion will
       increase for many areas of the Queensland coast.
    – Moreton Bay, Mackay, the Gold Coast, the Sunshine
       Coast, Fraser Coast and Bundaberg local government
       areas are the most at risk from rises in sea level
       together with high tides, storm surges and heavy
       rainfall.

Queenslanders enjoy living close to the ocean – 85% of the
state’s population (3.8 million people) live near the coast
(DERM, 2011b). Rising sea levels pose considerable risk to
coastal property, infrastructure and beaches through
coastal flooding and erosion (Figure 5).

As described in Section 1.4, experts agree that global sea
level is likely to rise 50–100 cm by 2100 compared to 2010.
Even at the lower end, a 50 cm increase in sea level would
                                                                Figure 6. Estimated increase in the frequency of
contribute to a significant increase in the frequency of
                                                                high sea-level events from a rise of 50 cm in sea
coastal flooding (Figure 6).
                                                                level. Such a seemingly modest rise in sea level
Coastal flooding occurs during extreme weather events           will lead to a very large increase in the frequency
such as storms, which can drive a surge of seawater             of coastal flooding. For example, a thousand-fold
onto vulnerable coastal areas. These storm surges, when         increase in high sea-level events means that
combined with a high tide, rising sea level and heavy           flooding that currently occurs only once in
rainfall on coastal catchments, increase the risk of flooding   100 years would occur almost every month.
to property, infrastructure and beaches. North Queensland,      Source: ACE CRC 2008
in particular, is vulnerable to coastal flooding, as more
intense tropical cyclones could drive very large storm surges
as well as heavy rainfall. Flooding caused by a combination
of a high tide, a storm surge and rising sea-level is often
called a ’high sea-level event’.

Figure 5. There are two main impacts of sea level rise: flooding and erosion.
Source: modified from ACE CRC

8   Climate Commission
K A L L A NG UR
WO ODY P O INT
MU R R UMB A DO WN S
G R IF F IN
The Critical Decade: Queensland climate impacts and opportunities (continued)
L AWNT O N
B R IG HT O N
S T R AT HP INE
B A L D HIL L S
S A N DG AT E
B R E NDA L E B R A C K E N R IDG E
DE A G O N S HO R NC L IF F E
MU D IS L A ND
F IT ZG IB B O N
TA IG UM
C A R S E L DINE
Box 1. Torres Strait Islands
B OO NDA L L NUDG E E B E A C H
B R IDG E MA N DO W NS
ZIL L ME R E
AS P LE Y
NUDG E E
Many Torres Strait Islands are already vulnerable to
flooding, but rising sea levels will worsen this
G E E B UNG
VIR G INIA
B A NY O
vulnerability. Around 7,000 people live on 18 of the 274
MC DOWA L L
C HE R MS IDE W E S T
C HE R MS IDE
S T HE L E NA IS L A ND
P O R T O F B R IS B A NE
NOR T HG AT E
small islands between northern Cape York and the coast
WAV E L L HE IG HT S
E A G L E FA R M
S TA F F OR D HE IG HT S
E V E R T ON PA R K
of Papua New Guinea (AHREOC, 2008). Many of the
NUNDA H
K E DR ON
P INK E NB A
S TA F F OR D
G O R DON PA R K WO OL OO WIN
C L AY F IE L D HE N DR A islands are already very low-lying and exposed to the
G R A NG E LYT TO N
impacts of storm surges, king tides and flooding,
L UT W Y C HE
A L DE R L E Y G R E E N IS L A ND
A S C OT
A L B IO N
particularly the islands of Boigu and Saibai where
NE W MA R K E T WIL S T O N WINDS O R
HA MILT ON WY NNUM
R E D H IL L
K E LV IN G R O V E
HE R S T O N
B OW E N HIL L S
B UL IMB A
MU R A R R IE
HE MMA NT
WY NNUM W E S T
MA NLY average height of communities is already below highest
astronomical tide (the highest tide under average
NE W S T E A D
F OR T IT UDE VA L L E Y T E NE R IF F E B A L MO R A L
S P R ING HIL L
MO R NING S IDE
conditions; TSRA, 2010).
HAW T H OR NE
NE W FA R M MA NLY W E S T MO R E T ON B AY
B R IS B A NE L OTA
C A NNO N HIL L T ING A L PA
K A NG A R OO P O INT NOR MA N PA R K
S O UT H B R IS B A NE
S E V E N HIL L S
WA K E R L E Y
Major airports, including Brisbane airport (above) Sea level in the Torres Strait region has been rising at
E A S T B R IS B A NE T HOR NE S IDE
R A NS OME
C A R INA WE L L ING T O N P O INT
WO OL L OO NG A B B A
and Cairns airport are vulnerable to sea-level rise C OO R PA R OO
C A MP HIL L G UMDA L E
B IR K DA L E double the global average, at approximately 6 mm per
and storm surge (OCC, 2010). Coastal flooding can A NNE R L E Y
G R E E NS L OP E S
C A R INA HE IG HT S C A R INDA L E
B E L MONT year (Suppiah et al. 2011). An increase in average sea level
OR MIS T ON
also cause significant damage to infrastructure such will result in increased frequency and severity of high
C HA NDL E R
C A PA L A B A WE S T
HOL L A ND PA R K
as roads, water supply and sewerage. TA R R A G INDI HOL L A ND PA R K W E S T
MO UNT G R AVAT T E A S T
A L E XA NDR A HIL L S
sea-level events. C L E VE L A ND
Source: DCCEE (2010)
MA NS F IE L D
MO UNT G R AVAT T
MA C K E NZIE
Major flooding events in 2005, 2006 and 2009 affected
C A PA L A B A
NAT HA N
At the high end of climate change projections, sea level
UP P E R MOU NT G R AVAT T
WIS HA R T
B UR B A NK
roads, residential buildings, cultural sites and community
could rise by 110 cm over this century compared to 1990. MA C G R E G OR
R OC HE DA L E gardens and affected the function of waste treatment
T HOR NL A NDS
This level would threaten up to 1,400 existing commercial E IG HT MIL E P L A INS facilities (Green, 2006; Green et al., 2008; J. Rainbird, pers
buildings in Queensland, with a replacement value of S HE L DON
comm. 13 September 2012). Although these flooding
$10 – $15 billion, and up to 1,800 light industrial buildings,
VIC T O R IA P OINT
R OC HE DA L E S O UT H events have not been linked directly to climate change,
with a value of $1.3 – $2 billion (DCCEE, 2011). An estimated UNDE R W O OD
P R IE S T DA L E
they demonstrate a window to the future as the average
35,900 to 56,900 existing residential buildings in Queensland S P R ING WO OD MO UNT C OT T O N sea level continues to rise (Green et al., 2008).
may also be at risk of flooding from sea-level rise (DCC, DA IS Y HIL L
2009). Storm surges were not included in this assessment, S L ACK S CR E E K
Torres Strait communities are particularly vulnerable
R E DL A ND B AY
and it is likely a higher number of properties would have S HA IL E R PA R K because the remoteness and small size of the islands can
beensea-level
C limate change, identified at risk if it had been (DERM, 2011b). C OR NU B IA
make recovery from storm events difficult, and because of
ris e and coastal inundation
Local government areas with the highest number of TA NA H ME R A H
the social and economic disadvantages faced by many
C A R B R O OK
Location: B R IS B A NE A ND G OL D C OA S T R E G ION, QL D
Dis c laimer properties at risk from a 110 cm sea-level rise and a high L OG A NHO L ME
islanders (DCC, 2009; TSRA, 2010).
sea-level rise. The imagetide include included here Moreton Bay, Mackay, the Gold Coast, the
This image has been developed to help communicate the risks of
and the information are not
provided as professional advice, and should not be relied upon for
Sunshine Coast,
site-specific decision-making or for making financial or any other
commitments. For decision-making purposes, appropriate
Fraser Coast and Bundaberg (DCC, 2009). E AG LE B Y
Large sea-level rises could completely inundate some
independent professional advice should be obtained.
The Commonwealth does not guarantee the accuracy or completeness
Torres Strait islands (TSRA, 2010), forcing communities to
A L B E R T ON
High sea-level events can also contribute to the erosion relocate to islands with higher ground or to mainland
B E E NL E IG H
of the image. The Commonwealth expressly disclaims liability for any
loss, however caused and whether due to negligence or otherwise,
arising directly or indirectly from the use of or reliance on this image
of coastlines and eventual coastal retreat. Erosion can
or the information contained in it, by any person.
MO UNT WA R R E N PA R K
Australia (AHREOC, 2008). Forced relocation would cause
S TA P YLT ON
WO ONG OO L B A
S c enario
cause the loss of iconic beaches and damage property a variety of social, cultural and economic difficulties
This image shows a modelled high sea-level rise scenario of 1.1m G IL B E R T O N
and infrastructure.
relevant to a 2100 time period. The model combines the sea-level rise
scenario with nominal highest astronomical tide (HAT) values for inside There are around 15,200 residential because the Torres Strait Islanders’ culture relies heavily
inside bay and Brisbane, Gold Coast and the open coast, to provide two
YATA L A
buildings
inundation levels of 2.6m (IBB) and 2.2m (OCGC) .
within
The two regions are marked in the image. The inundation portrayed
110 m of erodible coastline in Queensland on connection with country (Green, 2006).
is based on a simple ‘bucket fill’ approach and should be considered
as approximate only. The (DCC,
actual impacts may2009).
NOR W E L L
vary as this model does
not take account of existing sea walls, storm surge, erosion or other OR ME A U
local factors. The model depicts sea-level rise only and does not
include catchment flooding from rainfall events. Images such as these
can change over time as new information emerges.
The heavily populated coastal regions of southeast
The image has been developed using a high resolution digital elevation
model that has been hydrologically conditioned and enforced to
will flow over the land).
Queensland – the Gold Coast, Moreton Bay, Brisbane
represent a natural ground surface model (i.e. to show how water OR ME A U HIL L S
P IMPA MA
0.0m AHD
and the Sunshine Coast – are a magnet for tourism and
Inundation Level
development,
S cale = 1:40,000
with the gross tourism value of the Gold
K ING S HO L ME
0 Coast beaches alone estimated to be between $106 and
1 2 3 4
K ilometres
$319 million in 2006 (DERM, 2011b). After the Gold Coast
(Box 4), Moreton Bay and the Sunshine Coast have UP P E R C O OME R A
© Commonwealth of Australia 2010
2,250 and 1,850 residential buildings respectively within
110 m of erodible coastline (DCC, 2009). Inundation at Saibai Island, Torres Strait in 2010.
9The Critical Decade: Queensland climate impacts and opportunities
2.4 Plants and animals Queensland’s marine systems are among the most diverse
in the world (Box 3). Moreton Bay in southeast Queensland
– Heat and extreme weather events threaten the is one of the largest estuarine bays in Australia, covering
survival, breeding and regeneration cycles of many 3,400 square kilometres. The marine park contains an
plants and animals. enormous variety of habitats including coral reefs, mangroves,
– Climate change will increase the risk of extinction sandy beaches, saltmarshes and seagrass beds. These
for many of Queensland’s species. systems are vulnerable to rising sea level, especially in
– Many of Queensland’s iconic natural ecosystems areas where urban development prevents them taking hold
such as the Great Barrier Reef and World Heritage in new areas inland (Lovelock et al., 2011; Traill et al., 2011).
tropical rainforests will become increasingly
Many species and natural ecosystems are already stressed
threatened as the climate continues to change rapidly.
as a result of human pressures such as land clearing, urban
development and introduced species, making it harder for
Queensland is host to around 1,386 different ecosystems
them to respond to the changing climate. Reducing these
that support 70% of Australia’s native birds, 85% of its
human pressures can make these systems more resilient
mammals and just over half of the nation’s reptiles and
to the stress of climate change. One strategy, aimed at
native frogs. (DEHP, 2012a). Many of these species are only
assisting species to change their distribution in response
found in Queensland (DERM, 2011c). Many of Queensland’s
to climate change, is to connect areas of suitable habitat.
species and ecosystems are already threatened – more than
For example, the Great Eastern Ranges Initiative aims to
200 of its ecosystems are currently listed as endangered
link and protect ecosystems from the Victorian Highlands
and more than 500 as vulnerable (DERM, 2010). Climate
to the Atherton Ranges, allowing species to migrate and
change poses a serious additional threat to Queensland’s
respond to climate change.
unique biodiversity.
Biodiversity has many benefits, such as regulating the
quality and flow of freshwater, maintaining soil fertility,
and preventing erosion. Healthy ecosystems benefit people
and economically important sectors including agriculture
and tourism (MEA, 2005).
The responses of animals and plants can provide a readily
visible indication of a changing climate (Box 2). Many birds
and insects in Queensland are now found at more southerly
locations or at higher elevations because they have migrated
toward cooler temperatures (e.g. Chambers et al., 2005).
Aspects of animal and plant life cycles, such as migrations
and flowering, are also changing in response to a hotter
climate (Steffen et al., 2009). If the Queensland climate becomes hotter and drier,
it is likely reduce the habitat suitable for koalas, in
Plants and animals in the high altitude areas of the addition to habitat pressures from human activities
Wet Tropics World Heritage Area are especially vulnerable (Adams-Hosking et al., 2011). Rising concentrations
to climate change. Many species in this region are already of atmospheric CO2 could also affect leaf-eating
at the limits of their range and face high risks of extinction animals like koalas because the plants they live on
from temperature rise and potential reductions in rainfall become less nutritious as CO2 increases (Kanowski,
(Shoo et al., 2011). 2001). Koalas suffer greatly during drought with
populations in southwest Queensland declining by
Queensland’s fire-prone tropical savannas, grasslands and an estimated 80% between 1995 and 2009 (Seabrook
dry eucalypt forests provide habitat for many plants and et al., 2011).
animals, and are also at risk as the climate warms further. Source: Flikr/Tom Tarrant
Bushfires are expected to become more frequent and more
intense, affecting the ability of species and ecosystems to
bounce back from fire damage.
10 Climate CommissionThe Critical Decade: Queensland climate impacts and opportunities (continued)
Box 2. Examples of some key species impacts in Queensland
TURTLES
The sex of turtles is determined by the temperatures of
the nest – at about 30oC only female turtles are born,
endangering future successful breeding.
CORAL REEFS Nest sites may also be affected by any increase in intensity
Sea temperatures 1–2°C above normal can cause mass of tropical cyclones, and rising sea level could flood
coral bleaching. important nesting beaches (Fuentes et al., 2011; GBRMPA, 2009).
SEABIRDS WET TROPICS
Some seabirds have failed to breed at all in years where Animals such as the mahogany glider and lemur-like
sea temperatures have been high, due to the reduced ringtail possum could lose a large portion of
availability of fish (Smithers et al., 2003). climatically-suitable habitat. (DSEWPAC, 2006)
11The Critical Decade: Queensland climate impacts and opportunities
Box 3. Climate change and the Great Barrier Reef
The Great Barrier Reef (GBR) is the world’s largest
continuous reef system (over 2,200 km long, and 375,000
square kilometres in area), and comprises more than 2,900
individual reefs. The GBR is one of the most biologically
diverse ecosystems in the world and is a globally-important
breeding ground for seabirds and other marine vertebrates
such as turtles and whales (GBRMPA, 2009). The reef is
vital to Australia’s tourism and fishing industries, attracting
five million visitors to the region in 2008–2009 (Stoeckl et
al., 2011). In 2006–2007, the GBR was estimated to Higher average temperatures will cause increasing
contribute $5.4 billion to the Australian economy, and amounts of coral bleaching in the Great Barrier Reef.
provided more than 50,000 jobs (Access Economics, 2008). Source: Great Barrier Reef Marine Park Authority
The GBR also provides protective services to coastal
communities valued at more than $10 billion (Oxford In addition to the impacts of warming waters, corals and
Economics, 2009). other marine organisms are likely to be affected by ocean
acidification. The world’s oceans are approximately 30%
Climate change poses multiple, serious threats to the GBR more acidic than in pre-industrial times due to their
(Johnson & Marshall, 2007). Sea temperatures only 1–2°C absorption of CO2 from the atmosphere (Howard et al., 2012).
above the average summer maximum (based on the period Acidification is expected to reduce the rate of reef growth
1985–93, excluding 1991–92) can cause mass coral and makes corals and other organisms more fragile.
bleaching (loss of symbiotic algae) (Hoegh-Guldberg et al., Further serious impacts from rising sea levels, increasing
2007) and lower their growth rate (De’Ath et al., 2009). coral diseases and physical damage from any intensification
If high temperatures (2–3°C above normal) are prolonged in tropical cyclones are also expected (Veron et al., 2009).
or persistent (more than eight weeks) bleached corals will The GBR has been affected by five severe tropical cyclones
die in increasing numbers. Before 1979 there were no between 2005 and 2011, with Cyclone Yasi being the
records of bleaching on the GBR but since that time at largest tropical storm system in recorded history to cross
least nine bleaching episodes have occurred (Anthony and the GBR (Anthony and Marshall, 2012).
Marshall, 2012). Ocean temperatures in the region have
warmed by over 0.45°C since 1980 with the highest The ability of coral reefs to adapt to global warming is a
temperatures ever recorded occurring in the summer of 2010 matter of contention. While laboratory experiments suggest
(Lough et al., 2012). With the current rate of warming, reefs that some adaptation is possible, the rate of climate change
could suffer a chronically high level of bleaching by the mid is likely to be too rapid for most coral reef organisms to keep
to late part of this century (Anthony and Marshall, 2012). pace and for the critical goods and services provided by
the Great Barrier Reef ecosystem to be maintained (Hoegh-
Guldberg, 2012). This means that substantial negative
impacts are likely not only for reef biodiversity but for the
tourism and fishing industries that the reef supports.
Management actions to increase resilience of coral reef
systems include protecting herbivorous fish (who play
important ecological roles), as well as top predators,
reducing coastal sediment and nutrient runoff (Brodie et al.,
2012), and minimising other human disturbances by
increasing marine protected areas (Hughes et al., 2007;
Veron et al., 2009; Wooldridge et al., 2012). Management
initiatives such as the Reef Water Quality Protection Plan,
Reef Rescue, and the Representative Areas Program (which
The reef is vital to Australia’s tourism and fishing expanded totally protected areas on the GBR from 4.6% to
industries. over 33%) are strategies to improve the ability of coral reefs
Source: Great Barrier Reef Marine Park Authority to endure the rising pressure from rapid climate change.
12 Climate CommissionThe Critical Decade: Queensland climate impacts and opportunities (continued)
Box 4. Tourism in Queensland
Tourism contributes
$17.7
46%
of tourists visiting
Australia come to
billion
to the Queensland
economy – or about
7% of Queensland’s
Queensland (TA, 2012). Gross State Product
(TQ, 2012b).
18 Tourism directly and
million indirectly employs
Daintree
(wet tropics)
world heritage
overnight visitors
come to Queensland
every year (QG, 2012b).
120,000
Queenslanders (QG, 2012a).
Higher temperatures
and changing rainfall
will place the rainforest Domestic visitor
in a highly stressed expenditure during
situation towards the 2011/12 rose
18%
end of the century
(Liddell, 2010).
Many species in this
region are already at Great Barrier Reef
(TQ, 2012a).
the limits of their Marine Park
range and face Visitors to tropical North
Queensland spent around
high increased
risks of
extinction. $6.2
billion
in the year ending March 2012
(TQ, 2012d). Gold Coast
International visitors to
‘T he health of the Reef the Gold Coast in 2011/12
and the sustainability spent a total of
of its tourism industry
are inextricably linked’
(GBRMPA, 2011). $833
The quality of many reef
sites has been affected by
million
(TQ, 2012c).
coral bleaching (GBRMPA, 2011).
Sandy beaches under
threat from erosion caused
by rising sea levels.
4,750
Gold Coast residential
buildings are within 110 m
of erodible coastline.
Preparing for the impacts of climate change can build Acting on climate change by reducing greenhouse gas
resilience in the tourism industry. For example, on the Gold emissions is critical to limit the impacts. Box 6 has
Coast sand is pumped onto beaches to support the tourist examples of how tourist destinations and operators are
experience. However, these responses have costs; Gold already playing their part by reducing emissions.
Coast City Council spends between $2.5 and $3.5 million
replenishing sand stocks each year (Westthorp, 2012).
13The Critical Decade: Queensland climate impacts and opportunities
3. Opportunities 3.1 Renewable energy
With the impacts and risks clearly set out by scientists
across the globe, the next chapter of the climate story is – Queensland has abundant renewable resources,
about finding solutions that minimise the risks of climate including solar resources that are among the best
change while providing extra benefits for our health, in the world.
community, economy and environment. – Use of solar energy in Queensland has doubled in
less than two years.
Harnessing renewable and clean energy and using resources
more efficiently will create business opportunities and Investment in clean energy is growing globally. In 2011,
help some businesses save money and improve productivity. US$257 billion was invested in renewable energy worldwide
This is not to deny that there will be costs in the short (Frankfurt School UNEP Centre, 2012). This represents
run for some industries and communities, and that the growth of 6.5% from 2010, a level that outpaces growth in
rate of economic growth will be slowed. Short-term costs the overall global economy for the same period (PET, 2012).
of transition have been found to be outweighed by the In Australia, $4.9 billion was invested in clean energy in
costs to the economy of a changing climate and also 2011, mostly in solar projects (PET, 2012). In Queensland,
increasing costs the longer action is delayed (Stern, 2007; $2.7 billion was invested in renewable energy over the
Garnaut, 2008). 2009–2011 period, mostly for small-scale solar installations
(Queensland Government, 2012a).
Many of the opportunities in tackling climate change are
less well understood than the costs, which have often been The clean energy industry employed about 8,000 full-time
the centre of discussions. This report illustrates some of the equivalent staff in construction, operations and maintenance
opportunities that are particularly relevant to Queensland. across Australia in 2010 (CEC, 2011a). Of this total, 22% of
jobs were in Queensland, mainly in biomass energy
As Australia moves to reduce greenhouse gas emissions, facilities (CEC, 2011a). In comparison, the rest of the
levels of investment, employment and income are likely to Australian electricity supply industry directly employed
continue to grow strongly. However, the types and locations around 48,000 workers (ABARES, 2011).
of jobs may change and there will be a premium on
innovation and flexibility. Fortunately, Australia has Solar
demonstrated that it can deal well with business challenges Queensland has some of the world’s highest levels of solar
– pressure on profits provides a strong incentive to rethink exposure and low levels of solar variability, making it an
business models and firms are more likely to be innovative ideal location for solar energy generation (Queensland
(Dolman and Gruen, 2012). For example, 252 of Australia’s Government, 2010; Parsons Brinckerhoff, 2010). Solar
top energy-consuming businesses have already saved more photovoltaic (PV) electricity generation represents about
than $800 million in annual energy costs with a range of 4%* of total generation capacity in Queensland.
energy efficiency measures (DRET, 2012).
Solar Photovoltaic (PV)
Periods of economic and technological change tend to
Solar PV electricity generation is increasingly popular
mean that some operations and industries will diminish,
among households and businesses in Queensland
while other firms and industries grow. While the structural
(Figure 7). The state has the largest installed solar PV
changes associated with tackling climate risks should
capacity in Australia, at over 475 megawatts (MW), and the
not be taken lightly, they are not likely to be as significant
most installations – more than 209,000 as at 30 June 2012
as other pressures for change – arising from a sustained
(Wills, 2012). Use of solar energy in Queensland has doubled
strong exchange rate, strong demand for resources and
in less than two years (Queensland Government, 2012b).
agricultural exports, and the impact of the information
Current projections show that the yearly contribution of
technology and communication revolution.
rooftop solar PV to Queensland’s energy mix is likely to
double over the next 10 years and in a high uptake scenario
may even quadruple (AEMO, 2012a).
* Based on available data. Percentage figure calculated using solar PV
capacity at 30 June 2012 (Wills, 2012) and Queensland’s total expected
generation capacity of 12,200 MW for summer 2012 (AEMO, 2012b).
14 Climate CommissionThe Critical Decade: Queensland climate impacts and opportunities (continued)
Figure 7. Installed solar PV capacity (MW) in
Queensland, 2008 and 2011.
Source: Queensland Government, 2012b
While the vast majority of solar PV installations have been
small-scale, there have also been some medium- and
large-scale installations. For example, the University of
Queensland hosts Australia’s largest PV array. The 1.22 MW
PV system at the St Lucia campus is about 25% larger
than any other rooftop system in Australia and covers
four buildings (UQ Solar, 2012). The PV system will meet
approximately 6% of the annual electricity needs of the
campus, the equivalent of taking 335 cars off the road, and
will avoid about 1,750 tonnes of greenhouse gas emissions
each year (UQ Solar, 2012).
Solar PV is also being used in sporting stadiums. The Gold
Coast’s Metricon Stadium is the first in Australia with a
‘solar halo’ as part of the roof. The stadium won the 2011
EcoGeneration award for an outstanding large-scale clean
energy project (Metricon Stadium, 2012). The system University of Queensland’s ground-mounted
provides 215 kilowatts (kW), or around 20%, of the stadium’s Concentrating PV array, which tracks the sun across
total electricity (Metricon, 2012). The Townsville RSL the sky each day.
stadium has a rooftop solar PV system with capacity of 335
kW, enough to supply around two-thirds of the stadium’s Globally, the cost of producing solar PV cells has dropped
daytime power use (Townsville Queensland Solar City, 2008). 75% in the past four years and 45% in the past 12 months
(BNEF, 2012). Electricity generated from solar PV panels has
been estimated to already be cheaper than retail electricity
prices in some areas of Australia and is projected to be
competitively priced in the next few years (Bazilian et al.,
2012; BNEF, 2012). Solar PV (along with wind) could be the
cheapest form of power in Australia by 2030 (BREE, 2012).
The “challenge is to elegantly transition solar energy from
a highly promising and previously expensive option to a
highly competitive player” in the electricity industry
(Bazilian et al., 2012).
The Gold Coast’s Metricon Stadium ‘solar halo’
provides 20% of the stadium’s electricity needs.
15The Critical Decade: Queensland climate impacts and opportunities
Concentrated Solar Thermal (CST)
There is also potential for large-scale solar power generation
in Queensland (Queensland Government, 2010; Queensland
Government, 2012b; Parsons Brinckerhoff, 2010).
Queensland receives significant direct (as opposed to
diffuse) sunlight, making concentrated solar thermal (CST)
an efficient method to generate electricity. CST uses mirrors
to reflect sunlight into a small area to heat fluids or salts.
These heated fluids then drive an engine (usually a steam
turbine) which converts the energy into electricity.
Queensland experiences levels of radiation that compare
favourably with existing solar thermal generation sites in
the United States and Spain (Queensland Government,
2010; Figure 8). Queensland also experiences low variability
in solar radiation throughout the year, which is most favourable
for setting up a CST plant (Parsons Brinckerhoff, 2010).
CST can lower the emissions-intensity of existing fossil-fuel
power plants, and provide power during daytime peak
loads and baseload power when combined with thermal
storage. The primary challenges of using CST include Figure 8. Queensland receives high levels of direct
identifying the best locations with access to main solar radiation (measured as DNI), with many
transmission lines and the current high cost of the locations higher than existing CST sites around
electricity produced (ASI, 2012). However, costs per unit the world.
of energy are expected to decline as the technology is
adopted more widely (Lovegrove et al., 2012). Typical levels of DNI for locations at Nevada USA and
Andasol I, Spain (locations of operating CST plants) are
CST is already being developed on a commercial scale in 24.1MJ/m²/day and 20.71MJ/m²/day respectively.
Queensland. The 44 MW Kogan Creek Solar Boost Project,
currently being constructed, will be the largest solar
integration project in the world (CS Energy, 2012). The
project will provide a solar thermal addition to the existing
750 MW coal-fired Kogan Creek Power Station to pre-heat
steam for the boilers, increasing efficiency, capacity and
life expectancy (CS Energy, 2012). At peak solar conditions,
the project will be able to supply up to 44,000 megawatt
hours (MWh) of electricity each year (CS Energy, 2012).
Concentrated solar thermal uses mirrors to reflect
sunlight into a small area and heat fluids or salts.
16 Climate CommissionThe Critical Decade: Queensland climate impacts and opportunities (continued)
Solar hot water
Solar energy can also be used to heat water. A solar hot
water system is cost effective in comparison to a
conventional electric hot water system and produces
minimal greenhouse gas emissions (CEC, 2011a). For
example, a solar hot water system can reduce typical
household water heating emissions by between 60 and
90% depending on the location (CEC, 2011b).
Around 14% of Queensland households have solar hot water
systems. This has increased significantly in recent years
(Queensland Government, 2012b).
Waste from sugar mills can be used to produce
electricity.
Box 5. Energy from waste
Thiess Services currently owns and operates Swanbank
renewable energy and waste management facility, a
landfill site made up of 250ha of former coal mines in
Ipswich. As one of the largest landfill sites in Australia,
Swanbank accepts 500,000 tonnes of waste each year
(Thiess Services, 2012).
Figure 9. Installed solar hot water capacity (MW)
in Queensland, 2008 and 2011. The site has a pilot plant of an innovative decomposition
Source: Queensland Government, 2012b process using organic waste to produce ‘biogas’ (gas
from renewable sources). The process significantly
Bioenergy accelerates the production of biogas. The gas is fed
Queensland’s installed capacity for producing electricity through the Swanbank site gas collection system, and
from waste products totals 429 MW, which is about 55% of piped to a neighbouring coal-fired power station, where it
the total capacity across Australia (CEC, 2011a). Sugar cane produces approximately 56,000 MW hours of electricity
waste (bagasse) is the main source, with some additional each year. This represents a reduction of around 147,000
generation from landfill (Box 5) and sewage methane tonnes of greenhouse gas emissions each year (Thiess
gas. There are 44 biomass plants with capacity of more Services, 2012).
than 100 kW operating in Queensland (CEC, 2011a and
Queensland Government, 2012a).
Tully Sugar Mill is one of the largest biomass energy producers
in the state (Queensland Government, 2012a). The mill
generates 99.5% of its total annual energy usage by firing
steam boilers with waste material from sugar production
(Tully Sugar, 2012). It also exports 10 MW of electricity to
the Queensland electricity grid (Tully Sugar, 2012).
Racecourse Mill, operated by Mackay Sugar, is powered
through sugar cane waste bagasse. The energy generated
at the mill also powers a sugar refinery. In 2007, the bagasse This photo shows three of the biocells at the
storage area capacity was increased from 70,000 to 96,000 Swanbank Renewable Energy Facility. Two contain
tonnes. The expansion saved $759,000 each year (with a organic waste and one contains leachates (liquid
pay-back period of 2.14 years), and 21,850 tonnes of waste); the gas produced from the decay of this matter
greenhouse gas emissions. A further 38 MW of bagasse is collected by the pipes on the left of the photo.
energy generation capacity is now under construction at Source: Swanbank Renewable Energy Facility
the mill (Mackay Sugar Limited, 2012).
17The Critical Decade: Queensland climate impacts and opportunities
3.2 Business Business practices
There are many ways that businesses can save money
– Large, medium and small businesses are already and reduce greenhouse gas emissions. For example,
saving money and reducing greenhouse gas production systems may be upgraded, energy-efficient
emissions by becoming more efficient technology may be installed, and energy use can be
– Buildings can be designed to minimise energy better monitored and controlled.
costs and greenhouse gas emissions.
Businesses around Queensland are already reducing
their costs and greenhouse gas emissions. For example:
The transition to an economy with lower greenhouse gas
emissions provides opportunities for Queensland businesses –P
AC Foundry in Maryborough, one of Australia’s largest
to use clean energy and become more efficient. In addition foundries, saves more than $100,000 each year and
to saving money through reduced electricity bills, other has reduced its greenhouse gas emissions by upgrading
benefits can include better product quality, improved employee its manufacturing processes. The foundry replaced
health and safety, and competitive advantages (Box 6). its original 1978 furnace and installed a new sand-
handling system (Ecobiz, 2008). In addition to saving
Australia’s largest energy-using companies in the mining energy, product quality is higher and occupational
sector have identified net financial benefits of $257.3 million safety has improved (The Compass, 2005).
a year from energy savings projects, more than any other – The Currumbin RSL Club on the Gold Coast has
business sector. Coal mining companies reported the reduced energy use by 13% (the equivalent of 19
highest financial benefits per unit of energy saved, at $41.08 households) waste removal by up to 70% and
per gigajoule (DRET 2012). The areas with potential for greenhouse gas emissions by 4% (the equivalent of
energy savings identified by mining companies included 20 cars) since 2010 (DEHP, 2012). The club’s energy,
staff operation, maintenance procedures, energy water and waste initiatives have saved around $55,000
measurement, process control and retro-fitting with more and all initiatives have had a payback period of less
efficient or new technologies. than two years (Currumbin RSL, 2012). Savings
measures included energy-efficient lighting and a more
efficient hot water system. (Currumbin RSL, 2012).
– By reducing its energy and water use the Noosa Aquatic
Centre on the Sunshine Coast is avoiding 215 tonnes of
greenhouse gas emissions and saving approximately
$52,086 annually (DEHP, 2011). The centre has installed
a water recycling unit and variable-speed drives to
reduce the energy required to operate the pool pumps
(DEHP, 2011). In addition, pool water is pre-heated by a
solar heating system (DEHP, 2011).
The River Quay building in Brisbane’s South Bank
demonstrates a number of passive design features.
Source: Gollings Photography Pty Ltd
Noosa Aquatic Centre has reduced greenhouse gas
emissions and costs by having more efficient pool
pumping and using solar water heating.
18 Climate CommissionYou can also read