REPORT PIEVC Assessment of Three City Parks - Prepared for
←
→
Page content transcription
If your browser does not render page correctly, please read the page content below
REPORT: PIEVC Assessment of Three City Parks

                                     REPORT
          PIEVC Assessment of Three City Parks

                                   Prepared for:
                                City of Mississauga

                                      4 July 2018

4 July 2018                                           1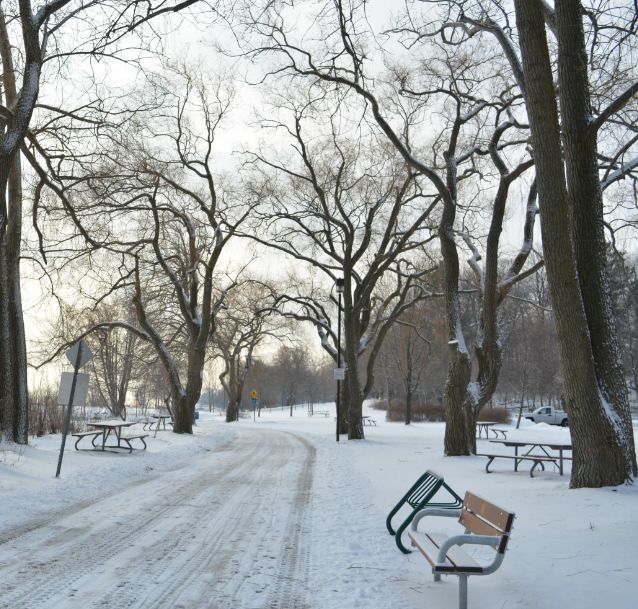
REPORT: PIEVC Assessment of Three City Parks

                                                                        Contents

1.     Introduction .......................................................................................................................................... 5
     1.1      Project Scope ................................................................................................................................ 5
     1.2      The PIEVC Protocol........................................................................................................................ 7
       Modifications ........................................................................................................................................ 8
2.     Assessed Infrastructure Descriptions.................................................................................................... 9
     2.1      Park Boundaries ............................................................................................................................ 9
     2.2      Hard Infrastructure ..................................................................................................................... 11
       2.2.1          Streetsville Park Specific Hard Infrastructure ..................................................................... 12
       Jack Darling Specific Hard Infrastructure ............................................................................................ 13
       Saint Lawrence Specific Hard Infrastructure....................................................................................... 15
     2.3      Third-Party Infrastructure ........................................................................................................... 16
     2.1      Natural Systems .......................................................................................................................... 17
     2.2      People – City and Regional Staff and Park Users ........................................................................ 18
3.     Limitations to the Infrastructure Assessment .................................................................................... 20
4.     Climate Data and Analyses.................................................................................................................. 21
     4.1      Identification of Climate Parameters and Thresholds ................................................................ 21
     4.2      Climate Data Sources .................................................................................................................. 23
       4.2.1          Baseline Climate Probabilities: Historical Values ................................................................ 23
       4.2.2          Incorporating Climate Change: Future Projections ............................................................ 23
     4.3      Probability Calculations and Scoring ........................................................................................... 24
       4.3.1          Scoring for Risk Ranking ...................................................................................................... 24
     4.4      Results and Conclusions .............................................................................................................. 26
5.     Vulnerability Assessment .................................................................................................................... 37
     5.1      Methodology............................................................................................................................... 37
     5.2      Severity Scoring........................................................................................................................... 38
     5.3      Stakeholder Workshop and Results ............................................................................................ 39
6.     Summary of Identified Risks ............................................................................................................... 40
     6.1      Statement of Overall Infrastructure Resiliency........................................................................... 40
     6.2      High-risks going forward ............................................................................................................. 40
     6.3      High-medium risks – Areas of Potential Vulnerability ................................................................ 41

4 July 2018                                                                                                                                                   2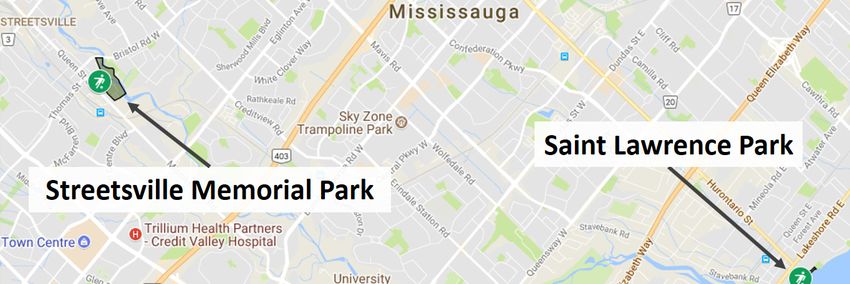
REPORT: PIEVC Assessment of Three City Parks
6.4 Special cases................................................................................................................................ 44
6.4.1 High Impact, Low probability .............................................................................................. 44
6.4.2 Low impact, high probability............................................................................................... 45
6.5 Beneficial Interactions ................................................................................................................ 46
6.6 Unknown Risks ............................................................................................................................ 47
7. Recommendations .............................................................................................................................. 48
7.1 Responses to High-Risks.............................................................................................................. 48
7.2 Responses to High-Medium Risks ............................................................................................... 51
7.3 Responses to Special Cases ......................................................................................................... 52
7.4 Climate Analysis and Data Related Measures............................................................................. 53
7.5 Unknown Risks .................................................................................................................................. 54
References .................................................................................................................................................. 57
Appendices – Submitted Under Separate Copy .......................................................................................... 60
Table of Figures
Figure 1-1: Map indicating the relative locations of each of the three parks being assessed within the City
of Mississauga. .............................................................................................................................................. 6
Figure 1-2: Flow chart describing risk assessment portion of the PIEVC Protocol ....................................... 7
Figure 2-1: Map defining assessment boundaries of Jack Darling Park...................................................... 10
Figure 2-2: Map defining assessment boundaries of Saint Lawrence Park. ............................................... 10
Figure 2-3: Map of assessment boundaries of Streetsville Park. ................................................................ 11
Figure 2-4: Examples of common infrastructure shared across parks ....................................................... 12
Figure 2-5: Streetsville foot bridge, seen from west bank of Credit River looking south. .......................... 13
Figure 2-6: Jack Darling toboggan hill (left) and beach wading areas (right) ............................................. 15
Figure 2-7: Saint Lawrence Park gazebo and shoreline armour stone ....................................................... 16
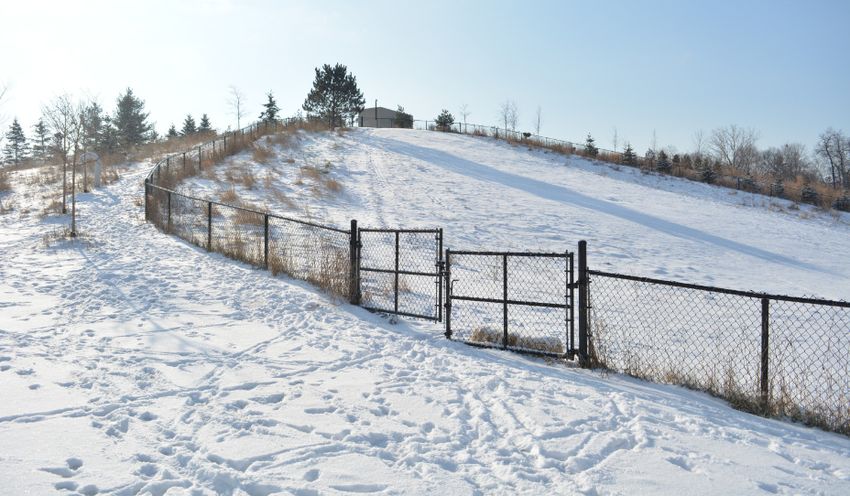
Figure 2-8: Black willows along the Waterfront Trail, Jack Darling Park. ................................................... 19
Figure 4-1: RCP Ranges and Projected Global Temperature Change by 2100............................................ 24
Figure 4-3: Historical water levels for Lake Ontario (1976 - 2017) ............................................................. 33
Figure 4-4: Estimated Frost Penetration Depth, including 1.2m Threshold ............................................... 35
Table of Tables
Table 2-1: Common hard infrastructure components. ............................................................................... 11
Table 2-2: Hard infrastructure specific to Streetsville Park. ....................................................................... 13
Table 2-3: Hard infrastructure specific to Jack Darling Park. ...................................................................... 14
Table 2-4: Hard infrastructure specific to Saint Lawrence Park.................................................................. 15
4 July 2018 3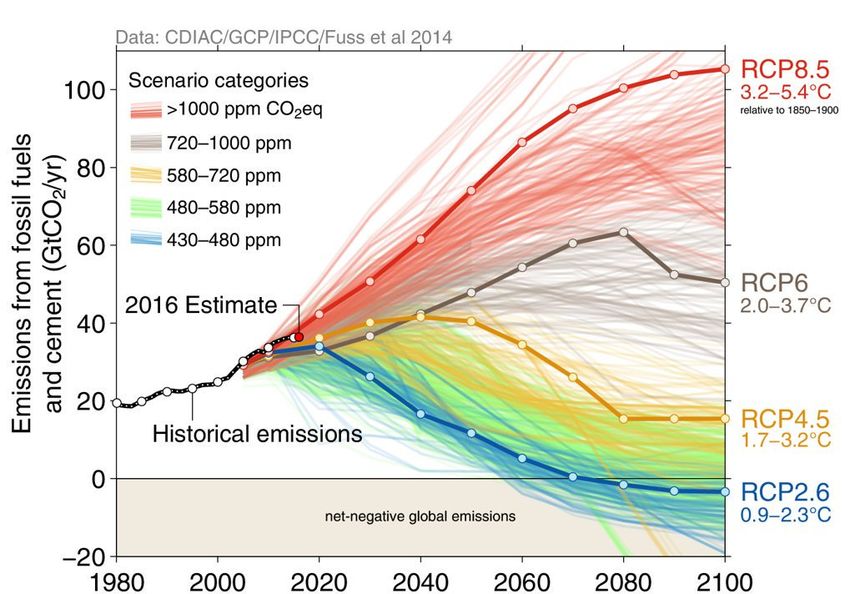
REPORT: PIEVC Assessment of Three City Parks

Table 2-5: Third-party infrastructure which may trigger secondary impacts to park assets...................... 16
Table 2-6: List of natural systems considered as important assets across the three parks ....................... 18
Table 2-7: List of people using, maintaining or otherwise servicing the parks .......................................... 19
Table 4-1: Climate Parameters and Inclusion Justification ......................................................................... 22
Table 4-2: Probability Scoring Method Options for PIEVC Vulnerability Assessment Scoring ................... 25
Table 4-3: Climate Parameters List: Probabilities and Scores .................................................................... 26
Table 4-4: Historical tornado occurrences in the Mississauga region ........................................................ 31
Table 4-5: Historical occurrences of golf ball or larger (4.5 cm) hail in Mississauga region ....................... 32
Table 5-1: Severity scoring method D. ........................................................................................................ 38
Table 7-1: Summary table of recommended adaptation responses………………….…………………………………… 54

4 July 2018                                                                                                                                    4
REPORT: PIEVC Assessment of Three City Parks
1. Introduction
The City of Mississauga (i.e., “the City”) has over 480 parks within its boundaries, ranging from small
neighbourhood green spaces to large, multi-hectare parks containing numerous recreational facilities
capable of hosting events numbering in the thousands of attendees. To better understand the potential
current and future vulnerabilities of Mississauga’s city parks to impacts from severe weather and climate
change, a climate change risk assessment was conducted focusing on three Mississauga parks designated
by the City for assessment in this project scope. These are the Streetsville Memorial, Jack Darling
Memorial, and Saint Lawrence parks.
This report provides a detailed description of the climate change and severe weather risk assessment
conducted for these parks through application of the Public Infrastructure Engineering Vulnerability
Committee (PIEVC) Protocol (i.e., “the Protocol”; Engineers Canada 2016). The Protocol is a five-step risk
assessment framework, based on standard engineering risk assessment methods. It is intended to identify
and prioritise the most important risks posed by climate change to public infrastructure, including the
main components and sub-components of systems that comprise the public infrastructure asset. The
Protocol has been applied over 50 times to assess climate change risks to critical infrastructure systems
across Canada and several international project applications since its introduction in 2008. This report
summarises the PIEVC Assessment steps and data applied in the Parks Assessment for the City of
Mississauga. PIEVC Worksheets were completed for documentation of each PIEVC step and are provided
in the Appendices of this report.
1.1 Project Scope
This report focuses on the PIEVC Parks Assessment portion of the overall City of Mississauga Climate
Change Action Plan project. The PIEVC Parks Assessment is one of several climate change risk assessments
which are either in progress or have recently been completed addressing City of Mississauga assets. Risk
Sciences International (RSI) was responsible for leading the PIEVC Parks Assessment portion of the Climate
Change Action Plan project scope. The results of this assessment will soon be combined with several other
parallel assessments underway as part of the Climate Action Plan project to compare and prioritise risks
in order to develop climate change adaptation response planning for the City as a whole. The PIEVC Parks
Assessment considers all human-made and natural infrastructure within each of the three City-selected
parks, as well as park users and municipal and regional staff. The assessment considers components within
the three assessed parks which may be subject to climate- and severe weather-related impacts.
The three parks being assessed are the following:
1) Jack Darling Memorial Park,
2) Streetsville Memorial Park, and
3) Saint Lawrence Park.
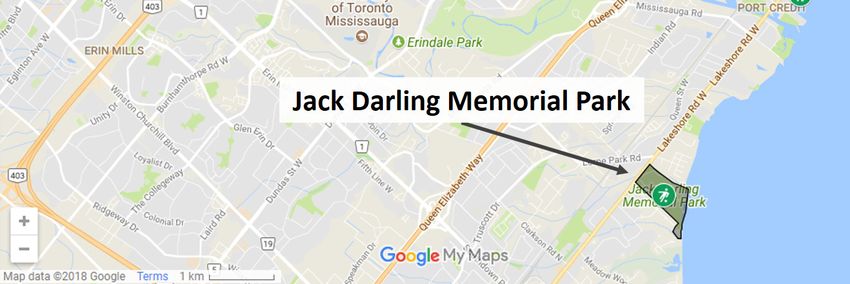
Figure 1-1 provides a map overview of the locations of each of the three parks within the City of
Mississauga, while a more detailed description of the parks and their contents is provided in Section 2.
4 July 2018 5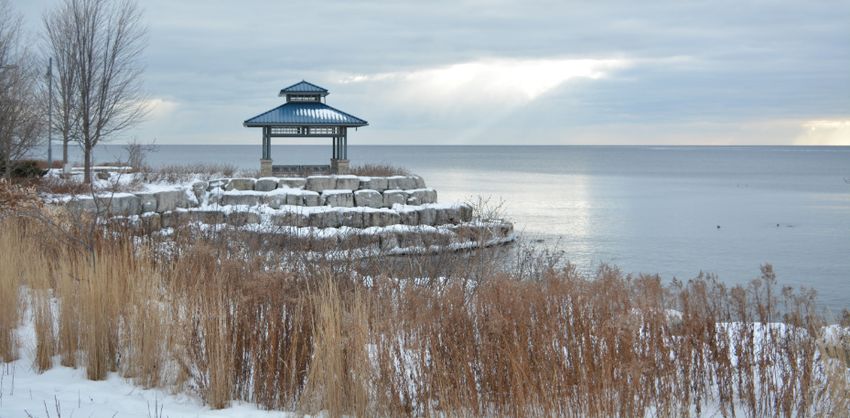
REPORT: PIEVC Assessment of Three City Parks

Figure 1-1: Map indicating the relative locations of each of the three parks being assessed within the City of
Mississauga.

The selection of the three parks was done prior to the Request for Proposal for the project through
discussions between the City’s environmental division and parks and forestry divisions. Jack Darling and
Streetsville Memorial Parks were chosen due to the presence of “representative infrastructure” and
location criteria. “Representative infrastructure” refers to the variety of infrastructure, facilities, and other
characteristics that are similar across parks in Mississauga, allowing many of the risk assessment findings
to be potentially applicable to other parks in the City. This approach allowed for a large variety of different
asset types, from recreational facilities to buildings to large naturalised areas, to be captured by the
assessment. Location considerations required that both lake shoreline and landlocked parks be included
in the assessment. Saint Lawrence Park was selected due to the severity of recent impacts from high lake
levels and wave action in the spring of 2017, as well as its representation of smaller sized parks with
hardened surfaces. As of this writing (April 2018), St. Lawrence Park’s lower promenade remains closed
to the public, and repairs and upgrades to the damaged sections of the park are estimated to eventually
cost approximately $2.5 million.

All three parks are located in potentially vulnerable areas with respect to climate hazards, with both Jack
Darling and Saint Lawrence parks having recently suffered significant damage due to record high water
levels in Lake Ontario, and Streetsville Park being exposed to impacts due to its location directly along and
within the Credit River Valley that is subject to regular spring flooding. The assessment process and
documentation therefore yield a characterisation and overview of the potential risks for City park assets.

4 July 2018                                                                                                    6
REPORT: PIEVC Assessment of Three City Parks

The PIEVC process also begins identifying options for responding to risks, while at the same time increasing
climate resilience and overall sustainability of park assets well into the future.

    1.2 The PIEVC Protocol
The PIEVC Protocol was developed between 2005 and 2012 and combines the systematic identification of
important climate and severe weather hazards with the analysis of infrastructure system components to
identify and prioritise risks, and to better understand how these risks may evolve over time with changes
in climate. The five standard steps in the Protocol are illustrated in Figure 1-2 below.

                Figure 1-2: Flow chart describing risk assessment portion of the PIEVC Protocol,
                through steps 1 to 5 (modified from Engineers Canada, 2016).

While PIEVC has been applied to multiple categories of public infrastructure, this study represents the
first explicit application of the PIEVC Protocol to a city’s park assets in Canada, which in turn presents both
challenges and opportunities for further expansion of the applications of the Protocol to new
infrastructure asset categories. The PIEVC Protocol is most often applied to “hard” or grey infrastructure,
human-made engineered structures, and systems such as buildings and treatment facilities, overhead
systems for communication and electrical transmission and distribution, and underground and surface
conveyance networks for drinking water, waste water, and sewage conveyance. Although green and
natural infrastructure have been addressed in previous PIEVC studies, they often do not represent a
significant portion of the existing infrastructure portfolio for the system being assessed. The treatment of
natural components, such as trees and plant species, as explicit infrastructure components, with the same

4 July 2018                                                                                                  7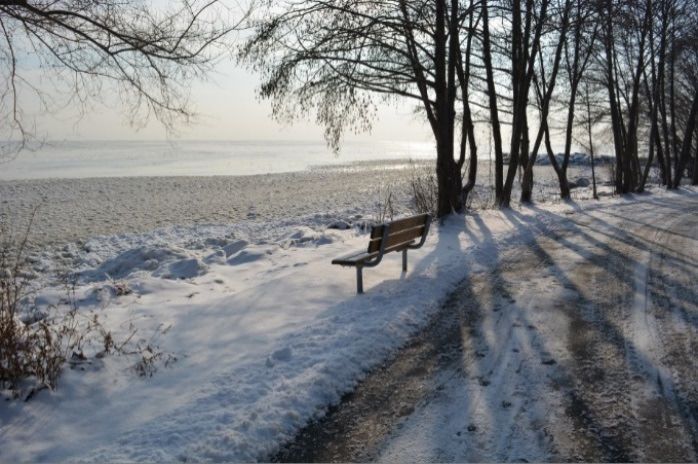
REPORT: PIEVC Assessment of Three City Parks

importance as individual engineered components, is also a novel application of the Protocol, and is
intended to recognise the benefits and services provided by such natural components.

In addition, the assessment recognised that the City operates multiple, unique parks, ranging in size, site
specific geographical characteristics, park specific assets and infrastructure, and intended use (e.g.,
community sports and other activities, festivals and other events). This diversity proved challenging in
trying to characterise and address risks to valued assets, but ultimately allows for the findings from the
three parks assessed here to be more widely applicable to other parks in within Mississauga.

Modifications
Note that Step 4 “Engineering Assessment”, is by definition an optional step within the PIEVC process, and
has been defined to be out of scope for this assessment. Step 4 of the Protocol involves detailed
engineering assessment of risks which generally lie within the “medium” range. While detailed
assessment of these risks can be very informative, engineering assessment of multiple individual assets is
costly and time consuming and can result in the initiation of detailed analysis and supplementary studies.
Scoping of this project deemed that the optional Step 4 of PIEVC is not needed for the most obvious “high”
risks identified in the assessment; i.e., high-risks are already flagged for immediate action and do not
require more detailed engineering assessment. The prioritization and risk ranking developed by the steps
1-3 and 5 are considered sufficient for the purposes of identifying and prioritising risks within this
assessment. The project scope also excluded the execution of the “Triple Bottom Line” module, another
optional decision-making module for PIEVC which considers economic, environmental and social factors
to help select the most appropriate adaptation solutions following the risk assessment. A separate process
will be conducted later to address the prioritization and selection of adaptation actions on a City-wide
basis.

4 July 2018                                                                                              8
REPORT: PIEVC Assessment of Three City Parks

    2. Assessed Infrastructure Descriptions
The definition of park infrastructure and their key components was developed based on a series of site
visits conducted on January 8 (Streetsville Park), January 9 (Saint Lawrence Park), and January 16 (Jack
Darling Park), 2018. Tours were provided by City of Mississauga parks staff and were attended by one or
more RSI staff for the purposes of understanding each park site, asset documentation, and discussion to
confirm asset functions and conditions. These site visits were further bolstered by multiple rounds of key
person interviews via email, phone conversations, and in-person meetings to refine the list of
infrastructure components and confirm completeness. Infrastructure components for the parks were
broken down into four main categories:

    •   Hard (or “grey”) infrastructure,
    •   Third party infrastructure,
    •   Natural systems, and
    •   People.

These categories are described in detail below and are further defined by sub-categories. Hard
infrastructure, for example, has been further defined as either “shared” infrastructure among all three
parks, meaning all three parks contain some example of these same component types, or “park specific”
hard infrastructure, addressing facilities and assets that only exist in an individual park.

    2.1 Park Boundaries
Defining park boundaries was critical for two reasons. The first was to define which infrastructure
components needed to be included in the analysis, including the identification of boundaries where park
infrastructure may interact with or rely on adjacent infrastructure. The park boundaries were also
important for the hazard probability analysis. For example, the size of the park “target area” proves critical
in estimating the probability of occurrence for smaller scale severe weather events like thunderstorms
and tornadoes. The second reason was to establish that the most representative values were available for
statistical analysis, which needs to take into account the total surface area of each park to calculate the
probability of interaction with climate events (described in Section 3). The park boundaries are provided
for each of Jack Darling Park (Figure 2-1), Saint Lawrence Park (Figure 2-2) and Streetsville Park (Figure
2-3), encompassing 11.2 hectares, 36.5 hectares and 1.9 hectares of surface area, respectively.

4 July 2018                                                                                                 9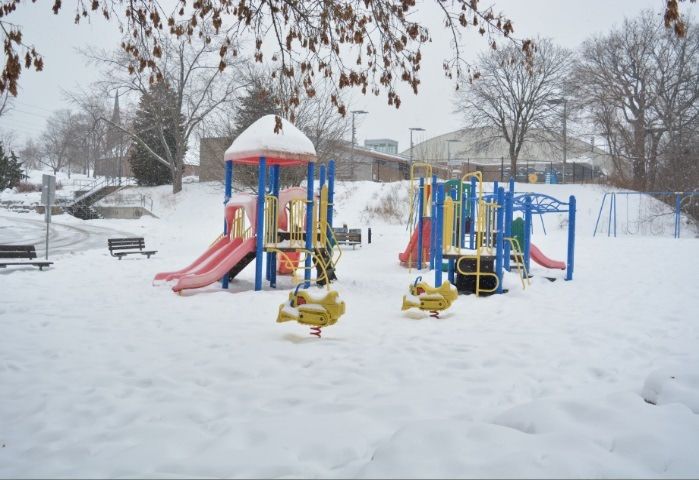
REPORT: PIEVC Assessment of Three City Parks

Figure 2-1: Map defining assessment boundaries of Jack Darling Park.

Figure 2-2: Map defining assessment boundaries of Saint Lawrence Park.

4 July 2018                                                              10
REPORT: PIEVC Assessment of Three City Parks

Figure 2-3: Map of assessment boundaries of Streetsville Park.

    2.2 Hard Infrastructure
A detailed description of park infrastructure begins with the hard or “grey” infrastructure components.
These have been further categorised into “common” and “park specific” groupings since the three parks
all share common infrastructure components, but also components which are unique to each individual
park. For example, although they differ in some characteristics, including age and condition of the asset,
every park contains multiple light standards, park benches, picnic tables, walking paths, and parking lots,
all of which are considered “common” hard infrastructure. Table 2-1 provides a detailed description of
these components, while Figure 2-4 providing examples.

Table 2-1: Common hard infrastructure components.

                                      Common Hard Infrastructure
 comfort stations                       park benches                storage shed - concrete block
 electrical service boxes               parking lot - asphalt       storage shed - wood
                                        parking lot - natural
 fleet vehicles                                                     underground electrical wiring
                                        surface
 garbage & recycling bins               picnic tables               utility access covers
 grounds keeping and tree
 maintenance equipment - in             play structures - metal     walking paths - asphalt
 storage sheds
 lawn, manicured                        play structures - plastic   walking paths - soil & gravel
 light standards                        Signs

4 July 2018                                                                                             11
REPORT: PIEVC Assessment of Three City Parks
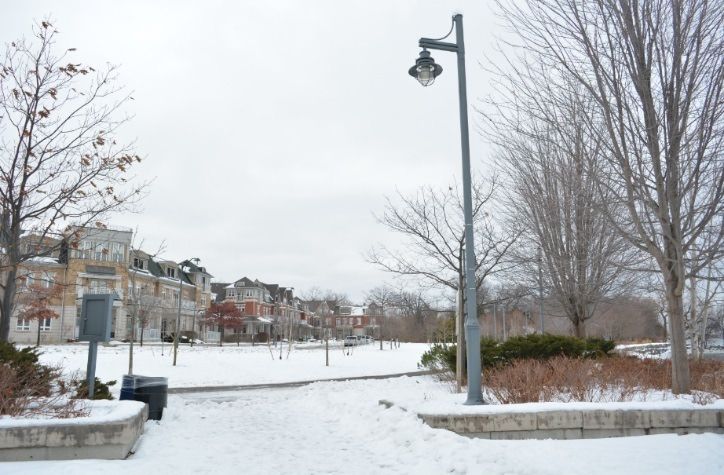
Figure 2-4: Examples of common infrastructure shared across parks, including comfort stations (top left; Jack
Darling), park benches and walking paths (top right; Jack Darling), light standards (bottom left; Saint Lawrence)
and playground equipment (bottom right; Streetsville).
2.2.1 Streetsville Park Specific Hard Infrastructure
The entire park sits at the base of the Credit River Valley, and therefore part of the definition of park
boundaries (Figure 2-3 above) included a focus on assets and facilities characterised by this lower
elevation. This immediately resulted in the exclusion of adjacent, higher elevation infrastructure
components which were not considered part of Streetsville Park, most notably the Vic Johnston Arena.
The additional park specific components which were included in the assessment are described in detail in
Table 2-2.
Streetsville is considered a destination park due to its size and available facilities. Although it was never
designed or otherwise explicitly intended to act as a park hosting large public events, several annual
events are regularly held within the park, particularly the Bread and Honey Festival and Lebanese Festival,
the former attracting an estimated 50,000 or so attendees over its two-and-half-day duration. The park
also hosts multiple local sports events due to the presence of baseball and soccer facilities. The use of the
park to host large public events impacts its exposure to and risks from weather and climate hazard events
The park also contains a comfort station, located on the site of a decommissioned waste water treatment
facility, and an adjacent outdoor storage yard which acts as the main staging area during the warm season
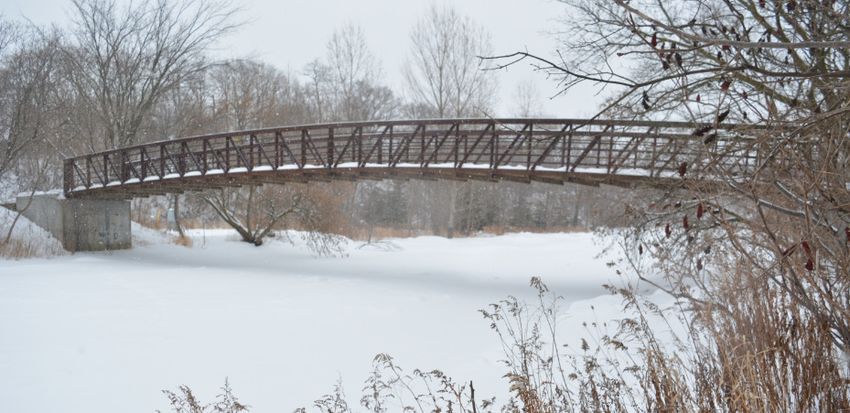
for the Streetsville Public Cemetery. The park also contains a large footbridge connecting the south bank
4 July 2018 12REPORT: PIEVC Assessment of Three City Parks
of the Credit River with the island at the center of the park (Figure 2-5). Armour stones were listed here
as a separate infrastructure item in spite of their presence at the other two parks. This approach was
taken to determine if there were any differences between impacts to protective armour stones associated
with river valley versus lake shoreline locations.
Figure 2-5: Streetsville foot bridge, seen from west bank of Credit River looking south.
Table 2-2: Hard infrastructure specific to Streetsville Park.
Streetsville Park - Specific Hard Infrastructure
armour stones - river soccer field - south of
flood lights - baseball diamonds
bank Credit River
baseball diamond - pedestrian bridge - steel box frame, wood
soccer fields – island
fencing, bleachers deck, concrete abutments
batting cages picnic area - island soccer nets
power & telecom lines and poles crossing
BBQs - iron, island storage lot – open
Credit River
bocce courts propane tanks - near comfort station stormwater ponds,
dumpsters small footbridge - near baseball diamond basins and outfalls
Jack Darling Specific Hard Infrastructure
Jack Darling Memorial Park is the largest of the three parks, covering more surface area than the other
two parks combined, and noted as the fifth largest park in Mississauga by surface area. Like Streetsville
Park, it is considered a “destination” park, attracting visitors from across the Greater Toronto Area and
occasionally internationally. Park-specific infrastructure for Jack Darling Park is described in detail in Table
2-3 below, with specific examples given in Figure 2-6.
In terms of unique facilities, Jack Darling is the only park in Mississauga with designated (but unsupervised)
beach wading areas, as well as a large splash pad which is kept operational until 11 PM in the evening on
4 July 2018 13REPORT: PIEVC Assessment of Three City Parks
particularly hot days during the summer. The park also features two large picnic areas adjacent to the
beach wading areas, as well as a covered picnic area located at its far southwestern end, next to the
Rattray Marsh. The park contains the largest leash-free dog park in Mississauga. Winter recreation
attractions include a toboggan hill and year-round access to walking trails throughout the park and along
the Lake Ontario shore.
In terms of drainage infrastructure, the park is also unique in that a very large portion of the park is
effectively a large green roof which overlays two underground water treatment facilities (described in
more detail below). Two creeks are located along or directly adjacent to the park, including a covered
catch basin for Turtle Creek at the park’s far western end, and Birchwood Creek, which runs along the
eastern boundary of the park. The park also lies adjacent to a provincially significant wetland (Rattray
Marsh Conservation Area) in an otherwise urbanized area. Although the Rattray Marsh Conservation Area
is an environmentally sensitive wetland and represents the last remaining lakefront marsh between
Toronto and Burlington, it lies outside of the scope of this study.
Table 2-3: Hard infrastructure specific to Jack Darling Park.
Jack Darling Park - Specific Hard Infrastructure
artificial "AstroTurf" under play
covered picnic area
structures
Turtle Creek catch-basin - near
culverts
shoreline
beach areas leash free dog park
splash pad road - asphalt
stormwater ponds, basins and
tennis courts
outfalls
flood lights - tennis courts picnic area - concrete slab
toboggan hill armour stone - lake shore
chain link fencing
4 July 2018 14REPORT: PIEVC Assessment of Three City Parks
Figure 2-6: Jack Darling toboggan hill (left) and beach wading areas (right)
Saint Lawrence Specific Hard Infrastructure
Saint Lawrence Park can be roughly separated into three areas. The Waterfront Trail portion, which
consists of either concrete block or asphalt pathway acting as a portion of the Lake Ontario Waterfront
Trail and includes the gazebo (Figure 2-6) and green areas adjacent to the Trail. The area with the lower
walkway and lookout point bordering the shoreline and Lake Ontario is currently closed to the public due
to storm and wave damage from 2013. Finally, there is also a street-level courtyard with paving stones
and ornamental trees in planters, bounded by Saint Lawrence Street to the east and Port Street to the
west. The detailed description of park specific hard infrastructure is given in Table 2-4.
Table 2-4: Hard infrastructure specific to Saint Lawrence Park.
Saint Lawrence Park - Specific Hard Infrastructure
break wall - stacked armour stones, east end lower promenade - staircase
electrical conduits - along shoreline lower promenade - walkway slabs
gazebo - box steel construction, bolts and welds;
street-Level courtyard - brick & concrete slab
sheet metal roofing; concrete pillars; slab
pathway
foundation
lower promenade - decorative and retention walls street-Level courtyard - Planters
lower promenade - ladders street-Level courtyard - Utility room
lower promenade - planters, concrete block upper promenade - staircase
lower promenade - railing, concrete blocks upper promenade - Walking path, concrete
4 July 2018 15REPORT: PIEVC Assessment of Three City Parks
Figure 2-7: Saint Lawrence Park gazebo and shoreline armour stone, view from Waterfront Trail looking south-
east.
2.3 Third-Party Infrastructure
A critical consideration in assessing climate risks is the potential for secondary impacts due to damage to
or loss of critical third-party infrastructure. The relevant third-party infrastructure considered in this
assessment is listed in Table 2-5. For all three parks, this includes connections to electrical distribution
and drinking and waste water services. Jack Darling in particular is located adjacent to many major third-
party infrastructure elements, including the drinking and waste water treatment plants located below the
park, a natural gas pipeline, and a partially buried comfort station which is shared with the Region of Peel
and is located at the northern end of the park. Access points for emergency response personnel and park
staff were important considerations in understanding the impacts of weather and climate events on park
users, particularly since plans include the installation of a new ambulance station at north end of the park.
Table 2-5: Third-party infrastructure which may trigger secondary impacts to park assets. If assets are park specific,
individual parks are identified as “JD” (Jack Darling Park) or “SL” (Saint Lawrence Park).
Important Third-Party Infrastructure
buried comfort station - connected to
natural gas pipe line [JD]
Peel Region water treatment [JD]
communication networks (cell and
Port Credit Harbour Marina and break wall [SL]
landline)
treatment plant vents - HVAC, stacks, etc.; large green
drinking water treatment plant [JD]
covers [JD]
electrical distribution connections waste water pipe network
evacuation/fire routes/first-responder
access waste water treatment plant [JD]
fresh water supply network
4 July 2018 16REPORT: PIEVC Assessment of Three City Parks
2.1 Natural Systems
As discussed in Section 1, this study represents a novel application of the PIEVC assessment tool,
particularly due to its emphasis on natural systems as key infrastructure assets. Treating natural system
components as infrastructure assets is in fact a critical distinction, one which will be emphasised
throughout this report. For example, consider how wind and ice damage to trees could be addressed
within a risk assessment. A PIEVC assessment focusing on grey infrastructure would be concerned with
the impacts of trees on engineered components, considering the risks posed by secondary damage trees
may cause to overhead systems or buildings. In the case of this parks assessment, the trees themselves
are considered infrastructure components, and risk rankings are based on severe weather and climate
related impacts directly to trees.
Both Jack Darling and Streetsville contain designated natural areas which are part of the City’s Natural
Heritage System (NHS). Designated natural areas cover roughly 9% of the total surface area of the city and
are surveyed every 4 years to study and inventory the contents and overall state of “remnant” natural
areas within the City (City of Mississauga, 2018). Guidance for management of the City’s NHS include the
Natural Heritage and Urban Forest Strategy (NH&UFS; City of Mississauga, 2014a) and the Urban Forest
Management Plan (UFMP; City of Mississauga, 2014b). This PIEVC assessment emphasises two of the
guiding principles of the UFMP, to “Integrate climate change considerations in natural heritage and urban
forest planning” and to “Recognise natural systems and the urban forest as critical components of the
City’s infrastructure” (City of Mississauga, 2014b).
The applied definition of natural systems for the three assessed parks was greatly refined through
discussions with Parks and Forestry staff and other stakeholders during the assessment workshop (see
Section 4). The natural asset inventory used in the assessment is described in detail in Table 2-6 below.
The Credit River (Streetsville Park), Lake Ontario shoreline (Saint Lawrence and Jack Darling Parks) and
individual creeks are defined as important infrastructure components. The Jack Darling Prairie is another
unique natural component, which was defined separately here and resulted in slightly different responses
to climate impacts than other similar components (i.e., separate and in contrast to the general “native
plant species” component). Trees were also defined as either ornamental (i.e., “standalone”) trees versus
trees in larger stands, since there may be important differences in their sensitivity depending on their
immediate surroundings.1 Trees located near the Lake Ontario shoreline, for example (Figure 2-7), may
be more “wind hardened” and suffer less damage than the same tree types in different locations.
1
For example, the literature on wind sensitivity of trees shows important differences between ornamental or
“standalone” and stands of trees. Ornamental trees tend to have “co-dominant” trunks and are much wider but also
more wind hardened than trees in stands, whereas trees in forest stands may be more wind sensitivity and will have
a single trunk.
4 July 2018 17REPORT: PIEVC Assessment of Three City Parks
Table 2-6: List of natural systems considered as important assets across the three parks. As in Table 5, assets
specific to individual parks are indicated by the abbreviations “JD” for Jack Darling, “SL” for Saint Lawrence, and
“SV” for Streetsville Parks.
Natural Systems
Credit River [SV] native species - plants
Turtle & Birchwood Creeks [JD] riparian habitat [SV & JD]
Jack Darling Prairie - tall grass prairie [JD] trees - stands
Lake Ontario shoreline [JD & SL] trees - ornamental
An examination of invasive animal and plant species with potential impacts on Mississauga’s city parks is
beyond the scope of the PIEVC study. However, the City of Mississauga has developed a draft Invasive
Species Management Plan and Implementation Strategy (ISMP &IS) that is currently under review. The
ISMP&IS guides activity to strategically manage the presence and future emergence of invasive species
and associated risks.2
2.2 People – City and Regional Staff and Park Users
The emphasis on impacts to people using, maintaining, or otherwise operating within the parks is also a
significant difference and expansion from most other PIEVC assessments conducted across Canada,
particularly the investigation of potential differences in risk associated with different staff or user groups.
Table 2-7 describes the distinctions which were applied here, further dividing the “people” categories into
either municipal/regional staff or park users. Distinctions were made, for example, between City of
Mississauga forestry and parks staff, and Region of Peel staff, including emergency response. For users,
distinctions were made between regular park visitors and people specifically using facilities which may
expose or shelter them from particular hazards, e.g., beach users may be exposed to more ultra-violet(UV)
ray and temperature related impacts in the summer, while event organizers, though only present in the
park for a small number of days during the spring and summer months, are extremely sensitive to anything
causing closures or putting large groups of event attendees/participants at risk.
2
Invasive species that may cause future concern include – Gypsy moth (oak and maple), Asian longhorned Beetle,
canker worm, fall webworm, two-lined chestnut borer, bronze birch borer, pine shoot beetle, forest tent caterpillar;
hemlock wolly adelgid, white pine weevil, oak skeletonizer, willow leaf beetle, elm leaf beetle, Asian gypsy moth.
4 July 2018 18REPORT: PIEVC Assessment of Three City Parks
Figure 2-8: Black willows along the Waterfront Trail, Jack Darling Park.
Table 2-7: List of people using, maintaining or otherwise servicing the parks. Note that beach users are only
relevant to Jack Darling Park.
Municipal and Regional Staff Park Users
Emergency Management/First
beach users [JD]
Responders (Peel)
Forestry event organizers
intermittent (short
Park Staff
duration)
Region of Peel Staff long-term (several hours)
Security marine users
4 July 2018 19REPORT: PIEVC Assessment of Three City Parks
3. Limitations to the Infrastructure Assessment
The limitations to the assessment include both high-level and project specific concerns for the
infrastructure and asset categories described above. Fundamentally, by requiring that infrastructure and
assets be explicitly defined as individual components, there is a risk of excluding other components which
may be relevant to climate related risks. This concern was mitigated through iterative review and
consultation of the list of components with City staff, stakeholders and other experts, but the potential
remains that one or more components may have not been considered.
Other potential limitations may be associated with the novel application of the Protocol to park assets in
contrast to a sole focus on “built infrastructure”. Given the much greater emphasis on risks to natural
systems and people when compared to most other PIEVC assessments, the results of this PIEVC
assessment go beyond the traditional (built) infrastructure assets results found in typical PIEVC results.
The novel application of the Protocol is both a challenge and an opportunity to expand the tool but needs
careful consideration of potential limitations.
Finally, the scope of the project, specifically the scope’s defined exclusion of the optional PIEVC Step 4 of
the assessment, does not allow for a full, quantified characterisation of a select few of risks identified in
this study. These are generally raised for additional analysis and further study in the conclusions and
recommendations portion of the assessment. A small number of risks which could have been addressed
through the optional PIEVC Step 4 (Engineering Analysis) have been highlighted which may justify areas
of additional detailed analysis for future work.
4 July 2018 20REPORT: PIEVC Assessment of Three City Parks
4. Climate Data and Analyses
4.1 Identification of Climate Parameters and Thresholds
RSI climate specialists used climate and weather observations from a variety of sources in Mississauga and
surrounding areas to develop historical climate and climate change projections tailored to specific
parameters considered relevant to the Mississauga Parks evaluated in this study. This consisted of three
main tasks:
1. Identification of the climate parameters that may impact the assets contained within each of the
three parks, both individually and as a group.
2. Identification of thresholds at which climate parameters cause particular impacts/issues with the
assets contained within each of the three parks.
3. Estimates of the probability of historical and future climate parameter threshold exceedances for
two future climate periods; the 2030s and the 2050s.
The procedures used to perform this analysis, and the associated analytical results, are detailed in the
following subsections. The climate parameters and thresholds established for analysis in this study were
assembled and analysed prior to the March 5 Workshop in the City of Mississauga by the project team
through collaborative work and were then refined in discussion with the input of workshop participants.
Climate parameters and thresholds were identified through a combination of:
• Climatic design values in engineering codes and standards;
• Practitioner experience (especially in managing past impacts and risks);
• Case studies in the published and “grey” literature3;
• Forensic investigation of past events; and
• Initial interviews with Mississauga Parks employees.
Where possible, the project team used climate parameters and thresholds that were consistent across
the range of assets in the three parks for clarity and consistency. In some cases, multiple thresholds were
developed for the same parameter, either because multiple thresholds held some significance for one or
more of the assets across the parks, or because the threshold was different for each asset. Additionally,
some thresholds are only applicable to individual parks and not across all three (i.e., Lake Ontario water
level thresholds only apply to Jack Darling Park and St. Lawrence Park, and not Streetsville Memorial Park).
In some cases, thresholds were adjusted after the workshop based on the experience and knowledge of
workshop participants familiar with the assets and their response to changing conditions. A more detailed
discussion of each parameter and thresholds is included in Section 4.4.
3
This is included to indicate any research available outside of peer-reviewed scientific journals, including previous
vulnerability assessments and conference proceedings.
4 July 2018 21REPORT: PIEVC Assessment of Three City Parks
Table 4-1: Climate Parameters and Inclusion Justification.
Climate Parameter Reason for Inclusion
Debris; Structural damage to buildings and above ground
High Winds (gusts)
infrastructure; Damage to green infrastructure
High impact, low probability events; potential for severe impacts
Tornadoes
to assets
Lightning Electrical system damage; Green infrastructure damage
Flooding events; Damage to hard infrastructure; damage to green
Water Levels
infrastructure
Impacts to service and site access; Washouts and flooding (coastal
Precipitation (Snow, Rain, Hail,
and riverine); Damage to equipment and vehicles; Occupational
Freezing Rain)
health and safety, public safety, electrical system impacts
Weathering of hard infrastructure; Occupational health and
UV Exposure
safety; Public safety
Freeze-Thaw Cycles Weathering of hard infrastructure
Occupational health and safety; Public safety; Stress on hardened
Extreme Temperatures
and natural infrastructure
Washouts and erosion; Degradation of parks equipment;
Flooding
Occupational health and safety; Public safety
Ecological damage to green infrastructure; Parks operations
Drought
impacts
Parks operations impacts; Occupational health and safety; Public
Air Quality and Smog
safety
Ecological damage to green infrastructure; Occupational health
Pest and Disease
and safety; Public safety
There are twelve key parameters evaluated within this study, which are listed in
4 July 2018 22REPORT: PIEVC Assessment of Three City Parks
Table 4-1, along with a brief synopsis detailing the primary reasons for inclusion within the study. The
twelve key parameters were used to develop 26 key thresholds related to the various assets within the
three parks.
4.2 Climate Data Sources
4.2.1 Baseline Climate Probabilities: Historical Values
The baseline climate probability refers to the probability of exceeding a defined climate parameter
threshold under current and historical conditions. Climate data sources for this study included the most
recent Environment Canada issued “Climate Normals” for the official averaging period of 1981-2010. In
most cases, climatological analyses were completed using data from the Environment Canada climate
data archive, specifically utilizing the climate station at Toronto Pearson International Airport. This station
was selected for multiple reasons, including the long-term uninterrupted set of climate observations,
availability of hourly and daily data, and the general representativeness of the station for the City of
Mississauga. Unless otherwise noted, historical probabilities are based on the most recent 30-year climate
“normal” period (1981 – 2010). Calculated annual probabilities are then expressed in terms of number of
events per year and, where appropriate, per total park surface area.
When required, separate datasets were consulted to address some localized, high impact events, i.e.,
those parameters which are difficult to observe using standard meteorological instrumentation and
methods. For these more complex or rare events, such as lightning strikes and tornadoes, estimating
probabilities employs both quantitative analyses and expert meteorological judgement. Lightning and
tornado databases consulted and used in this assessment include the Canadian lightning detection
networks (Shepard et al., 2013) and the national tornado database (Cheng et al., 2013). Additionally, data
sets provided by the City of Mississauga (e.g. snow water equivalent [SWE] data) were used to identify
potential events related to thresholds as determined by the project team.
4.2.2 Incorporating Climate Change: Future Projections
Climate change projections of temperature and precipitation for this project were derived from an
ensemble of 40 global climate models (GCMs) from the most recent International Panel on Climate Change
(IPCC) 5th assessment report (AR5), published in 2013. Projected values were generated using the “Delta
Method” (IPCC-TGICA, 2007), which consists of applying the average projected difference (the “delta”) for
a given climate parameter to the historical average or baseline value. Projections were derived for two
30-year periods, centered on the 2030s (2021 – 2050) and 2050s (2041 – 2070).
Two future projection scenarios or assumptions, termed Representative Concentration Pathways (RCPs),
are used in this study to analyze a range of potential future changes to the current climate of Mississauga.
These RCPs assume differing amounts of greenhouse gas emission reductions in future. There is the
“business as usual” RCP scenario (RCP 8.5), and the mid-century GHG mitigation (reduction) scenario (RCP
4.5). RCP 8.5 is the emissions scenario upon which, globally, we are currently tracking. For the period of
study considered in this assessment (i.e., present day to the 2050s), the early period (2030s) RCP 4.5 and
RCP 8.5 temperature change scenarios are similar, while the largest differences between the two future
projections scenarios shows in the later of the two projection periods, 2050s (Figure 4-1).
4 July 2018 23REPORT: PIEVC Assessment of Three City Parks Figure 4-1: RCP Ranges and Projected Global Temperature Change by 2100 Where possible, climate projections were provided; however, there remain specific events for which confident projections of future conditions are not available. This is particularly evident for localised, short duration events, extremes, and/or complex (synergistic) events. In cases where the projections of these events are not available, future climate conditions for Mississauga were either derived from specialised studies available in the published literature (e.g. Cheng et al., 2012, 2014), or were based on professional judgement by the climate team. When uncertainty regarding future conditions was considered too great to provide any definitive statements, projections were listed as unknown. 4.3 Probability Calculations and Scoring 4.3.1 Scoring for Risk Ranking As statistical information for both historical and projected event frequencies was available for most of the climate parameters identified in the study, the more quantitative PIEVC Protocol Method B (Table 4-2) was used to develop the probability scores for each parameter. The probabilities for each climate parameter are converted from numerical probabilities into PIEVC score categories, where possible. The PIEVC Protocol makes use of standardized climate probability scores ranging from 0 to 7, employed in parallel with the 0 to 7 impact scoring scale used for severity assessment. A score of 0 refers to a climate event that likely will not occur, while a score of 7 refers to an event that is “highly probable” to occur over the service life of the structure (i.e., a probability approaching 100%). 4 July 2018 24
REPORT: PIEVC Assessment of Three City Parks

Table 4-2: Probability Scoring Method Options for PIEVC Vulnerability Assessment Scoring

                                                            Probability
                   Score
                                            Method A                         Method B

                                            Negligible                          < 0.1 %
                     0
                                          Not Applicable                     < 1 in 1,000
                                          Highly Unlikely                         1%
                     1
                                           Improbable                          1 in 100
                                                                                  5%
                     2                   Remotely Possible
                                                                                1 in 20
                                            Possible                             10 %
                     3
                                           Occasional                           1 in 10
                                        Somewhat Likely                          20 %
                     4
                                             Normal                              1 in 5
                                              Likely                             40 %
                     5
                                            Frequent                           1 in 2.5
                                            Probable                             70 %
                     6
                                         Very Frequent                         1 in 1.4
                                         Highly Probable                        > 99 %
                     7
                                      Approaching Certainty                   > 1 in 1.01

As in some previous PIEVC assessments (e.g. Durham Harmony Creek Water Pollution Control Plant,
AECOM & RSI, 2017), the calculation of annual event frequency and future study period probabilities and
their changes was performed to assist with operational and maintenance decision-making. Study period
probability calculations indicate the probability of an event occurring within any of the three parks in the
study period between baseline and the 2030s, and baseline and the 2050s.

4 July 2018                                                                                              25
REPORT: PIEVC Assessment of Three City Parks
4.4 Results and Conclusions
Analyses and scoring of important climate parameters are provided below in Table 4-3 for RCP 8.5, with RCP 4.5 analyses and scoring provided in
the Appendix to this report. Included in the table are the relevant thresholds for each climate parameter, historical and projected annual frequency
and probabilities, study period probabilities, and corresponding PIEVC scores for the 30-year study period for the 2030s and 2050s, respectively.
Annual averages for each parameter are provided in terms of events per year (yr-1). Probability values (%) are calculated based on the probability
of an event directly impacting the parks over a 30-year period. The total surface area encompassed by the three parks, equal to 0.50 km2, is
considered. The PIEVC scores are the eventual probability scores, ranked from 0 to 7, which are used to calculate risk values and will appear in the
risk matrix summarizing results for the assessment.
Table 4-3: Climate Parameters List: Probabilities and Scores
Historical
2030s 2050s PIEVC Probability Scores
Climate (1981-
Threshold(s) 2030s 2050s
Parameters 2010)
RCP 8.5 RCP 8.5 Historical
(RCP 8.5) (RCP 8.5)
2.0 yr-1 2.3 yr-1 2.5 yr-1
90 km/h gust 7 7 7
100% 100% 100%
0.05 yr-1 ~0.05 yr-1 > 0.06 yr-1
120 km/h gust 6 6 6
High Winds ~80% ~80% > 85%
3 in 50
Tornado - EF1+ No change No change
years 1 1 1
(est. 135 km/h+) 0.3% 0.3%
0.3%
Any strikes near ~0.8 yr-1 ~0.92 yr-1 > 1.0 yr-1
Lightning 7 7 7
infrastructure > 99% > 99% 100%
Storm Surge/Wave 0.05 yr-1 Unknown, Unknown,
6 Unknown Unknown
Action/High Water ~77% Further Further
4 July 2018 26REPORT: PIEVC Assessment of Three City Parks
April 30th, 2017 Case Study Study
Study Needed Needed
75.38 m + 0.3m
40 mm w/in 24hr 0.03 yr-1 0.06 yr-1 ~0.11 yr-1
6 6 6
(winter) ~60% ~86% ~97%
Precipitation - Rain
0.013 yr-1 ~0.5 yr-1 >0.07 yr-1
50 mm w/in 1h (summer) 5 6 6
~30% ~78% ~90%
2-3 in 50
No change No change
Precipitation - Hail Hail - 4.5 cm years 1 1 1
0.2 to 0.3% 0.2 to 0.3%
0.2 to 0.3%
0.46 yr-1 No change No change
15 cm snow in 1 day 7 7 7
100% 100% 100%
Precipitation - Snow
9+ days w/ 5+ cm of 0.27 yr-1 No Change No Change
7 7 7
snow > 99% > 99% > 99%
0.06 yr-1 0.08 yr-1 0.09 yr-1
Precipitation - Ice 15 mm ice accretion 6 6 6
85% ~91% > 95%
0.27 yr-1 No Change 0.56 yr-1
UV exposure UV Index ≥ 10 7 7 7
> 99% > 99% 100%
Cycles yr-1 divided by 30 0.62 yr-1 0.58 yr-1 0.48 yr-1
Freeze-Thaw 7 7 7
+3 °C to -3 °C 100% 100% 100%
Warmer Winters
30.2 yr-1 40.6 yr-1 47.5 yr-1
Daily Winter T > RCP 8.5 7 7 7
100% 100% 100%
2050s T (-1 °C)
Flash Freeze
Unknown, Unknown,
Temperature – Cold T decrease of 2°C per 5.8 yr-1
likely poss. 7 7* 7*
hour, starting above 0°C, 100%
steady increase
ending below
Probability of "Hard" (- 0.5 yr-1 0.37 yr-1 0.23 yr-1
7 7 7
4°C) frost on Dec 4 100% 100% 100%
4 July 2018 27REPORT: PIEVC Assessment of Three City Parks
0.17 yr-1 ~0.13 yr-1 99% > 99% > 99%
0.03 yr-1 0.03 yr-1 0.03 yr-1
Tmin ≤ -30°C 6 6 6
60% 60% 60%
Windchill ≤ -30 °C for 2+ 2.73 yr-1 No Change No Change
7 7 7
hours 100% 100% 100%
5+ Heat Waves
0.02 yr-1 0.68 yr-1 1.15 yr-1
Temperature - Heat Tmax 31 > °C, Tmin > 20°C 5 7 7
45% 100% 100%
for 2+ days
100 year/Regulatory 0.01 yr-1 ~0.04 yr-1 ~0.05 yr-1
Flooding – Riverine 4 5 6
Flood 26% ~66% < 80%
2017 High Water - 75.98
0.01 yr-1 ~0.004 yr-1 0.15 yr-1
Drought 6 6 7
550 mm < 90% ~97% > 99%
0.05 yr-1 ~0.06 yr-1 >0.07 yr-1
Air-quality/Smog ≥45 AQ Advisory Days 6 6 7
< 80% ~86% > 90%
EAB kill temperature 0.97 yr-1 0.98 yr-1 >0.99 yr-1
7 7 7
≤ -30 °C 100% 100% 100%
Pests and Disease Deer Ticks and Lyme
0.97 yr-1 0.98 yr-1 >0.99 yr-1
Disease 7 7 7
100% 100% 100%
Winter days > -11 °C
4
Reduction in the likelihood of shoreline flooding comes from the overall expected level of the Great Lakes to decline by mid-century by approximately 0.5m
(Hayhoe et al. 2010).
4 July 2018 28REPORT: PIEVC Assessment of Three City Parks Temperature Temperature-based thresholds evaluated in this study consider extreme high and low temperature values, along with parameters like flash-freeze events, warmer winters, and extreme windchill events. Given current climate trends, it is not unexpected to see overall warming of winters and increases in the number of heat wave events and high temperature extremes. For example, summers with 5 or more heat warning events/days in the Mississauga region are currently rare (0.02 yr-1), but will increase to an annual occurrence by the middle of the century. While winter temperatures overall will continue to rise throughout the study period, the occurrence of extreme cold events (T ≤ -30°C) and windchill events is not expected to vanish entirely. The recent Polar Vortex winters of 2012-13, 2013-14, and 2017-18 also failed to trigger the extreme cold temperature thresholds, and only two years within the historical baseline (1981 and 1994) triggered the minimum temperature threshold for extreme cold. However, windchill events remain frequent, with an average of 2.7 events per year of windchill temperatures ≤ -30°C for at least two hours. Given that one cannot fully rule out the possibility of extreme cold thresholds being exceeded in a given year due to natural climate variability, the future annual probability of these events is held constant rather than decreased. Rainfall Two thresholds for rainfall events were selected for this study, one related to winter rainfall and one related to summer rainfall. Both thresholds were derived from the official ECCC warning criteria for winter rainfall (40mm in 1 day) and summer, convective based rainfall (25mm in 1 hour). As parks infrastructure is highly varied and contains both hard and green infrastructure, staff, and members of the public, criteria that are widely used within the region to indicate situations that could produce failures of any portion of the parks infrastructure across all three locations are employed here. Future projections of precipitation extremes are an area of considerable research, though results are highly dependent on the underlying datasets, quality of historical data, choices for future projections, and method for downscaling of extremes to a particular location. These factors lead to a wide range in the spread of potential results for a given location, based on the methods chosen for future projection or downscaling of results. One of the methods that has performed well for future precipitation projection is the application of the Clausius-Clapeyron (CC) relationship between atmospheric temperature and the atmosphere’s capacity to hold moisture. (Trenberth, 1999; Allen and Ingram, 2002; Westra et al., 2014; Wang et al., 2017). Using this relation, studies indicate that extreme rainfall intensity is likely to increase at a rate equal to or possibly greater than approximately 7% per degree Celsius of climate warming. In Ontario, it is reasonable to expect an increase of precipitation rates at the CC relation value under stratiform or non-thunderstorm type precipitation events (e.g. winter rainfall), and potentially higher rates (up to ~10% per degree Celsius of climate warming) under the convective rainfall regimes (e.g. summer thunderstorm extremes). For winter rainfall, while specific studies of projected future estimates of intensity and rainfall totals is not available for individual events, it is likely to expect increases in events (i.e. an increase to the current event frequency of winter rainfall threshold exceedances due to overall warmer winters at the CC rate). 4 July 2018 29
You can also read