Lightning for Climate (DRAFT) - GCOS XXX A Study by the Task Team on Lightning Observation
←
→
Page content transcription
If your browser does not render page correctly, please read the page content below
Lightning for Climate (DRAFT)
   A Study by the Task Team on Lightning Observation
          For Climate Applications (TT-LOCA)
Of the Atmospheric Observation Panel for Climate (AOPC)

                      GCOS−XXX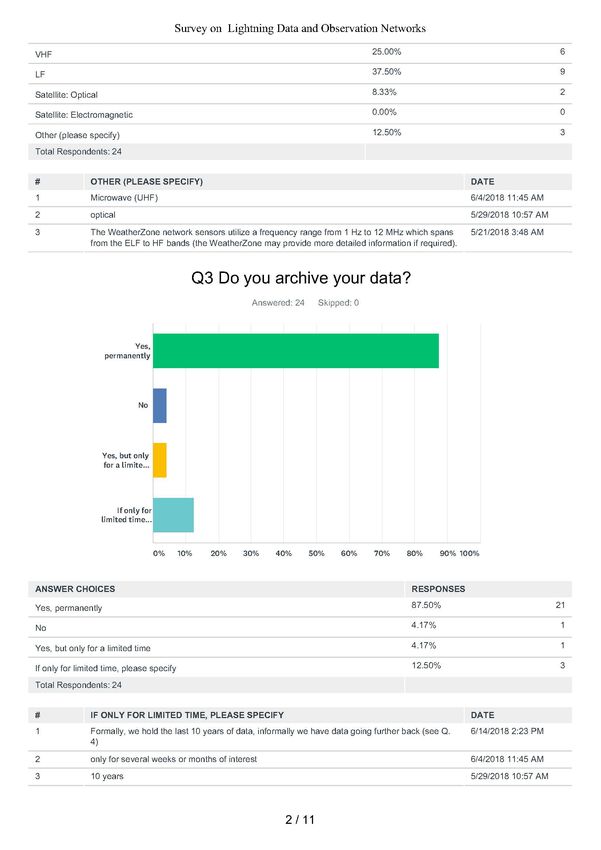
Lightning for Climate

   © World Meteorological Organization, 2019
       The right of publication in print, electronic and any other form and in any
language is reserved by WMO. Short extracts from WMO publications may be
reproduced without authorization, provided that the complete source is clearly
indicated. Editorial correspondence and requests to publish, reproduce or translate
this publication in part or in whole should be addressed to:
      Chair, Publications Board
      World Meteorological Organization (WMO)
      7 bis, avenue de la Paix                      Tel.: +41 (0) 22 730 84 03
      P.O. Box 2300                                 Fax: +41 (0) 22 730 80 40

          CH-1211 Geneva 2, Switzerland E-mail: Publications@wmo.int

      NOTE
      The designations employed in WMO publications and the presentation of
material in this publication do not imply the expression of any opinion whatsoever
on the part of WMO concerning the legal status of any country, territory, city or
area, or of its authorities, or concerning the delimitation of its frontiers or
boundaries.
      The mention of specific companies or products does not imply that they are
endorsed or recommended by WMO in preference to others of a similar nature
which are not mentioned or advertised.
       The findings, interpretations and conclusions expressed in WMO
publications with named authors are those of the authors alone and do not
necessarily reflect those of WMO or its Members.
      This publication has been issued without formal editing.

      Figure on front page: The road to lightning. Location: Batesville, Texas,
USA; photographer: Marko Korosec; credits: World Meteorological
Organization.

                                        2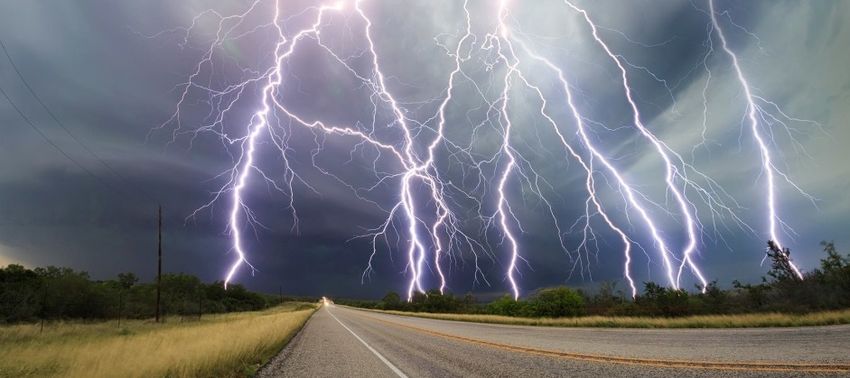
Lightning for Climate

3
Lightning for Climate

Table of Contents

Table of Contents ......................................................................... 4
1   Introduction ............................................................................. 6
2   Summary of Recommendations .............................................. 8
    2.1 Observations .................................................................................... 8
    2.2 Data Archival .................................................................................... 8
    2.3 Non-governmental Lightning Data................................................. 8
    2.4 Metadata .......................................................................................... 9
    2.5 Thunder Day Observations ............................................................. 9
    2.6 The Global Circuit ............................................................................ 9
    2.7 Schumann Resonances ................................................................. 10
3   Relevance of Lightning Data for Climate Applications ......... 11
    3.1 Casualties and Injuries .................................................................. 11
    3.2 Loss and Damage .......................................................................... 11
    3.3 Lightning as Proxy for Convective Activity and Storms ............. 12
    3.4 Current and Potential Use of Lightning Data for Climate
        Applications ................................................................................... 12
    3.5 Integration and Improvement of Nowcasting and Forecasting for
        Early Warning Systems and Adaptation ...................................... 14
    3.6 Lightning as a Driver of Climate Change ..................................... 14
4   Thunder Days ......................................................................... 16
    4.1 Brief History of Thunder Days ...................................................... 16
    4.2 Comparisons of Modern Satellite Observations of Global
        Lightning Activity and Thunder Day data .................................... 18
    4.3 Scientific Use of Thunder Day Observations ............................... 19
5   Open Research Questions...................................................... 21
    5.1 Drier Climate .................................................................................. 21
    5.2 El Niño–Southern Oscillation ........................................................ 21
    5.3 Model Parameterizations .............................................................. 21
    5.4 Aerosols ......................................................................................... 22

                                                4
Lightning for Climate

6    Observing systems and data ................................................. 23
     6.1 Survey on networks....................................................................... 23
     6.2 Complementary Observations by Satellite and Ground-Based
         Networks ........................................................................................ 25
     6.3 Observations from Space ............................................................. 27
     6.4 Ground-Based Observations ........................................................ 28
     6.5 Extreme Low Frequency (ELF): Schumann Resonances ............ 30
     6.6 Emerging Technologies (nano-satellites and cube-satellites) .... 31
7    Global Circuit ........................................................................ 33
8    Observation Requirements .................................................... 34
     8.1 Total Lightning Stroke Density (gridded)..................................... 34
     8.2 Schumann Resonances (emerging lightning product) ............... 35
9    Data Management ................................................................. 38
     9.1 Metadata for Ground Based Observations .................................. 38
     9.2 Metadata for Observations from Space ....................................... 39
     9.3 Best practices of data holding and data management ............... 40
10 The Role of the Private Sector and Community Based
   Networks ............................................................................... 42
References .................................................................................. 43
Glossary ...................................................................................... 57
Annex 1 ....................................................................................... 59
Annex 2 ....................................................................................... 70
     International Space Station (ISS) Lightning Imaging Sensor (LIS)
          WIGOS Metadata ........................................................................... 70
     NOAA/NESDIS Geostationary Operational Environmental Satellite
        (GOES) R-Series Program WIGOS Metadata ............................... 76

                                                 5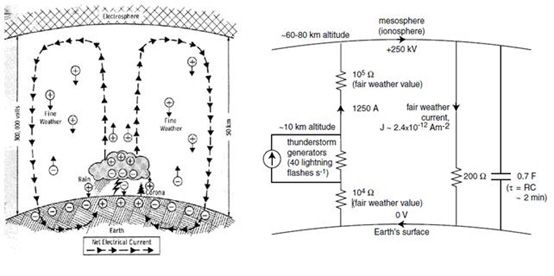
Lightning for Climate

1 Introduction

       In recent years, measurements of lightning have become more
extensive and new satellite instruments have further enhanced
measurement coverage. Lightning can be used as a proxy for monitoring
severe convection and precipitation, improving estimates of severe storm
development, evolution and intensity, and hence provide early warnings
for severe weather phenomena. In addition, lightning itself impacts the
global climate by producing nitrogen oxides (NOX), a strong greenhouse
gas. In regard to climate monitoring, lightning is thought to be a valuable
indicator to track and understand trends and extremes in convective
events under climate change.
       Due to this relevance and potential as climatological variable,
lightning has been added to the list of Essential Climate Variables (ECV)
in the 2016 GCOS Implementation Plan (IP) (GCOS, 2016), including a first
attempt to define the requirements for climate monitoring of lightning
measurements. Action 29 of the IP called for defining “the requirement
for lightning measurements, including data exchange, for climate
monitoring and to encourage space agencies and operators of ground-
based systems to strive for global coverage and reprocessing of existing
datasets”.
       In order to follow up on this action, the Atmospheric Observation
Panel for Climate (AOPC) agreed during AOPC-22 (Exeter, UK, March
2017, (GCOS, 2017)) on the creation of a dedicated task-team on lightning
observations for climate applications (TTLOCA). This task team continues
the work related to lightning observations of the Task Team on the Use of
Remote Sensing Data for Climate Monitoring of the Commission for
Climatology (CCL) as a joint GCOS/CCL task team.
      This study summarizes the work done by TTLOCA and covers key
aspects of lightning observations for climate applications. It explains the
relevance of lightning observations for climate, describes the current
status of observations, discusses gaps and open research questions and
provides suggestions for monitoring requirements for lightning,
including metadata requirements. Recommendations are summarized in
the beginning of the document with the intention that these
recommendations will be considered for the respective WMO
regulations.
      In addition, a glossary is added in order to standardize the
terminology. The report concludes with recommendations on how to

                                  6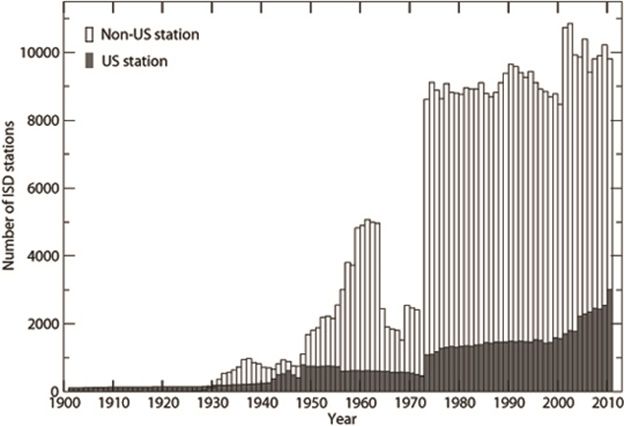
Lightning for Climate

observe lightning and manage data so it can be used for climate
monitoring and science.

                            7
Lightning for Climate
2 Summary of Recommendations
2.1 Observations
Better accessibility to lightning data and metadata would enable
distinctly more applications for lightning observations in a climate
context. Therefore we suggest that lightning shall be observed by WMO
members for climate applications as explained in section 8.1. The
lightning surface observations and also potential satellite observations
shall be shared.
Since there is currently no global data repository available for
lightning data, we suggest to further explore, if an archive including
satellite and in situ data for lightning would be feasible and provide
benefits compared to the current system.
2.2 Data Archival
Since lightning data are currently used mainly for nowcasting and
warning (see section 3.4), data management policies often do not include
the climate perspective. A survey showed that some data providers do
even not include permanent data storage for lightning data in their data
policies or important metadata are not available (see section 6.1). This
hinders current and will hinder future efforts to create climate-relevant
time series. Therefore we encourage all data providers to review their
data policy in regard to lightning and include permanent data archival.
2.3 Non-governmental Lightning Data
Some of the longest-running lightning data sets, with the highest
space and time resolution belong to private organizations or companies.
In order to make these data available for climate applications it is
important that privacy and intellectual property concerns of these
organizations are considered. The survey shows that most of these
organisations are generally willing to share their data under certain
conditions. This might include a time lag of, for example a month, since
the monetary value of the data will be diminished. Other conditions
might include a limitation to non-commercial usage of the data or only
for research.
We suggest that these considerations should be included in the
current discussion of WMO with all private networks to arrive at an
agreeable solution which neither adversely impacts the private
8Lightning for Climate
organizations, nor leaves these relevant lightning data completely out for
climate monitoring and science purposes.
2.4 Metadata
General recommendations in regard of metadata are listed in
section 9.1 and 9.2. For lightning, one main purpose of the lightning data
is absolute lightning detection efficiency at all points covered by the data,
and with sufficient time resolution to capture the frequent changes in
network configurations. Since absolute detection efficiency is not
possible, metadata must include sufficient information to develop the
needed detection efficiency variations of a network in order to inter-
compare lightning climatology in space and time among different
networks and techniques. In view of the fact that private companies are
the main data holders and potentially not willing to share station details,
this can also be provided by a relative detection efficiency for each pixel
at each time (see section 9.1). We recommend to consider this special
characteristic of ground-based lightning data in the context of the
renewal of the WIGOS Metadata Standard.
2.5 Thunder Day Observations
Operational monitoring of lightning started only late in the 20th
century and thus the diagnostic value of lightning time series in regard to
thunderstorm activity as a response to long-term climate change is still
limited. Thunder day observations, however, have been underway in a
systematic fashion since the 19th century and can potentially provide
insights into long-term trends. Therefore TTLOCA started an initiative to
locate thunder day observations worldwide toward supplementing
records of thunder days in existing digital data archives, such as the
NOAA Global Surface Summary of the Day (GSOD,
ftp://ftp.ncdc.noaa.gov/pub/data/gsod) and the NOAA Global Historical
Climatology Network - Daily dataset (GHCNd,
ftp://ftp.ncdc.noaa.gov/pub/data/ghcn/daily/). Once the task team has
collected all relevant information, we hope that the existing data can be
made available. Therefore we encourage WMO members to support
efforts to collect thunder day data to supplement the mentioned data
archives.
2.6 The Global Circuit
We propose using the GCOS Reference Upper-Air Network
(GRUAN) sites for regular ionospheric potential measurements using
small E-field sensors attached to regular radiosonde balloons. Only a few
9Lightning for Climate
GRUAN sites would be needed to estimate the global atmospheric
electrical activity (on a daily basis) and to monitor these changes into the
future. This will allow for continuously monitoring of changes in the
Earth’s global electric circuit which is directly related to thunderstorm
and lightning activity (see section 7). The balloon soundings measure the
electrical parameters in the free atmosphere, outside the boundary layer,
which often hampers other surface electrical measurements. However, a
sounding of ionospheric potential involves measurements both in the
free atmosphere and in the boundary layer. GRUAN has already agreed
to participate in an experiment as proof-of-concept and a more detailed
concept for this experiment, including funding, is being developed. We
encourage GCOS to further support this initiative in order to promote
the new ECV lightning.
2.7 Schumann Resonances
Monitoring extremely low frequency (ELF) electromagnetic
radiation at multiple stations seems to be an efficient method for
continuous monitoring of global lightning in absolute units, with far
fewer stations than are required for very low frequency (VLF) analysis.
Therefore the Atmospheric Panel for Climate Observations (AOPC) of
GCOS accepted Schumann Resonances as an emerging product for the
Essential Climate Variable (ECV) lightning (see section 6.5). In order to
become to be established as regular ECV product, we suggest AOPC to
review the continuity of data and evaluate the performance of the
measurements.
10Lightning for Climate
3 Relevance of Lightning Data for Climate Applications
3.1 Casualties and Injuries
Thunderstorms are spectacular weather phenomena and for
millennia humanity has been fascinated with the accompanying lightning
– one of the most powerful forces in nature. Lightning hazards are well
recognised and protection measures are in place to reduce the risk;
however, loss of life and damage to infrastructure caused by lightning
are still significant.
A number of comprehensive reports present country statistics of
lightning-related registered death including reports from Australia (650
fatalities in 1824 - 1991 (Coates et al., 1993)), Canada (999 fatalities in
1921 – 2003 (Mills et al., 2008)), China (5,033 fatalities in 1997 – 2009
(Zhang et al., 2011)), India (5,259 fatalities in 1979-2011 (Singh and Singh,
2015)), USA (20,758 fatalities in 1900 – 1991 (Lopez et al., 1998)), and
other countries (Holle, 2016). Global assumptions are highly uncertain
and (Cooper and Holle, 2019) estimate after an extensive review of
national data more than 24,000 fatalities per year.
In regard of injuries and people suffering from long-lasting
neurological disorders, the numbers are even bigger by an order of
magnitude. For developed countries a ratio of 10:1 for injuries per death
is assumed (Cherington et al., 1999). For developing countries, it is
assumed that the number is even higher (Cooper and Holle, 2019).
3.2 Loss and Damage
Assessments of lightning-related impacts and costs demonstrate
substantial economic losses for various sectors (Yair, 2018). Estimates of
lightning-related damage and disruption costs for Canada including
health, property, forestry and electricity indicate annual loss totalling
between $0.6 and 1 billion (Mills et al., 2010). For the USA, it is estimated
that lightning causes about US$5-6 billion in annual losses due to forest
and residential fires, and property damage (Kithil, 2003). Based on a 17-
year statistics (2001-2017), more than 10,143 lightning-caused wildland
fires are reported and more than 4.2 million acres are burned across the
USA annually (National Interagency Fire Center, 2018).
In general, thunderstorm-related losses are large and often cause
as much annual property loss in the USA as hurricanes, e.g. US$47
billion in 2011 (Sander et al., 2013). Insurance-related claims arising from
thunderstorms (wind, hail and flash flood damage) in Australia from 1967
11Lightning for Climate
to 1999 amount to about AU$5 billion (Insurance Council of Australia,
2000). The Sydney hailstorm of 14 April 1999 inflicted over AU$ 1.7
billion of insurance losses (2015 estimated loss value of AU$4.3 billion)
(Insurance Council of Australia, 2018) and topped the list of insurance
catastrophes of all time in Australia. The storm caused more losses than
tropical cyclone Tracy, which destroyed 70% of houses in Darwin in 1974
and the Newcastle earthquake, which damaged 50,000 buildings in the
city in 1989.
Significant casualties from lightning strikes and significant
thunderstorm-related losses clearly demonstrate that further
advancement of thunderstorm and lightning early warning systems is
required to reduce risk and improve protection of life and property.
3.3 Lightning as Proxy for Convective Activity and Storms
Lightning is an indicator of developing convective clouds that have
matured into thunderstorms. Convective initiation is typically first
indicated by radar when reflectivity indicating developing precipitation
aloft exceeds 35 dBZ and by lightning when the first lightning discharge
occurs. The first lightning produced by a storm is usually an intracloud
(IC) discharge occurring 5-10 min on average before the first ground
strike, although the first lightning discharge can be a cloud-to-ground
(CG) discharge. The sum of IC and CG lightning is referred to as total
lightning. As storm updrafts strengthen and the storms continue to
develop vertically, the total lightning frequency (dominated by the IC
lightning) will also increase (Gatlin and Goodman, 2010; Zipser and Lutz,
1994). Sometimes the cloud turrets will penetrate the tropopause where
the overshooting cloud turrets can be detected in satellite imagery (Bedka
et al., 2010). For damaging severe storms producing hail and strong
surface winds, lightning rates may approach hundreds of flashes per
minute. A rapid increase in lightning frequency, referred to as a lightning
jump (Schultz et al., 2011, 2009; Williams et al., 1999), often signals the
storm intensification before the severe weather is observed at the
ground.
3.4 Current and Potential Use of Lightning Data for Climate Applications
There are numerous uses for lightning data by forecasters,
commercial enterprises, researchers and the public. These uses can be
grouped into (a) Nowcasting and warning, (b) Forensics, (c) Risk
assessment, and (d) Research. Warning/nowcasting and forensic use of
lightning data are only indirectly linked to climate whereas risk
assessment and research are directly climate-related.
12Lightning for Climate
(a) Nowcasting and warning are only indirectly linked to climate
due to the difference of timescales. Currently the large majority of
lightning observations are used for this category of services and is also
covered by the private sector.. Since the number and intensity of
thunderstorms might increase under climate change, these observations
become more relevant in the context of adaptation (see section 3.5). They
typically include:
Severe storm detection and warning
Convective (flash flood) rainfall estimation
Storm tracking
Convective aviation hazard
Lightning safety
Warnings to power companies, fuel depots, outdoor activities
Forest fire forecasting
Predicting cyclone intensification
(b) Lightning data are forensically used for example by insurance
companies to investigate whether a fire was initiated by lightning or if
lightning caused damage to infrastructure.
(c) Risk assessments by national institutions and the private sector
are mainly conducted in order to understand risks for lightning damage,
and are based on observations. The lightning climatologies for risk
assessment are based on long time series and are used to plan
infrastructure like power grids and air traffic.
(d) Research about lightning and connectivity depends on
lightning observations. The scope of this research is very broad.
Particularly relevant for climate is research on trends in lightning activity
as a proxy for storms (see section 3.3). Other important research
questions related to climate are explained in detail in section 5. Lightning
research also includes the following topics:
Climate variability and change
Understanding the physics of the global electric circuit
Understanding the magnetosphere and ionosphere
Studies of NOx generation
Aerosol effects
Studies of whistler and other wave propagation phenomena
13Lightning for Climate
Transient luminous events
Terrestrial gamma-ray flashes.
A survey (see section 6.1) initiated by the task team about lightning
observation networks showed that private and national networks
currently focus mainly on (a), warning and nowcasting. Still 50% of the
networks in the survey responded that their data are used in addition for
climate applications and mainly for research (c) and lightning
climatologies (d).
3.5 Integration and Improvement of Nowcasting and Forecasting for
Early Warning Systems and Adaptation
In conjunction with radar and satellite, the lightning data provide
additional insight into the existence and intensity of convective activity
that is beneficial in forecasting, nowcasting, and warning decision-
making. Lightning parameters of interest include the location, time,
intensity, polarity, duration, and areal extent. The lightning data are
visualized as individual points or as accumulated grids in space (over
several km) and time (several minutes) to match the update rate of radar
or satellite imagery. For example, newly available lightning data from
operational weather satellites (running five minute moving average
trends) are superimposed in the forecaster workstation on top of radar
and satellite (visible and infrared) imagery loops, or NWP model fields
(Goodman et al., 2012; Gravelle et al., 2016). The integrated display of
lightning data enhances forecaster situational awareness and adds
confidence in their decision-making.
3.6 Lightning as a Driver of Climate Change
Lightning discharges are a major source of nitrogen oxide gases
called NOx (Koshak, 2014; Lapierre et al., 2018; Price et al., 1997;
Schumann and Huntrieser, 2007). The two primary gases (NO and NO2)
are formed during the lightning discharge when the air is heated to
30,000 degrees inside the lightning channel. Since air is made up of
approximately 80% N2 and 20% O2, these molecules breakup into
nitrogen and oxygen atoms. When the channel expands outwards and
cools, new compounds form as a result of the nitrogen and oxygen
atoms recombining. The amount of NOx gases formed is related to the
rate of cooling of the channel. There is a debate among scientists
working in this field as to the relative efficiency of different types of
lightning flashes (IC versus CG) to produce NOx. Besides the hot lightning
channel, it is also likely that NOx is produced outside the channel, within
14Lightning for Climate
the region of high electric fields surrounding the channel (Cooray et al.,
2009).
These NOx gases react with other gases in the atmosphere
resulting in the formation of ozone (O3). Ozone in the lower atmosphere
where we live, and where the lightning occurs is toxic to humans and
plants, but it absorbs heat from the earth's surface, acting as a
greenhouse gas, contributing to the warming of the atmosphere. There is
convincing evidence that tropospheric ozone is increasing in
concentration over time. Lightning is not the only source of NOx in the
atmosphere. In fact, there are many sources of NOx, with the
anthropogenic burning of fossil fuels being the main contributor to NOx
concentrations in the atmosphere. However, lightning is the largest
natural source (~5-1- Tg N/yr), and perhaps the largest source overall in
the upper parts of the troposphere where changes in ozone
concentrations are very important in the study of future climate change
(Grewe, 2004).
15Lightning for Climate
4 Thunder Days
Thunder days are defined as days with thunder heard and are a
proxy for lightning activity. This activity has been shown to be responsive
to two recognized climate variables: surface air temperature and
boundary layer aerosol. Evidence for the responsiveness of lightning to
temperature has been demonstrated on several natural time scales: the
diurnal (Bailey et al., 2007; Blakeslee et al., 2014; Markson, 2007, 2003;
Markson and Price, 1999; Price, 1993; Virts et al., 2013; Williams, 1999),
the semiannual time scale (Füllekrug and Fraser-Smith, 1996; Williams,
1994), the annual time scale (Adlerman and Williams, 1996; Blakeslee et
al., 2014; Christian et al., 2003; Williams, 1994) and the ENSO (El Nino
Southern Oscillation) time scale (Chronis et al., 2008; Goodman et al.,
2000; Hamid et al., 2001; Sátori et al., 2009b; Williams, 1992; Yoshida et
al., 2007). Model calculations also suggest greater lightning in a warmer
climate (Romps et al., 2014). In contrast to the large body of evidence for
increasing lightning activity under global warming, a recent study
projected a decrease of lightning due to a decrease of cloud ice content
(Finney et al., 2018). In addition, the evidence for lightning response on
the 11-year solar cycle time scale is conflicting (Brooks, 1934; Christian et
al., 2003; Fischer and Mühleisen, 1972; Kleymenova, 1967; Pinto Neto et
al., 2013) and deserves further attention. An increasing body of evidence
has shown that convective vigour and lightning activity are also
enhanced by richer concentrations of cloud condensation nuclei (Altaratz
et al., 2017; Bell et al., 2009; Fan et al., 2018; Mansell and Ziegler, 2013;
Rosenfeld et al., 2008; Stolz et al., 2017, 2015; Thornton et al., 2017).
4.1 Brief History of Thunder Days
The “thunder day” was defined as a standard meteorological unit
by the International Meteorological Committee in Vienna in 1873, and
was further characterized with a symbol ‘T’ in Paris in 1896.
Measurements of the Earth’ electric field over the oceans (Mauchly, 1923)
and the emergence of a global signal in universal time, led to C.T.R.
Wilson’s (1921) hypothesis for the global electrical circuit, maintained by
the integrated contribution of electrified weather worldwide. This
development motivated Brooks (1925) in turn to make the first
assessment of the global thunderstorm activity. A large dataset of 3265
surface stations with thunder day observations became the basis for the
cornerstone of atmospheric electricity (Whipple, 1929; Whipple and
Scrase, 1936). The recognized value of thunder days to mainstream
16Lightning for Climate
meteorology led the WMO to assemble data from 3840 stations from 190
countries to produce a global monthly climatology (WMO, 1953, Part I),
including global maps (Part II).
A second key WMO contribution toward an organized multi-station
time series of thunder day data was facilitated by their collaboration with
the United States Air Force in 1972 on the GSOD (Global Surface
Observation of the Day) dataset (NOAA, n.d.); This compilation had new
applicability to climate studies as it extends the global thunderstorm
record back many decades before any lightning network observations are
available.
Figure 1 shows the evolution of archived station data in GSOD over
the full period of the dataset. In recent years, the number of stations
reporting is greater than the station counts used to compute the global
mean temperature (e.g. Hansen and Lebedeff, 1987). Evidently GSOD
focused on archival going forward from the time of its inception, but little
effort was devoted to collecting the station archives on thunder days
from the period prior to 1972. Some enhancement of station collection
occurred in the decade of the 1953 WMO report, but earlier data are
scarce, and no data are in hand prior to 1929, when the existence of
archived thunder day data are well documented. We have abundant
evidence however that these data (Brooks, 1925) exist in the
meteorological archives of individual countries.
17Lightning for Climate
Figure 1 Number of reporting stations versus time for thunder days in the
GSOD data set, established in 1972.
Beginning in the late 1990s, automatic weather stations came into
widespread use, with a consequent reduction in the number of human
observers in national weather services. This situation has led to a
reduction in the number of stations reporting thunder days, though all
airport stations worldwide continue the original practice.
4.2 Comparisons of Modern Satellite Observations of Global Lightning
Activity and Thunder Day data
The continuous observation of global lightning activity is a
desirable goal from the climate perspective (Williams, 2005) but has not
yet been achieved. The optical observations of lightning from Low Earth
Orbit are sufficient however to document the climatological variation of
global lightning on the diurnal and seasonal time scales for which
systematic global temperature variations are also present (Williams,
1994). The reliability of thunder days as a proxy for worldwide lightning
activity can be judged in part by its behaviour on natural time scales. The
evidence for agreement on the diurnal time scale comes from the
classical work on the global electrical circuit by Brooks (1925), Whipple
(1929) and Whipple and Scrase ( 1936), in comparison with the modern
satellite observations of Bailey et al. ( 2007) and Blakeslee et al. (2014).
Comparisons on the seasonal time scale consist of calculations with the
18Lightning for Climate
gridded WMO ( 1953) climatology (Williams, 1994) and comparisons with
satellite optical observations Christian et al. (2003). The semiannual
variation is clearly present in both climatologies, when the near
equatorial zone is examined. For the annual variation, the tendency for
greater thunder day activity in NH summer is apparent, but the
summertime maximum (August) is not evident in the thunder day
climatology (Williams, 1994). A possible explanation is that the number
of flashes per thunder day in summer is greater in the baroclinic regions
at higher latitude than in the quasi-barotropic region of the near
equatorial region. This suggestion can be checked with satellite or by
ground based global lightning data.
4.3 Scientific Use of Thunder Day Observations
Thunder day observations have been used extensively for the
investigation of regional trends, for example in Australia (Davis and
Walsh, 2008; Kuleshov et al., 2002), Brazil (Sales, 2014), in the Baltic
countries (Enno et al., 2014), in Ontario, Canada (Huryn et al., 2016), in
China (Chen et al., 2004; Wei et al., 2011), in Finland (Tuomi and Mäkelä,
2008), in Germany (Kunz et al., 2009), in Iran (Araghi et al., 2016; Ghavidel
et al., 2017; Khalesi, 2014) in Nigeria (Ologunorisa and Chinago, 2004), in
Poland (Bielec-Bąkowska, 2003; Bielec-Bakowska and Lupikasza, 2009), in
Russia (Adzhiev and Adzhieva, 2009; Gorbatenko and Dulzon, 2001), in
Alaska (Williams, 2009) and in the continental United States (Changnon,
1985; Changnon and Changnon, 2001; Changnon and Hsu, 1984; Koshak
et al., 2015). Correlated trends between thunder days and surface air
temperature provide evidence for urban warming (Pinto Jr., 2009; Pinto
Neto et al., 2013), as well as possible aerosol effects.
ENSO variations in thunder day records, possibly linked with
variations in both temperature and aerosol, have been considered by
Pinto et al. (2015) in Brazil and by Kulkarni et al. (2015) in India. Brooks
(1934), Kleymenova (1967), Fischer and Mühleisen (1972); and Pinto et al.
( 2013) have all searched for the 11-year solar cycle in thunder day
records of exceptional length, with varying success. Long-term increases
in thunder days at stations on the Sea of Japan (Yamamoto et al., 2016)
have been shown to accompany long-term increases in sea surface
temperature there. Previously published thunder day observations in the
USA by Changnon and Hsu (1984) and Changnon (1985) and by
Gorbatenko and Dulzon (2001)) overlap with the “big hiatus” in global
warming in the period 1940 to 1976, and show flat or declining
behaviour, consistent with the behaviour of global temperature (Williams
et al., 2016).
19Lightning for Climate
The global temperature has been shown to vary by 0.1 oC (peak-to-
peak) on the 11-year solar cycle time scale (Camp and Tung, 2007; Tung
and Camp, 2008; Zhou and Tung, 2013), substantially smaller than the
temperature variations on the other natural time scales discussed
previously (all on the order of 1 oC). All these latter studies have clear
implications for climate change and global warming. The nature of
scientific investigations involving thunder days can expand to global
scale once a sufficiently long record at stations as numerous as those
used for climatological studies (Brooks, 1925; WMO, 1953) assembled
from presently separate archives. This action also speaks to the need
raised by Holzworth and Volland (1986) for a global geoelectric index, but
for decades gone by. A resolution in such an archive at monthly time
scale would fulfil many needs for climate studies (ENSO, 11-year solar
cycle time scale, global warming), but a continuation of the practice in
the GSOD dataset with daily/hourly resolution is certainly desirable.
20Lightning for Climate
5 Open Research Questions
5.1 Drier Climate
There appears to be an apparent paradox when looking at regional
time-averaged lightning and precipitation relationships. It is well known
for many years that lightning and rainfall are positively correlated in
individual storms, and that generally thunderstorms with more lightning
will likely produce more rainfall. However, the opposite relationship
appears to occur on larger spatial and temporal scales. Observational and
modelling evidence shows that in some cases regional lightning activity
actually increases as those regions become hotter and drier at the surface
(Price, 2009). The tropical continental centers of lightning activity rank in
the opposite order when considering lightning and precipitation. While
Africa is thought to have the highest lightning activity of the three
chimney regions, it may also have the lowest rainfall (Williams, 2005).
5.2 El Niño–Southern Oscillation
When we look at the impact of the ENSO cycle on tropical lightning
and rainfall, a similar negative relationship is observed, with drought-
stricken Southeast Asia during the El Nino years having more lightning
than during the wetter La Nina periods (Hamid et al., 2001; Yoshida et al.,
2007). This result is in contrast to the increase in wintertime lightning and
severe storms observed in the southeast US attributed to enhanced
cyclogenesis and a stronger jet stream (Goodman et al., 2000). Since the
rainfall over these islands of the Maritime Continent is mostly due to
convective precipitation, the only way to produce more lightning with
less precipitation is to produce more intense convective activity in each
thunderstorm. This could occur if we had fewer thunderstorms, with each
thunderstorm more vigorous, producing more lightning.
5.3 Model Parameterizations
In order to simulate lightning activity in climate models (GCMs) it
is necessary to develop lightning parameterizations, since these models
cannot resolve the clouds-scale processes that generate lightning. A few
parameterizations have been developed (Lopez, 2016; Price and Rind,
1992; Tost et al., 2007). Numerous climate model simulations have
suggested that lightning activity will increase in a warmer climate
(Grenfell et al., 2003; Price and Rind, 1994; Shindell et al., 2006). Although
the parameterizations of lightning in global climate models are quite
crude, the models nevertheless manage to capture some aspects of
21Lightning for Climate
global lightning climatologies (Shindell et al., 2006). Most of these
modelling studies indicate an approximate 10% increase in lightning
activity globally for every 1 K global warming, with most of the increase
occurring in the tropics. A recent paper however claims that tropical
lightning may decrease in a warmer climate (Finney et al., 2018).
5.4 Aerosols
The role of aerosols in thunderstorm electrification is still an open
question. It is possible that drier climates will result in more suspended
aerosols, dust and cloud condensation nuclei, hence influencing cloud
microphysics and cloud electrification (Williams et al., 2002). However, it
should be pointed out that many climate model simulations of lightning
do not include any aerosol effects, and address only thermodynamic
changes in their simulations. Whether aerosol effects would enhance
these changes is a topic for future studies.
Altaratz et al. (2010) showed that aerosols can have different
impacts on lightning activity depending on the concentrations in the
background atmosphere. In clean environments, adding aerosols tends to
enhance the lightning activity, while in polluted environments, adding
more aerosols tends to diminish lightning activity.
In a recent study by Thornton et al. (2017), it was shown that the
three month running mean of lightning density was enhanced by a factor
of two or more over ocean shipping lanes using high resolution lightning
climatology data from 2005 through 2016. Using PM2.5 aerosol data, the
authors showed that the enhanced aerosol from the shipping was directly
aligned with the enhanced lightning suggesting an important role in the
addition of the aerosol.
22Lightning for Climate
6 Observing systems and data
6.1 Survey on networks
In order to learn more about existing data and networks as well as
their data policy, the task team conducted an online survey (see
questions and summary of answers in Annex 1). Invitations to the survey
were sent to all national, private sector and scientific lightning detection
networks known to the members of the task team and for which contacts
were available. Their survey was sent in May 2018 to 36
networks/lightning data providers and we received 24 answers up until it
closed in June 2018. Three of 12 contacted space networks responded
and 21 of 26 in situ networks.
The survey consisted of ten questions about the network and its
data and two additional questions about the reference of the data set.
Please note that the summary below is only based on the received
answers and other important networks and the answers might not reflect
the global picture of lightning observations.
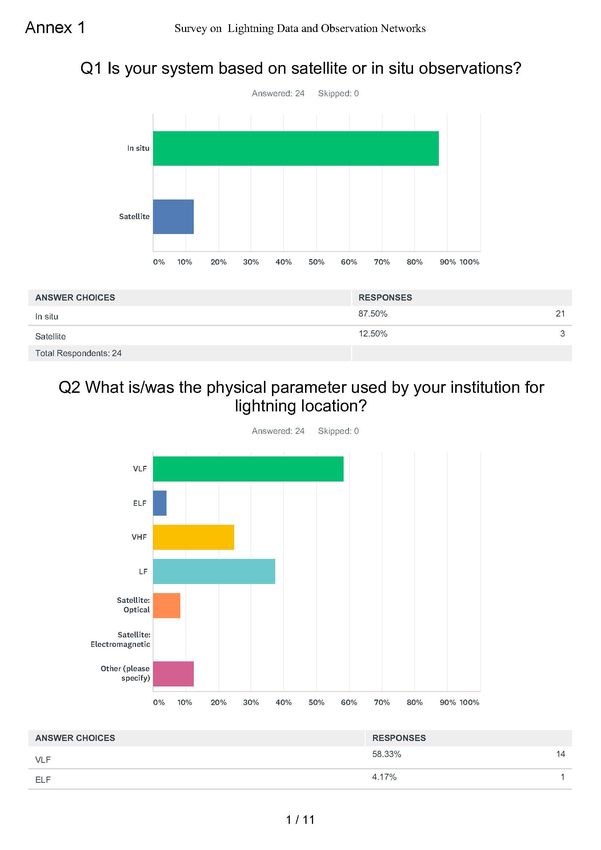
Question 1 asked whether it is an in-situ or satellite observing
system.
Question 2 asked how lightning is measured by the respective
network.
Most networks (58%) use VLF or LF (38%) frequencies.
Question 3 asked if the data would be archived and if yes, for how
long.
21 of the networks store their data permanently, three for a limited
time and one does not store it at all. This is discussed in more detail in
section 9.3 on data holding and management.
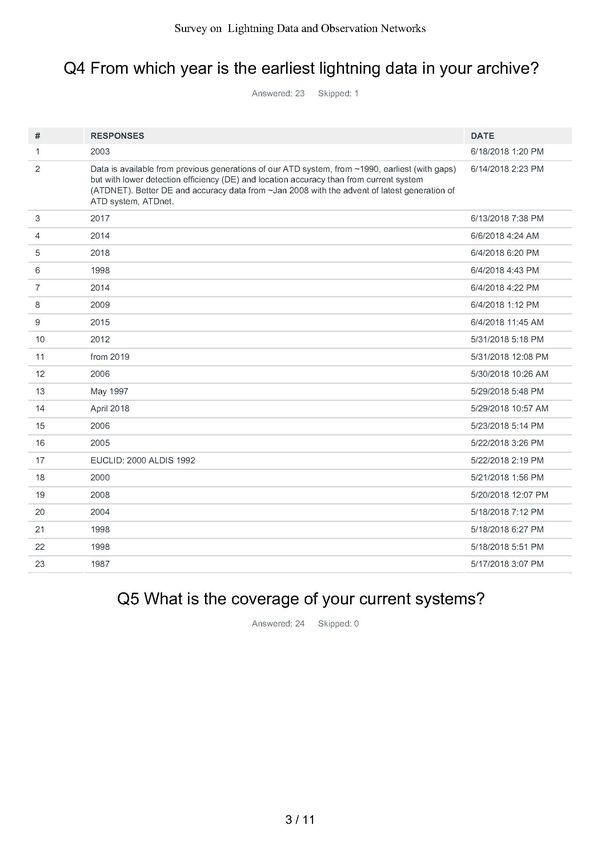
Question 4 asked about the earliest available data.
As shown in Figure 2, in-situ data are available from 1987 onwards
and is increasing steadily to present. The first uninterrupted global data
set within the survey responses starts in 2004 which indicates the need
for proxy data dating back longer in time in order to understand climatic
trends in global lightning occurrence (see section 4 on thunder days).
Near-global (with varying latitudinal coverage extent) space-based
observations began in 1995 and also continue today.
Question 5 asked about the geographic coverage of the networks.
23Lightning for Climate
Of the addressed networks, four are global, 10 regional and nine
national. Of the four global datasets, two are community based (The
World Wide Lightning Location Network (WWLN) and Blitzortung.org)
and two are commercial (the Global Lightning Dataset (GLD360),
operated by Vaisala and the Earth Networks Total Lightning Network
(ENTLN), operated by Earth Networks). This is further discussed in
section 10 on the role of the private sector.
Figure 2 Number of in situ lightning networks with lightning with year of
earliest available data.
Question 6 asked what information is stored by the networks.
All networks provide information about the location and the timing
of the lightning and most also include the intensity (78%). 52% provide
information about whether its IC or CG lightning.
Question 7 asked about availability of metadata.
74% have at least some information and 26% do not provide
metadata.
Question 8 asked about the kind of metadata available.
Of the networks with metadata, 90% store the location of the
station and 77% the type of the sensor and more detailed information like
the processing algorithm or station/sensor operations are stored by fewer
networks. This is further discussed in section 9.3 about data holding and
management.
24Lightning for Climate
Question 9 asked if the data are used for climate applications or if
products for climate applications are offered.
50% of the networks state that there data are or have been used for
climate applications. The main two applications are lightning
climatologies used to calculate risks and climate research. This is further
discussed in section 3.4 of lightning data for climate applications.
Question 10 asked, whether the network/institution would
potentially be willing to share lightning data for climate purposes.
87.5% of the polled networks are potentially willing to share data
and 21% even without a time lag. Asked for specific conditions under
which they would share data, mainly time lag and a restriction to
research and non-commercial usage was mentioned. This is further
discussed in section 10 on the role of the private sector.
Question 11 and 12 were questions about the references and
contact information of the networks.
6.2 Complementary Observations by Satellite and Ground-Based
Networks
For ground-based lightning networks operating at various radio
frequencies from Very Low Frequency (VLF) to Very High Frequency
(VHF), variations in ground conductivity, topography, ambient noise, and
receiver spacing can all affect the resolution, accuracy and temporal
stability of the received signal. The lower frequency networks are best at
the detection and discrimination of the CG lightning component with
high spatial accuracy, while the VHF ground-based networks excel at
mapping the detailed geometry of the lightning channels in the cloud
with nearly 100% flash detection efficiency within the boundaries of the
network (typically out to a range of 150 km).
The optical satellite-based lightning mappers excel at detecting the
total lightning over large areas with near uniform detection efficiency, as
well as the horizontal extent or area of the flash, sometimes extending
tens to hundreds of kilometres, but the received pixel-based optical
signal is of lower spatial resolution than typical regional ground-based
networks. Further, the optical signal can be attenuated by a long
intervening optical path through very thick clouds, obscured by sun glint,
and the performance impacted by energetic particles in the space
environment. Ground processing algorithms have been developed to
filter erroneous or false lightning events and, as the GLM is a new
25Lightning for Climate
instrument, will be improved over time. The satellite instruments are also
not able to uniquely identify IC vs CG lightning or current polarity on an
individual flash basis. The IC or CG characteristics are difficult to identify
owing to the extensive channels of CG flashes in the cloud that also
produce numerous optical pulses observable at cloud top. Therefore, the
satellite and ground-based systems complement each other in fully
describing the attributes of a lightning discharge.
Key performance attributes of both the ground-based and space-
based lightning detection and mapping systems that are important to
users are the Detection Efficiency (DE), Stability, Consistency, and
Accuracy (Nag et al., 2015). Attributes of accuracy include the Location (of
the ground strike or cloud pulse), initiation and termination of the
discharge, its Propagation and Areal extent, Amplitude, Peak current or
radiance (optical), Energy, Polarity (positive or negative charge),
Multiplicity (number of return strokes), Flash Rate (frequency and
tendency/rate of change), and Lightning type (IC or CG). No one type of
system is best at measuring all the lightning attributes and therefore
efforts are ongoing to determine how best to merge the satellite with the
ground-based data.
No lightning location system detects lightning at all points in space
and time. Ground bases systems such as LMA (Lightning Mapping
Arrays) have been shown to be efficient at locating nearly all the tiny
sparks in a stroke with high spatial (horizontally and vertically) and
temporal fidelity, but only over a small region (few hundred km at most).
Ground based RF networks can cover the world with a relatively few
sensors, although with lower and variable detection efficiency, and lower
spatial resolution than LMAs.
On the other hand, low altitude orbiting (LEO) satellite based
optical systems for locating lightning can approach the LMA detection
efficiency for high-altitude cloud strokes, over a small instantaneous
areas (with lower spatial accuracy), and they do cover much of the globe
(as limited by their orbits and viewing area) but generally cannot detect
temporal variations of lightning over the lifetime of thunderstorms due to
the LEO satellite orbital motion. Recently high resolution geostationary
satellite optical lightning detection capability which approaches the level
of absolute detection efficiency for the viewing area have been launched,
but they cannot determine stroke altitude, type or polarity nor can they
see the whole world (note: lightning occurs regularly north of 55 degrees
latitude in the summer over Alaska, Canada, Europe and Asia).
Furthermore, both LEO and Geostationary lightning imagers have the
intrinsic limitation of only seeing light that comes out of the tops of the
26Lightning for Climate
clouds, and cannot determine altitude of the light emission. This means
neither space-based, nor ground-based lightning location systems so far
deployed can see all the lightning, which climate modellers might need.
For the purposes of this study, we suggest that space-based and
ground-based lightning location systems are complementary. Climate
modellers using, say, NOAA GOES-16/17 GLM lightning data, who want
to study climate variations leading to, for example Tropical Cyclone
formation, may well benefit from the ground-based lightning data on
west African storm development, which is out of the field of view of the
GLM instrument. Alternatively, space-based optical lightning data can
help calibrate ground-based RF lightning location detection efficiency.
Similarly, satellite based systems can use LMA lightning data or total
lightning detection using RF sensors to calibrate both detection efficiency
as well as spatial fidelity of the satellite measurements.
6.3 Observations from Space
Lightning observations from space date back to the earliest days of
research satellites as well as the manned space program when
astronauts reported on the spectacular light show as seen from their
perspective high above the clouds at night (Goodman and Christian,
1993). The current generation of research and operational lightning
instruments in space all use the same or similar approach of spatial,
temporal, and spectral filtering for detecting the lightning optical
emissions throughout day and night with 5-10 km storm scale resolution
and a detection efficiency for total lightning of 70-80% within the viewing
area (Goodman et al., 2013; Rudlosky et al., 2018) .
The Optical Transient Detector (1995-2000, Cecil et al., 2014) and
Lightning Imaging Sensor (1997-2015, Albrecht et al., 2016) developed by
NASA for Mission to Planet Earth as components of the Earth Observing
System provide the longest record of space-based lightning observations
from low earth orbit. Based on the success of the OTD and LIS, there is
now a LIS copy on the International Space Station (ISS-LIS, launched
February, 2017) for an expected 2-4-year mission. NOAA operates a
Geostationary Lightning Mapper (GLM) on the GOES-R series of
Geostationary Operational Environmental Satellites. The first two in the
block of four new satellites are in orbit as GOES-16 (launched November,
2016 and operational as the GOES-East satellite at 75.2 W since
December, 2017) and GOES-17 (launched March, 2018 and is will replace
the aging GOES-15 satellite in January at 137.2 W). The GOES-R series
constellation satellite and instruments will be the primary operational
lightning mappers for the western hemisphere through 2036. The
27Lightning for Climate
Chinese Meteorological Agency launched its new Feng-Yun (FY-4a)
second generation geostationary satellite in December, 2016 with a
prototype Geostationary Lightning Mapping Imager (LMI) of a similar
design and product concept to the LIS and GLM. The FY-4c satellite will
also carry an advanced LMI instrument with a much larger area of Asia
coverage. EUMETSAT plans four operational Meteosat Third Generation
geostationary earth-orbiting satellite Lightning Imagers (MTG-LI)
covering nearly the whole of Europe and Africa with the planned launch
of the first MTG-I imaging satellite in 2021 made operational in 2022.
Other national space agencies in Asia such as the Japanese
Meteorological Agency (JMA) are considering possible lightning
mappers on their future geostationary satellites.
Various ground-based lightning networks (primarily RF) and the
ISS-LIS (optical) provide the primary means for independent performance
validation of the new space-based geostationary lightning instruments.
Limited-duration airborne science experiments with optical lightning
instruments also supported the in-orbit GLM performance assessment.
As per the recommendation of the WMO Integrated Global Observing
System (WIGOS) and Coordinating Group on Meteorological Satellites
(CGMS) Baseline, extensive use of reference instruments and well-
characterized calibration sites will be used for performance assessments
and long-term trending, cross-validation, and inter-calibration of the
various satellite instruments to produce a high-quality climate data set.
6.4 Ground-Based Observations
The workhorse of lightning sensing as used for meteorology and
climate studies have been the ground based RF systems. These systems
have been around the longest and have the broadest coverage of any
lightning sensing system, and therefore are highly useful to be included
in any lightning climatology study. Ground based radio frequency (RF)
systems detect the electromagnetic radiation pulses from electric
currents in lightning processes. LMAs use cross-correlated waveforms at
VHF (50-200 MHz) frequencies collected by approximately 10 to 20
stations to locate small-scale current pulses associated with rapid charge
movements inside clouds.
These data can be used to follow the leader process of a stroke as
it develops. Many large regional networks operate in the Low Frequency
(LF)/Middle Frequency (MF)/High Frequency (HF) region of the radio
spectrum (0.1 – 20 MHz say) and can cover a continental area with
hundreds of stations. These systems typically operate at RF frequencies
up to 10s of MHz and locate lightning using multiple electric field time of
28Lightning for Climate
arrival (TOA) correlations, or use fewer stations with crossed magnetic
loops to find the bearing direction and time of arrival for location, and
then determine polarity using a vertical electric antenna. LF/Mf/HF
systems detect the ground wave from lightning and are generally limited
to location of lightning within a few hundred kilometres, beyond which
point the sky wave and ground wave overlap complicating the waveform,
and making cross correlation difficult. These LF systems therefore have
great spatial coverage over well-instrumented continents, but do not
reach off shore or across some national boundaries more than a few
hundred kilometres (where there are no sensors).
Moving down in frequency to the VLF range (3-30 kHz) it is possible
to cover the globe with far fewer stations. This is because the peak
energy in RF radiation from lightning cloud to ground-strokes is in the
frequency range around 10-15 kHz. These waves travel around the world
in the Earth ionosphere wave-guide at nearly the speed of light, and with
moderate attenuation. Therefore sensors detect lightning sferics (also
known as discrete lightning strokes) out to about 6,000 km in the daytime
and nearly 20,000 km at night. These VLF networks do not identify the
small-scale strokes in a cloud, and are inefficient at locating in-cloud
strokes, and are less efficient at locating weak cloud-to -ground strokes. It
is difficult at best for VLF-based RF lightning locating systems to
determine polarity or altitude of distant strokes. This difficulty is largely
due to the multi-modal nature of VLF waveguide modes.
All of these RF lightning location systems have the intrinsic
capability of high, absolute UTC time accuracy (sub-microsecond) and
spatial accuracy (down to about 4 km on average) over the globe. These
time and space accuracies are better than any demonstrated for any
satellite system.
Regional climate studies may benefit greatly from limited regional
lightning networks, using either direction finding or time or arrival
techniques, for the case of detailed, local climate change studies.
Eventually, after sufficient data sets has been collected, data from the
geostationary mappers will be useful for studying lightning climatology.
On the other hand, global climate modelling may benefit the most from
use of the long-range RF network data, using detection efficiency tested
with satellite lightning data.
For more information see for instance: Rudlosky, personal
communication, 201:5
https://lightning.umd.edu/documents/Basic_Lightning_Detection_Descript
ion_V2.pdf.
29Lightning for Climate
6.5 Extreme Low Frequency (ELF): Schumann Resonances
At Extreme Low Frequency (ELF) (3 to 1600 Hz) and Very Low
Frequencies (VLF) frequencies (1600 Hz to 20 kHz), the electromagnetic
radiation from lightning flashes is contained within the Earth-ionosphere
cavity—a global waveguide and natural framework for monitoring
worldwide lightning activity for climate purposes. However only at ELF
frequencies is the attenuation sufficiently small to allow for global reach
from a single receiving station. The strong contrast in attenuation
between ELF (~0.1 dB/Mm) and VLF (~1 to 10 dB/Mm) dictates the need
for entirely different detection methods for ordinary lightning flashes at
VLF and ELF. For example, at VLF large numbers of receivers are needed
for high global detection efficiency of discrete lightning strokes (e.g., Virts
et al., 2013), otherwise known as ‘sferics’. For global VLF networks such
as WWLLN and GLD360, the strongest strokes originate in CG lightning
flashes, though some IC lightning close to receivers are also detected. In
contrast, at ELF the attenuation is sufficiently small to enable resonance
effects within the global waveguide and the phenomenon known as
Schumann resonances. The fundamental resonance mode near 8 Hz
involves an electromagnetic wavelength equal to the circumference of
the Earth (40 Mm). In this lower ELF frequency range (3-40 Hz) the
individual waveforms from lightning strokes overlap in time to form the
“background” signal. For a nominal global stroke rate of 100 per second,
the mean interstroke interval is 10 ms. This time is small in comparison
with the circum-propagation time (~130 ms) for any given stroke,
guaranteeing the overlapping of waveforms. This overlapping process
prevents the identification of the individual strokes from ordinary
convective scale lightning that dominates the worldwide activity.
A notable exception to the common waveform overlap at ELF
occurs in the case of exceptional mesoscale (in contrast with convective
scale) lightning flashes which can singlehandedly ring the Schumann
resonances to intensity levels 10-20 dB greater than the level of the
background signal. These exceptional Q-burst events (Ogawa et al., 1967)
also produce Transient Luminous Events (TLEs) – haloes, sprites and
elves—in the mesosphere, and in so doing modify the global waveguide
to some extent. These special events stand out so conspicuously above
the background that they can be mapped worldwide from single
receiving stations (Greenberg and Price, 2004; Guha-Sapir et al., 2017;
Hobara et al., 2006; Huang et al., 1999; Kemp, 1971; Kemp and Jones,
1971; Williams et al., 2010). Multi-station time-of-arrival methods have
also been implemented for the geolocation of exceptional flashes
(Yamashita et al., 2011). Given that these events lie in the tail of the
30You can also read