HEATWAVES: HOTTER, LONGER, MORE OFTEN - Climate Council
←
→
Page content transcription
If your browser does not render page correctly, please read the page content below
HEATWAVES:
HOTTER,
LONGER,
MORE OFTEN

The Climate Council is an independent, crowd-funded organisation providing quality information
on climate change to the Australian public.

CLIMATECOUNCIL.ORG.AU
HEATWAVES: HOTTER, LONGER, MORE OFTEN

                                        Written by Professor Will Steffen,
                                        Professor Lesley Hughes and Dr. Sarah
                                        Perkins
                                        Published by the Climate Council of Australia Limited.
                                        ISBN:     978-0-9924142-2-1 (print)
                                                  978-0-9924142-3-8 (web)
                                        © Climate Council of Australian Ltd 2014.
                                        This work is copyright the Climate Council of Australia Ltd.
                                        All material contained in this work is copyright the Climate
                                        Council of Australia Ltd except where a third party source is
                                        indicated.
                                        Climate Council of Australia Ltd copyright material is
                                        licensed under the Creative Commons Attribution 3.0
                                        Australia License. To view a copy of this license visit http://
                                        creativecommons.org.au
                                        You are free to copy, communicate and adapt the Climate
                                        Council of Australia Ltd copyright material so long as you
                                        attribute the Climate Council of Australia Ltd and the authors
                                        in the following manner:
                                        Heatwaves: Hotter, Longer, More Often by Professor Will
                                        Steffen, Professor Lesley Hughes and Dr. Sarah Perkins.

                                        © Climate Council of Australia Limited 2014.
                                        Permission to use third party copyright content in this
                                        publication can be sought from the relevant third party
                                        copyright owner/s.
                                        WARNING: This report may contain the images of
                                        Aboriginal and Torres Strait Islander people now deceased.

                                        This report is printed on 100% recycled paper.

                                                                   CLIMATECOUNCIL.ORG.AU
Preface
This is the second major report of the Climate Council. The Council is
an independent, non-profit organisation, funded by donations from
the public. Our mission is to provide authoritative, expert information
to the Australian public on climate change.

For the second year in a row, heatwaves       global trends in heatwaves is clear and
and extreme hot weather have plagued          compelling. The impacts of heatwaves
much of Australia. Preliminary accounts       are often under-the-radar compared to
of the January 2014 heatwave in Victoria      other extreme weather events, but they
point to significant health impacts—203       are widespread and serious, damaging
heat-related deaths, a 20-fold increase in    human health, infrastructure and
ambulance call-outs, a four-fold increase     natural ecosystems; and decreasing
in calls to nurses-on-call, and a four-fold   workplace performance and agricultural
increase to locum doctors. Severe heat        productivity. The report concludes by
also afflicted areas further north: for the   outlining what needs to be done to
week ending 4 January 2014, average           slow, and eventually stabilize, the trend
maximum temperatures were 8°C or              towards more severe and more frequent
more above normal in southern inland          heatwaves. The report draws directly on
Queensland. By 9 February Canberra            the peer-reviewed scientific literature
had recorded 16 days above 35°C this          as well as on authoritative assessments,
summer, compared to the long-term             such as those of the Intergovernmental
average of 5.2 days. Australia’s extreme      Panel on Climate Change (IPCC). A
heat drew international attention             reference list is provided at the end of
when play in the 2014 Australian Open         the report for those who would like more
tennis tournament was suspended for           information.
the afternoon of 16 January because
of the heat. Off-court ambulances             We are very grateful to our team of expert
treated almost 1000 tennis fans for heat      reviewers and community readers,
exhaustion in the first few days of the       whose comments and suggestions
tournament.                                   improved the report. The expert
                                              reviewers were: Dr Lisa Alexander
This report sets out the facts about          (University of New South Wales), Prof
heatwaves and hot weather. We explore         Helen Berry (University of Canberra),
the observed changes to heatwaves in          Prof David Karoly (University of
Australia—their severity, duration and        Melbourne), Prof Tord Kjellstrom (Health
timing—and place this in the context          and Environment International Trust,
of increasing extreme heat around             Mapua, New Zealand), and Dr Sophie
the world. The contribution of climate        Lewis (University of Melbourne). We also
change to the Australia-wide and              thank the Bureau of Meteorology and

CLIMATECOUNCIL.ORG.AU
HEATWAVES: HOTTER, LONGER, MORE OFTEN

                CSIRO, which reviewed the accuracy and
                relevance of the science underpinning
                the report. Their reviews are not an
                endorsement of the conclusions drawn.
                We are also grateful for Ron Collins,
                Jill Dumsday and Michael Kirkpatrick’s
                feedback as community readers.

                We are also grateful to Climate Council
                staff for their many contributions to the
                production of this report.

                The authors retain sole responsibility for
                the content of the report.

                              Professor Will Steffen
                              Climate Councillor

                              Professor Lesley Hughes
                              Climate Councillor

                              Dr Sarah Perkins

                                                             CLIMATECOUNCIL.ORG.AU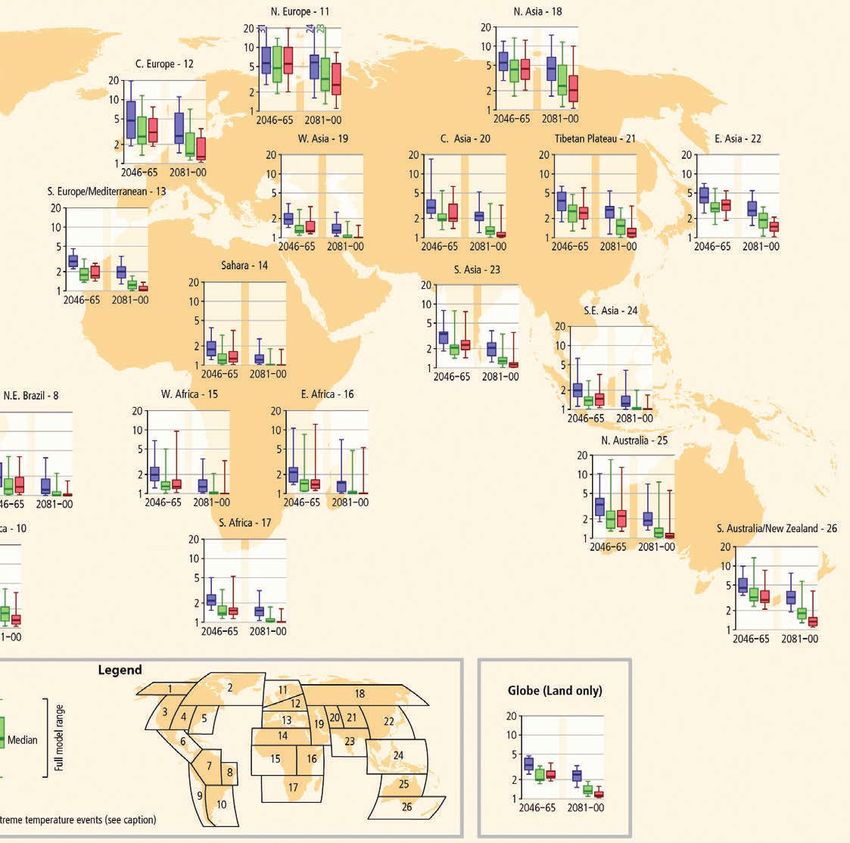
Contents
Preface
Key findings

Introduction                                                                                                                     1

1. Heatwaves are becoming longer and more intense..................................................... 2
    1.1 The nature of changing heatwaves                                                                                         3
    In Detail 1: Variability in heatwave characteristics                                                                        10
    1.2 Severe heatwaves in other parts of the world                                                                            15
    1.3 The influence of climate change on heatwaves                                                                            17

2. Impacts of heatwaves..........................................................................................................20
 2.1 Human health
		 Direct impacts on health                                                                                                    21
		 Indirect impacts                                                                                                            27
		 Workplace safety and productivity                                                                                           29
 2.2 Infrastructure                                                                                                            32
 2.3 Agriculture                                                                                                               34
 2.4 Natural Ecosystems                                                                                                        36

3. Interaction of heatwaves with other extreme
   events and environmental stresses ................................................................................38
    3.1 Droughts                                                                                                               39
    3.2 Bushfires                                                                                                              40
    3.3 Multiple interacting stresses on coral reefs                                                                           42
    In Detail 2: Multiple interacting stresses on coral reefs                                                                  43

4. Heatwaves in the future ....................................................................................................45
    4.1 Projections for extreme heat globally                                                                                  46
    4.2 Projections of future hot weather for Australia                                                                        49
    4.3 Implications of more severe heatwaves and hot weather                                                                  51
    4.4 This is the critical decade                                                                                            53

References                                                                                                                     56

What to do in a heatwave

CLIMATECOUNCIL.ORG.AU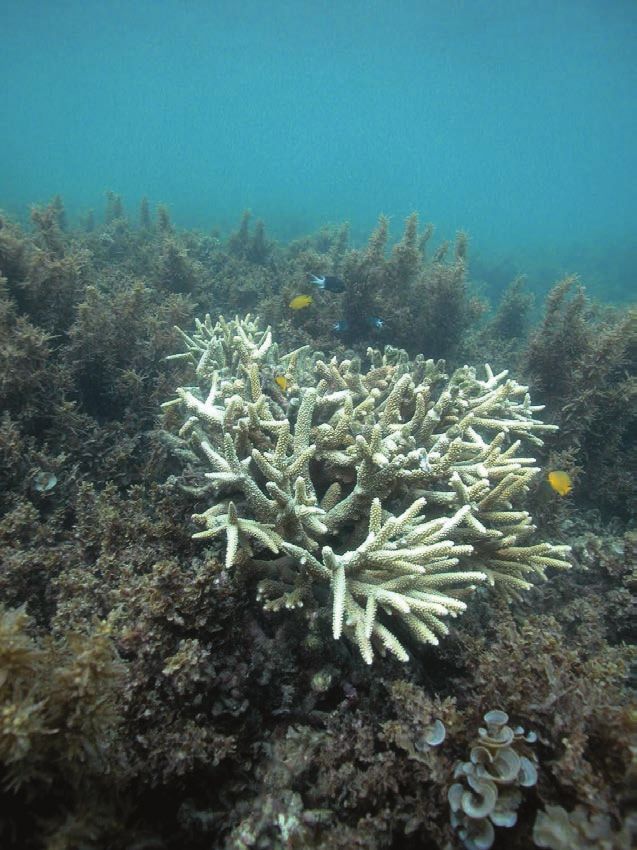
HEATWAVES: HOTTER, LONGER, MORE OFTEN

                Key findings
                1. Climate change is already                      Russia in 2010 and several regions in
                   increasing the intensity and                   the south and central US in 2011 and
                   frequency of heatwaves in                      2012.
                   Australia. Heatwaves are
                   becoming hotter, lasting                   2. Climate change is making
                   longer and occurring more                     heatwaves worse in terms
                   often.                                        of their impacts on people,
                                                                 property, communities and
                  ›› Over the period 1971–2008, both             the environment. Heatwaves
                     the duration and frequency of               have widespread impacts,
                     heatwaves increased, and the                ranging from direct impacts
                     hottest days during heatwaves               on our health to damage to
                     became even hotter.                         ecosystems, agriculture and
                                                                 infrastructure.
                  ›› Hot days have doubled in Australia
                     in the last 50 years. In the last          ›› Heatwaves pose a widespread
                     decade, hot weather records have              risk for Australians as they affect
                     occurred three times more often               people in all capital cities and
                     than cold weather records.                    most regional areas. Over the past
                                                                   100 years, heatwaves have caused
                  ›› Several of our capital cities—                more deaths than any other natural
                     Adelaide, Melbourne and                       hazard. Heatwaves also restrict
                     Canberra—are experiencing more                work capacity and decrease the
                     intense hot weather than expected.            productivity of exposed workers.
                     The increase in hot weather
                     observed in the 2000–2009 decade           ›› Extreme heat can damage
                     has already reached the best                  infrastructure such as electricity
                     estimate projected for 2030.                  distribution and transport systems,
                                                                   causing flow-on effects. Heatwaves
                  ›› The southeast of Australia, which             experienced in Melbourne in
                     includes many of our largest                  recent years have disrupted the
                     population centres, stands out as             railway system and electricity grid.
                     being at increased risk from many
                     extreme weather events, including          ›› Hot, dry conditions have a major
                     heatwaves, drought and bushfires.             influence on bushfires—these
                                                                   conditions are driving up the
                  ›› The trend toward more frequent and            likelihood of very high fire danger
                     more severe heatwaves in Australia            weather. Heatwaves exacerbate
                     is part of a larger global trend. Very        drought, which in turn can also
                     severe heatwaves have occurred                increase bushfire risk.
                     elsewhere, including Europe in 2003,

                                                                          CLIMATECOUNCIL.ORG.AU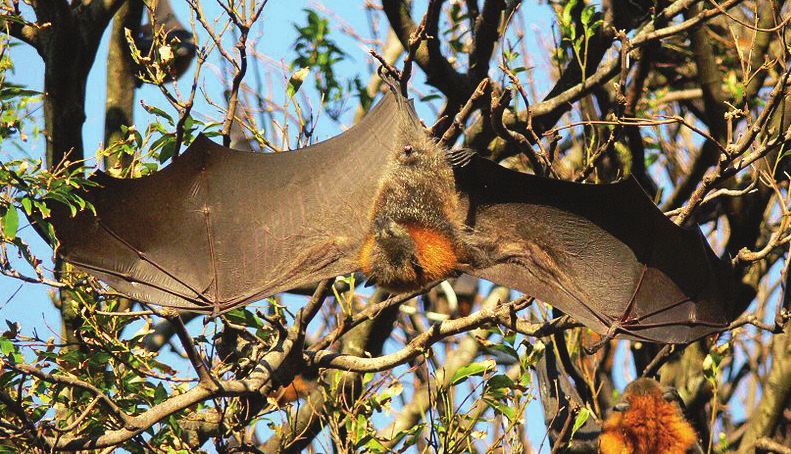
›› Heatwaves affect marine                  4. Record hot days and
      ecosystems, particularly vulnerable         heatwaves are expected to
      reefs. The 2011 marine heatwave             increase in the future
      in Western Australia caused the
      first-ever reported bleaching of           ›› The number of hot days, warm
      Ningaloo reef. Bleaching events               nights and heatwaves are all
      on the Great Barrier Reef have                expected to increase through the
      occurred repeatedly since the late            21st century across the globe.
      1970s.
                                                 ›› Record hot days and warm nights
   ›› Heatwaves can reduce crop yields,             are also expected to increase across
      decrease livestock productivity               Australia over the coming decades.
      and trigger mass deaths of heat-              For both northern and southern
      sensitive species such as flying              Australia, 1-in-20 year extreme hot
      foxes and birds.                              days are expected to occur every
                                                    two to five years by the middle of
   ›› It is crucial that communities;               the century.
      emergency services; health, medical
      and social services; and other             ›› If the current trend in greenhouse
      authorities prepare for the increases         gas emissions continues through
      that are already occurring in the             the rest of this century, today’s
      severity and frequency of hot weather.        record-breaking hot weather will
                                                    become commonplace, occurring
3. The climate system has                           almost every summer across the
   shifted, and is continuing to                    country.
   shift, increasing the likelihood
   of more extreme hot weather.                5. Limiting the increase in
                                                  heatwave activity requires
   ›› As greenhouse gases continue to             urgent and deep reductions in
      accumulate in the atmosphere,               the emissions of greenhouse
      primarily from the burning of fossil        gases.
      fuels, more heat is trapped in the
      lower atmosphere. This increases           ›› The choices we make over this
      the likelihood of more frequent and           decade will largely determine the
      more severe heatwaves.                        severity of the extreme heat that
                                                    our children and grandchildren will
   ›› Small increases in average                    experience.
      temperature lead to much larger
      increases in the frequency and             ›› To stabilize the climate, action on
      intensity of extreme heat.                    reducing emissions is required
                                                    now. This is the critical decade.
   ›› Since 1950, increases in extreme daily
      temperatures have been reported over
      most regions of the globe.

CLIMATECOUNCIL.ORG.AU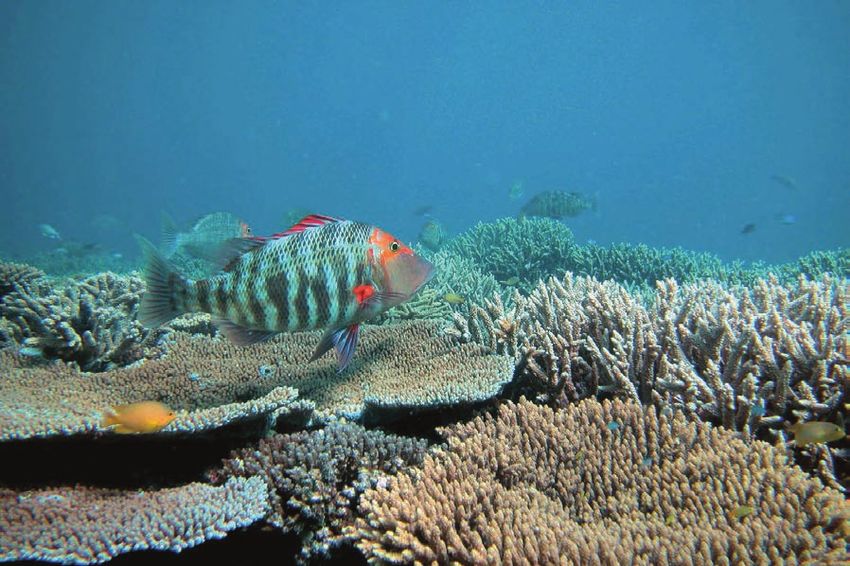
HEATWAVES: HOTTER, LONGER, MORE OFTEN

                                        Introduction
                                         Heatwaves are one of the most
                                         important climate-related risks for
                                         Australians.

                                         The extreme heat in Melbourne that
                                         plagued the 2014 Australian Open Tennis
                                         Tournament and the record-breaking
                                         heat in large areas of Queensland this
                                         summer reminded us of the risks that
                                         heatwaves pose. Coming on the heels of
                                         a record-breaking summer of 2012/2013,
                                         this summer’s heat is part of a longer-
                                         term trend towards hotter weather
                                         (Climate Commission 2013a). The link
                                         between climate change and more
                                         extreme heatwaves is clear.

                                         This report begins by exploring the
                                         long-term observations of hot weather
                                         to show how the nature of heatwaves is
                                         changing—their length, their frequency,
                                         their intensity and when they are
                                         occurring. We then describe what these
                                         trends mean for Australians—their
                                         impacts on our health and well-being,
                                         infrastructure, agriculture, biodiversity,
                                         and natural ecosystems. But heatwaves
                                         don’t occur in isolation from other
                                         factors and their interactions with events
                                         such as droughts can exacerbate the
                                         effects of extreme heat. Finally, we take
                                         a look at the future—how the risks of
                                         extreme heat change as the Earth warms
                                         further, and what we need to do to
                                         stabilize the climate and avoid the more
                                         severe projections for future heatwaves.

 Page 1                                               CLIMATECOUNCIL.ORG.AU
1.
HEATWAVES
ARE BECOMING
LONGER AND
MORE INTENSE
Hot days, hot nights and extended periods of hot weather—
heatwaves—are one of the most direct consequences of
climate change.
As greenhouse gases continue        In this section we first describe the
to accumulate in the atmosphere     observational evidence of how the
from the burning of fossil fuels,   nature of heatwaves is changing
more heat is trapped in the lower   in Australia. We then look at how
atmosphere. This increases the      heatwaves are changing around
likelihood that hot weather will    the rest of the world. Finally, we
occur and that heatwaves will       show the role of climate change in
become longer and more intense.     influencing the trends that we are
Observations over the past half-    observing.
century confirm this
physical process.

                                                                            Page 2
HEATWAVES: HOTTER, LONGER, MORE OFTEN

    1.1 The nature of
    changing heatwaves
                Since 1950 the annual number of            to the Australian definition (BoM 2012;
                record hot days across Australia           Nairn and Fawcett 2013). Furthermore,
                has more than doubled (CSIRO               heatwaves have several significant
                and BoM 2012) and the mean                 characteristics. These include (i)
                temperature has increased by               frequency characteristics, such as the
                about 0.9°C (BoM 2012).                    number of heatwave days and the annual
                                                           number of summer heatwave events;
                Over the past decade, the frequency of     (ii) duration characteristics, such as
                record hot days has been more than three   the length of the longest heatwave in
                times the frequency of record cold days    a season; (iii) intensity characteristics,
                (Trewin and Smalley 2013). The hottest     such as the average excess temperature
                ever area-averaged Australian maximum      expected during a heatwave and the
                temperature occurred on 7 January 2013,    hottest day of a heatwave; and (iv) timing
                reaching 40.3°C. This means that the       characteristics, including the occurrence
                maximum temperature averaged over          of the first heatwave event in a season.
                the whole continent on that day was
                over 40°C. Extreme temperature records     Each heatwave characteristic shows
                were broken in every state and territory   different rates and patterns of
                throughout the course of the 2012/2013     change across Australia. Numerous
                summer.                                    characteristics of heatwaves have
                                                           increased across many regions of
                While hot weather is a pre-requisite for   Australia since the middle of the 20th
                heatwaves, it is important to remember     century (Alexander and Arblaster 2009),
                that heatwaves are more than just          with trends for some characteristics
                stand-alone hot days. At least three       accelerating in the most recent decades.
                excessively hot days must occur in a       Over the period 1971–2008, both the
                row for a heatwave to form, according      duration and frequency of heatwaves

    Over the period 1971–2008, both the
    duration and frequency of heatwaves
    increased, and in several parts of
    the country the hottest days during
    heatwaves became even hotter.
 Page 3                                                                 CLIMATECOUNCIL.ORG.AU
01
HEATWAVES ARE BECOMING LONGER AND MORE INTENSE
increased, and in several parts of increases in the number of heatwave
the country the hottest days during days. While an increase in the number of
heatwaves became even hotter (Perkins days is required to increase the duration
and Alexander 2013). This is consistent and the frequency, both cannot occur
with trends in heatwaves for other global at the same time. That is, for each extra
regions, such as Central Asia and Europe heatwave day, the new heatwave day can
(See section 1.3; Perkins et al. 2012). contribute to either heatwave duration
or heatwave frequency, but not to both
Using the heatwave definition of the characteristics.
Australian Bureau of Meteorology (Nairn
and Fawcett 2013), Figure 1 depicts Since 1950, despite considerable year-
changes in five heatwave characteristics to-year variability, almost all of Australia
across the continent from 1950–2013. has experienced a lengthening of the
Figure 1(A) clearly shows that the number heatwave season (Figure 1(D)), with
of heatwave days has increased over the first event occurring much earlier
much of Australia (see also Figure 2), (Table 1). The intensity of heatwaves,
particularly the eastern half. An increase as measured by the temperature of the
in the number of heatwave days in turn hottest day (the peak of the heatwave),
influences the number of heatwave is also increasing. Figure 1(E) shows that
events and/or their duration. Although the temperature of the hottest day of a
smaller, the areas of increasing trends heatwave has increased over almost all of
in heatwave frequency (Figure 1(B)) and Australia below the tropics. Such trends
duration of the longest annual event are consistent with, and extend, the
(Figure 1(C)) are consistent with the trends reported by Perkins and Alexander
increase in heatwave days. Increases in (2013) since they include the latest
the number of heatwave events and in complete data for Australian summers.
their duration will generally lag behind
WHAT IS A HEATWAVE?
In Australia, a heatwave is defined operationally as a period of at least three days where the
combined effect of high temperatures and excess heat is unusual within the local climate (BoM
2012; Nairn and Fawcett 2013). Two aspects of this definition are important. First, a heatwave is
defined relative to the local climate. That is, a heatwave for Hobart will occur at lower temperatures
than one for Alice Springs. Second, the concept of excess heat is also important. Excess heat occurs
when unusually high overnight temperatures do not provide relief from the daytime heat.
CLIMATECOUNCIL.ORG.AU Page 4HEATWAVES: HOTTER, LONGER, MORE OFTEN
Figure 1: Heatwaves in Australia are becoming hotter, longer, more frequent, and occurring earlier. Figures A through E depict changes in five
heatwave characteristics across the continent from 1950–2013. All heatwave metrics are calculated relative to a 1961–1990 base period, using the
heatwave definition from the Australian Bureau of Meteorology (Nairn and Fawcett 2013). Source: Modified from Perkins and Alexander (2013)
using AWAP (Australian Water Availability Project) data from the Bureau of Meteorology.
How are heatwaves
changing in Australia?
A
10°S
THE NUMBER OF HEATWAVE DAYS
15°S IS INCREASING
20°S Red shows an increase in the number of heatwave days. Figure
A clearly shows that the number of heatwave days has increased
25°S over much of Australia, particularly the eastern half.
30°S
35°S
40°S
45°S
120°E 130°E 140°E 150°E
-2 -1.2 -0.4 0.4 1.2 2
Heatwave days expressed as a percentage
of all summer days per summer.
B
10°S
HEATWAVES ARE OCCURING
15°S
MORE FREQUENTLY
20°S Red indicates an increase in the number of heatwave events per
summer.
25°S
An increase in the number of heatwave days in turn influences the
number of heatwave events and/or their duration, and although
30°S smaller, areas of increasing trends in heatwave frequency (Figure
B) and duration of the longest yearly event (Figure C) are consistent
35°S with that of heatwave days. Note that changes in heatwave events
and duration will generally lag behind that of heatwave days—
40°S while an increase in the number of days is required to increase the
duration and frequency, both cannot occur at the same time. That
45°S is, for each extra heatwave day that is gained, the new day can only
120°E 130°E 140°E 150°E contribute to heatwave duration or frequency.
-1 -0.6 -0.2 0.2 0.6 1
Number of heatwave events per summer
Page 5 CLIMATECOUNCIL.ORG.AU01
HEATWAVES ARE BECOMING LONGER AND MORE INTENSE
C
10°S
THE DURATION OF THE LONGEST
15°S YEARLY HEATWAVE IS INCREASING
20°S Red indicates an increase in the number of days of the longest
heatwave of a summer.
25°S
30°S
35°S
40°S
45°S
120°E 130°E 140°E 150°E
-1 -0.6 -0.2 0.2 0.6 1
The length in days of the longest event
per summer
D 10°S
15°S
THE FIRST HEATWAVE OF THE SEASON
IS OCCURING EARLIER
20°S Red indicates a heatwave occurring earlier relative to the long-
term average. Since 1950, almost all of Australia has experienced
25°S a lengthening of the heatwave season, where the first event is
occurring much earlier (Figure D).
30°S
35°S
40°S
45°S
120°E 130°E 140°E 150°E
-10 -8 -6 -4 -2 0 2 4 6 8 10
Start day of the first event per summer
E
10°S
THE HOTTEST DAY OF A HEATWAVE
15°S IS BECOMING HOTTER
20°S Red shows increasing temperatures. Figure E shows that the
hottest day of a heatwave, i.e. its peak, has a detectable increase
25°S for almost all of Australia below the Tropics. Such trends are
consistent with, and continue on from those reported by (Perkins
30°S et al. 2012), since they include the latest complete Australian
summer data.
35°S
40°S
45°S
120°E 130°E 140°E 150°E
-5 -4 -3 -2 -1 0 1 2 3 4 5
Extreme Heat Factor units (°C2)
CLIMATECOUNCIL.ORG.AU Page 6HEATWAVES: HOTTER, LONGER, MORE OFTEN
Figure 2: Heatwaves in Australia. The number of heatwave days has been increasing across Australia, and in Australian capital cities,
since 1950. Such trends are consistent with, and continue on from those reported by Perkins et al. 2012, since they include the latest
complete Australian summer data. Source: Modified from Perkins and Alexander 2013.
Heatwaves:
State of the
Nation 10
9
The number of heatwave days 8
in Australia is increasing.
HEATWAVE DAYS
7
In Australia, a heatwave is defined
as a period of at least three days 6
where the combined effect of high
temperatures and excess heat is 5
unusual within the local climate
(BoM, 2012; Nairn and Fawcett, 2013). 4
The central line graph shows the 3
number of heatwave days for
Australia as a whole over the period 2
1950–2010. The number of heatwave
1
days each year has been increasing in
Perth, Adelaide, Melbourne, Sydney,
Canberra and Hobart, and across 1950 1960
Australia as a whole since 1950.
Page 7 CLIMATECOUNCIL.ORG.AU01
HEATWAVES ARE BECOMING LONGER AND MORE INTENSE
1970 1980 1990 2000 2010
YEAR SUMMER
COMMENCED
CLIMATECOUNCIL.ORG.AU Page 8HEATWAVES: HOTTER, LONGER, MORE OFTEN
Using the definition of a heatwave, the frequency, intensity and duration of
Table 1 presents the average number of heatwaves differ across these locations,
heatwave days, events, and duration, and that these characteristics are
a well as the average intensity over all influenced by local factors, such as
heatwaves and the average of the hottest synoptic conditions (meteorological
(peak) day for Australia’s capital cities, conditions over a wide area at a given
over the period 1950–2011. Note that time), rainfall, location, and the overall
climate classification.
Changes in
Number of Number of average Changes in Changes
heatwave heatwaves Length of intensity average in
days (events) longest event of the intensity of timing of
1950– 1981– 1950– 1981– 1950- 1981– heatwave the peak day first event
City 1980 2011 1980 2011 1980 2011 (°C) (°C) (days)
Sydney 6 9 1-2 2-3 4 5 1.5 1.5 -19
Melbourne 5 6 1-2 1-2 4 4 1.5 2 -17
Brisbane 10 10 2-3 2-3 6 6 1 1.5 -8
Perth 6 9 1-2 2-3 4 5 1.5 1.5 +3
Adelaide 5 9 1-2 1-2 4 6 2.5 4.3 -2
Hobart 4 5 1 1-2 4 4 -1.5 1.7 -12
Darwin 3 7 1 1-2 4 5 0 1 -7
Canberra 6 13 1-2 2-3 5 7 0 1.5 -3
Table 1: The average number of heatwave days, number of events, length of the longest event, average heatwave intensity,
average intensity of the peak heatwave day, and change in the timing of the first summer heatwave for Australia’s capital
cities (Perkins and Alexander 2013). Statistics were calculated from the high-quality ACORN-SAT temperature dataset for
the period 1951-2011 (Trewin 2012), using the Excess Heat Factor heatwave definition (Nairn and Fawcett 2013; Perkins
and Alexander 2013). All statistics are rounded to the nearest integer. The first column for each characteristic is for the
1950–1980 period and the second is for the 1981–2011 period. Changes in average intensity and peak intensity are calculated
by subtracting the respective average from 1950–1980 and 1981–2011. Changes in timing are calculated by subtracting the
average start date during 1981–2011 from that of 1950–1980.
Page 9 CLIMATECOUNCIL.ORG.AU01
HEATWAVES ARE BECOMING LONGER AND MORE INTENSE
IN DETAIL 1
Variability in heatwave
characteristics
The occurrence, duration and intensity of Bight (Pezza et al. 2012). Other regional features
extreme Australian temperatures varies from can also influence the occurrence and intensity
year to year, due to the influences of climate of Australian hot days and heatwaves, including
variability (Kenyon and Hegerl 2008; Alexander intra-seasonal drivers of variability (Marshall et
et al. 2009). Heatwaves, therefore, are also al. 2013), rainfall deficits (Nicholls 2004), local
affected. During El Niño years, for example, sea surface temperatures (Pezza et al. 2012),
much of Australia is prone to below average the Australian monsoon, and tropical cyclones
rainfall and above average temperatures. This (Parker et al. 2013).
increases the chance of stand-alone hot days
(Kenyon and Hegerl 2008; Alexander et al. 2009; See section 1.3 for the influence of climate
Arblaster and Alexander 2012; Min et al. 2013), change on heatwaves.
and possibly also the chance of heatwaves.
During La Niña years, when much of Australia
generally receives higher than average rainfall,
average temperatures are lower and therefore
heatwaves are less common in many places.
The occurrence of heatwaves is also governed
by meteorological conditions (see Engel et
al. 2012), which are influenced by climate
variability, as described above. The most
important weather system for Australian
heatwaves is the persistent anticyclone, where
a high-pressure system remains stationary
adjacent to the area affected for a prolonged
time (Hudson et al. 2011; Pezza et al. 2012;
Marshall et al. 2013). The high-pressure
system brings warm air from the interior
of the continent to the area experiencing
the heatwave, which sustains excessively
hot temperatures for a number of days. For
southeastern Australia heatwaves, this high is
generally centred over the Tasman Sea and is
in line with the subtropical ridge (an east-west
zone of high pressure that often lies over the
southern part of the continent) (Hudson et al.
2011; Marshall et al. 2013), and for southwestern
Australia, it is centred over the Great Australian
CLIMATECOUNCIL.ORG.AU Page 10HEATWAVES: HOTTER, LONGER, MORE OFTEN
While a fine balance of climate variability The trend towards more frequent and
and synoptic systems governs year-to- more intense heatwaves is reflected
year occurrences of Australian heatwaves in recent observations of individual
(see In Detail 1), such conditions cannot heatwave events. Over the past decade
explain longer-term changes (Lewis a remarkably large number of record-
and Karoly 2013). Although highly breaking and devastating heatwaves
variable over a small number of years, have occurred in Australia and in many
the number, duration and intensity other parts of the world (Coumou and
of heatwaves should not change over Rahmstorf 2012). The extent of the
decades in a stable climate. The changes heatwave that affected eastern to central
in Australian heatwaves as described Australia in 2004, from 9–22 February,
above are part of a long-term global was greater than any other February
trend towards more heatwaves and hot heatwave on record. All-time records
weather in many regions, a trend that is for consecutive days of heat include 17
very likely influenced by human-driven days over 30°C at Adelaide, 16 days over
climate change (IPCC 2013), as explained 35°C at Snowtown, 16 days over 40°C
in more detail in section 1.3. at Wilcannia, seven days over 35°C at
Bathurst, and 12 days over 35°C at Wagga
Wagga (BoM 2005).
AWAP HIGHEST MAX
TEMPERATURE (°C)
45°C
42°C
39°C
36°C
33°C
30°C
27°C
24°C
Figure 3: Highest maximum temperature reported in the period 1 January 2013—18 January 2013. Source: (BoM 2013a)
Page 11 CLIMATECOUNCIL.ORG.AU01
HEATWAVES ARE BECOMING LONGER AND MORE INTENSE
South and southeast Australia The heatwave that occurred during the
experienced an extreme heatwave in 2012–2013 summer was unusual for
2009, with two significant periods of its size and duration. A massive pool of
exceptionally high temperatures, from hot air became established over 70% of
28–31 January and 6–8 February (BoM the continent at the end of December
2009; McEvoy et al. 2012; see section 2012 and persisted until the middle of
3.2 for the link to the Black Saturday January (Figure 3). Through the 2–8
bushfires). On 30 January, Tasmania January period, the country experienced
experienced its hottest day on record seven consecutive days of area-averaged
when the temperature soared to 42.2°C. maximum temperature over 39 °C. In
Overnight minimum temperatures were 102 years of weather records, Australia
also very high in many places during has experienced only 21 such days, and
the heat wave. Adelaide experienced eight of them occurred in 2013. January
its warmest night on record when the 2013 was Australia’s hottest January on
temperature dropped to only 33.9°C on record. Temperature records were set
29 January. The most extreme heat of the in every state and territory during the
whole episode occurred on 7 February summer, and all-time high maximum
with record highs throughout much of temperatures were set at 44 weather
Victoria (BoM 2009). An all-time state stations, including Sydney, Hobart
record was broken at Hopetoun when and Newcastle (BoM 2013a; Climate
the temperature reached 48.8°C, which Commission 2013a). Extreme heat played
is considered the highest ever recorded a role in several of the extreme weather
in the southern hemisphere so far from events that occurred during the 2012–
the equator. Records stretching over 2013 summer (Figure 4).
154 years were broken in Melbourne,
where the temperature reached 46.4°C. Section 1.3 describes the link between
South Australia also experienced its climate change and heatwaves and is
hottest February day on record (48.2°C) at supported by the observational data of
Renmark (BoM 2009). heatwaves in Australia.
RECORD TEMPERATURES ACROSS THE COUNTRY
A major heatwave affected central and eastern Australia in late 2013/early 2014. The most significant
records were set on 3 January, when Queensland experienced its area-averaged hottest day on record.
For the week ending 4 January, average maximum temperatures were 8°C or more above normal
in southern inland Queensland. Overall, record high maximum temperatures occurred over 8.8% of
Australia from 1 to 4 January, including 16.8% of New South Wales, 16.8% of the Northern Territory,
15.2% of Queensland and 7.9% of South Australia (BoM 2014).
CLIMATECOUNCIL.ORG.AU Page 12HEATWAVES: HOTTER, LONGER, MORE OFTEN
“Angry Summer” 2012–
2013: Events Snapshot
HEAT RAIN
›› Australia’s hottest summer on ›› 26 daily rainfall records across
record. Australia were broken at weather
stations with over 80 years of data
›› January 2013 was the hottest month including 11 all-time daily rainfall
on record for Australia. records during late January even in
›› Hottest day ever recorded for eastern Australia.
Australia as a whole—40.3°C on 7 ›› There were also 9 December records,
January. 23 January records and 2 February
›› 7 days in a row with a temperature records broken across Australia.
above 39°C for Australia as a whole. ›› Gladstone, Queensland set
›› Heatwave and temperature records records for its highest 4-day
were broken across Australia rainfall (819.8mm)—higher than
including: Gladestone’s previous record for a
whole calendar month.
›› 44 weather stations set hottest
maximum temperatures.
›› 2 weather stations also set
December record maximum
temperatures.
›› 13 weather stations also set January
FLOODS
record maximum temperatures.
›› 5 river height records broken.
›› 4 weather stations also set February
record maximum temperatures. ›› Major flooding through southeast
Queensland and northern New
›› 29 warmest night records (highest South Wales.
minimum temperature) including 7
all-time records.
Figure 4: A snapshot of the “angry summer” 2012–2013. Source: Modified from Climate Commission 2013a
Page 13 CLIMATECOUNCIL.ORG.AU01
HEATWAVES ARE BECOMING LONGER AND MORE INTENSE
DRY BUSHFIRES
›› Much of Australia was drier than ›› Bushfires in every state and territory
normal from mid-2012 with record with very damaging fires in
lowest July to December rainfall Tasmania and New South Wales.
across Central South Australia, and ›› On 4 January, up to 40 bushfires
below average rainfall across almost occured across Tasmania. Over
all of southeastern Australia. 25,000 hectares were burnt and
›› Lowest monthly rainfall records close to 200 properties destroyed.
were broken at weather stations ›› “One of the worst fire danger days
in Queensland, New South Wales, on record for NSW” — NSW Rural
Victoria, South Australia and the Fire Service Commissioner Shane
Northern Territory. Fitzsimmons.
›› In New South Wales bushfires
occured across the state on
January 8, with reports of up to 140
incidents.
TROPICAL
CYCLONES
›› TROPICAL CYCLONE OSWALD:
Former tropical cyclone Oswald
TORNADOES
caused extremely heavy rainfall to ›› Tornadoes with damaging winds
fall over Queensland and northern hit Bundaberg and other coastal
New South Wales. The low pressure Queensland townships on
system also caused high waves, Australia Day.
storm surges and flooding.
›› TROPICAL CYCLONE RUSTY:
Near the end of February, tropical
cyclone Rusty, a large and slowly
moving storm system, threatened
the Pilbara coast of north Western
Australia with winds of up to
230km/h and heavy rainfall.
CLIMATECOUNCIL.ORG.AU Page 14HEATWAVES: HOTTER, LONGER, MORE OFTEN
1.2 Severe heatwaves in
other parts of the world
(Europe, Russia, USA)
In the last 10–15 years, many Switzerland a remarkable 5.1°C higher
severe heatwaves have occurred than the 1864–2000 average (Black et al.
in other parts of the world. One of 2004). During July and August, nighttime
the most severe was the European temperatures also climbed dramatically,
heatwave of July and August and were higher even than long-term
2003, which occurred during an mean daily temperatures (Black et
unusually dry summer (Black et al. al. 2004). The 2003 heatwave closely
2004). resembled the projections of maximum
summer temperatures from regional
It was likely the hottest period that climate models for the second half of
Europe has experienced since at least the 21st century (Beniston 2004; Schär et
1500 AD (Stott et al. 2004). From May to al. 2004), and, under a high greenhouse
August, Europe experienced anticyclonic gas emissions scenario (the IPCC SRES
(high atmospheric pressure) conditions, A2 scenario), summers such as this are
which contributed to the low rainfall and expected to be common occurrences
high temperatures, leading to a reduction in Europe by the end of this century
in soil moisture (Black et al. 2004). (Beniston 2004; Schär et al. 2004).
Low soil moisture content has been
an important factor in the increasing The 2003 European heatwave was
number of days of extreme heat in followed in 2010 by an even more
many regions of the world (Mueller intense and widespread heatwave,
and Seneviratne 2012; see section 3.1). which scorched enormous areas across
Average monthly temperatures across Eastern Europe (Barriopedro et al. 2011),
Europe were significantly higher than including western Russia, Belarus,
usual, and mean June temperatures over Estonia, Latvia, and Lithuania (Dole et
central Europe were 4.2°C hotter than the al. 2011). By May 2010, record high sea
long-term (1958–2002) average (Black et surface temperatures had developed in
al. 2004). the Indian and Atlantic Oceans, with a
number of consequences for weather
While most of Western and much of patterns. One of the most important
Eastern Europe sweltered, France and consequences was the unusually strong
Switzerland were particularly affected, and persistent anticyclonic condition
with the mean summer temperature that settled over Russia during the
averaged across four weather stations in summer, and was responsible for the
Page 15 CLIMATECOUNCIL.ORG.AU01
HEATWAVES ARE BECOMING LONGER AND MORE INTENSE
extreme heat. The most intense period hottest and driest summer the state
of the heatwave occurred from June to has seen since records began in 1895
mid-August (Trenberth and Fasullo 2012), (Peterson et al. 2012). 2011 was a La
including the hottest July on record in Niña year, an effect that typically brings
western Russia since at least 1880 (Dole warmer winters and decreased rainfall
et al. 2011). During July, temperatures to southern parts of the US (Luo and
soared to over 40°C, breaking Zhang 2012), and by July, around 75%
numerous records, and daily maximum of Texas was experiencing a drought
temperatures persisted around record described as “exceptional” (NOAA 2012).
levels (Dole et al. 2011). As with the 2003 Soil moisture content had been reduced
European heatwave, the 2010 summer because of decreased rainfall (Mueller
in Russia matched climate projections and Seneviratne 2012; Winguth and
for the latter half of the 21st century, Kelp 2013), predisposing the region to
based on a scenario of no emission prolonged extreme temperatures (Mueller
reductions until mid-century (IPCC SRES and Seneviratne 2012, section 3.1) that
A1B; Barriopedro et al. 2011). Rahmstorf culminated in a heatwave across the state
and Coumou (2011) calculated with a in July. The June to August three-month
likelihood of around 80% that the Russian average temperature was 2.9°C above the
2010 heatwave would not have occurred long-term (1981–2010) average, at 30.4°C.
without the influence of human-caused While the reduced rainfall has been
climate change (see next section). largely attributed to natural variability
“‘Mega-heatwaves’ such as the 2003 and
2010 events likely broke the 500-year-
long seasonal temperature records over
approximately 50% of Europe” Barriopedro
et al. 2011
North America has also experienced a (Hoerling et al. 2013), climate models
number of heatwaves in recent years, have shown a shift to warmer and drier
with a major heatwave and devastating conditions over the period 1964 to 2008
drought affecting the state of Texas in (Peterson et al. 2012). The circumstances
July 2011 (NOAA 2011; Luo and Zhang that led up to the Texas 2011 drought,
2012; Peterson et al. 2012) and a larger which in turn set the scene for a record
heatwave covering a greater area of the heatwave, are much more likely now
country in 2012 (NOAA 2012). The 2011 than they were 40–50 years ago and
summer (June to August) was the 4th climate change has increased the
hottest summer on record for the US likelihood of setting a hot temperature
(NOAA 2012), and broke many heat- record by 6% in 2011 in comparison to the
related records around the country 1981–2010 period (Peterson et al. 2012).
(NOAA 2011). Texas experienced the
CLIMATECOUNCIL.ORG.AU Page 16HEATWAVES: HOTTER, LONGER, MORE OFTEN
1.3 The influence of
climate change on
heatwaves
Human-driven climate change The influence of climate change on
has contributed to the increase in heatwaves is more significant than the
hot days and heatwaves. increase in global average temperature,
about 0.85°C since 1880 (IPCC 2013),
The increase in greenhouse gases in might suggest. Figure 5 shows how
the atmosphere, primarily caused by small changes in average temperature
the burning of fossil fuels, is trapping can have a significant influence on
more heat in the lower atmosphere extremes (IPCC 2012). The figure shows
(IPCC 2013), that in turn increases the the distribution of temperatures, say,
likelihood of heatwaves and hot days and daily maximum temperature, around the
decreases the likelihood of cold weather. average. On most days, the temperature
Increase of average temperature
PREVIOUS NEW
CLIMATE CLIMATE
Probability of occurance
More hot weather
Less cold weather
More record
hot weather
COLD AVERAGE HOT
Previous record New record
Figure 5: Relationship between average and extremes, showing the connection between a shifting average and the
proportion of extreme events. Source: Climate Commission 2013b, modified from IPCC 2007
Page 17 CLIMATECOUNCIL.ORG.AU01
HEATWAVES ARE BECOMING LONGER AND MORE INTENSE
is not too far from the average, but heatwaves have been observed in the
occasionally some very hot or very cold Mediterranean region since the 1960s
days can occur. But when the average (Kuglitsch et al. 2009). A doubling in the
temperature warms by even a small length of European heatwaves between
amount towards a higher level, the 1880–2005 has also been found (Della
temperatures at the “tails”—the ends of Marta et al. 2007). Other areas of the
the temperature distribution—also shift. world, particularly Africa, Antarctica,
The result is a much greater likelihood India, and parts of South America, do
of very hot weather and a much lower not yet have enough high quality data to
likelihood of very cold weather. undertake comprehensive investigations
of changes in heatwave activity.
Long-term observations demonstrate
the effect of warming on temperature For regions where adequate and
extremes shown in Figure 5. Globally, consistent data exist, increases in
since 1950 it is very likely (greater than extreme daily temperatures have been
90% probability) that there has been reported over most global regions since
an overall increase in the number of 1950 (Brown et al. 2008) (see Figure 6 for
warm days and nights, and an overall the Northern Hemisphere). The number
decrease in the number of cold days of heatwave days has increased each
and nights (IPCC 2013). It is also likely decade between 1950–2010 for much of
(greater than 66% probability) that there Northern America, Europe, Central and
has been an increase in the frequency, East Asia, and, consistent with Figure 1
intensity and duration of heatwaves above, eastern and southern Australia
and warm spells over that period across (Figure 7; Perkins et al. 2012).
many global regions (IPCC 2013; Perkins
et al. 2012). An increase in heatwave Global changes in warm spells have
frequency has been observed in China also been found since 1950 (Alexander
(Ding et al. 2010), and increases in the et al. 2006; Perkins et al. 2012; Donat et
frequency, duration and intensity of al. 2013). Unlike heatwaves, warm spells
1951–1980 1981–1991 1991–2001 2001–2011
0.5
FREQUENCY
0.4
0.3
0.2
0.1
0
-5 -4 -3 -2 -1 0 1 2 3 4 5 -4 -3 -2 -1 0 1 2 3 4 5 -4 -3 -2 -1 0 1 2 3 4 5 -4 -3 -2 -1 0 1 2 3 4 5
Figure 6: Summer temperature shifts in the Northern Hemisphere over the period 1951–2011. During the 1951–1980 period,
the Northern Hemisphere experienced an equal number of hotter-than-average (red) as colder-than-average days (blue).
Since that time, average summer temperatures have shifted towards warmer days, and the Northern Hemisphere now
experiences many more hotter-than-average days than it does colder-than-average. Source: NASA/GISS 2012
CLIMATECOUNCIL.ORG.AU Page 18HEATWAVES: HOTTER, LONGER, MORE OFTEN
90°N
45°N
0°
45°S
90°S
180° 90°W 0° 90°E 180°
-3 -1.8 -0.6 0.6 1.8 3
Figure 7: Global trends in the number of heatwave days per decade, from 1950–2011. Hatching represents statistically
significant trends at the 5% level, calculated by non-parametric methods. Grey regions did not have adequate data for
heatwave calculation. There has been an increase in occurrence of heatwaves over many other regions in addition to
Australia, as a results of the long-term rise in global average temperatures. Source: Adapted from Figure 1 of (Perkins et
al. 2012), calculated using the Excess Heat Factor index (Perkins et al. 2012, Nairn and Fawcett 2013) from the HadGHCND
gridded daily temperature dataset (Caesar et al. 2006)
include excessively warm events (relative particular heatwave will occur due to the
to time of year) that occur outside of human-driven increase in atmospheric
summer. Trends in these non-summer greenhouse gas concentrations. Using
events are increasing faster than such methods, Lewis and Karoly (2013)
heatwaves during the summer seasons concluded that the odds of the Australian
only, as measured by the number of 2013 Angry Summer occurring when
heatwave/warm spell days and events, it did increased more than five times
and their duration and peak intensity due to the human-driven increase in
(Perkins et al. 2012). There is considerable atmospheric greenhouse gases. Using
evidence that nighttime temperature similar methods, a study by Rahmstorf
extremes are increasing faster than and Coumou (2011) estimated that
daytime temperature extremes (IPCC there is a likelihood of around 80% that
2013), a trend that is important for the the Russian 2010 heatwave would not
impacts of heatwaves (section 2 below). have occurred without the influence of
human-caused climate change.
Recently scientists have used model-
based approaches to estimate the
increase in the likelihood that a
Page 19 CLIMATECOUNCIL.ORG.AU2.
IMPACTS OF
HEATWAVES
Heatwaves have been dubbed In Australia, heatwaves and hot
“the most under-rated weather weather are responsible for the
hazard in Australia” (BoM, cited greatest number of deaths from
in PwC 2011). While heatwaves any type of natural disaster, and
and hot weather do not result contribute significantly to morbidity,
in obvious violent effects on particularly among the elderly. The
the landscape, unlike the effects economic burden of heatwaves
of many other weather-related is large, through the decrease in
disasters such as high-intensity labour productivity during the
storms and bushfires, the hottest periods (Kjellstrom and
impacts of heatwaves on health, McMichael 2013), the demand
infrastructure, agriculture, and the placed on emergency services,
environment can nonetheless be infrastructure stress and breakdown,
serious, costly and long-lasting. and agricultural losses.
Page 20HEATWAVES: HOTTER, LONGER, MORE OFTEN
2.1 Human health:
Direct impacts on health
The increasing frequency, Heatwaves are a particularly important
intensity and duration of risk for people living in cities because
heatwaves are increasing the metropolitan areas can be significantly
burden on Australia’s people and warmer than neighbouring countryside
health services. areas (Stone et al. 2010). Dense urban
areas, such as inner city environments,
Those most at risk include the very old, may be 1 to 3°C hotter than surrounding
the very young, Aboriginal and Torres areas (Climate Commission 2011; Figure
Strait Islander communities, and those 8). This phenomenon is known as the
who work outdoors or whose physical ‘Urban Heat Island’ and occurs because
and mental wellbeing are compromised. of a decreased amount of vegetation and
Consequently, as Australia’s population increased areas of dark surfaces in urban
grows and ages, the proportion and environments, in addition to the heat
absolute number of people most at risk produced from vehicles and generators
from heatwaves will continue to rise, (Luber and McGeehin 2008; Stone et al.
increasing the pressure on emergency 2010). The Urban Heat Island effect is
and health services. generally more prominent during the
night than the day, so its major impact
is to increase the likelihood of extreme
high minimum temperatures.
“Heatwaves kill more Australians than
any other natural disaster. They have
received far less public attention than
cyclones, floods or bushfires—they are
private, silent deaths which only hit the
media when morgues reach capacity or
infrastructure fails.”
Price-Waterhouse Cooper, “Extreme Heat Events”
Page 21 CLIMATECOUNCIL.ORG.AU02
IMPACTS OF HEATWAVES
33°C
TEMPERATURE
30°C
Late afternoon
temperatures °C
RURAL
SUBURBAN
WAREHOUSE OR
INDUSTRIAL
CBD
URBAN
RESIDENTIAL
PARK
SUBURBAN
RURAL
Figure 8: A stylised view of the urban heat island effect. The average annual air temperature in sprawling urban areas, and inner-
city environments, is higher than surrounding areas, although the exact temperature profile can vary from city to city. Source:
Climate Commission 2011, modified from US EPA 2008 and NASA 1999
As even more Australians move into urban more serious—an example of the indirect
areas, they are increasingly moving into effects heatwaves have on health.
the inner city, and thus into areas where
the urban heat island effect is more likely. Extreme and prolonged heat can directly
Similarly, much of our infrastructure— affect our health by causing heat stress
roads, rail, and medical facilities—is and, under very severe conditions,
concentrated in inner city areas, where even death. Our bodies operate at a
a disruption to this infrastructure can core temperature of 37°C and must
affect a large number of people. This was maintain that temperature within a very
shown by the breakdown of the electricity narrow range (Parsons 2003; Hanna
grid and metropolitan railway system in et al. 2011). As we produce heat during
Melbourne during the 2009 heatwave (see our daily activities (especially if we
section 2.2 below), when many areas in exert ourselves), we need to release that
Melbourne were left without electricity, heat to the air around us to maintain a
and thousands of commuters were steady core body temperature. We do
stranded on the way home from work in this by direct transfer to air when the air
the CBD (McEvoy et al. 2012). For most around our bodies is at a temperature
people this would have caused no more below 37°C or by sweating, which is a
than inconvenience. But for those needing type of evaporative cooling. At very high
medical help it would have been much temperatures—around 37°C or higher—
CLIMATECOUNCIL.ORG.AU Page 22HEATWAVES: HOTTER, LONGER, MORE OFTEN
this cooling can become difficult, The heatwave in Melbourne in late
especially if humidity is high, and core January 2009 exemplifies such
body temperature can rise. conditions. On 27 January the maximum
temperature rose to 36.4°C from a high of
If core body temperature rises to 38°C 25.5°C the previous day. The maximum
for several hours, heat exhaustion temperatures during the next three
occurs, and mental and physical capacity days were 43.4°C, 44.3°C and 45.1°C,
becomes impaired (Parsons 2003; Berry et before dropping to 30.5°C on 31 January.
al. 2010). If core temperature goes above Nighttime minimum temperatures were
42°C, even for just a few hours, heat stroke also very much above average. There
and death can result (Parsons 2003) (see were 374 excess deaths recorded during
Figure 9). this period. The death rate peaked on 30
and 31 January, towards the end of the
heatwave, lagging behind the extreme
CORE BODY TEMPERATURE temperatures by a few days (DHS 2009;
Figure 10).
37ºC 38ºC+ 39ºC+ 42ºC+
Similar impacts have been observed
in other parts of Australia. Deaths in
Brisbane increased by 23% during the
7–26 February 2004 period (especially
during the 21–22 February weekend),
when the temperature increased from
Figure 9: Temperature effects on the human body. Source: Climate
26°C to 42°C (Tong et al. 2010). From 1993
Commission 2011 to 2006, Adelaide recorded a 7% increase
in total hospital admissions during
People living in dense urban periods of heatwaves compared with
environments, the very old and the non-heatwave periods and the number
very young, those with pre-existing of people requiring ambulance transport
medical conditions and heat-exposed increased 4% during heatwaves (Nitschke
workers are the most vulnerable when et al. 2007). During the heatwave of
the temperature soars. Even so, most January 1994, Sydney recorded 110
people can survive one extremely hot excess heat-related deaths (Gosling et al.
day. However, heatwaves lasting even a 2007). Mortality during heatwave events
few days, especially if coupled with high also occurs in other countries (Figure 11).
nighttime temperatures (e.g. upper 20s
or low 30s °C), can cause serious health There have been newspaper reports of
impacts. The warm nights are particularly the health impacts of the January 2014
important because our bodies don’t get heatwave in Victoria—203 heat-related
the chance to recover (Banwell et al. deaths, a 20-fold increase in ambulance
2012). It is the cumulative effects over a call-outs, a four-fold increase in calls to
few days of an intense heatwave that lead nurses-on-call, and a four-fold increase to
to serious health impacts and deaths— locum doctors (The Age, 23 January 2014)—
and we tend to see these after the worst but these figures will need to be verified by
of the heatwave has passed. more thorough, peer-reviewed analyses.
Page 23 CLIMATECOUNCIL.ORG.AU02
IMPACTS OF HEATWAVES
250
43.4 44.3
45.1 45
200
36.4
35
33.8
150 30.5
DEATHS
25.5 25
ºC
100
15
50
2004–08 average deaths
2009 deaths 5
2009 max temp (ºC)
26 Jan 27 Jan 28 Jan 29 Jan 30 Jan 31 Jan 1 Feb
Figure 10: Mortality and temperature during the 2009 Melbourne heatwave. This graph shows the relationship between
prolonged periods of higher temperature and death rates over the same period. Source: Climate Commission 2013c, modified
from DHS 2009
With Australia’s population growing frailty increases with advancing age, as
and ageing, the proportion and absolute does the incidence of falls, illnesses and
number of older adults is rising. disease. In these circumstances, people’s
Projections indicate that by 2031 almost ability to do the things they need to do
one in four Australians will be aged to keep their bodies cool diminishes, for
over 65 (Booth and Tickle 2003). These example drinking, and remembering
Australians are particularly vulnerable to to drink, enough. Dehydration is an
the effects of heatwaves (van Iersel and important cause of heat-related deaths
Bi 2009), partly because general physical among older adults (Rikkert et al. 2009).
“Older people who live in big cities
that are not prepared for heatwaves
or in areas with clear “heat island”
effects… have the highest risk of
heat-related morbidity.”
Rikkert et al. 2009
CLIMATECOUNCIL.ORG.AU Page 24HEATWAVES: HOTTER, LONGER, MORE OFTEN
Figure 11: Global mortality during recent heatwave events.
Impacts (mortality)
of recent heatwaves
Russia
USA
56,000, July and August
600, Chicago July 1995
2010 (Munich RE 2011)
(Dematte et al. 1998)
Brisbane
75 excess deaths
in Brisbane
heatwave in
2004, of which
41 were due to
cardiovascular
causes
Europe
70,000, summer of 2003
(France hardest hit)
(Robine et al. 2008)
SE Australia
300, February 2009
(DHS 2009)
Page 25 CLIMATECOUNCIL.ORG.AU02
IMPACTS OF HEATWAVES
Despite heat being felt more intensely numbers due to mental health and
in urban areas compared to the behavioral disorders rose (Hansen et al.
surrounding countryside, older adults are 2008). There was an almost 10% increase
also at risk of extreme heat in regional in admissions due to mood (affective)
Australia, where community and medical anxiety, stress-related and somatoform
services are less accessible. Poor access disorders (disorders characterized by
to services is largely responsible for symptoms that suggest physical illness
the relatively poorer health of rural or injury), and an increase of around
Australians compared to city-dwellers 17% in admissions among people with
(Smith et al. 2008) and older adults face dementia. A study of heatwaves in New
more challenges than most in reaching South Wales also found that people with
services. Older Australians, who rely an underlying mental health problem
entirely on income support, particularly were more vulnerable to extreme heat
where they do not own their own homes, (Khalaj et al. 2010).
typically live under financial hardship.
This means they are likely to struggle
to cope with the economic burden
associated with hot days and heatwaves,
for example, larger electricity bills for
air conditioning (if they have it), with
consequent risks for their health (Luber
and McGeehin 2008).
In any single year, one in five Australians
suffer from some type of mental
disorder and these illnesses account
for by far the largest proportion of
Australia’s burden of disease (Slade 2009).
Because these illnesses are so common
and so disabling, mental health is a
National Health Priority Area. People
experiencing mental health problems
are sometimes at increased risk during
heatwaves. Nitschke et al. (2007) found
that during heatwaves in Adelaide,
hospital admissions due to mental health
problems increased by 7%. A similar study
conducted in Adelaide from 1993 to 2006
found that, once the air temperature
climbed above 26.7°C, hospital admission
CLIMATECOUNCIL.ORG.AU Page 26You can also read