Analysis and Findings from Mapping the Australian Social and Affordable Housing Network - Queensland and Western Australia
←
→
Page content transcription
If your browser does not render page correctly, please read the page content below
Analysis and Findings from Mapping
the Australian Social and Affordable
Housing Network - Queensland and
Western Australia

See also:

   • Queensland Social and Affordable Housing Network Maps
   • Western Australia Social and Affordable Housing Network
     Maps

Judy Kraatz
Nirodha Jayawardena

P1.61 Mapping the Social and Affordable Housing Network
February 2020
SBEnrc P1.61 Mapping the Social and Affordable Housing Network
Acknowledgements

Project Steering Group

Project Leader and Lead Researcher:
Judy Kraatz            Griffith University
Researchers:
Nirodha Jayawardena Curtin University
Rachel Ong             Curtin University
Nicolas van der Nest   Curtin University
Core Members:
Richard Spradbury      Now Living BGC Residential
Linda Parmenter        Queensland Department of Housing and Public Works (QDHPW)
Jeremy Hill            QDHPW
Sarah Mewett           Western Australia Department of Communities (WA Communities)
Veronica Pannell       WA Communities
Affiliates:
Lyn Brun               Access Housing
Wendy Hayhurst         Community Housing Industry Association
Sonya Keep             Common Ground Queensland
Lindsay O'Sullivan     Keystart Home Loans
Mike Myers             National Affordable Housing Consortium (NAHC)
Luke Rowlinson         Rowlinson Architects Pty Ltd https://cpfcorp.com/
Alex Dordevic          Housing Vic and National Disability Insurance Scheme Reform Group

Additional stakeholders who participated in mapping workshops in Brisbane and Perth to develop
inputs included:

Michelle Brown           QDHPW - Director Social and Affordable Housing Programs
Emma Greenhalgh          Q Shelter - Director Policy and Sector Capacity
Venessa Swinburn         Community Services Industry Alliance - Project Officer
Ashley Rouse             NAHC - Quality and Contract Management Coordinator

Sustainable Built Environment National Research Centre (SBEnrc)                     Page 2 of 64
SBEnrc P1.61 Mapping the Social and Affordable Housing Network

TABLE OF CONTENTS

1     EXECUTIVE SUMMARY .................................................................................................................. 5
2     INTRODUCTION............................................................................................................................. 7
      2.1        Research approach .......................................................................................................... 8
      2.2        Why network mapping .................................................................................................. 12
3     NETWORK ELEMENTS - BACKGROUND....................................................................................... 15
      3.1        Element 1 – Policy drivers and players .......................................................................... 15
      3.2        Element 2 – Funding ...................................................................................................... 18
      3.3        Element 3 – Financing (private, institutional and individual) ........................................ 19
      3.4        Element 4 – Procurement and delivery ......................................................................... 20
      3.5        Element 5 – Metrics, indicators and data ...................................................................... 21
      3.6        Element 6 – Labour market dynamics and housing....................................................... 22
      3.7        Element 7 – Changing demographics ............................................................................ 23
      3.8        Element 8 – Housing typologies .................................................................................... 24
      3.9        Element 9 – Socio-environmental systems.................................................................... 27
      3.10       Element 10 – Integrated, shared and disruptive technologies...................................... 27
      3.11       Element 11 – Housing asset management .................................................................... 29
      3.12       Element 12 – Production supply chain .......................................................................... 29
      3.13       Element 13 – Knowledge, skills and capacity building .................................................. 31
4     INTERNATIONAL COMPARISONS ................................................................................................ 33
      4.1        Canada ........................................................................................................................... 33
      4.2        United Kingdom ............................................................................................................. 35
      4.3        Singapore ....................................................................................................................... 37
5     RESEARCH FINDINGS................................................................................................................... 39
      5.1        Concluding remarks ....................................................................................................... 44
6     APPENDIX A – NETWORK MAPPING EXAMPLES ......................................................................... 46
      6.1        Canada’s housing system ............................................................................................... 46
      6.2        Australian building and construction product system map........................................... 47
      6.3        Hong Kong construction industry stakeholder challenges ............................................ 48
      6.4        Energy efficiency in Australian housing - Social Network Analysis................................ 49
      6.5        An approach to collaboration in industrialised buildings - Actor Network Theory ....... 50

Sustainable Built Environment National Research Centre (SBEnrc)                                                                     Page 3 of 64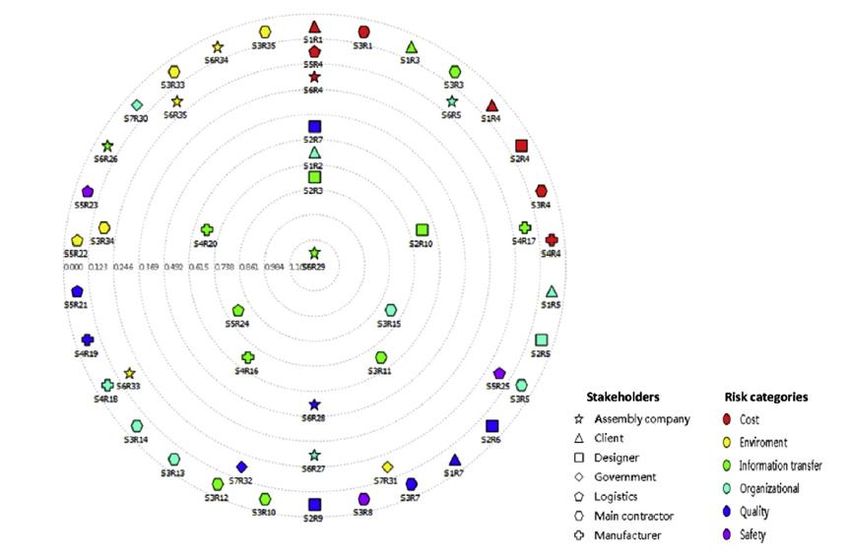
SBEnrc P1.61 Mapping the Social and Affordable Housing Network
7     APPENDIX B – ADDITIONAL ELEMENT-BASED INFORMATION ................................................... 52
      7.1         Element 2 - Funding ....................................................................................................... 52
      7.2         Element 3 - Financing..................................................................................................... 53
      7.3         Elements 2 and 3 - Funding and Financing in Canada ................................................... 54
      7.4         Element 9 - Socio-economic systems ............................................................................ 55
8     References .................................................................................................................................. 56

Sustainable Built Environment National Research Centre (SBEnrc)                                                                     Page 4 of 64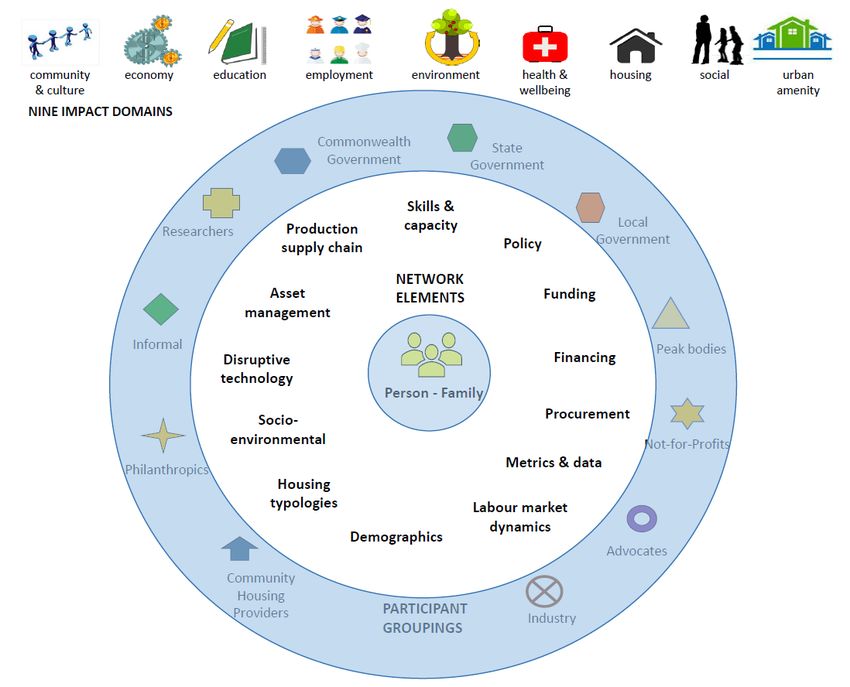
SBEnrc P1.61 Mapping the Social and Affordable Housing Network

1 EXECUTIVE SUMMARY
This Sustainable Built Environment National Research Centre (SBEnrc) project, Mapping the Social
and Affordable Housing Network aims to contribute to improvement in the productivity,
effectiveness and efficiency of this network in Australia. Through providing a high level, graphical
representation across 13 elements these maps, and associated findings cast light on current
complexity, challenges and opportunities.
The maps, findings and supporting materials have been brought together to facilitate a strategic yet
pragmatic understanding of of this network. This has been done to help organisations better
leverage outcomes for those in need of social and/or more affordable housing.
These maps are a snapshot in time, at July 2019. As such they are intended to provide a base-line
overview of this network, to inform current understanding, and future analysis and decision-making.
They cannot be comprehensive due to the expansive nature of the network (and limited project
resources), but aim to provide a foundation for decision-making. For example, they could help guide
a living process to assist organisations identify and engage with partners and stakeholders, to better
address the changing nature of the housing need. The intent has been to identify all participants for
the three tiers of government and for peak bodies/industry associations, whilst providing examples
only for the remaining groups of participants involved in the network. Network maps have been
developed for two focal participants, the WA Department of Communities, and the Queensland
Department of Housing and Public Works.
Thirteen elements have been identified and used to provide clarity for both the graphical
representations and also to help network participants breakdown the complexity to aid decision-
making.
       1. Policy drivers and players                        8. Housing typologies
       2. Funding                                           9. Socio-environmental systems
       3. Financing (private, institutional and             10. Integrated, shared and disruptive
           individual)                                           technologies
       4. Procurement and delivery                          11. Housing asset management
       5. Metrics, indicators and data                      12. Production supply chain
       6. Labour market dynamics and housing                13. Knowledge, skills and capacity
       7. Changing demographics                                  building
   The consequent analysis and findings have then been based on: (i) knowledge gathered in the
   previous SBEnrc social and affordable housing program of research; (ii) desk top research of the
   network; (iii) a limited review of relevant network mapping literature; (iv) input of expert
   stakeholders in the workshops held from May-July 2019; (v) feedback on draft maps from research
   partners; (vi) a limited review of literature relevant to system improvement; (vii) a limited review of
   housing system literature in Canada, Singapore and the United Kingdom (UK); and (viii) insights and
   reflections from the research team throughout the process of developing these maps.
   The findings and recommendations included in this report are not specific to the two state government
   housing agencies as the focal participants, but address issues across the whole of the housing network,
   as identified in the network maps. As such they will be relavent at various levels of government, and/or
   to various participants across the network. Whilst some findings may be specific to certain groups of
   organisations, it is recommended that all network participants engage with these findings to help build
   understanding of the complexity and inter-relationships which exist across the Australian social and
   affordable housing network. This research offers a unique and important overview of the Australian
   social and affordable housing network as a whole, rather than one of siloed parts. This provides the
   opportunity for people and organisations to come together with a united understanding and language,
   to add value both within and across the network.

Sustainable Built Environment National Research Centre (SBEnrc)                             Page 5 of 64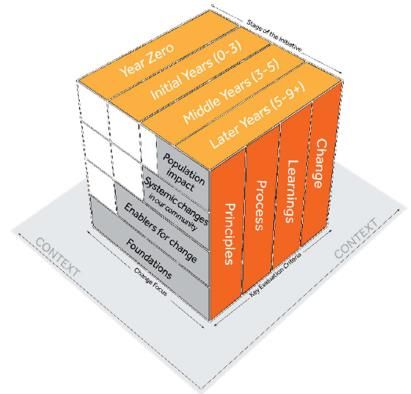
SBEnrc P1.61 Mapping the Social and Affordable Housing Network
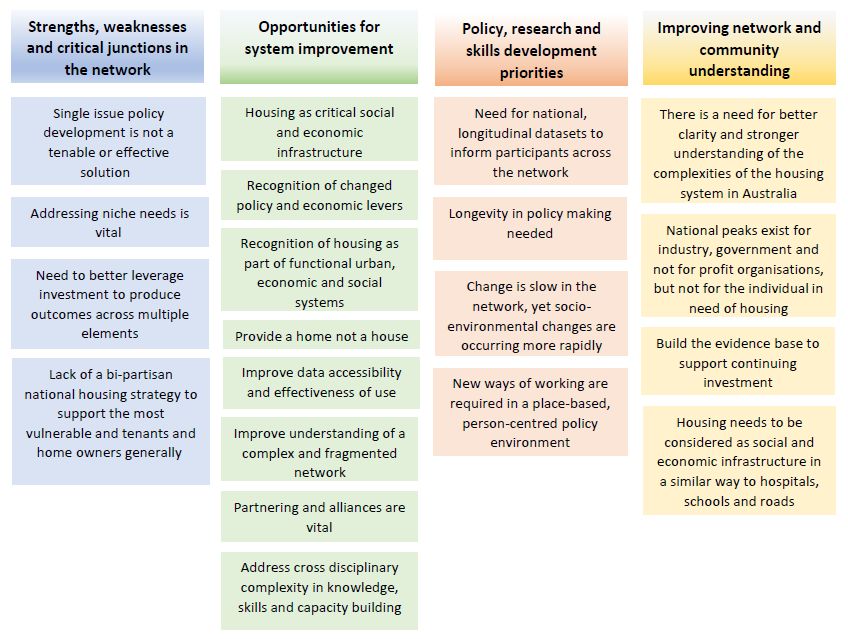
The key findings identified in this research are listed below. Accompanying recommendations are
provided in Section 5 Research Findings.
Strengths, weaknesses and critical junctions in the network
1) Single issue, stand-alone policy development around housing is not a tenable or effective
solution to complex problems across the network.
2) Addressing niche client needs is vital in a person centred environment.
3) The need exists to better leverage investment to produce outcomes across multiple elements.
4) There is currently a lack of a national bi-partisan housing strategy to support the most
vulnerable and tenants and homeowners generally.
Opportunities for system improvement
5) Housing as critical social and economic infrastructure.
6) Recognition of alternative policy and economic levers at a national level, beyond demand and
supply.
7) Greater national recognition of housing as part of functional urban, economic and social
systems, with associated required policy integration.
8) Providing a home not a house.
9) Improving data accessibility and effectiveness of use across the network.
10) Improve understanding of a complex and fragmented network, across both asset and service
delivery.
11) Partnerships and alliances across the network are vital to strengthen the system.
12) Address cross disciplinary complexity in building knowledge, skills development and capacity
building.
Policy, research and skills development priorities
13) There is a need for national, longitudinal datasets to inform policy development, delivery and
to better understand the impact of policy changes.
14) Longevity in policy making needed.
15) Change is slow in this network, yet socio-environmental changes are occurring more rapidly.
16) New ways of working (e.g. co-design) are required in a place-based, person-centred policy
environment.
Improving network and community understanding
17) There is a need for better clarity and stronger understanding of the complexities of the
housing system in Australia.
18) National peaks exist for industry, government and not-for-profit (NFP) organisations but not
for the individual in need of housing.
19) Continue to build the evidence base to support continuing government needs-based
investment in housing, along with further building the case for private and NFP investment.
Housing needs to be considered as social and economic infrastructure in a similar way to
hospitals, schools and roads. This requires asset management budgets and rolling programs of
work to enable investment planning to me long term demand based on demographic
projections.
Further research in this area is recommended, to build on these baseline maps. Follow-up interviews
with expert stakeholders, network participants and those living in social and affordable housing could
enable a further more detailed analysis of the network, to further describe, analyse and quantify
relationships and interactions.
This document partners with two companion reports - Queensland Social and Affordable Housing
Network Maps and Western Australia Social and Affordable Housing Network Maps.
Sustainable Built Environment National Research Centre (SBEnrc) Page 6 of 64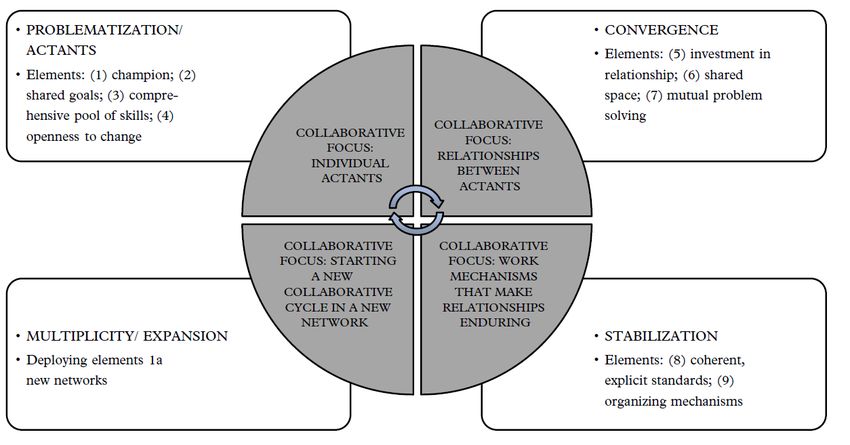
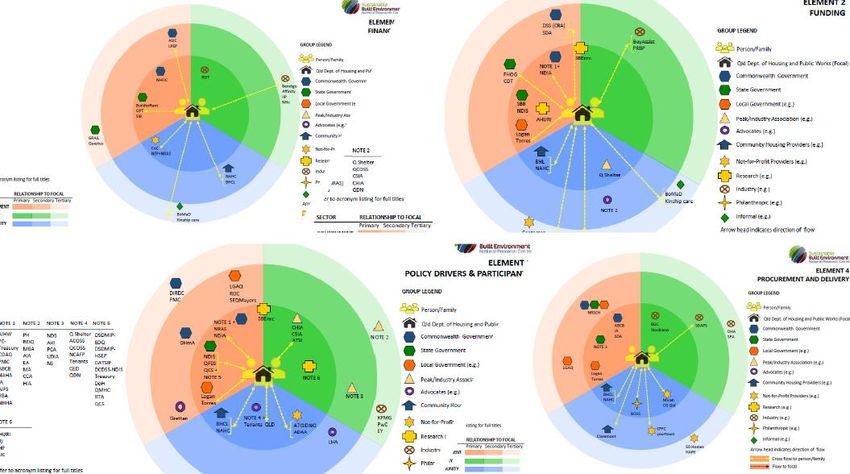
SBEnrc P1.61 Mapping the Social and Affordable Housing Network

2 INTRODUCTION
Sustainable Built Environment National Research Centre (SBEnrc) research, Mapping the Social and
Affordable Housing Network1 aims to improve the productivity, effectiveness and efficiency of the
housing system in Australia.
This current research builds upon findings of previous SBEnrc research projects: Rethinking Social
Housing2, Valuing Social Housing3, and Procuring Social and Affordable Housing4. Through provision of
a set of network maps the research aims to provide a strategic yet pragmatic understanding of the
complexities and associations in the system which can then inform policy development and delivery.
The Rethinking Social Housing project developed a productivity-based conceptual framework, which
addressed the role and benefits of having access to safe and secure housing through the lens of
productivity, in terms of an array of benefits including tenant, macro-economic, fiscal and non-
economic perspectives.
These high-level maps which focus on public, community and non-market rental housing, aim to
identify, understand and describe the various elements of this complex system.
Most people reading this report will have a high level of understanding of the housing system in
Australia, and the elements within this system. The network maps developed in this research provide
a graphical representation of some of this complexity. Figure 1 is a composite image of four of the
thirteen maps developed for Queensland (Qld). Full reports for both Qld and Western Australia (WA)
are available at the project website.

Figure 1 – Network mapping composite image

1
 http://sbenrc.com.au/research-programs/1-61/
2
  http://sbenrc.com.au/research-programs/1-31/
3
  https://sbenrc.com.au/research-programs/1-41/
4
  http://sbenrc.com.au/research-programs/1-54/
Sustainable Built Environment National Research Centre (SBEnrc)                         Page 7 of 64
SBEnrc P1.61 Mapping the Social and Affordable Housing Network
The Australian Institute of Health and Welfare (AIHW) also provide some timely updates on the extent
of housing need (2019):

      1. ‘288,800 clients were assisted by SHS (specialist homeless services) agencies in 2017–18.’
      2. ‘‘189,400 households (were) awaiting social housing allocation at 30 June 2017.’
      3. ‘812,900 tenants in 396,100 households were living in the main social housing programs
         across Australia in 2016–17.’
Other points which provide an overarching context for consideration as you read this report include:

      1. ‘183,965 Australians are benefiting from the (National Disability Insurance Scheme) NDIS,
         including: 176,197 people [who] have received individualised plans’ (National Disability
         Insurance Agency 2018).
      2. It is only recently (i.e. one generation) that Australians have built significant wealth from
         housing (Herbert, McCue et al. 2013).
      3. Increase in disposable income for consumer goods to fill houses. The average size of Australian
         houses are some of the largest in the world (Commsec 2017).
      4. There has been a trend towards the financialisaton and commodification of housing globally
         with Sydney being the focus of international investment which has contributed to the housing
         affordability issue nationally. (Farha 2017).
      5. This has been occurring alongside the role of housing provision being increasingly relinquished
         by state and territory governments to the NFP and private sector, and partnerships thereof
         (Dalton 2009). The shift has been occurring for many decades (Table 1) and is much more
         complex than a supply and demand equation with links to the labour market, income
         distribution and demographic changes in our population. This shift from public sector provision
         is one that is entwined with ‘the broader functioning of urban economies and social cohesion’,
         and the need to develop housing policy on a national scale and in a global context (Dalton
         2009).

Table 1 - Public housing completions as a percentage of dwelling completions

                                                            Percentage
                                        1945/46                 23
                                        1955/56                 20
                                        196465                  14
                                        1966                    8*
                                      * Of total stock of occupied dwellings
                                      Source: Dalton 2009

2.1       Research approach
Critical to this research is the focus on the person and/or the household. This has been central to the
SBEnrc social and affordable housing program of research since 2014, when the nine impact domains
were developed, which demonstrate the value and impact of having safe and affordable housing on all
aspects of a person’s life. These impact domains are community and culture, economy, education,
employment, environment, health and wellbeing, housing, social engagement and urban amenity

The network maps have then been developed in the context of the lead government housing agency
in both Queensland and Western Australia (as the focal participant). Both these agencies are core
partners in SBEnrc. This has been done with a focus on combined asset and service provision, in line
with housing strategy in both states. This also acknowledges that greater benefit from investment is
gained where broader issues of individual and community wellbeing are also considered, as
demonstrated in the previous SBEnrc research project Valuing Social Housing.

Sustainable Built Environment National Research Centre (SBEnrc)                            Page 8 of 64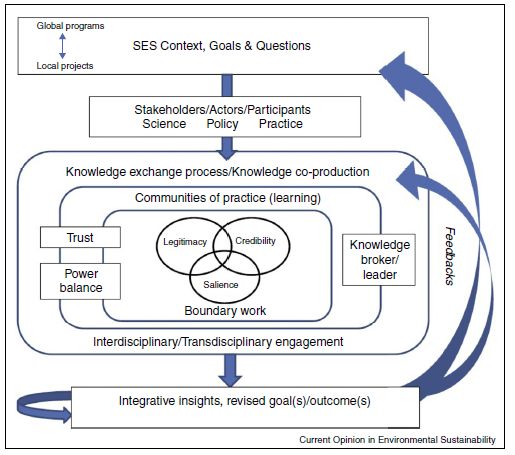
SBEnrc P1.61 Mapping the Social and Affordable Housing Network
Thirteen elements of the social and affordable housing network, listed below, have been identified to
improve map clarity and ensure complex information could be communicated as effectively as
possible. Development of these elements was informed by previous SBEnrc research, including the 9
impact domains developed in the Rethinking Social Housing research and then in conjunction with
industry experts in project-based Working Group discussions from March to August 2018, and Project
Steering Group meeting input in October 2018.

    1. Policy drivers and players                             8. Housing typologies
    2. Funding                                                9. Socio-environmental systems (SES)
    3. Financing (private, institutional and                  10. Integrated, shared and disruptive
       individual)                                                technologies
    4. Procurement and delivery                               11. Housing asset management
    5. Metrics, indicators and data                           12. Production supply chain
    6. Labour market dynamics and housing                     13. Knowledge, skills and capacity
    7. Changing demographics                                      building

Further to improving map clarity, network participants were collated in 11 groups (Table 2). The intent
has however been to aim to identify all participants for the three tiers of government and for peak
bodies/industry associations, while providing examples only for the remaining groups of participants
involved in the network (as at July 2019).

The intensity of the relationships (i.e. primary, secondary or tertiary) with the focal participant has also
been identified on the maps and in the associated reference tables. This has been established through
desk-top research, expert panel workshops and research team knowledge. For example, the
relationship between the focal participant (i.e. QDHPW) is, for example:

    1. Primary - with other government agencies whose policy objectives are intertwined
    2. Secondary - with many of the industry organisations who may lobby and inform policy but do
       not have a direct relationship with the focal participant.
    3. Tertiary - with, for example, realestate.com, who provide an important service to home buyers
       but not with the focal participant.

Sustainable Built Environment National Research Centre (SBEnrc)                               Page 9 of 64
SBEnrc P1.61 Mapping the Social and Affordable Housing Network
Table 2 – Group icons and details

                            Commonwealth Government                All participants*

                            State government                       All participants*

                            Local government                       All participants*

                            Peak body/industry association         All participants

                            Advocates                              Examples only

                            Community housing providers (CHPs)     Examples only

                            Not-for-profit (NFP) providers         Examples only

                            Research                               Examples only

                            Industry                               Examples only

                            Philanthropic                          Examples only

                            Informal                               Examples only

Figure 2 highlights the relationship among the nine impact domains, the 11 network participant groups
and the 13 network elements.

Figure 2 – Domains, participants, elements and the person

Sustainable Built Environment National Research Centre (SBEnrc)                        Page 10 of 64
SBEnrc P1.61 Mapping the Social and Affordable Housing Network
Two sets of 13 network maps have been developed, one for WA and one for Qld. The 2 focal
participants (actors), around which the maps were built are: (i) WA Department of Communities (WA
Communities); and (ii) QDHPW. Information for these maps has been compiled in reference tables,
and was developed through: (i) research team expertise; (ii) desk top research; (iii) expert panel
workshops in both Brisbane and Perth between May and July 2019; and (iv) feedback from partners
on the draft maps.
It is important to note that such a view of the social and affordable housing system in both WA and
Qld has not been undertaken to date. These maps are thus provided as a base from which to build a
more detailed understanding of how this complex system functions. Further expert panel workshops
and interviews would be required to enable greater understanding which could then inform the
development of data rich maps using online network mapping software. The maps cannot be
comprehensive due to the expansive nature of the network, but they are intended to provide a starting
point for understanding. As such they could become part of a living process for organisations to engage
with partners and the broader sector to better understand the changing nature of the network over
time, given available funding and resources.
This subsequent analysis, in line with the project objectives identified in the SBEnrc P1.61 Project
Schedule and Project Steering Group discussions, aims to identify: (i) identify strengths, weaknesses
and critical junctions in the network; (ii) identify opportunities for system improvement for example,
in relation to technical, capability, coordination, cultural or other issues; and (iii) make
recommendations for policy, research and skills development in the sector.
This analysis has been informed by:
1. Knowledge gathered in the previous SBEnrc social and affordable housing program of research.
2. Desk top research of the network.
3. A limited review of relevant network mapping literature, based on available resources.
4. Input of expert stakeholders in the workshops held from May to July 2019.
5. Feedback on draft maps from research partners.
Sustainable Built Environment National Research Centre (SBEnrc) Page 11 of 64SBEnrc P1.61 Mapping the Social and Affordable Housing Network
6. A limited review of literature relevant to system improvement.
7. A limited review of housing system literature in Canada, Singapore and the UK.
8. Insights and reflections from the research team throughout the process of developing these
maps.
2.1.1 Clarifications
The following points of clarification are provided:
1. For social housing, QDHPW has a key policy role with on-the-ground delivery through the
Department of State Development, Manufacturing Infrastructure and Planning (DSDMIP) and
local government arrangements along with national settings such as the National Affordable
Housing Agreement (NAHA).
2. For affordable housing, QDHPW plays more of a catalyst role, providing policy and some
financial input. The key drivers at a state level are DSDMIP frameworks and national policy
settings such as the National Housing Finance and Investment Corporation (NHIFC) and tax
incentives.
3. Whether an organisation has been included as a peak body, industry association or an
advocacy group has been based on their website details. The distinction is made to assist
with the clarity of the maps and is sometimes grey. This does not broadly impact findings.
2.2 Why network mapping
The use of visualisation techniques to help explain complex networks is widely supported as it provides
researchers and participants to see a graphical representation of the network being investigated.
Hogan et al. (2007) note that illustrating links between participants provides more dependable results,
engagement and understanding.
To help establish a process for this mapping, a review of literature focussed around network mapping
was undertaken in late 2018. Limited literature was found which directly addresses mapping the
social and affordable housing network. Considerable literature was found however in related and
allied sectors. Based on this review, a hybrid Social Network Mapping/Actor Network Theory
(SNA/ANT) approach has been used for this research. This approach enables us to identify the
participants within this network in Australia, with an emphasis on the human and organisational
actors. It enables a multilevel analysis of interactions and influences among multiple stakeholders
within the network, to deliver on the research objectives previously stated. The following steps were
thus undertaken:
1. Identify the focal actors i.e. WA Communities, and QDHPW.
2. Confirm the 13 elements for considering the network to facilitate mapping clarity.
3. Identify participants (nodes) and links (e.g. flows of knowledge).
4. Identify activities, connections and interactions among participants (especially with the
individual/household).
5. Consolidate information into reference tables.
6. Develop draft maps.
7. Conduct expert panel workshops with key participants, and then draft map content with
regards to coverage of participants and map clarity.
8. Finalise the network maps.
9. Analyse the maps to identify synergies, gaps and clashes in line with research objectives in
terms of strengths, weaknesses and critical junctions in the network, opportunities for
system improvement and policy, research and skills development priorities.
Mapping these networks can shed light on synergies that contribute to improving processes and
outcomes, and to the gaps and clashes which impact on delivering effective outcomes. To effectively
implement change an understanding of the complexity of the system, both formal and informal, is
Sustainable Built Environment National Research Centre (SBEnrc) Page 12 of 64SBEnrc P1.61 Mapping the Social and Affordable Housing Network
required. Ultimately, the effectiveness of the network affects short-term outcomes, and medium and
long-term impacts across both the social and financial realms. Benefits of mapping this system, and its
many participants, includes:
1. Improved communications and sharing - a visual map can reveal system dynamics and
show: key actors; boundaries of the supply chain; interrelationships and functional
roles, flow of services, knowledge and information along the chain; linkage points; and
gaps or blockages among participants.
2. Improved analysis through - for example, providing a starting point for new participants
to the network, or for existing members to identify issues, challenges and areas for
improvement.
3. Promotion of higher level collaboration - for example, in helping to overcome barriers to
entry, bottlenecks, value sharing and supply-related constraints.
These current research outcomes (i.e. network maps and reference tables) also provide the
opportunity for further, more analytical network analysis. On-line network mapping tools are very
effective in imagining, and perhaps re-imagining, a process as a complex system containing various
stakeholders and relationships. The purpose of such being to analyse stakeholder associated schedule
risks and their cause-and-effect relationships. This methodology has been applied in various research
areas, including a green building project (Yang and Zou 2014), waste management (Caniato, Vaccari et
al. 2014), the construction industry (Zou 2006), information science (Otte and Rousseau 2002), and
social science (Borgatti, Mehra et al. 2009).
Examples of how network/system mapping approaches and tools have assisted with improving
network outcomes and impacts in allied housing-related sectors are listed below with detail provided
in Section 6, Appendix A:
1. Australian building and construction industry – product system map.
2. Hong Kong construction industry - risk network and status centrality map.
3. Canadian housing system.
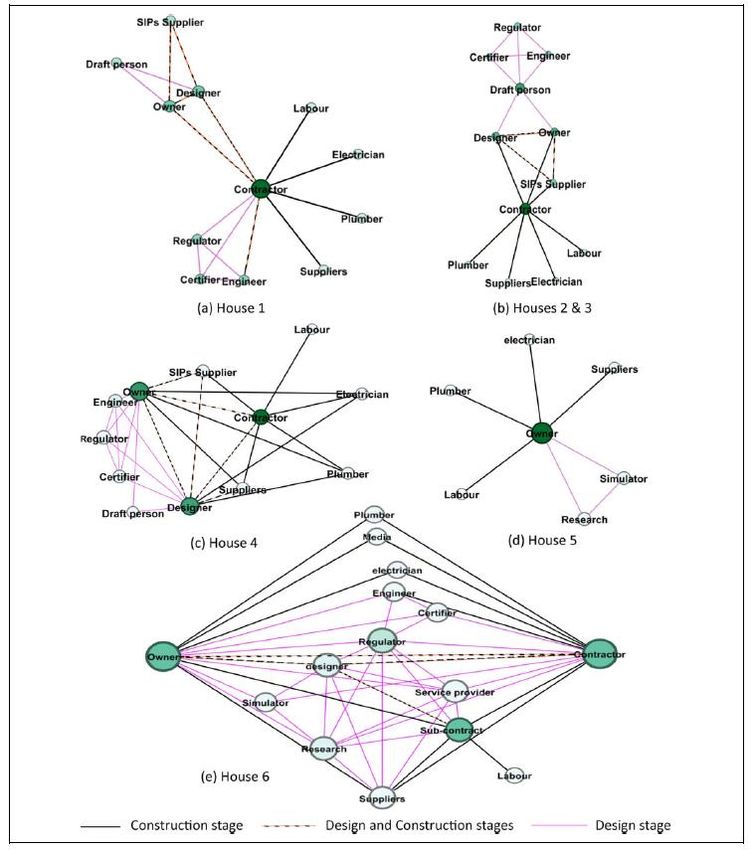
4. Energy efficiency in Australian housing – SNA.
5. Collaboration for industrialised building settings within the Australian housing supply chain –
ANT.
Table 3 provides a summary of the benefits of network mapping in a housing delivery context, based
on the examples provided in Appendix A.
Table 3 – Summary of benefits of network mapping in the housing delivery context
Housing Benefits
Delivery
Segment
Planning • Better information flow about customer requirements.
• Improve flow of knowledge and resources to make all firms in the delivery
supply chain more productive.
• Greater coordination of design and assembly.
Construction • Identifying and managing risks.
• Better access to resources.
• Provide a broader conceptual view of the building activity
• Utilising resources.
• Strengthening the weakest link to address bottlenecks in the chain.
• Improving specific links between firms to address issues at identified
bottlenecks.
Marketing and • Creating new or alternative links in the chain, such as promoting local firms
sales to enter global supply chains.
Sustainable Built Environment National Research Centre (SBEnrc) Page 13 of 64SBEnrc P1.61 Mapping the Social and Affordable Housing Network
• Linking to new, additional lead firms.
Occupancy and • Uncover sources of conflicts as well as potentials for cooperation
management • Facilitate knowledge exchange and learning processes
• Develop visions and strategies to achieve common goals.
Sustainable Built Environment National Research Centre (SBEnrc) Page 14 of 64SBEnrc P1.61 Mapping the Social and Affordable Housing Network
3 NETWORK ELEMENTS - BACKGROUND
As discussed above, the element-based approach to the maps is intended to build understanding
around the breadth of discussions which need to occur. This section: (i) highlights some of the key
issues identified in the course of this research; and (ii) provides some additional background for each
of the 13 elements. This then informs the findings and recommendation provided in Section 5 of this
report. Issues highlighted include those which emerged during map development and refinement
(including expert panel comments and discussions), and desk top research throughout the course of
this project.
3.1 Element 1 – Policy drivers and players
The following key issues are highlighted for this element:
1. The network maps reveal the complexity of the system, and can potentially help policy makers
better understand the breadth of change which needs to be addressed, beyond supply and
demand, and economic value. The complexity also demonstrates the challenges which will be
faced in building consensus for a national housing strategy.
2. There is a high degree of permeability between state and civil society policy-making as
evidenced by the number of non-state/civil society players represented in the network maps.
3. Policy diffusion without national leadership, a national strategy, and a national body
specifically representing those in housing crisis, tenants, and homeowners, is impeding the way
in which a strong bi-partisan national strategic focus can be developed.
4. Co-design among the three tiers of government, CHPs and the private sector, and among asset
providers, service providers and advocates are considered an important way of providing
person centred, place-based solutions.
The 2019 ANZ Core Logic Housing Affordability Report highlights several issues around supply and
demand and the economy, including housing affordability, intergenerational inequity, interest rates,
access to credit and persistently low income growth remains as ongoing challenges for policy makers
(ANZ and Corelogic 2019). Broader issues, as highlighted by Dalton (2009), also need to be considered
in the current housing policy environment. These include:
1. There is permeability between state and civil society policy-making, as evidenced by the
number of non-state/civil society players represented in the network maps including the many
peak bodies and industry associations.
2. Policy diffusion, without national leadership, and without a national association body
specifically representing those in housing crisis, tenants, and homeowners, further
marginalises broad reaching housing policy development beyond supply and demand
scenarios.
3. The rise in popularity of non-for-profit housing and co-operatives ‘because costs could be
contained by devolving responsibility and encouraging volunteer labour and sweat equity’.
4. Issues of housing and labour market income distribution, demographic changes, urban
economies, and social cohesion need consideration.
5. The limited capacity of state agencies to make an impact ‘in terms of broader economic policy
making in a national and global context’.
Many individuals and organisations across Australia have been calling for a national housing strategy
or plan (Community Housing Industry Association (CHIA) 2018, National Shelter 2018). The complexity
of the network maps demonstrates the challenges which will be faced in building consensus for such
a national strategy. Whilst there is now a Commonwealth Minister and Assistant Minister for Housing,
responsibilities for ensuring an effective housing system remains spread across many departments
(including Social Services and Human Services and those representing Indigenous Australians). In the
Sustainable Built Environment National Research Centre (SBEnrc) Page 15 of 64SBEnrc P1.61 Mapping the Social and Affordable Housing Network
shadow ministry there is again several ministries with responsibilities which impact on housing. This
policy diffusion is impeding the way in which a strong bi-partisan national strategic focus can be
developed (Dalton 2009; Lawson, Dodson et al. 2019) To compound this, the states and territories
have a primary role in the delivery of public housing, and setting the environment for community
housing, and affordable rental and private housing, with local government having a primary role in
zoning and planning mechanisms (Table 4). A bi-partisan approach to the development of housing
policy at a national level, and in many states, has not existed in this country for many decades, with
policy changes often linked to political cycles. Much of the impact of housing policy cannot be
accounted for in the short term, with impacts not becoming evident for several years, or even inter-
generationally. This makes it difficult to track and understand the impact of policy decisions.
Table 4 – Snapshot of housing-related responsibilities by tier of Government
Tier of Current primary responsibilities and Additional recommended responsibilities and
Government powers* powers
Common- Tax arrangements Policy leadership – long term housing plan
wealth Building codes and regulation (Australian Leadership aboriginal housing Leadership
Building Codes Board) disability housing
Funding – e.g. National Housing Finance Expanded/updated codes and regulations to
and Investment Corporation, match changing environment
Commonwealth Rent Assistance Aboriginal housing funding
Social security payments Living wage/rent
National data repository to enable social value
bank
National CHP regulation
State Taxes and duties Value capture and inclusionary zoning on all
Planning and development government land
Public housing supply Rental security regulations
CHP regulation
Private rental regulation
Indigenous community housing
Social support infrastructure
Transport infrastructure
Local Zoning Planning mechanisms to protect affordable
Planning mechanisms housing
Urban and community infrastructure Encourage diversity of stock
Partner with CHPs land supply
* This is not definitive as the situation varies based on partnerships and other arrangements
Further key issues identified in the course of this and previous SBEnrc social and affordable housing
research include:
1. The need to prioritise funding across the housing network, due to the contestatory and
competitive funding environment which exists between the Commonwealth, and State and
Territories, is disadvantaging the most vulnerable in our society, and impacting on the
functioning of the broader housing system.
2. Embedding co-design – among (i) the three tiers of government, CHPs and the private sector,
and (ii) asset providers, service providers and advocates is needed to support a person
centred, place-based approach to housing policy making and provision.
3. Evidence-based policy development and evaluation is needed to be able to promote
investment and report return on investment, to both commonwealth and state Treasuries
and private/institutional investors.
4. Recognition of the medium to long term (often inter-generational) impact of the lack of
secure housing is needed.
Sustainable Built Environment National Research Centre (SBEnrc) Page 16 of 64SBEnrc P1.61 Mapping the Social and Affordable Housing Network
5. There is a need for a non-commodified housing system with housing classed as both social
and economic infrastructure (Infrastructure Australia 2019, Queensland Department of State
Development, Manufacturing, Infrastructure and Planning (QDSDMIP 2019).
6. Clarity in the policy related to housing is especially important for the most vulnerable
community members, including people with disability and Indigenous Australians.
The Queensland Council of Social Services (QCOSS) housing policy theory of change is provided as an
example of a structured process for addressing these complex and currently intractable problems
(Figure 3).
Figure 3 – QCOSS Housing policy Theory of Change
Source: Queensland Council of Social Service 2018a
Recommend further reading relevant to this element includes:
1. Commonwealth of Australia (2017). Remote Housing Review: A review of the National
Partnership Agreement on Remote Indigenous Housing and the Remote Housing Strategy
(2008-2018). Commonwealth of Australia, Canberra.
2. Habibis, D., R. Phillips and P. Phibbs (2019). Housing policy in remote Indigenous communities:
how politics obstructs good policy, Housing Studies, 34:2.
3. Power, E. and K. Mee (2019) "Is this a housing system that cares? That’s the question for
Australians and their new government." The Conversation.
4. Westbury, N. and M. C. Dillon (2019). Overcoming Indigenous exclusion: very hard, plenty
humbug. Centre for Aboriginal Economic Policy Research, Australian National University:
Canberra.
Sustainable Built Environment National Research Centre (SBEnrc) Page 17 of 64SBEnrc P1.61 Mapping the Social and Affordable Housing Network
3.2 Element 2 – Funding
The following key issues are highlighted for this element:
1. The taxation treatment of housing in Australia is an issue highlighted by several network
participants.
2. Family and kinship support are important in this element.
It is well understood that government alone cannot cope with the increasing demand for social
housing. Hence, it is imperative we look at innovative ways to fund this need with the collaboration of
private institutional investors. Governments in Australia can take a proactive role in addressing issues
which fall into their jurisdiction regarding long-term policy setting, transparency and risk. Different
social and affordable housing projects also require different funding mechanisms, that is, some
instruments work best for individual projects, while others perform better on a city, regional or
national level.
Several organisations address the tax treatment of housing in Australia and its impact of the housing
system and affordability:
1. Reforms of capital gains tax and negative gearing provide benefits to people who already own
houses leaving the low/middle income groups in the expensive rental market (National Shelter
2018).
2. CHPs supplied 3.3 percent of Australia’s rental housing (CHIA 2018). Thus, eliminating bias in
the taxation system towards social and affordable housing development is an important way
to attract more CHPs to the sector. Moreover, CHIA NSW note that ‘channelling social and
affordable housing investment through not-for-profit housing organisations maximises the
impact of the taxpayer’s investment because CHPs forego the usual developer margin and use
taxation concessions to generate 25 to 30 percent additional supply’ (CHIA NSW 2018).
3. The 2018 Grattan Institute report on housing affordability discusses tax settings including
impacts on how they encourage people to invest in housing, and discourage people from
downsizing, increasing demand for well-located houses (Daley and Coates 2018).
4. The 2018 Housing Policy Review report from QCOSS discussed this in the context of housing
being commodified rather than viewed as a human right (QCOSS 2018).
5. The 2018 Australian Housing and Urban Research Institute (AHURI) report Pathways to
Housing Tax Reform, proposed a staged set of housing tax reform around: (i) income tax
treatment of housing assets; (ii) asset portfolio decisions of Australian households; and (iii)
pathways to state housing and land tax reform (Eccleston, Verdouw et al. 2018).
A further issue raised throughout this program of research is the need to provide the person or
household with a stable home that does not change depending on the type of assistance they are
receiving at a given point in time (See Section 7.1 for a snapshot of Australian Government funding
schemes).
Recommend further reading relevant to this element includes:
1. Jayawardana, N. I. and J. Kraatz (2018). Funding and Financing Approaches. SBEnrc: Brisbane,
Australia.
2. Kraatz, J. and N. I. Jayawardana (2018). Procuring social and affordable housing. SBEnrc:
Brisbane, Australia.
Sustainable Built Environment National Research Centre (SBEnrc) Page 18 of 64SBEnrc P1.61 Mapping the Social and Affordable Housing Network
3.3 Element 3 – Financing (private, institutional and individual)
The following key issues are highlighted for this element:
1. Risk is considered to be a major component in restricting large-scale investment.
2. Reduced economies of scale for providers, a perception of increased credit risk, below market
returns on rental yields are all making investment in housing less attractive.
3. Long term measures, consistent policy direction, stable regulatory environments and reliable
cash flows are all important to investors.
4. Several innovative models for attracting funding are available.
5. Rental system reform is needed to address trend of people staying in the rental system for
longer periods.
6. Social housing being considered as an infrastructure class an important step to considering
housing as vital economic and social infrastructure.
There has been debate over the past few years as to how substantial volumes of private finance could
be leveraged into this sector. The most widely suggested approaches include: the use of retail
investment vehicles; tax relief targeting CHPs; rent-to-buy models; and shared equity models.
Risk is considered to be a major component in restricting large-scale investment and has a significant
impact on the various investment hurdle rates, however under the right conditions, risk is an imputed
cost/rate which may never be realised. Therefore, if these risks were removed the required investment
rate would be substantially reduced, and potentially the costs associated with various housing related
activities and their externalities would also be reduced.
Social Ventures Australia (2017) highlight several challenges in attracting private capital: (i) reduced
economies of scale for providers; (ii) a perception of increased credit risk from institutional investors
limiting access by CHPs to low-cost capital over longer terms; (iii) rental yields which are significantly
below market returns making it a less attractive investment; (iv) the need for stable regulatory
environments and reliable cash flows; and (v) short term measures and inconsistent policy direction
which creates uncertainty.
Providing only demand side subsidies is not sufficient to tackle the widening gap between the demand
and supply of funding and finance. This could be addressed to some extent through: a fairer and more
secure renting system which does not assume renting is a pathway to home-ownership (National
Shelter 2018); commonwealth government participation at all stages in building social and affordable
housing, including identifying shortfalls in the existing financing mechanisms; and better accounting
for future demographic and technology changes. This requires attention to all 13 elements discussed
in this report when making and evaluating strategy, policy and budgets.
Of note also is that social housing is now considered as an asset class by the Queensland Government
(QDSDMIP 2019b) and Infrastructure Australia (Infrastructure Australia 2019). This is an important step
forward for housing to be considered in the broader context of fulfilling value to the person/household
and society.
See Section 7.2 and 7.3 for addition detail of some Australian financing schemes and approaches.
Recommend further reading relevant to this element includes:
1) Jayawardana, N. I. and J. Kraatz (2018). Funding and Financing Approaches. SBEnrc: Brisbane,
Australia.
2) Kraatz, J. and N. I. Jayawardana (2018). Procuring social and affordable housing. SBEnrc:
Brisbane, Australia.
Sustainable Built Environment National Research Centre (SBEnrc) Page 19 of 64SBEnrc P1.61 Mapping the Social and Affordable Housing Network
3.4 Element 4 – Procurement and delivery
The following key issues are highlighted for this element:
1. The shift in delivery to that of person-centred and place-based delivery approaches continues,
and remains as a significant shift in procurement in recent times.
2. Addressing unconscious bias in procurement systems is critical for person centred and place
based solutions.
A place-based approach is defined as ‘collaborative, long-term approaches to build thriving
communities delivered in a defined geographic location’ (Dart 2018, p.1). This approach is now being
used by state housing agencies to respond to complex and challenging social issues. The Place-based
Evaluation Framework, developed by Dart, includes ‘instruction for multi-site PBAs (place-based
delivery approaches), evaluation scoping, collective impact, cultural capability, theory of change, key
evaluation questions, principles, indicators, measurement, ethical conduct, resourcing, reporting, and
a theoretical overview of complexity aware evaluation approaches’. The conceptual cube (Figure 4)
provides a guide to the interplay of elements when considering place-based solutions.
Figure 4 – Conceptual cube - the interplay of elements in place-based solutions
Source: Dart 2018, p.2.
In a person-centred delivery environment, cultural proficiency within and across an organisation is
important (Figure 5), requiring ‘an organisational culture that actively challenges and addresses
unconscious bias towards people from culturally and linguistically diverse (CALD) backgrounds with
disability and their communities’ (Katrivesis and Robertson 2018, p.1) (Figure 5 – Key elements of
Sustainable Built Environment National Research Centre (SBEnrc) Page 20 of 64SBEnrc P1.61 Mapping the Social and Affordable Housing Network
cultural proficiency – good practice model Figure 5). Such an approach is needed to ensure a diverse
and inclusive approach to procuring social and affordable housing, throughout the network, and not
just limited to those organisations involved specifically in the delivery of housing to specific cohorts.
Figure 5 – Key elements of cultural proficiency – good practice model
Source: Katrivesis and Robertson 2018, p.1.
In a 2012 working paper Martel, Harley et al. 2012 review procurement options used in remote
Indigenous communities in both the Northern Territory (NT) and WA through three case studies. The
paper proposed the following criteria as a guide to the selection of appropriate procurement methods:
(i) the apportionment of risk and responsibilities; (ii) clarity and tangibility i.e. flexibility and ease of
variation in dealing with uncertainty; (iii) the importance of timing and timelines; (iv) ensuring cost
competitiveness and enabling cost certainty; (v) the ability to incorporate ‘non-building or non-
housing’ outcomes; (vi) ensuring participation in the process and managing expectations; and (vii)
addressing design and building integration, buildability and quality issues.
Recommend further reading relevant to this element includes:
1) Kraatz, J. and N. I. Jayawardana (2018). Procuring social and affordable housing. SBEnrc:
Brisbane, Australia.
3.5 Element 5 – Metrics, indicators and data
The following key issue is highlighted for this element:
1. Using data to help determine/demonstrate the long-term social and economic benefits of
housing and housing policy is crucial.
There are many valuable sources for relevant data and its interpretation (including tools) in Australia.
Some key examples include:
Sustainable Built Environment National Research Centre (SBEnrc) Page 21 of 64SBEnrc P1.61 Mapping the Social and Affordable Housing Network
1. Australian Institute of Health and Welfare (AIHW), Housing Assistance in Australia 2018 -
annual document (Australian Institute of Health and Welfare 2018)
2. AIHW Housing Data Dashboard - https://www.housingdata.gov.au/
3. AIHW National Social Housing Survey - https://www.aihw.gov.au/about-our-data/our-data-
collections/national-social-housing-survey
4. Australian Bureau of Statistics (ABS) Survey of Disability, Ageing and Carers -
https://www.abs.gov.au/ausstats/abs@.nsf/mf/4430.0
5. ABS Housing Occupancy and Costs - https://www.abs.gov.au/ausstats/abs@.nsf/mf/4130.0
6. ABS Socio-Economic Indexes for Areas -
https://www.abs.gov.au/websitedbs/censushome.nsf/home/seifa
7. The Household, Income and Labour Dynamics in Australia (HILDA) Survey - an important
source of longitudinal data gathered from a household-based panel study -
https://melbourneinstitute.unimelb.edu.au/hilda
8. The Australian Social Value Bank is developing an online value calculator tool which uses
cost-benefit analysis to help measure social value https://asvb.com.au/asvb-helps-measure-
social-impact/calculate-social-value-with-asvb/
Two international examples of how data can be effectively used to address the social and economic
benefits of housing include:
1) Wellbeing valuation - key sources internationally include HACT UK -
https://www.hact.org.uk/ and the Organisation for Economic Co-operation and
Development (OECD) - http://www.oecd.org/statistics/measuring-well-being-and-
progress.htm . In the UK, HACT has developed a well-being valuation analysis method which
enables community housing associations to measure the impact of their investment in terms
of well-being. This method addresses the impact of the broader non-housing benefits of
access to safe and secure housing on an average person’s well-being, and places a dollar
value on these benefits.
2) A Living Standards Framework has recently been developed by New Zealand Treasury. This
enables them to determine ‘the likely effects of their policy choices on New Zealanders’ living
standards over time’ through an ‘intergenerational wellbeing approach’ (New Zealand
Treasury).
Recommend further reading relevant to this element includes:
1) Kraatz, J. and G. Thomson (2017). Valuing Social Housing - Final Research Report and
Attachment A. SBEnrc: Brisbane, Australia.
3.6 Element 6 – Labour market dynamics and housing
The following key issues are highlighted for this element:
1. There is a need to better understand housing impacts relating to underemployment and casual
workers; to building a better understanding lived experience in terms of access to housing;
2. Continuity of ‘home’ is needed as people transition from emergency to social housing to better
enable engagement with all aspects of life including employment.
3. A shift in government spending away from tax and benefit incentives that favor
homeownership in favor of tenure-neutral, portable and progressive housing allowances.
The 2017 Australian Housing and Urban Research Institute (AHURI) report Housing tenure, mobility
and labour market behaviour examines issues of geographic mobility, reservation wages5, and job
5
The minimum wage that an unemployed individual finds acceptable (AHURI 2017).
Sustainable Built Environment National Research Centre (SBEnrc) Page 22 of 64SBEnrc P1.61 Mapping the Social and Affordable Housing Network
search behaviour. (Whelan and Parkinson 2017). A 2019 World Bank report on housing mobility notes
that high-productivity jobs are often concentrated in metropolitan areas. With much of household
wealth tied up in immovable assets such as land and housing, this can contribute to wealth inequality
and homeowners being ‘anchored’ to a location independent of its prosperity (Inchauste 2019). This
report makes the following recommendations to improve labour market dynamics and housing:
1) Create enabling conditions to allow the housing supply to expand - suggested measures
include: encouraging new construction or the redevelopment of existing structures by
permitting appropriate floor-space ratios, building heights, and density in specific target zones;
streamline processes to speed up land-use approval and permitting; improving property rights
and the land administration system; and developing governance structures that ensure
efficient coordination mechanisms across financing, urban planning, infrastructure
development, land-use regulation, building codes, delivery and contracting approaches is
critical.
2) Use public finance more strategically – calling on governments to emphasize strategic
investment projects of greenfield housing with transportation links to facilitate travel to the
centres of economic activity.
3) A shift in government spending away from tax and benefit incentives that favour
homeownership in favour of tenure-neutral, portable and progressive housing allowances
would improve redistribution and efficiency.
4) Governments could consider providing housing allowances for targeted groups, such as the
youth, potentially making benefits conditional on job search responsibilities.
5) Improve monitoring and dissemination of housing data and local-level information – through
government providing better information on housing prices, employment, wages, housing
policies and regulations, and other indicators would help to inform policy makers.
Recommend further reading relevant to this element includes:
1) Haffner, M. E. A. and K. Hulse (2019). "A Fresh Look at Contemporary Perspectives on Urban
Housing Affordability." International Journal of Urban Sciences.
2) Mulliner, E., K. Smallbone and V. J. O. Maliene (2013). "An Assessment of Sustainable
Housing Affordability Using a Multiple Criteria Decision Making Method." Science Direct 41
(2): 270-279.
3.7 Element 7 – Changing demographics
The following key issues are highlighted for this element:
1. There is a high degree of awareness across the network of the changing demographics of those
in need of social and affordable housing. Using this knowledge to develop and deliver
innovative policies, assets and services now and into the future is critical.
2. Four key changing demographic issues in Australia include: (i) the population is ageing; (ii)
household composition is changing; (iii) cities are key growth areas; and (iv) home ownership
in Australia is declining.
The 2018 SBEnrc Changing Demographics and Typologies research report highlighted four key
demographic changes occurring in Australia (Kraatz, Baro et al. 2018): (i) the population is aging; (ii)
household composition is changing; (iii) cities are key growth areas; and (iv) home ownership in
Australia is declining. That report noted ‘the changes in demographics identified are largely due to:
longer life expectancy; migration (including of Indigenous households to urban locations); and growing
household diversity (e.g. one person and multigenerational households)’. These general trends are
altering the composition of households, and affecting lifestyles and the demand for appropriate
Sustainable Built Environment National Research Centre (SBEnrc) Page 23 of 64You can also read