Housing Element CITY OF MALIBU 2013-2021
←
→
Page content transcription
If your browser does not render page correctly, please read the page content below
CITY OF
    MALIBU

  2013-2021
Housing Element

       Draft

    October 2013
This page intentionally left blank
City of Malibu 2013-2021 Housing Element

                                                                    Contents
I.     Introduction ................................................................................................................................. I-1
       A.         Purpose of the Housing Element ............................................................................................ I-1
       B.         Public Participation ................................................................................................................... I-2
       C.         Consistency with Other Elements of the General Plan ...................................................... I-2
II.    Housing Needs Assessment ...................................................................................................... II-1
       Population Characteristics ....................................................................................................................II-2
       B.    Household Characteristics .......................................................................................................II-4
       C.    Employment ...............................................................................................................................II-9
       D.    Housing Stock Characteristics.............................................................................................. II-12
       E.    Special Needs ......................................................................................................................... II-16
       F.    Assisted Housing at Risk of Conversion ............................................................................... II-23
       G.    Housing Constructed, Demolished or Converted within the Coastal Zone ............... II-23
       H.    Future Growth Needs............................................................................................................. II-24
III.   Resources and Opportunities ..................................................................................................III-1
       A.         Land Resources......................................................................................................................... III-1
       B.         Financial and Administrative Resources .............................................................................. III-2
       C.         Energy Conservation Opportunities...................................................................................... III-3
IV.    Constraints .................................................................................................................................IV-1
       A.         Governmental Constraints .................................................................................................... IV-1
       B.         Non-Governmental Constraints..........................................................................................IV-21
       C.         Fair Housing............................................................................................................................. IV-24
V.     Housing Plan...............................................................................................................................V-1
       A.         Goals, Objectives, Policies, and Implementation Programs............................................V-1
       B.         Quantified Objectives .............................................................................................................V-8

Appendices
       Appendix A -                 Evaluation of the Previous Housing Element
       Appendix B –                 Land Inventory
       Appendix C –                 Public Participation Summary
       Appendix D –                 List of Acronyms

                                                                              i                                                 Draft | October 2013
City of Malibu 2013-2021 Housing Element
List of Tables
Table II-1 Population Trends 1990-2012 Malibu vs. Los Angeles County ....................................... II-2
Table II-2 Age Distribution Malibu vs. Los Angeles County .............................................................. II-3
Table II-3 Race/Ethnicity .......................................................................................................................... II-4
Table II-4 Household Composition ......................................................................................................... II-5
Table II-5 Household Tenure .................................................................................................................... II-6
Table II-6 Overcrowding .......................................................................................................................... II-7
Table II-7 Median Household Income Los Angeles County and Cities .......................................... II-8
Table II-8 Labor Force Malibu vs. Los Angeles County ...................................................................... II-9
Table II-9 Employment by Occupation .............................................................................................. II-10
Table II-10 2010-2020 Industry Employment Projections Los Angeles-Long Beach-
Glendale Metropolitan Statistical Area ............................................................................ II-11
Table II-11 Job Location for Malibu Residents ..................................................................................... II-12
Table II-12 Housing by Type, 2000-2012 – Malibu vs. Los Angeles County .................................... II-13
Table II-13 Age of Housing Stock by Tenure – Malibu vs. Los Angeles County ............................. II-14
Table II-14 Income Categories and Affordable Housing Costs – Los Angeles County ............... II-15
Table II-15 Persons with Disabilities by Age - Malibu .......................................................................... II-18
Table II-16 Elderly Households by Tenure - Malibu .............................................................................. II-19
Table II-17 Household Size by Tenure - Malibu .................................................................................... II-19
Table II-18 Household Type by Tenure – Malibu .................................................................................. II-20
Table II-19 Emergency Shelters Serving SPA 5 - West Los Angeles .................................................. II-22
Table II-20 Malibu Coastal Zone Housing Units – 1982-2013.............................................................. II-24
Table II-21 Regional Housing Growth Needs ....................................................................................... II-25
Table III-1 Sites Inventory Summary ....................................................................................................... III-1
Table IV-1 Residential Land Use Categories – Malibu General Plan .............................................. IV-1
Table IV-2 Residential Development Standards ................................................................................. IV-3
Table IV-3 Permitted Residential Development by Zoning District.................................................. IV-4
Table IV-4 Residential Parking Requirements .................................................................................... IV-10
Table IV-5 Permit Processing Steps ...................................................................................................... IV-17
Table IV-6 Planning and Development Fees .................................................................................... IV-18
Table IV-7 Planning and Development Fee Example Single-Family Development .................. IV-19
Table IV-8 Planning and Development Fee Example Multi-Family Development .................... IV-19
Table V-1 Quantified Objectives 2013-2021 ........................................................................................ V-8
List of Figures
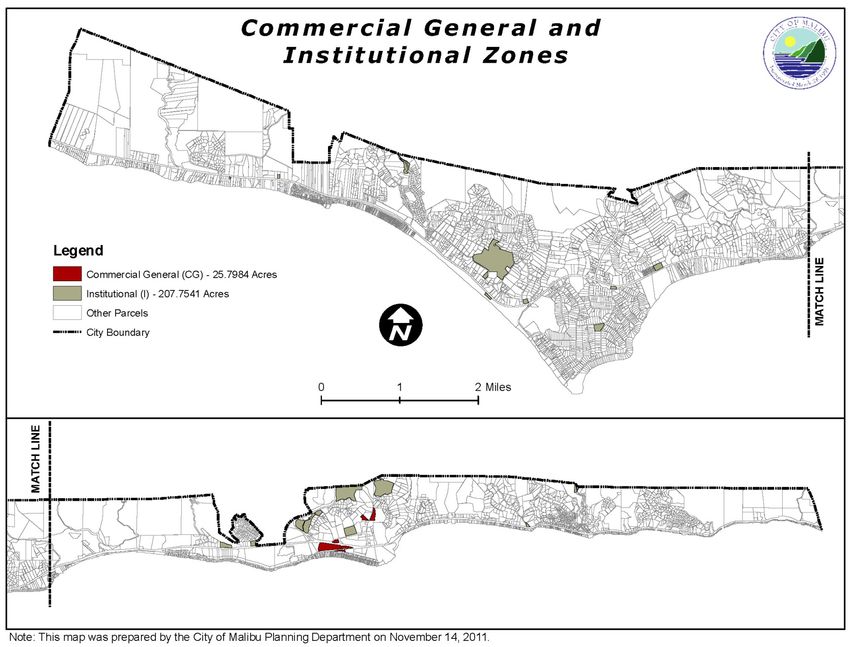
Figure IV-1 Commercial General and Institutional Zones ................................................ IV-9
ii Draft | October 2013City of Malibu 2013-2021 Housing Element I. Introduction
I. INTRODUCTION
State law requires the preparation of a Housing Element (“Element”) as part of a
jurisdiction's General Plan (California Government Code § 65302(c)). The Element is to
consist of an identification and analysis of existing and projected housing needs, and a
statement of goals, policies, quantified objectives and scheduled programs for the
preservation, improvement and development of housing in the City of Malibu (“City”).
The Element shall also identify adequate sites for housing and to make adequate
provision for the existing and projected needs of all economic segments of the
community (§ 65583).
Guidelines adopted by the California Department of Housing and Community Develop-
ment (“HCD”) are also to be considered in the preparation of the Element (§ 65585).
Periodic review of the Element is required to evaluate: (1) the appropriateness of its
goals, objectives and policies in contributing to the attainment of the state housing goal;
(2) the effectiveness in attaining the community’s housing goals and objectives; and
(3) the progress of the City in implementation of the Element(§ 65588).
A. Purpose of the Housing Element
State law recognizes the vital role that local governments play in the supply and
affordability of housing. Each local government in California is required to adopt a
comprehensive, long-term General Plan for the physical development of the city or
county. The Housing Element is one of the seven mandated elements of the General
Plan. Housing Element law, first enacted in 1969, mandates that local governments plan
to meet the existing and projected housing needs of all economic segments of the
community. The law recognizes that, in order for the private market to adequately
address housing needs, local governments must adopt land use plans and regulatory
systems that provide opportunities for, and do not unduly constrain, housing
development. As a result, housing policy in California rests largely upon the effective
implementation of local General Plans and, in particular, local Housing Elements. Housing
Element law also requires that HCD review local housing elements for compliance with
state law and to report its written findings to the local government.
As mandated by state law, the planning period for this Housing Element extends from
2013 to 2021. 1 This Element identifies strategies and programs that focus on: 1) providing
diversity in housing opportunities; and 2) maintenance and preservation of the City’s
housing stock.
The Housing Element consists of the following major components:
• An analysis of the City’s demographic and housing characteristics and trends
(Chapter II);
• An evaluation of land, financial, and administrative resources available to
address the City’s housing goals (Chapter III);
The planning time frame for the Regional Housing Needs Assessment process is from January 2014 through
1
October 2021.
I-1 Draft | October 2013City of Malibu 2013-2021 Housing Element I. Introduction
• A review of potential constraints, both governmental and non-governmental,
to meeting the City’s housing needs (Chapter IV);
• A Housing Plan for the 2013-2021 planning period, including housing goals,
policies, and programs (Chapter V);
• A review of the City’s accomplishments and progress in implementing the
previous Housing Element (Appendix A);
• A detailed inventory of sites suitable for the development of housing
(Appendix B); and
• A summary of the City’s public participation during the preparation and
adoption of this Housing Element (Appendix C).
B. Public Participation
Section 65583(c)(5) of the California Government Code states that “[t]he local
government shall make a diligent effort to achieve public participation of all economic
segments of the community in the development of the housing element, and the
program shall describe this effort.” Public participation played an important role in the
formulation and refinement of the City’s housing goals and policies, and in the develop-
ment of a Land Use Plan that determines the extent and density of future residential
development in the community.
Residents and other stakeholders had many opportunities to review and provide
comments on the Housing Element and related implementation actions. Please refer to
Appendix C for additional information regarding the City’s efforts to encourage public
involvement and how comments and concerns have been addressed.
C. Consistency with Other Elements of the General Plan
The City’s General Plan sets forth broad policy guidance in the areas of land use,
housing, transportation, conservation, open space and recreation, noise, and public
safety. The various General Plan elements provide a consistent set of policies and
programs intended to preserve and enhance the quality of life, while accommodating
growth and change in a proactive manner. For example, residential development
capacities established in the Land Use Element, and constraints to development
identified in the Conservation, Public Safety, and Noise Elements, are reflected in the
Housing Element. This Housing Element builds upon the other General Plan elements and
is consistent with the policies and proposals set forth by the General Plan. As the General
Plan is occasionally amended, the City will review the Housing Element for internal
consistency, and make any necessary revisions.
Senate Bill (SB) 1087 of 2005 2 requires cities to provide a copy of their Housing Element to
local water and sewer providers, and also requires that these agencies provide priority to
2 SB 1087 (Florez) [Stats. 2005, ch. 727].
I-2 Draft | October 2013City of Malibu 2013-2021 Housing Element I. Introduction
affordable housing developers. SB 1087 further prohibits local water and sewer providers
from denying services to affordable housing developers, unless they find that the
capacity is unavailable to all applicants. The Housing Element will be provided to these
agencies immediately upon adoption.
I-3 Draft | October 2013City of Malibu 2013-2021 Housing Element I. Introduction
This page intentionally left blank
I-4 Draft | October 2013City of Malibu 2013-2021 Housing Element II. Housing Needs Assessment
II. HOUSING NEEDS ASSESSMENT
The City of Malibu (“City”) lies within an approximately 21-mile strip of coastline at the
western edge of Los Angeles County (“County”). Malibu is primarily a residential
community consisting of beachfront residential lots and large estate lots in the hillsides
and canyons overlooking the ocean. Some multi-family development and
neighborhood/visitor-serving commercial development is located in the flatter portions
of the City along Highway 1 (Pacific Coast Highway). The City has a highly scenic rural
character that it seeks to preserve. Development within the City is constrained by
numerous land features including steep slopes, environmentally sensitive habitat areas
(ESHA), geologic instability, flood hazards, and extreme wildfire hazards. The entire City
lies within the Coastal Zone as defined by the California Coastal Act of 1976 3. Because of
these constraints, a large portion of the City remains undeveloped and rural in character.
Growth is also limited by the lack of a centralized sewer system.
Since its incorporation in 1991, the City has grown from a population of approximately
11,700 to 12,699 residents in 2012, according to recent Census data. The City is
approximately 19.9 square miles in area and is bounded by unincorporated County to
the west and north, the City of Los Angeles (Pacific Palisades) to the east and the Pacific
Ocean to the south. Further to the east is the City of Santa Monica. The Santa Monica
Mountains National Recreation Area lies just to the north. The City’s population is affluent
with a median household income, according to recent Census data, of $132,926.
Malibu's median household income was significantly higher than that of Los Angeles
County ($56,266) and California as a whole ($61,632).
This chapter examines general population and household characteristics and trends,
such as age, race and ethnicity, employment, household composition and size,
household income, and special needs. Characteristics of the existing housing stock (e.g.,
number of units and type, tenure, age and condition, costs) are also addressed. Finally,
the City’s projected housing growth needs based on the 2014 – 2021 Regional Housing
Needs Assessment (RHNA) are discussed.
The Housing Needs Assessment utilizes the most recent data from the U.S. Census, the
California Department of Finance (DOF), the California Employment Development
Department (EDD), the Southern California Association of Governments (SCAG), and
other relevant sources. Supplemental data were obtained through field surveys and from
private vendors, where appropriate.
California Public Resources Code, Division 20.
3
II-1 Draft | October 2013City of Malibu 2013-2021 Housing Element II. Housing Needs Assessment
Population Characteristics
1. Population Growth Trends
In 1990, the unincorporated community of Malibu had a population of 11,643. The City of
Malibu was incorporated on March 28, 1991. From 1990 to 2000, the population of the
newly incorporated City grew by about 8% to 12,575. From 2000 to 2012 the City’s
population grew by only 124 persons, or one percent compared to almost four percent
for Los Angeles County as a whole (see Table II-1).
Table II-1
Population Trends 1990-2012
Malibu vs. Los Angeles County
Growth Growth
1990 2000 2012
1990-2000 2000-2012
Malibu 11,643 12,575 12,699 8.0% 1.0%
Los Angeles County 8,863,164 9,519,330 9,884,632 7.4% 3.8%
Source: U.S. Census, California Dept. of Finance Table E-5 (2012)
2. Age
Housing needs are influenced by the age characteristics of the population. Different age
groups require different accommodations based on lifestyle, family type, income level,
and housing preference. Table II-2 provides a comparison of the City’s and County’s
population by age group in 2010. This table shows that the age distribution of the City’s
population differs from Los Angeles County as a whole, in that a lower proportion of the
City’s population is 19 years of age or younger (20% in the City versus 28% in the County)
and a higher proportion of the City’s population is 45 years of age and above (55% in the
City versus 36% in the County). The median age of the City’s population is 13 years older
than the median age in the County (47.8 years in the City versus 34.8 years in the
County).
II-2 Draft | October 2013City of Malibu 2013-2021 Housing Element II. Housing Needs Assessment
Table II-2
Age Distribution
Malibu vs. Los Angeles County
Malibu Los Angeles County
Age Group Persons % Persons %
Under 5 years 408 645,793
3% 7%
5 to 9 years 639 5% 633,690 6%
10 to 14 years 778 6% 678,845 7%
15 to 19 years 781 6% 753,630 8%
20 to 24 years 820 6% 752,788 8%
25 to 29 years 443 4% 759,602 8%
30 to 34 years 425 3% 716,129 7%
35 to 39 years 574 5% 715,635 7%
40 to 44 years 849 7% 714,691 7%
45 to 49 years 1,125 9% 706,742 7%
50 to 54 years 1,234 10% 662,205 7%
55 to 59 years 1,142 9% 560,920 6%
60 to 64 years 1,105 9% 452,236 5%
65 to 69 years 718 6% 323,287 3%
70 to 74 years 570 5% 245,183 2%
75 to 79 years 415 3% 192,881 2%
80 to 84 years 314 2% 152,722 2%
85 years and over 305 2% 151,626 2%
9,818,605
Total 12,645 100% 100%
Median age 47.8 34.8
Source: 2010 Census, Table DP-1
3. Race and Ethnicity
The racial and ethnic composition of the City differs from that in the County, in that a
lower proportion of City residents are Hispanic/Latino or other racial minorities.
Approximately 87% of City’s residents are non-Hispanic white, contrasted with 28% for the
County as a whole. The percentage of Hispanics residing in the City, at 6.1%, is
approximately one-eighth that of the percentage of Hispanics residing in the County.
Asians, at 2.6%, represent the largest non-Hispanic minority group in the City (Table II-3).
II-3 Draft | October 2013City of Malibu 2013-2021 Housing Element II. Housing Needs Assessment
Table II-3
Race/Ethnicity
Malibu Los Angeles County
Racial/Ethnic Group Persons % Persons %
Not Hispanic or Latino 11,876 93.9% 5,130,716 52.3%
-White 11,046 87.4% 2,728,321 27.8%
-Black or African American 137 1.1% 815,086 8.3%
-American Indian/Alaska Native 17 0.1% 18,886 0.2%
-Asian 323 2.6% 1,325,671 13.5%
-Native Hawaiian/Pacific Islander 15 0.1% 22,464 0.2%
-Other races or 2+ races 338 2.7% 220,288 2.2%
Hispanic or Latino (any race) 769 6.1% 4,687,889 47.7%
Total 12,645 100.0% 9,818,605 100.0%
Source: 2010 Census, Table DP-1
B. Household Characteristics
1. Household Composition and Size
Household characteristics are important indicators of the type and size of housing
needed in a city. The Census defines a “household” as all persons occupying a housing
unit, which may include single persons living alone, families related through marriage or
blood, or unrelated persons sharing a single unit. Persons in group quarters such as
dormitories, retirement or convalescent homes, or other group living situations are
included in population totals, but are not considered households.
Table II-4 provides a comparison of households by type for the City and County as a
whole, according to recent Census data. Family households comprised approximately
61% of all households in the City, somewhat lower than the County with 68%. Household
composition in the City differs from that of the County with the most significant difference
being non-family households with individuals under 18 years of age (City 26% versus
County 38%). Other less significant differences include non-family households headed by
individuals 65 and older (City 32% versus County 24%) and family households headed by
a female with no husband present (8% City versus 15% County). The City’s average
household size of 2.37 is somewhat lower than the County as a whole (2.98).
II-4 Draft | October 2013City of Malibu 2013-2021 Housing Element II. Housing Needs Assessment
Table II-4
Household Composition
Malibu LA County
Household Type Households % Households %
Family households: 3,196 61% 2,194,080 68%
Husband-wife family 2,571 49% 1,480,665 46%
With own children under 18 years 980 19% 721,804 22%
Male householder, no wife present 222 4% 216,368 7%
With own children under 18 years 112 2% 92,161 3%
Female householder, no husband present 403 8% 497,047 15%
With own children under 18 years 207 4% 239,012 7%
Non-family households: 2,071 39% 1,047,124 32%
Householder living alone 1,498 28% 784,928 24%
Households with individuals under 18 years 1,379 26% 1,220,021 38%
Households with individuals 65 years and
1,711 32% 790,386 24%
over
Total households 5,267 100% 3,241,204 100%
Average household size 2.37 2.98
Source: 2010 Census, Table DP-1
2. Housing Tenure and Vacancy
Housing tenure (owner versus renter) is an important indicator of the housing market.
Communities need an adequate supply of units available both for rent and for sale in
order to accommodate a range of households with varying income, family size and
composition, and lifestyle. Table II-5 provides a comparison of the number of owner-
occupied and renter-occupied units in the City in 2010 as compared to the County as a
whole. It reveals that the level of homeownership for the City (54.1%) is higher than for the
County (44.8%).
This table also shows that the vacancy rate in the City is very high (23%) due to the large
number of second homes.
II-5 Draft | October 2013City of Malibu 2013-2021 Housing Element II. Housing Needs Assessment
Table II-5
Household Tenure
Malibu LA County
Housing Type Units % Units %
Occupied housing units 5,267 76.7% 3,241,204 94.1%
Owner-occupied housing units 3,716 54.1% 1,544,749 44.8%
Average household size of owner-occupied units 2.46 3.16
Renter-occupied housing units 1,551 22.6% 1,696,455 49.2%
Average household size of renter-occupied units 2.17 2.81
Vacant housing units 1,597 23.3% 203,872 5.9%
For rent 212 3.1% 104,960 3.0%
Rented, not occupied 14 0.2% 4,994 0.1%
For sale only 110 1.6% 26,808 0.8%
Sold, not occupied 39 0.6% 6,726 0.2%
For seasonal, recreational, or occasional use 990 14.4% 19,099 0.6%
All other vacants 232 3.4% 41,285 1.2%
Homeowner vacancy rate (%) 2.8 1.7
Rental vacancy rate (%) 11.9 5.8
Total housing units 6,864 100% 3,445,076 100%
Source: 2010 Census, Table DP-1
3. Overcrowding
Overcrowding is often closely related to household income and the cost of housing. The
U.S. Census Bureau considers a household to be overcrowded when there is more than
one person per room, excluding bathrooms and kitchens, with severe overcrowding
when there are more than 1.5 occupants per room. Table II-6 summarizes overcrowding
for the City of Malibu.
II-6 Draft | October 2013City of Malibu 2013-2021 Housing Element II. Housing Needs Assessment
Table II-6
Overcrowding
Malibu LA County
Occupants per Room Units % Units %
Owner occupied units 3,340 100% 1,552,091 100%
1.01 to 1.50 14 0.4% 71,920 4.6%
1.51 to 2.00 0 0% 17,241 1.1%
2.01 or more 0 0% 4,877 0.3%
Renter occupied units 1,333 100% 1,665,798 100%
1.01 to 1.50 13 1.0% 163,166 9.8%
1.51 to 2.00 0 0% 86,760 5.2%
2.01 or more 0 0% 43,489 2.6%
Source: Census 2006-2010 ACS, Table B25014
According to recent Census data, overall overcrowding in the City was substantially
lower than in the County as a whole (1.4% occupied units in the City versus 23.6%
occupied units in the County). In the City, overcrowding was more prevalent among
renter-occupied units than for owner-occupied units. Approximately 1% of the City’s
renter-occupied households were overcrowded, compared to only .4% of owner-
occupied households. The relatively high cost of housing in Malibu is the primary cause of
overcrowding. Several programs in the Housing Plan (Chapter V) that are designed to
address housing affordability will also help to alleviate overcrowding. These programs
include: Program 1.1 – Code Enforcement; Program 1.3 – Housing Rehabilitation
Assistance; Program 1.4 – Preserve Existing Mobile Home Parks; Program 1.5 – Conserve
Affordable Housing in the Coastal Zone; Program 2.2 – Ensure Adequate Capacity to
Accommodate Housing Needs; Program 2.3 – Encourage Mixed-Use and Adaptive
Reuse Development in Appropriate Locations; Program 2.2A – Second Units; Program 2.3
– Streamline Development Review and Assist Affordable Housing Developments; and
Program 3.3 – Provide Financial Support and Referral Information to Persons in Need of
Assistance.
4. Household Income
Household income is a primary factor affecting housing needs in a community.
According to recent Census data, the median household income in the City was
$132,926, approximately 226% higher than the County median income of $56,266 (Table
II-7).
II-7 Draft | October 2013City of Malibu 2013-2021 Housing Element II. Housing Needs Assessment
Table II-7
Median Household Income
Los Angeles County and Cities
% of County
Median
Jurisdiction Median
Income
Income
Malibu $132,926 236%
Los Angeles County $56,266 100%
Source: U.S. Census, 2006-2010 ACS, Table DP-3
5. Overpayment
According to state housing policy, overpaying occurs when housing costs exceed 30% of
gross household income. According to SCAG, 46% of all renter households and 42% of all
owner households in the City were overpaying for housing.
Although homeowners enjoy income and property tax deductions and other benefits
that help to compensate for high housing costs, lower-income homeowners may need to
defer maintenance or repairs due to limited funds, which can lead to deterioration. For
lower-income renters, severe cost burden can require families to double up resulting in
overcrowding.
The relatively high cost of housing in Malibu is the primary cause of overpayment for
lower-income households. Several programs in the Housing Plan designed to address
housing affordability will also help to alleviate overpayment. These programs include
Program 1.1 – Code Enforcement; Program 1.3 – Rehabilitation Assistance; Program 1.4 –
Preserve Existing Mobile Home Parks; Program 1.5 – Conserve Affordable Housing in the
Coastal Zone; Program 2.2 – Ensure Adequate Capacity to Accommodate Housing
Needs; Program 2.2A – Second Units; Program 2.3 – Streamline Development Review and
Assist Affordable Housing Development; and Program 3.3 – Provide Financial Support and
Referral Information to Persons in Need of Assistance.
a. Extremely Low Income Households
State law requires quantification and analysis of existing and projected housing needs of
extremely-low-income (ELI) households. ELI is defined as households with income less
than 30% of area median income. The 2013 area median income for the County was
$64,800 (see Table II-14). For ELI households, this results in an income of $25,600 or less for
a four-person household. Households with extremely low incomes have a variety of
housing problems and needs.
Existing Needs
According to ACS data reported by SCAG, approximately 342 ELI households resided in
the City, representing 6.3% of the total households.
II-8 Draft | October 2013City of Malibu 2013-2021 Housing Element II. Housing Needs Assessment
Projected Needs
The projected housing need for ELI households is assumed to be 50% of the very-low-
income regional housing need of 1 unit. As a result, the City has a projected need for 1
ELI unit. The resources and programs to address this need are the same as for low-income
housing in general and are discussed throughout the Housing Element, including the
Housing Plan. Because the needs of ELI households overlap extensively with other special
needs groups, further analysis and resources for ELI households can be found in Chapter
II. Needs Assessment, Section E., Special Needs and Chapter IV. Constraints, Section A.d.,
Special Needs Housing.
C. Employment
Employment is an important factor affecting housing needs within a community. The jobs
available in each employment sector and the wages for these jobs affect the type and
size of housing residents can afford.
1. Current Employment
Current employment and projected job growth have a significant influence on housing
needs during this planning period. Table II-8 shows that the City had a workforce of 6,173
persons, or 58% of the working-age population, according to recent Census data. The
table shows that the characteristics of the City’s working population are generally similar
to those countywide with a slightly lower proportion of the working-age population in the
labor force (58% City versus 65.2% County). Approximately 42% of City residents were not
in the labor force.
Table II-8
Labor Force Malibu vs. Los Angeles County
Malibu LA County
Labor Force Status Persons % Persons %
Population 16 years and over 10,639 100% 7,602,252 100%
In labor force 6,173 58.0% 4,959,167 65.2%
Civilian labor force 6,163 57.9% 4,953,791 65.2%
Employed 5,741 54.0% 4,522,917 59.5%
Unemployed 422 4.0% 430,874 5.7%
Armed Forces 10 0.1% 5,376 0.1%
Not in labor force 4,466 42.0% 2,643,085 34.8%
Source: Census 2006-2010 ACS, Table DP3
According to recent Census data, approximately 61.7% of the City’s working residents
were employed in management and professional occupations (Table II-9). A significant
percentage of workers (22.6%) were employed in sales and office-related occupations.
A relatively low percentage of workers (11.1%) were employed in service-related
occupations such as waiters, waitresses, and beauticians. Blue collar occupations such
II-9 Draft | October 2013City of Malibu 2013-2021 Housing Element II. Housing Needs Assessment
as machine operators, assemblers, farming, transportation, handlers, and laborers
constituted 4.6% of the workforce.
Table II-9
Employment by Occupation
Malibu
Occupation Persons %
Civilian employed population 16 years and over 5,741 100%
Management, business, science, and arts occupations 3,542 61.7%
Service occupations 640 11.1%
Sales and office occupations 1,296 22.6%
Natural resources, construction, and maintenance occupations 154 2.7%
Production, transportation, and material moving occupations 109 1.9%
Source: U.S. Census 2006-2010 ACS, Table DP3
In a high-cost area like Malibu second units provide an important option for low-wage
workers, including household employees. Program 2.2 in the Housing Plan describes the
City’s strategy for expanding the availability of second units.
2. Projected Job Growth
Future housing needs are affected by the number and type of new jobs created during
this planning period. Table II-10 shows projected job growth by industry for the Los
Angeles-Long Beach-Glendale Metropolitan Statistical Area (Los Angeles County) for the
period 2010-2020. Total employment in Los Angeles County is expected to grow by 15.5%
during this time period. The overall growth is expected to add about 658,000 new jobs
and bring the employment of Los Angeles County to about 4.9 million by 2020.
Generally, residents who are employed in well-paying occupations have less difficulty
obtaining adequate housing than residents in low-paying occupations.
II-10 Draft | October 2013City of Malibu 2013-2021 Housing Element II. Housing Needs Assessment
Table II-10
2010-2020 Industry Employment Projections
Los Angeles-Long Beach-Glendale Metropolitan Statistical Area
Annual Average
NAICS Employment Employment Change
Code Industry Title 2010 2020 Numerical Percent
Total Employment 4,246,700 4,904,300 657,600 15.5
Self-Employment (A) 337,500 366,900 29,400 8.7
Unpaid Family Workers (B) 3,300 3,400 100 3.0
Private Household Workers (C) 126,600 163,300 36,700 29.0
Total Farm 6,200 5,800 -400 -6.5
Total Nonfarm 3,773,100 4,364,900 591,800 15.7
1133,21 Mining and Logging 4,100 4,500 400 9.8
23 Construction 104,500 129,600 25,100 24.0
31-33 Manufacturing 373,200 362,500 -10,700 -2.9
22,42-49 Trade, Transportation, and Utilities 739,800 887,700 147,900 20.0
51 Information 191,500 211,700 20,200 10.5
52-53 Financial Activities 209,500 231,300 21,800 10.4
54-56 Professional and Business Services 527,500 640,600 113,100 21.4
61-62 Educational Services, Health Care and Social Assistance 522,000 660,000 138,000 26.4
71-72 Leisure and Hospitality 384,800 480,000 95,200 24.7
81 Other Services (excludes 814-Private Household Workers) 136,700 150,700 14,000 10.2
Government 579,600 606,300 26,700 4.6
Federal Government (D) 51,600 43,900 -7,700 -14.9
State and Local Government 528,000 562,400 34,400 6.5
State Government 80,700 88,100 7,400 9.2
Local Government 447,300 474,300 27,000 6.0
Data sources: U.S. Bureau of Labor Statistics' Current Employment Statistics (CES) March 2011 benchmark and Quarterly Census of Employment and
Wages (QCEW) industry employment.
Industry detail may not add up to totals due to independent rounding.
Notes
1. Self-Employed persons work for profit or fees in their own business, profession, trade, or farm. Only the unincorporated self-employed are included in
this category. The estimated and projected employment numbers include all workers who are primarily self-employed and wage and salary workers who
hold a secondary job as a self-employed worker.
2. Unpaid family workers are those persons who work without pay for 15 or more hours per week on a farm or in a business operated by a member of the
household to whom they are related by birth or marriage.
3. Private household workers are employed as domestic workers whose primary activities are to maintain the household. Industry employment is based on
QCEW.
4. Temporary U.S. Census workers are included in the base and projected year employment numbers.
3. Jobs-Housing Balance
A regional balance of jobs to housing helps to ensure that the demand for housing is
reasonably related to supply. When the number of jobs significantly exceeds the housing
supply, the rental and for-sale housing markets may become overheated, requiring
households to pay a larger percentage of their income for housing. In addition, a tight
housing market can result in overcrowding and longer commute times as workers seek
more affordable housing in outlying areas. The current jobs-housing objective within the
SCAG region is one new housing unit for every 1.5 jobs. 4
SCAG Draft 2007 Regional Comprehensive Plan, Land Use & Housing Chapter
4
II-11 Draft | October 2013City of Malibu 2013-2021 Housing Element II. Housing Needs Assessment
According to recent Census data, 96% of employed City residents worked in Los Angeles
County, and approximately 40.4% of all workers were employed within the City limits
(Table II-11).
Table II-11
Job Location for Malibu Residents
Workplace Location %
Worked in state of residence 99.8%
Worked in county of residence 96.0%
Worked in place of residence 40.4%
Worked outside county of residence 3.7%
Worked outside state of residence 0.2%
Source: Census 2006-2010 ACS, Table S0801
D. Housing Stock Characteristics
This section presents an evaluation of the characteristics of the community’s housing
stock and helps in identifying and prioritizing needs. The factors evaluated include the
number and type of housing units, recent growth trends, age and condition, tenure,
vacancy, housing costs, affordability, and assisted affordable units at-risk of loss due to
conversion to market-rate. A housing unit is defined as a house, apartment, mobile
home, or group of rooms, occupied as separate living quarters or, if vacant, intended for
occupancy as separate living quarters.
1. Housing Type and Growth Trends
According to recent Census data, the housing stock in the City was comprised mostly of
single-family detached homes, which made up about 78% of all units, while multi-family
units comprised about 15% of the total. Mobile home units comprised about 8% of the
total. Table II-12 provides a breakdown of the housing stock by type along with growth
trends for the City compared to the County as a whole for the period from 2000 to 2012.
Second units provide an important source of housing for lower-income persons in Malibu.
A discussion of second unit production and affordability is presented in Appendix B.
Program 2.2 in the Housing Plan describes the City’s strategy for expanding the
availability of second units.
II-12 Draft | October 2013City of Malibu 2013-2021 Housing Element II. Housing Needs Assessment
Table II-12
Housing by Type, 2000-2012 –
Malibu vs. Los Angeles County
2000 2012 Growth
Structure Type
Units % Units % Units %
Malibu
Single-family 4,294 70% 5,327 78% 1,033 139.2%
Multi-family 1,222 20% 1,000 15% -222 -29.9%
Mobile homes 610 10.0% 541 7.9% -69 -9.3%
Total units 6,126 100% 6,868 100% 742 100%
Los Angeles County
Single-family 1,835,024 56% 1,947,820 56% 112,796 61.6%
Multi-family 1,379,277 42% 1,447,958 42% 68,681 37.5%
Mobile homes 56,605 2% 58,314 2% 1,709 0.9%
Total units 3,270,906 100% 3,454,092 100% 183,186 100%
Source: Cal. Dept. of Finance, Tables E-5 & E-8
Between 2000 and 2012, only single-family detached homes were added to the City’s
housing stock (second units are not reported in these data). The number of multi-family
units and mobile homes in the City were reduced during that same period by 29.9% and
9.3%, respectively. Approximately 61.6% of new residential units in the County as a whole
were single family units and 35.7% were multi-family units.
2. Housing Age and Conditions
Housing age is often an important indicator of housing condition. Housing units built prior
to 1978, before stringent limits on the amount of lead in paint were imposed may have
interior or exterior building components coated with lead-based paint. Housing units built
before 1970 are the most likely to need rehabilitation and to have deteriorated lead-
based paint. Table II-14 shows the age distribution of the housing stock in the City
compared to the County as a whole.
This table shows that about 44% of the units in the City were constructed prior to 1970.
The fact that a significant percentage of the City’s housing stock is more than 30 years
old suggests that there may be some need for rehabilitation, which is typical of most
jurisdictions in Southern California.
II-13 Draft | October 2013City of Malibu 2013-2021 Housing Element II. Housing Needs Assessment
Table II-13
Age of Housing Stock by Tenure –
Malibu vs. Los Angeles County
Malibu LA County
Year Built Units % Units %
Built 2005 or later 138 2% 54,241 2%
Built 2000 to 2004 271 4% 109,255 3%
Built 1990 to 1999 567 9% 208,791 6%
Built 1980 to 1989 993 16% 403,248 12%
Built 1970 to 1979 1,498 24% 496,376 14%
Built 1960 to 1969 1,207 19% 518,500 15%
Built 1950 to 1959 868 14% 722,473 21%
Built 1940 to 1949 435 7% 396,035 12%
Built 1939 or earlier 275 4% 516,817 15%
Total units 6,252 100% 3,425,736 100%
Source: Census 2006-2010 ACS, Table DP-4
In general, the quality of housing is exceptional in the City. At a minimum, most dwelling
units are well-maintained, especially with respect to the harsh environmental conditions
that they are subject to. There are areas where older housing units exist, such as along
Pacific Coast Highway in the eastern portion of the City. However, even these units are
maintained given their economic value. It is estimated that about 2% of the housing units
within the City are in need of minor repair, and two are in need of major structural repair
or replacement due to landslides.
A goal of the City’s Building & Safety Division as well as Code Enforcement staff is to
address housing concerns before they become serious problems. Staff has helped to
reduce structural deterioration by identifying problems and informing residents of
programs to assist with improvements. In addition, the City addresses issues related to
lead-based paint and asbestos removal through adding standard conditions of approval
to include Best Management Practices for all projects that include the demolition or
remodeling of older structures.
3. Housing Cost
a. Housing Affordability Criteria
State law establishes five income categories for purposes of housing programs based on
the County’s area median income (“AMI”): extremely-low (30% or less of AMI), very-low
(31-50% of AMI), low (51-80% of AMI), moderate (81-120% of AMI) and above-moderate
(over 120% of AMI). Housing affordability is based on the relationship between household
income and housing expenses. According to the U.S. Department of Housing and Urban
Development (“HUD”) and the California Department of Housing and Community
II-14 Draft | October 2013City of Malibu 2013-2021 Housing Element II. Housing Needs Assessment
Development (“HCD”) 5, housing is considered “affordable” if the monthly payment is no
more than 30% of a household’s gross income. In some areas (such as Los Angeles
County), these income limits may be increased to adjust for high housing costs.
Table II-14 shows affordable rent levels and estimated affordable purchase prices for
housing in the City (and County) 6 by income category. Based on state-adopted
standards, the maximum affordable monthly rent for extremely-low-income households is
$640, while the maximum affordable rent for very-low-income households is $1,068. The
maximum affordable rent for low-income households is $1,708, while the maximum for
moderate-income households is $1,944.
Maximum purchase prices are more difficult to determine due to variations in mortgage
interest rates and qualifying procedures, down payments, special tax assessments,
homeowner association fees, property insurance rates, etc. With this caveat, the
maximum home purchase prices by income category shown in Table II-14 have been
estimated based on typical conditions.
Table II-14
Income Categories and Affordable Housing Costs –
Los Angeles County
2013 County Median Income = $64,800 Income Limits Affordable Rent Affordable Price (est.)
Extremely Low (City of Malibu 2013-2021 Housing Element II. Housing Needs Assessment
c. Rental Housing
A recent survey of rental housing units in the City 8 found that rents ranged from $3,675 to
over $5,000 per month. When market rents are compared to the amounts that low-
income households can afford to pay (Table II-14), it is clear that it is not possible for low-
income households to find market-rate rental housing without overpaying.
E. Special Needs
Certain groups have greater difficulty in finding decent, affordable housing due to
special circumstances. Such circumstances may be related to one’s employment and
income, family characteristics, disability, or other conditions. As a result, some of the
City’s residents may experience a higher prevalence of overpayment, overcrowding, or
other housing problems.
State Housing Element law defines “special needs” groups to include persons with
disabilities, the elderly, large households, female-headed households, homeless people,
and farmworkers. This section contains a discussion of the housing needs facing each of
these groups.
1. Persons with Disabilities
The most recent available Census data reported that the City had approximately 605
people between 16 and 64 years of age, or about 7% of the working age population,
who reported a work-related disability (Table II-15). Of those aged 65 and above, 299
(about 17.5%) reported some form of physical disability. Reported disabilities included
persons whose disability hinders their ability to go outside the home (1.7% of the working
age population and 10.2% of the senior population). Housing opportunities for the
handicapped can be maximized through housing assistance programs and providing
universal design features such as widened doorways, ramps, lowered countertops, single-
level units and ground floor units. During the previous planning period an ordinance
establishing procedures to ensure reasonable accommodation for persons with
disabilities was adopted pursuant to SB 520. 9
Developmentally Disabled
As defined by federal law, “developmental disability” means a severe, chronic disability
of an individual that:
• Is attributable to a mental or physical impairment or combination of mental
and physical impairments;
• Is manifested before the individual attains age 22;
• Is likely to continue indefinitely;
http://www.forrent.com/search-apartments-by-area/CA/Greater-Los-Angeles/West-LA/Malibu.php
8
Senate Bill 520 (Chesbro) [Stats. 2001, ch. 671]
9
II-16 Draft | October 2013City of Malibu 2013-2021 Housing Element II. Housing Needs Assessment
• Results in substantial functional limitations in three or more of the following
areas of major life activity: a) self-care; b) receptive and expressive language;
c) learning; d) mobility; e) self-direction; f) capacity for independent living; or
g) economic self-sufficiency;
• Reflects the individual’s need for a combination and sequence of special,
interdisciplinary, or generic services, individualized supports, or other forms of
assistance that are of lifelong or extended duration and are individually
planned and coordinated.
The Census does not record developmental disabilities as a separate category of
disability. According to the U.S. Administration on Developmental Disabilities, an
accepted estimate of the percentage of the population that can be defined as
developmentally disabled is 1.5 percent. Many developmentally disabled persons can
live and work independently within a conventional housing environment. More severely
disabled individuals require a group living environment where supervision is provided. The
most severely affected individuals may require an institutional environment where
medical attention and physical therapy are provided. Because developmental
disabilities exist before adulthood, the first issue in supportive housing for the
developmentally disabled is the transition from the person’s living situation as a child to
an appropriate level of independence as an adult.
The California Department of Developmental Services (DDS) currently provides
community-based services to approximately 243,000 persons with developmental
disabilities and their families through a statewide system of 21 regional centers, four
developmental centers, and two community-based facilities. The Westside Regional
Center (WRC) located in Culver City (http://www.westsiderc.org/) provides services for
people with developmental disabilities in Malibu. The WRC is a private, non-profit
community agency that contracts with local businesses to offer a wide range of services
to individuals with developmental disabilities and their families.
There is no charge for diagnosis and assessment for eligibility. Once eligibility is
determined, most services are free regardless of age or income. There is a requirement
for parents to share the cost of 24-hour out-of-home placements for children under age
18. This share depends on the parents' ability to pay. There may also be a co-payment
requirement for other selected services.
Regional centers are required by law to provide services in the most cost-effective way
possible. They must use all other resources, including generic resources, before using any
regional center funds. A generic resource is a service provided by an agency that has a
legal responsibility to provide services to the general public and receives public funds for
providing those services. Some generic agencies may include the local school district,
county social services department, Medi-Cal, Social Security Administration, Department
of Rehabilitation and others. Other resources may include natural supports. This is help
that disabled persons may get from family, friends or others at little or no cost. According
to the latest WRC Performance Report 10, the Center served approximately 7,100
individuals during 2010.
10
http://www.westsiderc.org/s/WRC%20Performance%20Contract%20Year%20End%20Report%20For%202010.pdf
II-17 Draft | October 2013City of Malibu 2013-2021 Housing Element II. Housing Needs Assessment
In addition to the services provided by the WRC, City housing programs that respond to
the needs of this population include 1d (Emergency Shelters and Transitional/Supportive
Housing) and 3a (Section 8 Rental Assistance).
Table II-15
Persons with Disabilities by Age - Malibu
Disability by Age Disabilities Percent
Age 5 to 15 - total persons* 1,710 persons --
Sensory disability 0 0.0%
Physical disability 10 0.6%
Mental disability 21 1.2%
Self-care disability 0 0.0%
Age 16 to 64 - total persons* 8,550 persons --
Sensory disability 54 0.6%
Physical disability 220 2.6%
Mental disability 154 1.8%
Self-care disability 28 0.3%
Go-outside-the-home disability 144 1.7%
Employment disability 605 7.0%
Age 65 and over* - total persons* 1,711 persons --
Sensory disability 166 9.7%
Physical disability 299 17.5%
Mental disability 111 6.5%
Self-care disability 83 4.9%
Go-outside-the-home disability 174 10.2%
*Numbers in shaded rows represent persons, not disabilities. Persons may report more
than one disability.
Source: 2000 Census, SF3 Tables P8 and P41
2. Elderly
According to recent Census data, there were 1,272 households in the City where the
property owner was 65 or older (Table II-16). Many elderly persons are dependent on
fixed incomes or have disabilities. Elderly homeowners may be physically unable to
maintain their homes or cope with living alone. The housing needs of this group can be
addressed through smaller units, second units on lots with existing homes, shared living
arrangements, congregate housing, and housing assistance programs.
Second units provide an important source of housing for elderly family members as an
alternative to institutional facilities (see Housing Plan, Program 2.2).
II-18 Draft | October 2013City of Malibu 2013-2021 Housing Element II. Housing Needs Assessment
Table II-16
Elderly Households by Tenure - Malibu
Owner Renter
Householder Age Households % Households %
Under 65 years 2,220 66% 1,181 89%
65 to 74 years 470 14% 104 8%
75 to 84 years 416 12% 48 4%
85 years and over 234 7% 0 0%
Total Households 3,340 100% 1,333 100%
Source: U.S. Census 2006-2010 ACS, Table B25007
3. Large Households
Large households are defined as those with five or more members. Approximately 65% of
owner households and 70% of renter households in the City have only one or two
members. About 7% of renter households have five or more members, while about 6% of
owners were large households (Table II-17). This distribution indicates that the need for
large units with four or more bedrooms is expected to be significantly less than for smaller
units. The City responds to the needs of large households through participation in the
County’s Section 8 program and other housing assistance programs (see Housing Plan
Program 3.3).
Table II-17
Household Size by Tenure - Malibu
Owner Renter
Householder Age Households % Households %
1 person 740 22% 595 45%
2 persons 1,425 43% 327 25%
3 persons 432 13% 158 12%
4 persons 528 16% 155 12%
5 persons 167 5% 82 6%
6 persons 45 1% 0 0%
7 persons or more 3 0% 16 1%
Total Households 3,340 100% 1,333 100%
Source: U.S. Census 2006-2010 ACS, Table B25009
II-19 Draft | October 2013City of Malibu 2013-2021 Housing Element II. Housing Needs Assessment
4. Female-Headed Households
Of the 4,673 households in the City, 6.4% or 297 households were headed by a female
(Table II-18). While female-headed households represent a small portion of households,
8.1% of these households were below the poverty level 11. The City responds to the needs
of female-headed households through the following: Housing Plan Program 1.1 – Code
Enforcement; Program 1.3 – Housing Rehabilitation Assistance; Program 1.4 – Preserve
Existing Mobile Home Parks; Program 1.5 – Conserve Affordable Housing in the Coastal
Zone; Program 2.2 – Ensure Adequate Capacity to Accommodate Housing Needs;
Program 2.3 – Encourage Mixed-Use and Adaptive Reuse Development; Program 2.2A –
Second Units; Program 2.7 – Streamline Development Review and Assist Affordable
Housing Development; and Program 3.3 – Provide Financial Support and Referral
Information to Persons in Need of Assistance.
Table II-18
Household Type by Tenure – Malibu
Owner Renter
Household Type Households % Households %
Married couple family 2,256 68% 466 35%
Male householder, no wife present 49 1% 12 1%
Female householder, no husband present 185 6% 112 8%
Non-family households 850 25% 743 56%
Total Households 3,340 100% 1,333 100%
Source: U.S. Census 2006-2010 ACS, Table B11012
5. Farmworkers
Farmworkers are traditionally defined as persons whose primary income is from seasonal
agricultural work. Farming activities in the City are limited horticultural activities on
approximately 25 acres of land scattered throughout the City. For example, there are
two nurseries located west of Trancas Canyon, two orchards located north of Point
Dume, one nursery located just west of Pepperdine University, and two nurseries and two
orchards located in the Civic Center area. These horticultural activities are not a
significant source of employment and do not generate a demand for permanent onsite
farm worker housing.
Recent Census estimates published by SCAG reported about 4,573 persons employed in
agricultural occupations living in Los Angeles County, with none reporting Malibu as their
place of residence.
2000 Census, SF3 Table DP-3
11
II-20 Draft | October 2013City of Malibu 2013-2021 Housing Element II. Housing Needs Assessment
6. Homeless Persons
Throughout the country, homelessness has become an increasing problem. Factors
contributing to the rise in homelessness include the general lack of housing affordable to
lower-income persons, increases in the number of persons whose incomes fall below the
poverty level, reductions in public assistance for the poor, and the de-institutionalization
of the mentally ill.
The McKinney-Vento Homeless Assistance Act of 1986 12 defines a "homeless" person as
an individual who lacks a fixed, regular, and adequate nighttime residence, or an
individual whose primary nighttime residence is:
1. A supervised publicly or privately operated shelter designed to provide
temporary living accommodations;
2. An institution that provides a temporary residence for individuals intended to
be institutionalized; or
3. A public or private place not designed for, or ordinarily used as, regular
sleeping accommodations for human beings.
Federal agencies, such as the U.S. Department of Housing and Urban Development
(HUD), interprets the McKinney-Vento definition to include only those persons who are on
the streets or in shelters and persons who face imminent eviction (within a week) from a
private dwelling or institution and who have no subsequent residence or resources to
obtain housing. 13
People are also at risk of homelessness when they experience a sudden drop in income
or a rise in housing costs, and/or they do not have the skills necessary to manage their
limited resources. According to the National Coalition for the Homeless (NCH), most
individuals at risk of homelessness are on a fixed income or are marginally employed and
have few ties to family and friends.
The 2008-2013 Los Angeles County Consolidated Plan 14 estimated that there may be 71
homeless persons in the City. In 2009, information regarding the estimated number of
homeless in the city was obtained from the Malibu Police Services Division of the Los
Angeles County Sheriff’s Department (LACSD). LACSD estimates there are perhaps 25
homeless individuals living in the undeveloped hillside areas and other vacant or isolated
areas of the City. While there are no homeless facilities within the City, the homeless can
be found in public parks and near public restroom facilities. This LACSD figure is
considered to be a more accurate assessment. Recent Census estimates published by
SCAG reported no homeless persons in Malibu.
The needs of the homeless vary by subpopulation. Mentally ill persons require housing
supported by mental health care and counseling. Alcohol and drug abusers require
treatment facilities and medical and social support services. Victims of domestic
violence need shelter and social services to assist in the transition to independent living.
Runaway and recently emancipated youths require shelter, combined with counseling
42 U.S.C. Sections 11301, et seq.
12
“Who is Homeless?” 2009. Published by the National Coalition for the Homeless, July 2009. p. 1.
13
Los Angeles Urban County Five-Year Consolidated Plan, Table VI.2, May 28, 2008
14
II-21 Draft | October 2013You can also read