URBAN, RURAL, & NORTHERN INDIGENOUS HOUSING - Canadian ...
←
→
Page content transcription
If your browser does not render page correctly, please read the page content below
URBAN, RURAL, & NORTHERN
     INDIGENOUS HOUSING
                                                             The Next Step

Prepared for the Canadian Housing and Renewal Association

                                                                              Abstract
                    A summary of housing provider’s views of Indigenous housing and the
         importance of Indigenous leadership and control of social and affordable housing.

                                     Prepared by Daniel J. Brant & Catherine Irwin-Gibson
                                                                                April 2019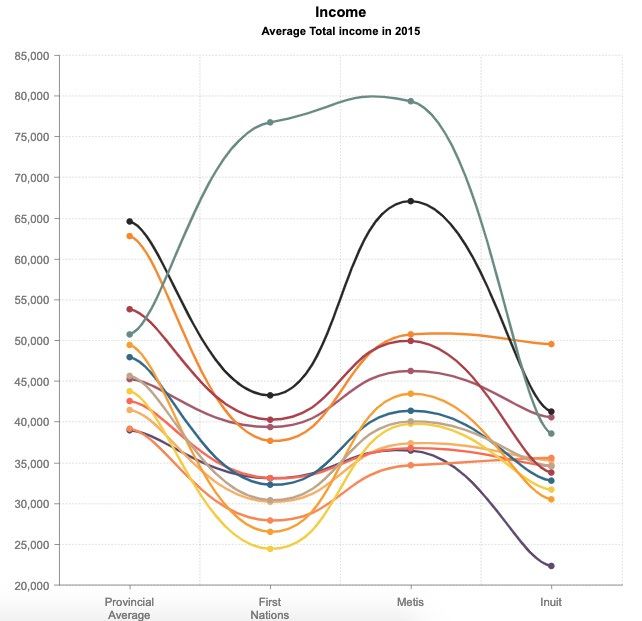
Note to the Reader on Nomenclature ............................................................................................ 2
Executive Summary......................................................................................................................... 3
Résumé à l’intention de la haute direction .................................................................................... 5
A Contextual Background of Urban, Rural, and Northern Housing ................................................ 7
   The Genesis of “Indian Urbanization” ........................................................................................ 7
   Socio-economic Conditions....................................................................................................... 10
Research Design ............................................................................................................................ 11
Demographics ............................................................................................................................... 12
   The Youth Factor ....................................................................................................................... 13
   Income ...................................................................................................................................... 15
   Education .................................................................................................................................. 17
Survey Results ............................................................................................................................... 18
   Section A: General Organizational Structure ............................................................................ 19
   Section B: Infrastructure Inventory .......................................................................................... 21
   Section C: Maintenance and Repairs ........................................................................................ 21
   Section D: Tenants .................................................................................................................... 24
   Section E: Finance and Business .............................................................................................. 27
   Section F: Support Mechanisms ............................................................................................... 29
   Section G: Future Needs ........................................................................................................... 30
Discussion of Interview Findings................................................................................................... 31
   Government Policies and Applications/Practices ..................................................................... 31
   Potential Partnerships .............................................................................................................. 35
   Economic and Social Effects of Indigenous Housing ................................................................ 37
   Organizational leadership and operational management ........................................................ 39
   Infrastructure and Maintenance............................................................................................... 41
   Meeting the needs of users/primary stakeholders .................................................................. 42
   Territorial Housing – A very different environment ................................................................. 44
Comments from the interviews .................................................................................................... 46
Analysis and Areas of Investigation .............................................................................................. 46
   Growing youth population ........................................................................................................ 46
   Gender Gaps ............................................................................................................................. 47
   Management of the Service Providers ..................................................................................... 48
   Previous Evaluation Conclusions .............................................................................................. 49

_______________                                                                                                                                  1
Urban, Rural, and Northern Indigenous Housing: The Next Step
Promising Models ......................................................................................................................... 50
   Transition from homelessness to housing – Extremely deep core, hardest to house. ............ 50
   Partnerships with Other Social Services ................................................................................... 51
   Diversifying Portfolios ............................................................................................................... 52
   Utilizing Equity in Indigenous Housing Organizations .............................................................. 52
   Home Ownership Possibilities .................................................................................................. 53
A “For Indigenous, By Indigenous” (FIBI) Organization ................................................................ 54
Recommendations ........................................................................................................................ 57
Conclusion ..................................................................................................................................... 61
Appendix A – Survey Instrument .................................................................................................. 63
Appendix B – Interview Guide for Selected Housing providers.................................................... 74

This research was funded by Indigenous Services Canada (ISC) and by Canada Mortgage and
Housing Corporation (CMHC), however, the views expressed are the personal views of the
authors and neither CMHC nor ISC accept responsibility for them.

Note to the Reader on Nomenclature
Throughout the report, there are many attributions to Indigenous peoples. The nomenclature
used relates to the timeframe in which the references are being made. For instance, the term
“Indian” is used in many cases as this was the term used up until the mid 2000s, and still to this
day in some cases. ‘Native’ is used infrequently but the term is still used in some formal
organizations.

Indigenous is the generalized term that is commonly accepted at this time when referring to
the original peoples of this land and the terms most accepted by the three Indigenous groups in
Canada is First Nations, Métis and Inuit. In this report, we have tried to use Indigenous given
the large majority of housing providers serve all three groups in a status-blind manner.

The term used by the federal government is changed a number of times but refers to the same
group(s) of Indigenous peoples. The department of Indian and Northern Development was the
name of the federal government department with the responsibilities of administrating the
“Indian Act”. The name of this department changed to Aboriginal Affairs and Northern
Development Canada for a short period of time then to Indigenous and Northern Affairs
Canada. In 2017, this department was dissolved and replaced by two departments, Crown-
Indigenous Relations and Indigenous Services Canada. Throughout this report, we use the
names that are published on documents consistent with the nomenclature attributed at the
time of publication.

_______________                                                                                                                                  2
Urban, Rural, and Northern Indigenous Housing: The Next Step
Executive Summary
Urban, rural, and northern Indigenous housing providers across Canada are facing important
changes to their funding and significant increases to demand for their services. A survey and
interviews conducted between the end of December 2018 and March 2019 with urban, rural,
and northern 1 Indigenous housing providers revealed that the Urban Native Housing Program
and the Rural and Native Housing Programs administered by the Canada Mortgage and Housing
Corporation (CMHC) have had mixed successes. Urban, rural and northern housing providers
have fought a hard, lengthy process to create a legacy of housing into which all levels of
government and community have made significant investments to respond to the genuine need
and to serve the most vulnerable.

Yet, the expiry of Operating Agreements under these programs are introducing a season of
dramatic challenges for Indigenous housing providers, putting this collective investment at
grave risk. Many of these providers are unprepared for the change and lack the confidence that
their funding models will allow for the objectives of these programs to be accomplished. An
aging housing inventory, reduced funding, and a growing clientele has placed Indigenous
housing providers in a difficult position. A compelling desire and proven track record of
providing housing services has been a work product of the many Indigenous housing providers
that have served urban, rural and northern Indigenous people in a positive way. And yet, they
remain on the outside of decision-making, and subject to policies that put their assets at risk,
prevent them from protecting the most vulnerable and defeat any attempt at reconciliation or
meaningful poverty-reduction.

The socio-economic standard of living of Indigenous people across Canada is not improving at
the same rate as the rest of Canadian society, 2 while supply for Indigenous housing geared to
this population is falling short of the demand. The need for social supports is greater than the
funding for these supports allows. The funding that is available does not support the
development processes that would address adequate salaries, capacity building within the
housing providers organizations, and advocacy for Indigenous housing providers. The increasing
rate of urbanization of Indigenous peoples brings an additional unique demand for services. As
the Indigenous population expands at a rate far greater than the Canadian average 3, the
housing short-fall is becoming increasingly significant.

If the only objective was to house Indigenous people, the solution might be a simple influx of
dollars. Yet, Indigenous housing providers do much more than just housing, bringing social
services to better the lives of their tenants in dignified and empowering ways.

1
  Northern refers to both provincial north and the territories
2
  James Anaya, United Nations Rapporteur on Human Rights, stated "Canada consistently ranks among the top of
countries in respect to human development standards, and yet amidst this wealth and prosperity, aboriginal
people live in conditions akin to those in countries that rank much lower and in which poverty abounds." Canada
faces a 'crisis' on aboriginal reserves: UN investigator. CTV news, Tuesday, October 15, 2013.
3
  Aboriginal and Northern Affairs Canada. Aboriginal Migration and Urbanization in Canada, 1961-2006. 2013.

_______________                                                                                                   3
Urban, Rural, and Northern Indigenous Housing: The Next Step
The most effective method to supporting Indigenous housing providers is through a
consolidated approach to prevent disparities between regions, restore Crown-Indigenous
relations, and reflect the federal fiduciary obligations to Indigenous peoples. 4 Indigenous
housing providers are asking for an inclusive, Indigenous-led, dedicated approach through the
development and funding of a ‘For Indigenous by Indigenous’ National Housing Centre. It is
envisioned that a centre of this nature can provide advocacy, funding, capacity building, best
practices, and planning services for Indigenous housing providers across the country.

The following report will expose the results of the survey and interviews. It will explain the
quickly changing demographics of Indigenous populations across Canada and the background to
the Urban Native Housing Program and the Rural and Native Housing Programs. This report is a
continuation of many years of thought and research by the Canadian Housing and Renewal
Association’s Indigenous Housing Caucus, representing urban, rural, and northern social, non-
profit and affordable Indigenous housing and homelessness providers and stakeholders. 5

4
  For a further understanding of the fiduciary obligations of Canada towards Indigenous peoples, see Guerin v. R.,
[1984] 2 S.C.R. 335, Wewaykum Indian Band v. Canada, [2002] 4 S.C.R. 245. See also Daniels v. Canada, [2016] 1
S.C.R. 99.
5
  Indigenous Caucus. Canadian Housing and Renewal Association. 2019.

_______________                                                                                                      4
Urban, Rural, and Northern Indigenous Housing: The Next Step
Résumé à l’intention de la haute direction
Partout au Canada, les fournisseurs de logements destinés aux Autochtones qui sont actifs en
milieu urbain, rural ou nordique 6 voient leur financement se transformer alors que la demande
à l’égard de leurs services est en forte hausse. D’après un sondage et des entrevues menés
auprès de tels fournisseurs entre la fin de décembre 2018 et mars 2019, les résultats obtenus
par le Programme de logement pour les Autochtones en milieu urbain et le Programme de
logement pour les ruraux et les Autochtones, tous deux administrés par la Société canadienne
d’hypothèques et de logement (SCHL), sont mitigés. Les fournisseurs de logements destinés aux
Autochtones qui sont actifs en milieu urbain, rural ou nordique ont dû surmonter bien des
écueils et se mesurer à un long processus pour créer un parc de logements dans lequel tous les
ordres de gouvernement et le milieu communautaire ont fait d’importants investissements
pour répondre à un besoin réel et loger les plus vulnérables.

Pour les fournisseurs de logements destinés aux Autochtones, l’expiration des accords
d’exploitation liés à ces programmes marque le début d’une période semée d’embûches et met
en péril notre investissement collectif. Bon nombre de ces fournisseurs ne sont pas prêts à
affronter ce changement et doutent que leur modèle de financement leur permette de réaliser
les objectifs des programmes. Étant donné que leur parc immobilier vieillit, que leur
financement est réduit et que leur clientèle augmente, les fournisseurs de logements destinés
aux Autochtones sont maintenant dans une position difficile. Nourris par un profond désir de
fournir des services de logement et forts de leurs succès passés, les fournisseurs de logements
destinés aux Autochtones ont incontestablement amélioré la situation en milieu urbain, rural et
nordique. Ils demeurent pourtant exclus du processus décisionnel et doivent se conformer à
des politiques qui posent un risque pour leurs actifs, qui les empêchent de protéger les plus
vulnérables et qui minent toute tentative de réconciliation ou de réduction notable de la
pauvreté.

La norme socio-économique qui mesure le niveau de vie des Canadiens indique que le niveau
de vie des Autochtones ne s’améliore pas au même rythme que celui des autres Canadiens 7.
Toutefois, l’offre de logements destinés aux Autochtones est insuffisante pour répondre à la
demande. Les mesures de soutien social requises vont au-delà de ce qui peut être accompli
avec le financement dont disposent les fournisseurs. Le financement disponible ne couvre pas
les mesures de soutien nécessaires pour offrir des salaires adéquats, développer les
compétences des fournisseurs de logements et défendre leurs intérêts. Le taux d’urbanisation
croissant des Autochtones fait grossir la demande de services de logement. Puisque la

6
 Les régions nordiques du Canada sont les territoires et la partie nord des provinces.
7
 James Anaya, rapporteur spécial des Nations Unies sur les droits des peuples autochtones, a déclaré « que le
Canada se classe toujours parmi les meilleurs pays en ce qui concerne les normes de développement humain.
Pourtant, au sein de cette richesse et de cette prospérité, les peuples autochtones vivent dans des conditions
analogues à celles de pays beaucoup plus pauvres, où la pauvreté est monnaie courante ». (Traduction) Canada
faces a 'crisis' on aboriginal reserves: UN investigator. CTV news, publié le mardi 15 octobre 2013.

_______________                                                                                                  5
Urban, Rural, and Northern Indigenous Housing: The Next Step
population autochtone croît beaucoup plus rapidement que la population canadienne en
général 8, la pénurie de logements s’accentue.

Si le seul objectif était de loger les Autochtones, la solution serait simple : injecter plus de
dollars. Pourtant, les fournisseurs de logements destinés aux Autochtones offrent bien plus que
des logements et des services de logement, ils offrent des services sociaux qui améliorent les
conditions de vie de leurs locataires, avec dignité et un souci de les outiller pour l’avenir.

La meilleure façon de soutenir les fournisseurs de logements destinés aux Autochtones est
d’adopter une approche unifiée pour éviter les écarts entre les régions, rétablir la relation entre
la Couronne et les Autochtones et tenir compte de l’obligation fiduciaire du gouvernement
fédéral à l’égard des peuples autochtones9. Les fournisseurs de logements destinés aux
Autochtones réclament une approche inclusive, pilotée par les Autochtones, et dédiée à cette
fin. Cela se ferait par la mise sur pied et le financement d’un centre national du logement géré
« par des Autochtones pour des Autochtones ». Ce centre pourrait défendre les intérêts des
fournisseurs de logements destinés aux Autochtones de partout au pays, les aider à se financer,
développer leurs compétences, leur enseigner les pratiques exemplaires et leur offrir des
services de planification.

Le rapport qui suit présente les résultats du sondage et des entrevues. Il décrit les changements
démographiques rapides que connaissent les populations autochtones du Canada et le contexte
entourant le Programme de logement pour les Autochtones en milieu urbain et le Programme
de logement pour les ruraux et les Autochtones. Ce rapport s’appuie sur la réflexion et les
recherches sur le logement faites par le Caucus autochtone de l’Association canadienne
d’habitation et de rénovation urbaine (ACHRU) au fil des années. Ce caucus représente un large
éventail de fournisseurs de logements destinés aux Autochtones : milieu urbain, milieu rural,
logements sociaux dans les régions nordiques, logements du secteur sans but lucratif,
logements abordables, organismes luttant contre l’itinérance et autres intervenants10.

8
  Affaires autochtones et Développement du Nord Canada. Migration et urbanisation de la population autochtone
du Canada, 1961-2006, publié en 2013.
9
  Pour mieux comprendre l’obligation fiduciaire du Canada à l’égard des autochtones, voir le jugement Guerin c. La
Reine, [1984] 2 RCS 335, le jugement Bande indienne Wewaykum c. Canada, [2002] 4 RCS 245 et le jugement
Daniels c. Canada, [2016] 1 RCS 99.
10
   Caucus autochtone. Association canadienne d’habitation et de rénovation urbaine. 2019.

_______________                                                                                                  6
Urban, Rural, and Northern Indigenous Housing: The Next Step
A Contextual Background of Urban, Rural, and Northern Housing

     The Genesis of “Indian Urbanization”
In Canada, the funding of housing programs has long been a shared responsibility. The federal
government works closely with its provincial and territorial partners to improve access to
housing and meet the housing needs of Canadians. In 1963, the federal government
commissioned what would be known as the Hawthorn report, a study entitled “A Survey of the
Contemporary Indians of Canada: Economic, Political, Educational Needs and Policies.” 11 While
the report dealt with the basic theme of economic development, it did provide some policy
recommendations that impacted not only federal-provincial relations, but perhaps as an
unintended consequence, resulted in a profound impact on the current issues dealing with
Indigenous urban housing. At the time of the Hawthorn report publication, the majority (85%)
of ‘Indians’ lived on reserves and statistics relating to the Indigenous population dealt with First
Nations or status Indians. 12 The Hawthorn report urged the federal government to support a
policy where:

          (17) [First Nation] People in semi-isolated bands across the Northern wooded
          belt face special problems of development that require special types of
          programs, and should receive maximum support in moving away to obtain
          employment in areas or urban centres offering adequate job opportunities. 13
While there is a specific note directed to the ‘Northern wooded belt’, there is no question that
this recommendation developed into a general policy nationwide and support was directed
through the federal body to all Indian peoples across the country under the 1996 federal-
provincial social housing agreements. 14 Our research did not find any specific federal policy
documents directing provinces to expand their own service programs to Indigenous housing,
however gaps remain to meet growing demand. A further recommendation from the
‘Hawthorn report’ states:

          (32) The general policy of extending provincial services to Indians should be
          strongly encouraged, although due attention must be given to merits of the
          case in each functional area. 15
The Constitution Act, 1867 does not make any specific references to housing. For areas outside
of education, welfare, and health provinces would negotiate “special financial arrangements” if
asked to provide additional services. The Hawthorn report states, (and it is important to note,
that housing is not listed as an item for future consideration):

11
   Hawthorn, Harry B., Ed. A Survey of the Contemporary Indians of Canada: Economic, Political, Educational Needs
and Policies. 2 Vols., Ottawa, 1966-7.
12
   Ibid.
13
   Emphasis Added. Ibid, page 14.
14
   Audit and Evaluation Services, Canada Mortgage and Housing Corporation. Evaluation of the Urban Social
Housing Programs, 1999, page i.
15
   Ibid, page 14.

_______________                                                                                                 7
Urban, Rural, and Northern Indigenous Housing: The Next Step
As already noted, one of the factors which tends to evoke special financial
arrangements is that the initial approach for the extension of provincial
services comes from the federal government. This inevitably results in
intergovernmental bargaining, and stresses the additional effort required of
the provinces while frequently minimizing their actual constitutional
competence in the areas under discussion. The possible long run implications
of this development are disturbing. Outside of the basic provincial programs in
education, welfare, and health in which federal departments are already
operative and where it is thus unrealistic to assume that the provinces will
extend their services without special financial arrangements, there are
numerous additional areas of provincial activity. These include training
programs, grants to local government, and a host of inspection and advisory
services. The list is almost endless. The undesirable consequences of an
unending proliferating series of federal provincial agreements in every
conceivable area of provincial service activity are self-evident. 16
Some provincial governments addressed the issue as early as 1965 and started to construct
Indigenous housing in remote areas of the prairie provinces under federal-provincial
agreements. 17 This program was established to construct low-cost housing for sale to Indian
and Métis people and featured a payment plan consistent with the purchaser’s income.
Organizations representing Métis and non-status Indians continued to push for programs to
support access to, and better housing for, people residing off reserve. The rationale for this
push was twofold: first, the housing conditions of the Aboriginal peoples at that time were
devastatingly poor; and second, the growth rate of Aboriginal peoples was far beyond the
Canadian average growth rate. The Royal Commission on Aboriginal Affairs observed that “the
[Aboriginal] population increased 42% from 1961 to 1971, 57% from 1971 to 1981, and nearly
47% from 1981 to 1991.” 18
The federal government, in 1972, made a commitment to build 50,000 housing units for
Aboriginal people residing off reserve. 19 This led to the development of the Rural and Remote
Housing Program, which was established in 1973 and administered by CMHC. 20 The objective of
this program was to provide low-interest mortgage loans and grants to non-profit rental
housing groups. The Urban Native Housing Program was introduced in 1978 as part of CMHC’s
16
Ibid, page 6.
17
Evaluation of the Rural and Native Housing Programs: Main Report, Program Evaluation Division, Canada
Mortgage and Housing Corporation, February 1992, page 6.
18
Royal Commission on Aboriginal Peoples, as cited in Lance W. Roberts, Rodney A. Clifton, Barry Ferguson, Karen
Kampen, and Simon Langlois, eds. Recent Social Trends in Canada, 1960-2000 (Montreal and Kingston: McGill-
Queen’s University Press), 2005.
19
Pomeroy, S. A New Beginning: A National Non-Reserve Aboriginal Housing Strategy, on behalf of the National
Aboriginal Housing Association. In Vol. 4: Moving Forward, Making a Difference, in Aboriginal Policy Research
Series, Thompson Educational Publishing, 2013.
20
Evaluation of the Rural and Native Housing Programs: Main Report, Program Evaluation Division, Canada
Mortgage and Housing Corporation, February 1992.
_______________ 8
Urban, Rural, and Northern Indigenous Housing: The Next StepNon-Profit Housing program, and featured subsidies for people who could not afford market
rents.21 In the early 80s the program increased the subsidy portion because many of the
tenants could not afford the rent provisions that were established in the earlier program.
Most of these programs continue to leave their imprint on the present. When the Rural and
Native Housing (RNH) programs started in 1985, the stated objective was “that the RNH
program along with other social housing programs, assist households in need, who cannot
obtain affordable, suitable and adequate shelter on the private market.” 22
Of interest is the paragraph in the 1992 CMHC Rural and Native Housing program evaluation,
which speaks to the needs of tenants. Many of the interviewees in the case studies conducted
stated that stable income remained a major issue for tenants. The 1992 evaluation states:
When CMHC negotiated the social housing agreements with the provincial
governments in 1986, it was agreed that the programs should be targeted to
core need households, and that the units provided under the programs should
be affordable, suitable and adequate. That is, the objectives of the Rural and
Native Housing Programs were to take households out of core need. This
evaluation has demonstrated that these objectives have not been achieved,
both for units built before 1986 and for units built after 1985. In more than 50
percent of the cases, RNH households with incomes lower than the income
thresholds have an affordability, suitability or adequacy problem. 23
The evaluation goes on the say that the major reason for the failure of the program was the
design and delivery of the programs. 24
An additional program added in 1978, the Urban Native Housing Program, offered subsidies
through Operating Agreements made with the housing providers, largely non-profit Indigenous
organizations established to provide housing to Indigenous peoples living in or migrating to
urban centres. At the time, the programs were well received and addressed the needs of the
growing urban Indigenous population. The program evaluation conducted in 1999 reflected
positive results. The program was directed to address core needs, which were defined as those
whose rent would not exceed a maximum of 30 percent of its income to obtain adequate
housing. Because the gap between the costs of supplying housing and rental revenues was
being addressed through subsidies based on the rent geared to income (RGI) basis, the program
was successful and provided more homes to Aboriginal clientele. The urban social housing
strategy in 1986 included this feature and ensured that housing subsidies were targeted to
those in core need. Today,
21
CMHC Evaluation of the Urban Social Housing Programs, December 1999.
22
CMHC Evaluation of the Rural and Native Housing Program, February 1992, page 442.
23
Ibid., page 442.
24
Ibid, page 443.
_______________ 9
Urban, Rural, and Northern Indigenous Housing: The Next StepCMHC defines “acceptable housing” as housing that is adequate in condition,
suitable in size and affordable, and uses a conventional method for measuring
housing affordability. A household whose shelter falls short of any of these
three standards and for whom there is no available housing that would be
acceptable is deemed to be in “core housing need.” 25
A contributing factor to the necessity of urban and rural Indigenous housing was the rate of
urban migration. The Canadian encyclopedia has documented the growth of the urban
Aboriginal population.26 A further rise in the Aboriginal growth rates occurred with the 1985
legislation of Bill C-31, whose provisions reinstated Indian status to over 100,000 people 27 and
resulted in a further demand on housing providers to secure additional housing units.
Socio-economic Conditions
While there are evaluations, investigations, reports and academic studies looking at and
analyzing the socio-economic condition of Indigenous peoples in Canada, the situation has not
improved to any great degree. James Anaya, Special Rapporteur to the United Nations, in a
report to the Human Rights Council on the overall subject of Indigenous peoples in Canada
dated July 4, 2014, wrote the following:
The most jarring manifestation of those human rights problems is the
distressing socioeconomic conditions of Indigenous peoples in a highly
developed country. Although in 2004 the previous Special Rapporteur
recommended that Canada intensify its measures to close the human
development indicator gap between Indigenous and non-Indigenous
Canadians in health care, housing, education, welfare and social services,
there has been no reduction in that gap in the intervening period in relation to
registered Indians/First Nations, although socioeconomic conditions for Métis
and non-status Indians have improved, according to government data. 28
The United Nations Special Rapporteur on the Right to Housing, Leilani Farha, referenced
adequate housing as a component of the right to an adequate standard of living. On the right to
non-discrimination in this context, Farha stated the following in her 2015 report to the United
Nations General Assembly:
A rights-based approach to Habitat III understands urbanization not simply as
a geographical, demographic or economic phenomenon subject to
25
CMHC, Defining the Affordability of Housing in Canada, prepared by Prism Economics and Analysis, January
2019.
26
Price, John A. et al. "Urban Migration of Indigenous Peoples in Canada". The Canadian Encyclopedia, 17 January
2018, Historica Canada.
27
Ibid.
28
Anaya, James. Report of the Special Rapporteur to the Human Rights Council of the United Nations, 2014.
_______________ 10
Urban, Rural, and Northern Indigenous Housing: The Next Stepmeasurement and analysis, but also as a dynamic process that renews and
reshapes social, political and economic relationships. 29
The research gathered for this engagement illustrates strikingly similar conditions as stated in
the 1992 evaluation of the Rural and Native housing programs, the Royal Commission on
Aboriginal Peoples, the 2015 Truth and Reconciliation Commission of Canada, and the United
Nations report by James Anaya, among others. However, as supported by Farha’s comments,
the urbanization of Indigenous peoples is indeed shaping a new social, political and economic
relationship that cannot be avoided further. To ignore the issue of Indigenous urbanization will
be to further exacerbate the low economic situation of Indigenous peoples and current housing
crisis, which federal, provincial, and territorial governments have committed to addressing.
Research Design
The basic objective of the research was first to understand the nature, scope and conditions of
the work and services of the Indigenous housing providers, and to ascertain the housing
providers’ views on the potential creation of an urban, rural and northern Indigenous housing
entity for advocacy, research, and operation of a national housing centre.
The research was initiated from the concept discussed and agreed to at the annual Canadian
Housing and Renewal Association (CHRA) Indigenous Housing Caucus Day in 2017, where the
concept of a central support organization for urban and rural Indigenous housing providers was
first articulated; followed by the Indigenous Housing Caucus Day in 2018 where the “For
Indigenous by Indigenous” (FIBI) National Housing Centre was proposed. 30
The research for this assignment employed a mixed methods research design. An initial
quantitative instrument by way of a bilingual electronic survey was developed and
administered to urban, rural, and northern Indigenous housing providers. The contact list of
145 Indigenous housing providers spread across the country was developed using publicly
available information and existing housing networks. The survey information was collected in
QuestionsPro software. Emails enclosing the survey link were followed up with direct phone
calls to all the Indigenous housing providers to personally request that they complete the
survey. The survey questions are attached as Appendix A.
29
Farha, Leilani, Special Report to the General Assembly of the United Nations, August 2015, Adequate housing as
a component of the right to an adequate standard of living.
30
A For Indigenous By Indigenous National Housing Strategy: Addressing the Housing Needs of Indigenous Families
and Individuals in the Urban, Rural and Northern Parts of Canada. Proposal to the Government of Canada by the
Indigenous Housing Caucus Working group. Canadian Housing and Renewal Association. May 2018.
_______________ 11
Urban, Rural, and Northern Indigenous Housing: The Next StepThe second part of the research design was qualitative in nature, conducting personal
interviews with 26 Indigenous housing providers throughout the country. A critical case
approach was used and a Project Oversight committee of the CHRA’s Indigenous Caucus
determined the locations to be interviewed. An interview guide (attached as Appendix B) was
developed and sent to each of the housing providers prior to their interviews.
Secondary research was also undertaken, collecting and reviewing papers written on the
subject of Indigenous housing, evaluations of housing programs, and statistical information
from Statistics Canada and other federal agencies and departments.
Demographics
The demand for housing services by Indigenous peoples in urban, rural and northern settings is
impacted by a number of critical factors. Of importance is the demographic profile of
Indigenous peoples, which includes the total population, the population distribution, gender
distribution, migration statistics, and overall growth rates. The most recent census conducted in
2016, reports that 1,673,785 Aboriginal people are living in Canada, 4.9% of the Canadian
population.31 This number is recorded in three separate distinction categories as illustrated in
the following chart, which also provides the percentage change since the last census of 2011.
Aboriginal Population – 2016
Population Percentage
Reported change since
2011 Census
First Nations 977,239 39.3% Increase
Métis 587,545 51.2% Increase
Inuit 65,025 29.1% Increase
Table 1: Aboriginal Population, 2016.32
The growth of the Aboriginal population living in urban centres has steadily grown since 1961 as
illustrated in the chart below.
31
National Indigenous Peoples Day... by the numbers 2018. 2016 Census Canada.
32
Ibid.
_______________ 12
Urban, Rural, and Northern Indigenous Housing: The Next StepFigure 1: Proportion of Aboriginals Living in Urban Areas, Comparative 1961-2006 33
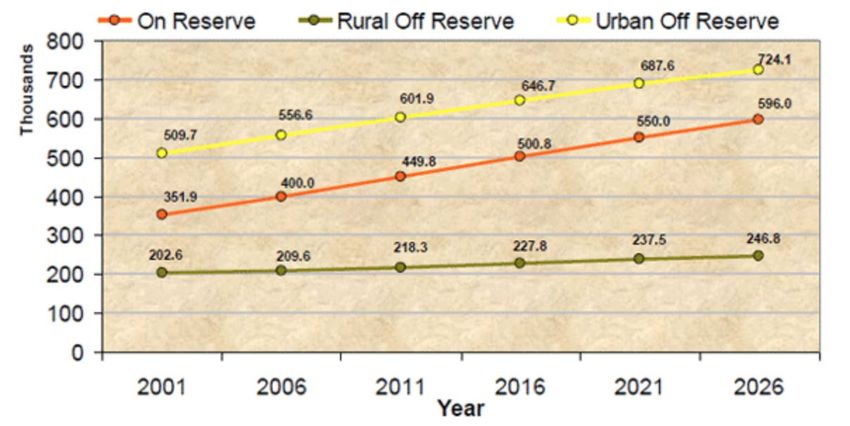
Figure 2: Projected Aboriginal Population, by Place of residence, Medium Growth Scenario,
Canada, 2001-2026 34
The Youth Factor
The percentage of youth in the Indigenous population is far above the Canadian average. This
issue will come to bear in a few years, adding a new dimension to the demands of services to
33
Norris, Mary Jane & Clatworthy, Stewart, Urbanization and Migration Patterns of Aboriginal Populations in
Canada: A Half Century in review. Commissioned by Aboriginal Affairs and Northern Development Canada, 2011.
Page 33.
34
Indigenous and Northern Affairs Canada, Aboriginal Demography – Population, Household and Family
Projections, 2001-2016.
_______________ 13
Urban, Rural, and Northern Indigenous Housing: The Next StepIndigenous people, including housing. When we look at Figure 3, we can see two things in
comparison to the non-Indigenous population in Canada. First, we see the marked difference in
percentage of youth in all three of the Indigenous groups, as a far greater percentage of the
total population, relative to the non-Indigenous population. Second, we see the opposite in the
elderly, who represent a much smaller portion of the population, relative to the non-Indigenous
population.
Figure 3: Youth and Elder populations, relative to the Non-Aboriginal Population 35
The following table similarly provides the percentages of youth and elderly populations.
Share (In percentage) of the Aboriginal population aged 0-14 and 65 years and over
0-14 years 65 years and over
First Nations 29.2 6.4
Métis 22.3 8.7
Inuit 33.0 4.7
Non-Aboriginal 16.4 16.3
Table 2: Share (in percentage) of the Aboriginal population aged 0-14 and 65 years and over 36
Within the census metropolitan area’s (CMA) of the larger cities in Canada, we can see from
Table 3 that the population growth within these CMA’s all exceed significantly the Canadian
average. The youth population growth, combined with the low economic status, as illustrated in
Figure 4, compounds with an aging asset base of current housing providers, and results in a still
greater demand on these Indigenous housing providers. The issue of provision of urban
Indigenous housing can be considered to be at a crisis level already.
35
Statistics Canada: Aboriginal peoples in Canada: Key results from the 2016 Census.
36
Statistics Canada: Aboriginal People in Canada: Key Results of the 2016 census
_______________ 14
Urban, Rural, and Northern Indigenous Housing: The Next StepPercentage of Population increase in selected CMAs
First Nations (male)
Canadian (avg)
Métis (female)
Inuit (female)
Cdn (female)
Métis (male)
First Nations
Inuit (male)
Cdn (male)
(female)
· Halifax 8.1 9.2 7 175.3 159 304.4 286.8 270 120
· Montreal 9.1 10 7 56.1 50.7 142.6 157.8 50 73.2
· Toronto 15.9 15.8 16.1 64.4 59.4 107.3 97.2 100 135.5
· SS Marie -2.1 -1.3 -2.7 38 39.2 20.3 26.7 … ...
· T Bay -1.6 -0.5 -2.7 61.1 47.2 32.5 60.2 -25 -25
· Winnipeg 11.7 13 10.4 56.8 47.7 26.4 29.5 -27 16.1
· Regina 20.7 23.6 17.9 43.9 34.3 3.8 17.3 100 400
·Saskatoon 24.7 26.7 22.9 37.5 36.5 47.9 61.8 -14.3 83.3
·Calgary 28.6 28.8 28.4 59.6 60.9 51.9 48.9 10 152.4
·Edmonton 27.1 28.2 26 51.5 51.5 42.9 42.4 87.1 92.7
·Yellowknife 5.2 5.3 5.1 37.4 13 -6.6 3.6 4.3 -16
·Vancouver 15.9 16 15.9 53.9 51.8 55 57.1 89.5 83.3
·Victoria 11.2 12.3 10.2 41.8 51.5 89.2 76.1 22.2 -5.9
Table 3: Percentage Change in population 2006-2016 in selected CMAs37
Income
The overall economic condition of Indigenous peoples ranges greatly from province to province.
We can see from Figure 4 that the economic situation, as expressed by the incomes reported in
the 2016 census, illustrates a number of critical issues. First, it is noted that the income levels
for all Indigenous peoples are lower than provincial averages with the exception of Nunavut.
This may be explained by the small numbers of First Nations and Métis located in Nunavut who
may be considered economic outliers and, if relocated to Nunavut to take professional jobs, the
graphic illustration would be skewed. It is notable that the Inuit income level on this same line,
is well below the average income in that territory.
37
Statistics Canada, 2018, Aboriginal Population Profile. 2016 Census. Statistics Canada Catalogue no. 98-510-
X20116001, Ottawa
_______________ 15
Urban, Rural, and Northern Indigenous Housing: The Next StepFigure 4: Average total income 2015 38
Figure 4 also shows that Manitoba and Saskatchewan have the poorest income levels with the
First Nations people having the least income of all Canadian Indigenous populations. As we
break out the provincial statistics even further, we can see the largest disparity between
Indigenous and non-Indigenous is in Manitoba.
The following Table 4 provides the numeric average income for the different Indigenous groups.
We can see from the table that one of the issues illustrated in these numbers is the income
disparity between men and women. In comparing Table 4 with Figure 4, we can see that the
income gap is even further exacerbated for Indigenous women. As we will see later in the
survey results, Indigenous women, and their children, make up the largest demographic of
tenants among Indigenous housing providers.
38
Ibid, Statistics Canada Catalogue no. 98-510-X20116001, Ottawa
_______________ 16
Urban, Rural, and Northern Indigenous Housing: The Next StepIndigenous Average Income
First Nations Métis Inuit
Gender Male Female Male Female Male Female
Income $34,346 $29,050 $49,983 $34,801 $38,301 $37,469
Table 4: Indigenous Average Income 39
Education
Education levels for Indigenous people across Canada are very low for First Nations people
living on reserve, as demonstrated in Table 5. For Indigenous people living off reserve, the
education levels are somewhat higher but still relatively low. Of great concern are the high
numbers of respondents who indicated no certificate, diploma or degree at all.
Indigenous People relative to levels of Education
First Nations Métis Inuit
No Certificate, diploma or degree 264,430 116,390 22,575
Equivalency Certificate 175,315 129,315 8,455
Or Diploma 67,480 55,765 4,155
University Certificate or Diploma 117,790 95,790 6,170
Bachelor’s Degree 37,670 36,200 1,310
Degrees above bachelor’s degree 13,210 12,660 395
Table 5: Number of Indigenous People with levels of education 40
The Auditor General of Canada in their Report 5 – Socio–economic Gaps on First Nations
Reserves – Indigenous Service Canada, 2018 Spring report,41 noted that the gap between
Indigenous and non-Indigenous high school diploma achievement is getting wider, which
exacerbates the ability of First Nations people to become involved in the general labour force
or participate in the economy. This gap further adds to employment issues, which in turn adds
to the demand for housing.
39
Ibid., Statistics Canada Catalogue no. 98-510-X20116001, Ottawa
40
Ibid., Statistics Canada Catalogue no. 98-510-X20116001, Ottawa
41
Office of the Auditor General of Canada. 2018 Independent Auditor’s Report 5 – Socio-economic Gaps on First
Nations Reserves – Indigenous Services Canada. Spring Report.
_______________ 17
Urban, Rural, and Northern Indigenous Housing: The Next StepFigure 5: Percentage of populations with at least high school diploma or equivalent 42 Survey Results An electronic web-based survey was designed and administered to a list of 145 urban, rural, and northern Indigenous housing providers by email. The purpose of the survey was to get housing providers’ views and statistical information on a variety of issues relating to their operations. The research was deemed to be necessary given the impending expiry of Operating Agreements combined with growing demand and clientele. The research collected provides documented data to justify the required supports from all levels of government. The survey was divided into seven different categories of questions: general organizational structure, infrastructure inventory, maintenance and repairs, tenants, finance and business, support mechanisms, and future needs. The survey instrument was reviewed by CHRA’s Indigenous Housing Caucus, CMHC, and Indigenous Services Canada (ISC) prior to implementation and was sent out to housing providers who were provided five weeks to respond. The survey questions are attached as Appendix A. Phone calls to the contact person for each housing provider were made following up on the email survey and inviting them to participate. Office of the Auditor General of Canada. 2018 Independent Auditor’s Report 5 – Socio-economic Gaps on First 42 Nations Reserves – Indigenous Services Canada. Spring Report. _______________ 18 Urban, Rural, and Northern Indigenous Housing: The Next Step
From the 145 providers contacted, we received 55 completed surveys. A completed survey is
defined as one where the respondent went through the entire questionnaire and submitted the
responses they made. It should be noted that respondents could skip questions and proceed to
the next question. As a result, not all questions were completed. We have included the results
from partially completed surveys. Consequently, the response rate for each question is marked
with “n=” to reflect the participation for that specific question.

In the survey and interview instructions to housing providers, we indicated that the responses
would be confidential, and any information provided would be non-attributable. The
information provided in this report complies with this assurance that specific information will
not be attributed to specific providers.

   Section A: General Organizational Structure

We were able to view the rate of participation from each province and territory as illustrated in
Figure 6.

                         Geographic Location of Respondents
                       Location                 Percentage

                       Nova Scotia                       1.75%

                       New Brunswick                     1.75%

                       Quebec                            0.87%

                       Ontario                           32.46%

                       Manitoba                          12.28%

                       Saskatchewan                      19.3%

                       Alberta                           7.89%

                       British Columbia                  18.42%

                       Northwest Territories             3.51%

                        Yukon                           1.75%
                       Figure 6: Location of Survey Respondents (n=114)

_______________                                                                                19
Urban, Rural, and Northern Indigenous Housing: The Next Step
We asked further where the respondents were located with 65.18% indicating a major urban
centre, 25.00 % in a small town and 9.82% in a rural or remote area.
With respect to the start of the housing providers’ organization, we were provided the year of
their start and can see that there has been a continuous number of housing providers added as
the years progress. Figure 7 indicates the date or year that the organizations began, with the
cumulative housing providers over time. It shows that there has been a constant growth in the
number of housing providers, reflecting the growing need within the Indigenous population
across Canada.
The Year Indigenous Housing Providers Started Operation
Year 1970- 1975- 1980- 1985- 1990- 1995- 2000- 2005-
1974 1979 1984 1989 1994 1999 2004 2010
Number of
housing 14 12 18 27 9 6 4 9
providers started
Figure 7: Year of founding of housing provider’s organization (n=99)
The overwhelming majority (98%) have operated continuously since they started operations
and report employing 2,038 people as of March 2019 (n=99). When asked if this represented a
growth or decrease in the numbers of staff, 61.18% indicated that it was growth. The main
reason for the growth was cited as being addition of properties. Also cited was an increase in
services and available funding.
We asked about volunteers and their importance. Respondents answered in the middle of the
Likert scale regarding their level of importance to the organization. When queried about the
responsibilities of volunteers, the majority answer was board members followed by special
projects and fundraising. We enquired as to whether external professional services were
retained and 93.14% of the organizations (n=84) indicated they did indeed retain outside
professional services. The main service retained was audit and legal, followed by maintenance
services, and some human resource services.
With respect to the governance structures, 87% reported being a non-profit organization
comprised of 57% having an all Indigenous board and 30% with partial Indigenous members of
the Board (n=101). 4% reported being a cooperative and 2% reported being a for-profit
corporation. The average size of the board was 7.38 members (n=84) with the least numbers of
board members being four (4) and the largest number of members being 23.
_______________ 20
Urban, Rural, and Northern Indigenous Housing: The Next StepSection B: Infrastructure Inventory
To understand the magnitude of the work being undertaken and the specificity of the
organizations, we asked if they managed any properties that were not owned by their
respective organizations. 30% indicated they did in fact manage other properties and received a
management fee or revenue for doing so. The total numbers of units being managed by the
housing providers reported was 20,393 (n=81) with a median of 80 units. In reality, there are
some outliers, for instance there are 5 providers with over 1,000 units and two with over 2,000
units. These outliers are included in the total number of responses.
We asked a specific question regarding accessibility for wheelchairs and of 74 responses,
representing 17,377 units, 793 were reported as having this accessibility.
The majority of respondents (77.78%) indicated they did not provide shelter services for the
homeless (n=72). For those that did provide shelter services, the length of stay ranged from 20
days to up to two (2) years (n=16).
In a subsequent question, we asked the respondents to identify the types of units they
managed. There were 67 responses that provided answers to this question and the following
table provides the summary of the results.
Types of Units being Managed
Wheelchair
No. units Bachelor 1 bdrm 2 bdrm 3 bdrm 3+ bdrm Accessible
16,723 808 3,522 4,129 6,848 1,416 747
percentage 4.83 21.06 24.69 40.95 8.47 4.94
Table 6: Types of Units being Managed (n=67)
For the numbers of units reported, the numbers illustrate that the majority of units are in the 2
and 3-bedroom facility with 8.47% reporting more than 3 bedrooms. Section D (Tenants) below
provides more detail on the makeup of the tenants but it suggests that if 2 and 3 bedrooms are
the most used type of unit, that families make up the majority of tenants.
Section C: Maintenance and Repairs
In this section, we asked the respondents to provide some information on the condition of their
units. We asked that they provide a general assessment and we provided some overall
guidelines as to what was included in each category. The guidelines were as follows:
_______________ 21
Urban, Rural, and Northern Indigenous Housing: The Next StepCondition of Units
Unsuitable A subjective call by the housing provider
Major repairs New roof, drainage issues, electrical replacement, New windows and
doors, new siding, driveway replacement, mold remediation,
structural problems, water infiltration, furnace replacement.
Some Repairs General repairs to furnace/electric, windows or doors, new
appliances, replace kitchen cabinets, floor covering replacement
General maintenance Furnace filters, some painting, tree maintenance, caulking, changing
locks on doors and windows
Excellent No repairs required
Table 7: Condition of Units guidelines.
This was obviously a more difficult question to respond to as only 33 respondents provided
information. While the data received was useful, some respondents provided an incomplete
assessment of the total of their units. For instance, instead of completing an assessment of the
entire inventory of their units, they may have inserted a number for the condition of just one or
two of the categories. This speaks to an issue identified in the analysis where database
information is not kept nor readily available. When speaking to the housing providers during
the follow-up call regarding participation in the survey, many providers indicated that they did
not have the resources or the time to provide this level of detail. A limited few had an asset
management system in place and those who did provided information.
With this qualifier in mind, the information provided by the respondents to this question is
summarized as follows. A total of 37 respondents reported the condition of 10,931 units. The
overall condition of these units is illustrated in table 8 below.
Condition Assessment
Unusable Major repairs Some Repairs General Excellent
Maintenance
112 1,232 2,601 4,672 2,314
1.02% 11.27% 23.79% 42.74% 21.17%
Table 8: Condition of Units assessment by survey respondents (n=37)
Respondents were invited to provide further narrative on issues they faced with respect to the
condition of their units. General maintenance was raised a number of times with comments
about the portfolio being spread around the urban area, which added to maintenance costs.
_______________ 22
Urban, Rural, and Northern Indigenous Housing: The Next StepThe fact that the portfolio is old was also raised and said to cause more and ongoing
maintenance requirements. Water damage was another issue that was raised numerous times
either because of drainage issues or leaking roofs. Heating systems were raised a number of
times and maintenance of the heating systems was an issue. A concern was raised regarding
the impending end of Operating Agreements and a fear that they would not be able to maintain
units without the continuation of the subsidy attached to those agreements.
In Table 9, information from Census 2016 research confirms the level of standards found in
Indigenous households are, for the most part, below those of non-aboriginal Canadians in
adequacy, affordability and suitability.
Percent distribution of core housing need by standard, Aboriginal identity, Canada, 2016 43
Aboriginal Households Non-Aboriginal Households
Percentage below each standard
Below Below Below Below Below Below
Adequacy Affordability Suitability Adequacy Affordability Suitability
Standards Standards Standards Standards Standards Standards
Canada 24.2% 81.2% 17.8% 12.7% 91.3% 11.4%
All-CMA 18.9% 87.8% 17.0% 10.9% 92.0% 13.4%
Total for
Canada
All-CA Total 19.2% 90.2% 14.2% 13.6% 94.2% 5.1%
for Canada
Non- 38.0% 62.2% 21.7% 23.4% 85% 4.3%
CMA/CA
Total for
Canada
Overall Incidence for each standard
Canada 4.4% 14.8% 3.2% 1.6% 11.3% 1.4%
All-CMA 3.7% 17.0% 3.3% 1.5% 12.4% 1.8%
Total for
Canada
All-CA Total 3.2% 15.1% 2.4% 1.3% 9.1% 0.5%
for Canada
Non-CMA/CA 6.6% 10.9% 3.8% 2.3% 8.3% 0.4%
Total for
Canada
Adding across columns exceeds 100% as households can experience multiple problems
43 CMHC (Census 2016 -based and NHS-based housing indicators and data)
_______________ 23
Urban, Rural, and Northern Indigenous Housing: The Next StepYou can also read