Mental Health, Substance Use, and Suicidal Ideation During the COVID-19 Pandemic - United States, June 24-30, 2020 - CDC
←
→
Page content transcription
If your browser does not render page correctly, please read the page content below
Morbidity and Mortality Weekly Report
Weekly / Vol. 69 / No. 32                                                                                                          August 14, 2020

     Mental Health, Substance Use, and Suicidal Ideation During the COVID-19
                  Pandemic — United States, June 24–30, 2020
        Mark É. Czeisler1,2; Rashon I. Lane MA3; Emiko Petrosky, MD3; Joshua F. Wiley, PhD1; Aleta Christensen, MPH3; Rashid Njai, PhD3;
   Matthew D. Weaver, PhD1,4,5; Rebecca Robbins, PhD4,5; Elise R. Facer-Childs, PhD1; Laura K. Barger, PhD4,5; Charles A. Czeisler, MD, PhD1,4,5;
                                       Mark E. Howard, MBBS, PhD1,2,6; Shantha M.W. Rajaratnam, PhD1,4,5

   The coronavirus disease 2019 (COVID-19) pandemic has
been associated with mental health challenges related to the                                INSIDE
morbidity and mortality caused by the disease and to mitiga-                                1058 Characteristics of Marijuana Use During
tion activities, including the impact of physical distancing                                     Pregnancy — Eight States, Pregnancy Risk
and stay-at-home orders.* Symptoms of anxiety disorder and                                       Assessment Monitoring System, 2017
depressive disorder increased considerably in the United States                             1064 Top Food Category Contributors to Sodium and
during April–June of 2020, compared with the same period in                                      Potassium Intake — United States, 2015–2016
2019 (1,2). To assess mental health, substance use, and suicidal                            1070 Serious Adverse Health Events, Including Death,
ideation during the pandemic, representative panel surveys                                       Associated with Ingesting Alcohol-Based Hand
were conducted among adults aged ≥18 years across the United                                     Sanitizers Containing Methanol — Arizona and
                                                                                                 New Mexico, May–June 2020
States during June 24–30, 2020. Overall, 40.9% of respondents
reported at least one adverse mental or behavioral health con-                              1074 COVID-19–Associated Multisystem Inflammatory
                                                                                                 Syndrome in Children — United States, March–July 2020
dition, including symptoms of anxiety disorder or depressive
                                                                                            1081 Hospitalization Rates and Characteristics of
disorder (30.9%), symptoms of a trauma- and stressor-related
                                                                                                 Children Aged
Morbidity and Mortality Weekly Report
Community-level intervention and prevention efforts, including subjects research. Respondents were informed of the study pur-
health communication strategies, designed to reach these groups poses and provided electronic consent before commencement,
could help address various mental health conditions associated and investigators received anonymized responses. Participants
with the COVID-19 pandemic. included 3,683 (68.1%) first-time respondents and 1,729
During June 24–30, 2020, a total of 5,412 (54.7%) of (31.9%) respondents who had completed a related survey
9,896 eligible invited adults** completed web-based surveys†† during April 2–8, May 5–12, 2020, or both intervals; 1,497
administered by Qualtrics.§§ The Monash University Human (27.7%) respondents participated during all three intervals
Research Ethics Committee of Monash University (Melbourne, (2,3). Quota sampling and survey weighting were employed
Australia) reviewed and approved the study protocol on human to improve cohort representativeness of the U.S. population
by gender, age, and race/ethnicity.¶¶ Symptoms of anxiety
** A minimum age of 18 years and residence within the United States as of
April 2–8, 2020, were required for eligibility for the longitudinal cohort to
disorder and depressive disorder were assessed using the four-
complete a survey during June 24–30, 2020. Residence was reassessed during item Patient Health Questionnaire*** (4), and symptoms of
June 24–30, 2020, and one respondent who had moved from the United States a COVID-19–related TSRD were assessed using the six-item
was excluded from the analysis. A minimum age of 18 years and residence within
the United States were required for eligibility for newly recruited respondents Impact of Event Scale††† (5). Respondents also reported
included in the cross-sectional analysis. For both the longitudinal cohort and
newly recruited respondents, respondents were required to provide informed ¶¶ Survey weighting was implemented according to the 2010 U.S. Census with
consent before enrollment into the study. All surveys underwent data quality respondents who reported gender, age, and race/ethnicity. Respondents who
screening procedures including algorithmic and keystroke analysis for attention reported a gender of “Other,” or who did not report race/ethnicity were
patterns, click-through behavior, duplicate responses, machine responses, and assigned a weight of one.
inattentiveness. Country-specific geolocation verification via IP address mapping *** Symptoms of anxiety disorder and depressive disorder were assessed via the
was used to ensure respondents were from the United States. Respondents who four-item Patient Health Questionnaire (PHQ-4). Those who scored ≥3 out
failed an attention or speed check, along with any responses identified by the of 6 on the Generalized Anxiety Disorder (GAD-2) and Patient Health
data-scrubbing algorithms, were excluded from analysis. Questionnaire (PHQ-2) subscales were considered symptomatic for these
†† The surveys contained 101 items for first-time respondents and 86 items for respective disorders. This instrument was included in the April, May, and
respondents who also participated in later surveys, with the 15 additional June surveys.
items for first-time respondents consisting of questions on demographics. The ††† Symptoms of a TSRD attributed to the COVID-19 pandemic were assessed
survey instruments included a combination of individual questions, validated via the six-item Impact of Event Scale (IES-6) to screen for overlapping
questionnaires, and COVID-19-specific questionnaires, which were used to symptoms of PTSD, ASD, and ADs. For this survey, the COVID-19 pandemic
assess respondent attitudes, behaviors, and beliefs related to COVID-19 and was specified as the traumatic exposure to record peri- and posttraumatic
its mitigation, as well as the social and behavioral health impacts of the symptoms associated with the range of stressors introduced by the COVID-19
COVID-19 pandemic. pandemic. Those who scored ≥1.75 out of 4 were considered symptomatic.
§§ https://www.qualtrics.com/. This instrument was included in the May and June surveys only.
The MMWR series of publications is published by the Center for Surveillance, Epidemiology, and Laboratory Services, Centers for Disease Control and Prevention (CDC),
U.S. Department of Health and Human Services, Atlanta, GA 30329-4027.
Suggested citation: [Author names; first three, then et al., if more than six.] [Report title]. MMWR Morb Mortal Wkly Rep 2020;69:[inclusive page numbers].
Centers for Disease Control and Prevention
Robert R. Redfield, MD, Director
Anne Schuchat, MD, Principal Deputy Director
Chesley L. Richards, MD, MPH, Deputy Director for Public Health Science and Surveillance
Rebecca Bunnell, PhD, MEd, Director, Office of Science
Arlene Greenspan, PhD, Acting Director, Office of Science Quality, Office of Science
Michael F. Iademarco, MD, MPH, Director, Center for Surveillance, Epidemiology, and Laboratory Services
MMWR Editorial and Production Staff (Weekly)
Charlotte K. Kent, PhD, MPH, Editor in Chief Martha F. Boyd, Lead Visual Information Specialist
Jacqueline Gindler, MD, Editor Maureen A. Leahy, Julia C. Martinroe,
Paul Z. Siegel, MD, MPH, Guest Associate Editor Stephen R. Spriggs, Tong Yang,
Mary Dott, MD, MPH, Online Editor Visual Information Specialists
Terisa F. Rutledge, Managing Editor Quang M. Doan, MBA, Phyllis H. King,
Douglas W. Weatherwax, Lead Technical Writer-Editor Terraye M. Starr, Moua Yang,
Glenn Damon, Soumya Dunworth, PhD, Information Technology Specialists
Teresa M. Hood, MS, Donald G. Meadows, MA
Technical Writer-Editors
MMWR Editorial Board
Timothy F. Jones, MD, Chairman
Michelle E. Bonds, MBA Katherine Lyon Daniel, PhD Patricia Quinlisk, MD, MPH
Matthew L. Boulton, MD, MPH Jonathan E. Fielding, MD, MPH, MBA Patrick L. Remington, MD, MPH
Carolyn Brooks, ScD, MA David W. Fleming, MD Carlos Roig, MS, MA
Jay C. Butler, MD William E. Halperin, MD, DrPH, MPH William Schaffner, MD
Virginia A. Caine, MD Jewel Mullen, MD, MPH, MPA Morgan Bobb Swanson, BS
Jeff Niederdeppe, PhD
1050 MMWR / August 14, 2020 / Vol. 69 / No. 32 US Department of Health and Human Services/Centers for Disease Control and PreventionMorbidity and Mortality Weekly Report
whether they had started or increased substance use to cope started or increased substance use to cope with stress or emotions
with stress or emotions related to COVID-19 or seriously related to COVID-19 (13.3%), and those who reported having
considered suicide in the 30 days preceding the survey.§§§ seriously considered suicide in the preceding 30 days (10.7%)
Analyses were stratified by gender, age, race/ethnicity, (Table 1). At least one adverse mental or behavioral health
employment status, essential worker status, unpaid adult care- symptom was reported by more than one half of respondents
giver status, rural-urban residence classification,¶¶¶ whether who were aged 18–24 years (74.9%) and 25–44 years (51.9%),
the respondent knew someone who had positive test results of Hispanic ethnicity (52.1%), and who held less than a high
for SARS-CoV-2, the virus that causes COVID-19, or who school diploma (66.2%), as well as those who were essential
had died from COVID-19, and whether the respondent was workers (54.0%), unpaid caregivers for adults (66.6%), and who
receiving treatment for diagnosed anxiety, depression, or post- reported treatment for diagnosed anxiety (72.7%), depression
traumatic stress disorder (PTSD) at the time of the survey. (68.8%), or PTSD (88.0%) at the time of the survey.
Comparisons within subgroups were evaluated using Poisson Prevalences of symptoms of adverse mental or behavioral
regressions with robust standard errors to calculate prevalence health conditions varied significantly among subgroups
ratios, 95% confidence intervals (CIs), and p-values to evaluate (Table 2). Suicidal ideation was more prevalent among males
statistical significance (a = 0.005 to account for multiple com- than among females. Symptoms of anxiety disorder or depressive
parisons). Among the 1,497 respondents who completed all disorder, COVID-19–related TSRD, initiation of or increase
three surveys, longitudinal analyses of the odds of incidence**** in substance use to cope with COVID-19–associated stress,
of symptoms of adverse mental or behavioral health conditions and serious suicidal ideation in the previous 30 days were most
by essential worker and unpaid adult caregiver status were commonly reported by persons aged 18–24 years; prevalence
conducted on unweighted responses using logistic regressions decreased progressively with age. Hispanic respondents reported
to calculate unadjusted and adjusted†††† odds ratios (ORs), higher prevalences of symptoms of anxiety disorder or depressive
95% CI, and p-values (a = 0.05). The statsmodels package disorder, COVID-19–related TSRD, increased substance use,
in Python (version 3.7.8; Python Software Foundation) was and suicidal ideation than did non-Hispanic whites (whites) or
used to conduct all analyses. non-Hispanic Asian (Asian) respondents. Black respondents
Overall, 40.9% of 5,470 respondents who completed surveys reported increased substance use and past 30-day serious consid-
during June reported an adverse mental or behavioral health eration of suicide in the previous 30 days more commonly than
condition, including those who reported symptoms of anxiety did white and Asian respondents. Respondents who reported
disorder or depressive disorder (30.9%), those with TSRD symp- treatment for diagnosed anxiety, depression, or PTSD at the
toms related to COVID-19 (26.3%), those who reported having time of the survey reported higher prevalences of symptoms
§§§
of adverse mental and behavioral health conditions compared
For this survey, substance use was defined as use of “alcohol, legal or illegal
drugs, or prescriptions drugs that are taken in a way not recommended by with those who did not. Symptoms of a COVID-19–related
your doctor.” Questions regarding substance use and suicidal ideation were TSRD, increased substance use, and suicidal ideation were more
included in the May and June surveys only. Participants were informed prevalent among employed than unemployed respondents, and
that responses were deidentified and that direct support could not be
provided to those who reported substance use behavior or suicidal ideation. among essential workers than nonessential workers. Adverse
Regarding substance use, respondents were provided the following: “This conditions also were more prevalent among unpaid caregivers for
survey is anonymous so we cannot provide direct support. If you would adults than among those who were not, with particularly large
like crisis support please contact the Substance Abuse and Mental Health
Services Administration National Helpline, 1-800-662-HELP (4357), (also differences in increased substance use (32.9% versus 6.3%) and
known as the Treatment Referral Routing Service) or TTY: 1-800-487-4889. suicidal ideation (30.7% versus 3.6%) in this group.
This is a confidential, free, 24-hour-a-day, 365-day-a-year, information
service, in English and Spanish, for persons and family members facing
Longitudinal analysis of responses of 1,497 persons who com-
mental and/or substance use disorders.” Regarding suicidal ideation, pleted all three surveys revealed that unpaid caregivers for adults
respondents were provided the following: “This survey is anonymous so had a significantly higher odds of incidence of adverse mental
we cannot provide direct support. If you would like crisis support please
contact the National Suicide Prevention Lifeline, 1-800-273-TALK (8255, health conditions compared with others (Table 3). Among those
or chat line) for help for themselves or others.” who did not report having started or increased substance use to
¶¶¶ Rural-urban classification was determined by using self-reported ZIP codes
cope with stress or emotions related to COVID-19 in May, unpaid
according to the Federal Office of Rural Health Policy definition of rurality.
https://www.hrsa.gov/rural-health/about-us/definition/datafiles.html. caregivers for adults had 3.33 times the odds of reporting this
**** Odds of incidence was defined as the odds of the presence of an adverse behavior in June (adjusted OR 95% CI = 1.75–6.31; pMorbidity and Mortality Weekly Report
TABLE 1. Respondent characteristics and prevalence of adverse mental health outcomes, increased substance use to cope with stress or
emotions related to COVID-19 pandemic, and suicidal ideation — United States, June 24–30, 2020
Weighted %*
All respondents Conditions Started or increased ≥1 adverse
who completed substance use Seriously mental or
surveys during Anxiety or to cope with considered behavioral
June 24–30, 2020 Anxiety Depressive depressive COVID-19– pandemic-related stress suicide in health
Characteristic weighted* no. (%) disorder† disorder† disorder† related TSRD§ or emotions¶ past 30 days symptom
All respondents 5,470 (100) 25.5 24.3 30.9 26.3 13.3 10.7 40.9
Gender
Female 2,784 (50.9) 26.3 23.9 31.5 24.7 12.2 8.9 41.4
Male 2,676 (48.9) 24.7 24.8 30.4 27.9 14.4 12.6 40.5
Other 10 (0.2) 20.0 30.0 30.0 30.0 10.0 0.0 30.0
Age group (yrs)
18–24 731 (13.4) 49.1 52.3 62.9 46.0 24.7 25.5 74.9
25–44 1,911 (34.9) 35.3 32.5 40.4 36.0 19.5 16.0 51.9
45–64 1,895 (34.6) 16.1 14.4 20.3 17.2 7.7 3.8 29.5
≥65 933 (17.1) 6.2 5.8 8.1 9.2 3.0 2.0 15.1
Race/Ethnicity
White, 3,453 (63.1) 24.0 22.9 29.2 23.3 10.6 7.9 37.8
non-Hispanic
Black, 663 (12.1) 23.4 24.6 30.2 30.4 18.4 15.1 44.2
non-Hispanic
Asian, 256 (4.7) 14.1 14.2 18.0 22.1 6.7 6.6 31.9
non-Hispanic
Other race or 164 (3.0) 27.8 29.3 33.2 28.3 11.0 9.8 43.8
multiple races,
non-Hispanic**
Hispanic, any 885 (16.2) 35.5 31.3 40.8 35.1 21.9 18.6 52.1
race(s)
Unknown 50 (0.9) 38.0 34.0 44.0 34.0 18.0 26.0 48.0
2019 Household income (USD)Morbidity and Mortality Weekly Report
TABLE 1. (Continued) Respondent characteristics and prevalence of adverse mental health outcomes, increased substance use to cope with
stress or emotions related to COVID-19 pandemic, and suicidal ideation — United States, June 24–30, 2020
Weighted %*
All respondents Conditions Started or increased ≥1 adverse
who completed substance use Seriously mental or
surveys during Anxiety or to cope with considered behavioral
June 24–30, 2020 Anxiety Depressive depressive COVID-19– pandemic-related stress suicide in health
Characteristic weighted* no. (%) disorder† disorder† disorder† related TSRD§ or emotions¶ past 30 days symptom
Know someone who had positive test results for SARS-CoV-2
Yes 1,109 (20.3) 23.8 21.9 29.6 21.5 12.9 7.5 39.2
No 4,361 (79.7) 26.0 25.0 31.3 27.5 13.4 11.5 41.3
Knew someone who died from COVID-19
Yes 428 (7.8) 25.8 20.6 30.6 28.1 11.3 7.6 40.1
No 5,042 (92.2) 25.5 24.7 31.0. 26.1 13.4 10.9 41
Receiving treatment for previously diagnosed condition
Anxiety
Yes 536 (9.8) 59.6 52.0 66.0 51.9 26.6 23.6 72.7
No 4,934 (90.2) 21.8 21.3 27.1 23.5 11.8 9.3 37.5
Depression
Yes 540 (9.9) 52.5 50.6 60.8 45.5 25.2 22.1 68.8
No 4,930 (90.1) 22.6 21.5 27.7 24.2 12.0 9.4 37.9
Posttraumatic stress disorder
Yes 251 (4.6) 72.3 69.1 78.7 69.4 43.8 44.8 88
No 5,219 (95.4) 23.3 22.2 28.6 24.2 11.8 9.0 38.7
Abbreviations: COVID-19 = coronavirus disease 2019; TSRD = trauma- or stress-related disorder.
* Survey weighting was employed to improve the cross-sectional June cohort representativeness of the U.S. population by gender, age, and race/ethnicity according
to the 2010 U.S. Census with respondents in which gender, age, and race/ethnicity were reported. Respondents who reported a gender of “Other” or who did not
report race/ethnicity were assigned a weight of one.
† Symptoms of anxiety disorder and depressive disorder were assessed via the four-item Patient Health Questionnaire (PHQ-4). Those who scored ≥3 out of 6 on
the Generalized Anxiety Disorder (GAD-2) and Patient Health Questionnaire (PHQ-2) subscales were considered symptomatic for each disorder, respectively.
§ Disorders classified as TSRDs in the Diagnostic and Statistical Manual of Mental Disorders (DSM–5) include posttraumatic stress disorder (PTSD), acute stress disorder
(ASD), and adjustment disorders (ADs), among others. Symptoms of a TSRD precipitated by the COVID-19 pandemic were assessed via the six-item Impact of Event
Scale (IES-6) to screen for overlapping symptoms of PTSD, ASD, and ADs. For this survey, the COVID-19 pandemic was specified as the traumatic exposure to record
peri- and posttraumatic symptoms associated with the range of stressors introduced by the COVID-19 pandemic. Those who scored ≥1.75 out of 4 were
considered symptomatic.
¶ 104 respondents selected “Prefer not to answer.”
** The Other race or multiple races, non-Hispanic category includes respondents who identified as not being Hispanic and as more than one race or as American Indian
or Alaska Native, Native Hawaiian or Pacific Islander, or “Other.”
†† Essential worker status was self-reported. The comparison was between employed respondents (n = 3,431) who identified as essential vs. nonessential. For this
analysis, students who were not separately employed as essential workers were considered nonessential workers.
§§ Unpaid adult caregiver status was self-reported. The definition of an unpaid caregiver for adults was a person who had provided unpaid care to a relative or friend
aged ≥18 years to help them take care of themselves at any time in the last three months. Examples provided included helping with personal needs, household
chores, health care tasks, managing a person’s finances, taking them to a doctor’s appointment, arranging for outside services, and visiting regularly to see how
they are doing.
¶¶ Region classification was determined by using the U.S. Census Bureau’s Census Regions and Divisions of the United States. https://www2.census.gov/geo/pdfs/
maps-data/maps/reference/us_regdiv.pdf.
*** Rural-urban classification was determined by using self-reported ZIP codes according to the Federal Office of Rural Health Policy definition of rurality. https://
www.hrsa.gov/rural-health/about-us/definition/datafiles.html.
Discussion reported symptoms of a TSRD related to the pandemic, and
Elevated levels of adverse mental health conditions, substance approximately one in 10 reported that they started or increased
use, and suicidal ideation were reported by adults in the United substance use because of COVID-19. Suicidal ideation was also
States in June 2020. The prevalence of symptoms of anxiety elevated; approximately twice as many respondents reported
disorder was approximately three times those reported in the serious consideration of suicide in the previous 30 days than did
second quarter of 2019 (25.5% versus 8.1%), and prevalence of adults in the United States in 2018, referring to the previous
depressive disorder was approximately four times that reported in 12 months (10.7% versus 4.3%) (6).
the second quarter of 2019 (24.3% versus 6.5%) (2). However, Mental health conditions are disproportionately affecting
given the methodological differences and potential unknown specific populations, especially young adults, Hispanic per-
biases in survey designs, this analysis might not be directly sons, black persons, essential workers, unpaid caregivers for
comparable with data reported on anxiety and depression dis- adults, and those receiving treatment for preexisting psychiatric
orders in 2019 (2). Approximately one quarter of respondents conditions. Unpaid caregivers for adults, many of whom are
currently providing critical aid to persons at increased risk
US Department of Health and Human Services/Centers for Disease Control and Prevention MMWR / August 14, 2020 / Vol. 69 / No. 32 1053Morbidity and Mortality Weekly Report
TABLE 2. Comparison of symptoms of adverse mental health outcomes among all respondents who completed surveys (N = 5,470), by respondent
characteristic* — United States, June 24–30, 2020
Prevalence ratio¶ (95% CI¶)
Symptoms of anxiety Started or increased substance use
disorder or depressive Symptoms of a TSRD to cope with stress or emotions Serious consideration
Characteristic disorder† related to COVID-19§ related to COVID-19 of suicide in past 30 days
Gender
Female vs. male 1.04 (0.96–1.12) 0.88 (0.81–0.97) 0.85 (0.75–0.98) 0.70 (0.60–0.82)**
Age group (yrs)
18–24 vs. 25–44 1.56 (1.44–1.68)** 1.28 (1.16–1.41)** 1.31 (1.12–1.53)** 1.59 (1.35–1.87)**
18–24 vs. 45–64 3.10 (2.79–3.44)** 2.67 (2.35–3.03)** 3.35 (2.75–4.10)** 6.66 (5.15–8.61)**
18–24 vs. ≥65 7.73 (6.19–9.66)** 5.01 (4.04–6.22)** 8.77 (5.95–12.93)** 12.51 (7.88–19.86)**
25–44 vs. 45–64 1.99 (1.79–2.21)** 2.09 (1.86–2.35)** 2.56 (2.14–3.07)** 4.18 (3.26–5.36)**
25–44 vs. ≥65 4.96 (3.97–6.20)** 3.93 (3.18–4.85)** 6.70 (4.59–9.78)** 7.86 (4.98–12.41)**
45–64 vs. ≥65 2.49 (1.98–3.15)** 1.88 (1.50–2.35)** 2.62 (1.76–3.9)** 1.88 (1.14–3.10)
Race/Ethnicity††
Hispanic vs. non-Hispanic black 1.35 (1.18–1.56)** 1.15 (1.00–1.33) 1.19 (0.97–1.46) 1.23 (0.98–1.55)
Hispanic vs. non-Hispanic Asian 2.27 (1.73–2.98)** 1.59 (1.24–2.04)** 3.29 (2.05–5.28)** 2.82 (1.74–4.57)**
Hispanic vs. non-Hispanic other race 1.23 (0.98–1.55) 1.24 (0.96–1.61) 1.99 (1.27–3.13)** 1.89 (1.16–3.06)
or multiple races
Hispanic vs. non-Hispanic white 1.40 (1.27–1.54)** 1.50 (1.35–1.68)** 2.09 (1.79–2.45)** 2.35 (1.96–2.80)**
Non-Hispanic black vs. 1.68 (1.26–2.23)** 1.38 (1.07–1.78) 2.75 (1.70–4.47)** 2.29 (1.39–3.76)**
non-Hispanic Asian
Non-Hispanic black vs. non-Hispanic 0.91 (0.71–1.16) 1.08 (0.82–1.41) 1.67 (1.05–2.65) 1.53 (0.93–2.52)
other race or multiple races
Non-Hispanic black vs. 1.03 (0.91–1.17) 1.30 (1.14–1.48)** 1.75 (1.45–2.11)** 1.90 (1.54–2.36)**
non-Hispanic white
Non-Hispanic Asian vs. non-Hispanic 0.54 (0.39–0.76)** 0.78 (0.56–1.09) 0.61 (0.32–1.14) 0.67 (0.35–1.29)
other race or multiple races
Non-Hispanic Asian vs. 0.62 (0.47–0.80)** 0.95 (0.74–1.20) 0.64 (0.40–1.02) 0.83 (0.52–1.34)
non-Hispanic white
Non-Hispanic other race or multiple 1.14 (0.91–1.42) 1.21 (0.94–1.56) 1.05 (0.67–1.64) 1.24 (0.77–2)
races vs. non-Hispanic white
See table footnotes on the next page.
for severe illness from COVID-19, had a higher incidence of generalizability. However, standardized quality and data inclu-
adverse mental and behavioral health conditions compared sion screening procedures, including algorithmic analysis of
with others. Although unpaid caregivers of children were not click-through behavior, removal of duplicate responses and
evaluated in this study, approximately 39% of unpaid caregivers scrubbing methods for web-based panel quality were applied.
for adults shared a household with children (compared with Further the prevalence of symptoms of anxiety disorder and
27% of other respondents). Caregiver workload, especially in depressive disorder were largely consistent with findings from
multigenerational caregivers, should be considered for future the Household Pulse Survey during June (1).
assessment of mental health, given the findings of this report Markedly elevated prevalences of reported adverse men-
and hardships potentially faced by caregivers. tal and behavioral health conditions associated with the
The findings in this report are subject to at least four limi- COVID-19 pandemic highlight the broad impact of the
tations. First, a diagnostic evaluation for anxiety disorder or pandemic and the need to prevent and treat these conditions.
depressive disorder was not conducted; however, clinically Identification of populations at increased risk for psychological
validated screening instruments were used to assess symptoms. distress and unhealthy coping can inform policies to address
Second, the trauma- and stressor-related symptoms assessed health inequity, including increasing access to resources for
were common to multiple TSRDs, precluding distinction clinical diagnoses and treatment options. Expanded use of
among them; however, the findings highlight the impor- telehealth, an effective means of delivering treatment for mental
tance of including COVID-19–specific trauma measures health conditions, including depression, substance use disorder,
to gain insights into peri- and posttraumatic impacts of the and suicidal ideation (8), might reduce COVID-19-related
COVID-19 pandemic (7). Third, substance use behavior mental health consequences. Future studies should identify
was self-reported; therefore, responses might be subject to drivers of adverse mental and behavioral health during the
recall, response, and social desirability biases. Finally, given COVID-19 pandemic and whether factors such as social iso-
that the web-based survey might not be fully representative lation, absence of school structure, unemployment and other
of the United States population, findings might have limited financial worries, and various forms of violence (e.g., physical,
1054 MMWR / August 14, 2020 / Vol. 69 / No. 32 US Department of Health and Human Services/Centers for Disease Control and PreventionMorbidity and Mortality Weekly Report
TABLE 2. (Continued) Comparison of symptoms of adverse mental health outcomes among all respondents who completed surveys (N = 5,470),
by respondent characteristic* — United States, June 24–30, 2020
Prevalence ratio¶ (95% CI¶)
Symptoms of anxiety Started or increased substance use
disorder or depressive Symptoms of a TSRD to cope with stress or emotions Serious consideration
Characteristic disorder† related to COVID-19§ related to COVID-19 of suicide in past 30 days
Employment status
Employed vs. unemployed 0.96 (0.87–1.07) 1.28 (1.12–1.46)** 2.30 (1.78–2.98)** 3.21 (2.31–4.47)**
Employed vs. retired 3.01 (2.58–3.51)** 2.84 (2.42–3.34)** 4.30 (3.28–5.63)** 5.97 (4.20–8.47)**
Unemployed vs. retired 3.12 (2.63–3.71)** 2.21 (1.82–2.69)** 1.87 (1.30–2.67)** 1.86 (1.16–2.96)
Essential vs. nonessential worker§§ 1.42 (1.30–1.56)** 1.52 (1.38–1.69)** 2.36 (2.00–2.77)** 2.76 (2.29–3.33)**
Unpaid caregiver for adults vs. not¶¶` 2.55 (2.37–2.75)** 2.63 (2.42–2.86)** 5.28 (4.59–6.07)** 8.64 (7.23–10.33)**
Rural vs. urban residence*** 0.94 (0.82–1.07) 0.96 (0.83–1.11) 0.84 (0.67–1.06) 0.95 (0.74–1.22)
Knows someone with positive 0.95 (0.86–1.05) 0.78 (0.69–0.88)** 0.96 (0.81–1.14) 0.65 (0.52–0.81)**
SARS-CoV-2 test result vs. not
Knew someone who died from 0.99 (0.85–1.15) 1.08 (0.92–1.26) 0.84 (0.64–1.11) 0.69 (0.49–0.97)
COVID-19 vs. not
Receiving treatment for anxiety vs. not 2.43 (2.26–2.63)** 2.21 (2.01–2.43)** 2.27 (1.94–2.66)** 2.54 (2.13–3.03)**
Receiving treatment for depression 2.20 (2.03–2.39)** 1.88 (1.70–2.09)** 2.13 (1.81–2.51)** 2.35 (1.96–2.82)**
vs. not
Receiving treatment for PTSD vs. not 2.75 (2.55–2.97)** 2.87 (2.61–3.16)** 3.78 (3.23–4.42)** 4.95 (4.21–5.83)**
Abbreviations: CI = confidence interval; COVID-19 = coronavirus disease 2019; PTSD = posttraumatic stress disorder; TSRD = trauma- or stress-related disorder.
* Number of respondents for characteristics: gender (female = 2,784, male = 2,676), age group in years (18–24 = 731; 25–44 = 1,911; 45–64 = 1,895; ≥65 = 933), race/
ethnicity (non-Hispanic white = 3453, non-Hispanic black = 663, non-Hispanic Asian = 256, non-Hispanic other race or multiple races = 164, Hispanic = 885).
† Symptoms of anxiety disorder and depressive disorder were assessed via the four-item Patient Health Questionnaire (PHQ-4). Those who scored ≥3 out of 6 on
the Generalized Anxiety Disorder (GAD-2) and Patient Health Questionnaire (PHQ-2) subscales were considered to have symptoms of these disorders.
§ Disorders classified as TSRDs in the Diagnostic and Statistical Manual of Mental Disorders (DSM–5) include PTSD, acute stress disorder (ASD), and adjustment disorders
(ADs), among others. Symptoms of a TSRD precipitated by the COVID-19 pandemic were assessed via the six-item Impact of Event Scale (IES-6) to screen for
overlapping symptoms of PTSD, ASD, and ADs. For this survey, the COVID-19 pandemic was specified as the traumatic exposure to record peri- and posttraumatic
symptoms associated with the range of stressors introduced by the COVID-19 pandemic. Persons who scored ≥1.75 out of 4 were considered to be symptomatic.
¶ Comparisons within subgroups were evaluated on weighted responses via Poisson regressions used to calculate a prevalence ratio, 95% CI, and p-value (not shown).
Statistical significance was evaluated at a threshold of a = 0.005 to account for multiple comparisons. In the calculation of prevalence ratios for started or increased
substance use, respondents who selected “Prefer not to answer” (n = 104) were excluded.
** P-value is statistically significant (pMorbidity and Mortality Weekly Report
TABLE 3. Odds of incidence* of symptoms of adverse mental health, substance use to cope with stress or emotions related to COVID–19
pandemic, and suicidal ideation in the third survey wave, by essential worker status and unpaid adult caregiver status among respondents
who completed monthly surveys from April through June (N = 1,497) — United States, April 2–8, May 5–12, and June 24–30, 2020
Essential worker† vs. all other employment statuses
(nonessential worker, unemployed, retired) Unpaid caregiver for adults§ vs. not unpaid caregiver
Unadjusted Adjusted¶ Unadjusted Adjusted**
Symptom or behavior OR (95% CI)†† p-value†† OR (95% CI)†† p-value†† OR (95% CI)†† p-value†† OR (95% CI)†† p-value††
Symptoms of anxiety disorder§§ 1.92 (1.29–2.87) 0.001 1.63 (0.99–2.69) 0.056 1.97 (1.25–3.11) 0.004 1.81 (1.14–2.87) 0.012
Symptoms of depressive disorder§§ 1.49 (1.00–2.22) 0.052 1.13 (0.70–1.82) 0.606 2.29 (1.50–3.50)Morbidity and Mortality Weekly Report
2. CDC, National Center for Health Statistics. Early release of selected mental
Summary health estimates based on data from the January–June 2019 National Health
What is already known about this topic? Interview Survey. Atlanta, GA: US Department of Health and Human
Services, CDC, National Center for Health Statistics; 2020. https://www.
Communities have faced mental health challenges related to cdc.gov/nchs/data/nhis/earlyrelease/ERmentalhealth-508.pdf
COVID-19–associated morbidity, mortality, and mitigation activities. 3. Czeisler MÉ, Tynan MA, Howard ME, et al. Public attitudes, behaviors,
What is added by this report? and beliefs related to COVID-19, stay-at-home orders, nonessential
business closures, and public health guidance—United States, New York
During June 24–30, 2020, U.S. adults reported considerably City, and Los Angeles, May 5–12, 2020. MMWR Morb Mortal Wkly
elevated adverse mental health conditions associated with Rep 2020;69:751–8. https://doi.org/10.15585/mmwr.mm6924e1
COVID-19. Younger adults, racial/ethnic minorities, essential 4. Löwe B, Wahl I, Rose M, et al. A 4-item measure of depression and
workers, and unpaid adult caregivers reported having experi- anxiety: validation and standardization of the Patient Health
enced disproportionately worse mental health outcomes, Questionnaire-4 (PHQ-4) in the general population. J Affect Disord
increased substance use, and elevated suicidal ideation. 2010;122:86–95. https://doi.org/10.1016/j.jad.2009.06.019
5. Hosey MM, Leoutsakos JS, Li X, et al. Screening for posttraumatic stress
What are the implications for public health practice? disorder in ARDS survivors: validation of the Impact of Event Scale-6 (IES-6).
The public health response to the COVID-19 pandemic should Crit Care 2019;23:276. https://doi.org/10.1186/s13054-019-2553-z
increase intervention and prevention efforts to address 6. Substance Abuse and Mental Health Services Administration. Key substance
associated mental health conditions. Community-level efforts, use and mental health indicators in the United States: results from the
including health communication strategies, should prioritize 2018 National Survey on Drug Use and Health. Rockville, MD: US
Department of Health and Human Services, Substance Abuse and Mental
young adults, racial/ethnic minorities, essential workers, and
Health Services Administration; 2018. https://www.samhsa.gov/data/
unpaid adult caregivers. sites/default/files/cbhsq-reports/NSDUHNationalFindingsReport2018/
NSDUHNationalFindingsReport2018.pdf
administration of the survey in June. No other potential conflicts of 7. Horesh D, Brown AD. Traumatic stress in the age of COVID-19: call to
close critical gaps and adapt to new realities. Psychol Trauma
interest were disclosed. 2020;12:331–5. https://doi.org/10.1037/tra0000592
8. Hailey D, Roine R, Ohinmaa A. The effectiveness of telemental health
References applications: a review. Can J Psychiatry 2008;53:769–78. https://doi.
1. CDC, National Center for Health Statistics. Indicators of anxiety or org/10.1177/070674370805301109
depression based on reported frequency of symptoms during the last 9. Stone D, Holland K, Bartholow B, Crosby A, Davis S, Wilkins N.
7 days. Household Pulse Survey. Atlanta, GA: US Department of Health Preventing suicide: a technical package of policy, programs, and practices.
and Human Services, CDC, National Center for Health Statistics; 2020. Atlanta, GA: US Department of Health and Human Services, CDC,
https://www.cdc.gov/nchs/covid19/pulse/mental-health.htm National Center for Injury Prevention and Control; 2017. https://www.
cdc.gov/violenceprevention/pdf/suicideTechnicalPackage.pdf
US Department of Health and Human Services/Centers for Disease Control and Prevention MMWR / August 14, 2020 / Vol. 69 / No. 32 1057Morbidity and Mortality Weekly Report
Characteristics of Marijuana Use During Pregnancy — Eight States, Pregnancy
Risk Assessment Monitoring System, 2017
Jean Y. Ko, PhD1; Kelsey C. Coy, MPH1,2; Sarah C. Haight, MPH1; Tamara M. Haegerich, PhD3; Letitia Williams, MPH1; Shanna Cox, MSPH1;
Rashid Njai, PhD4; Althea M. Grant, PhD4
Marijuana is the most commonly used illicit substance under each state had a response rate ≥55%. Data were weighted to
federal law in the United States (1); however, many states have adjust for noncoverage and nonresponse and represent the total
legalized medical and adult nonmedical use. Evidence regarding population of women with a live birth in each state in 2017.
the safety and health effects of cannabis use during pregnancy Women were asked “At any time during the 3 months before
is largely inconclusive (2). Potential adverse health effects to you got pregnant or during your most recent pregnancy, did you
exposed infants (e.g., lower birthweight) have been documented use marijuana or hash in any form?” Use before pregnancy was
(2). To provide population-based estimates of use surrounding identified as a frequency greater than “never” to the follow-up
pregnancy, identify reasons for and mode of use, and understand question “During the 3 months before you got pregnant, about
characteristics of women who continue versus cease marijuana how often did you use marijuana products in an average month?”
use during pregnancy, CDC analyzed data from eight states par- Use during pregnancy was identified the same way, from the
ticipating in the 2017 Pregnancy Risk Assessment Monitoring question “During your most recent pregnancy, about how often
System (PRAMS) marijuana supplement. Overall, 9.8% of did you use marijuana products in an average month?” Women
women self-reported marijuana use before pregnancy, 4.2% during who indicated marijuana use in both periods were defined as
pregnancy, and 5.5% after pregnancy. The most common reasons having continued use, whereas those who used before pregnancy
for use during pregnancy were to relieve stress or anxiety, nausea and ceased during pregnancy were defined as having ceased use.
or vomiting, and pain. Smoking was the most common mode Women who indicated “yes” to the question “Since your new
of use. In multivariable models that included age, race/ethnicity, baby was born, have you used marijuana or hash in any form?”
marital status, education, insurance status, parity, trimester of were defined as using marijuana after pregnancy. Women who
entry into prenatal care, and cigarette and e-cigarette use during self-reported use during pregnancy indicated the reason or rea-
pregnancy, women who continued versus ceased marijuana use sons (to relieve nausea or vomiting; stress or anxiety; symptoms
during pregnancy were more likely to be non-Hispanic white or of a chronic condition; pain; to have fun or relax; and other) and
other race/ethnicity than non-Hispanic black, be unmarried, have mode or modes (smoking; eating; drinking; vaporizing; dabbing;
≤12 years of education, and use cigarettes during pregnancy. The or other) of using marijuana during pregnancy. More than one
American College of Obstetricians and Gynecologists (ACOG) option could be chosen. Qualitative thematic coding categorized
and the American Academy of Pediatrics (AAP) recommend “other” responses; written responses of mental health conditions
refraining from marijuana use during pregnancy and lactation were recoded as relieving stress or anxiety and written responses
(3,4). Given the increasing number of states legalizing medical of poor appetite or weight loss were recoded as relieving nausea or
and adult nonmedical marijuana use, surveillance of perinatal vomiting. Remaining responses were retained as other. Weighted
marijuana use can inform clinical guidance, provider and patient prevalence estimates and 95% confidence intervals (CIs) were
education, and public health programs to support evidence-based calculated overall and by state using SUDAAN (version 11.0;
approaches to addressing substance use. RTI International). Among women who used marijuana in
PRAMS is a state-specific, population-based surveillance the 3 months before pregnancy, chi-squared tests were used to
system designed to monitor self-reported behaviors and expe- compare characteristics of women who continued versus ceased
riences before, during, and after pregnancy among women marijuana use during pregnancy, including age, race/ethnicity,
who have had a recent live birth. In each participating state, a marital status, education, insurance status, parity, trimester of
monthly stratified systematic sample of women with recent live entry into prenatal care, and cigarette and e-cigarette use during
births is selected from birth certificate records and surveyed by pregnancy. Adjusted prevalence ratios (aPRs) were calculated
mail or telephone 2–6 months after delivery.* Supplementary to describe associations between continued versus ceased use
questions about marijuana use were asked in eight states in pregnancy and maternal characteristics. P-valuesMorbidity and Mortality Weekly Report
FIGURE 1. Prevalence* of marijuana use before, during, and after pregnancy (N = 6,236)† — eight states, Pregnancy Risk Assessment Monitoring
System (PRAMS), 2017§,¶
100
Use before pregnancy
Use during pregnancy
Use after pregnancy
25
Percentage using marijuana
20
15
10
5
0
Total Alaska Illinois Maine New Mexico New York North Dakota Pennsylvania West Virginia
States
* Age-standardized prevalence estimates were also calculated but did not differ meaningfully from unadjusted results.
† A total of 6,236 unique women had data on use before (n = 5,802), during (n = 5,805), and after pregnancy (n = 5,720).
§ Postpartum use estimates are not available for North Dakota.
¶ Marijuana legalization status as of 2017: medical and adult nonmedical use for Alaska and Maine; medical use for Illinois, New Mexico, New York, North Dakota,
Pennsylvania, and West Virginia. In North Dakota and West Virginia, medical use of marijuana was legalized in 2017, but enactment might not have occurred by the
time of PRAMS data collection.
and after pregnancy were 9.8%, 4.2%, and 5.5%, respectively use during pregnancy were more likely to be non-Hispanic
(Figure 1). Estimates also varied by state, ranging from 8.4% white (aPR = 1.8; 95% CI = 1.1–3.2) or other race/ethnicity
in New York to 21.2% in Maine before pregnancy, 2.6% in (aPR = 2.5; 95% CI = 1.4–4.5) compared with non-Hispanic
New York to 12.1% in Maine during pregnancy, and 4.4% in black, to be unmarried (aPR = 1.7; 95% CI = 1.1–2.6), have
Illinois to 15.9% in Maine after pregnancy. Among 413 women 12 years of education, and to have used cigarettes
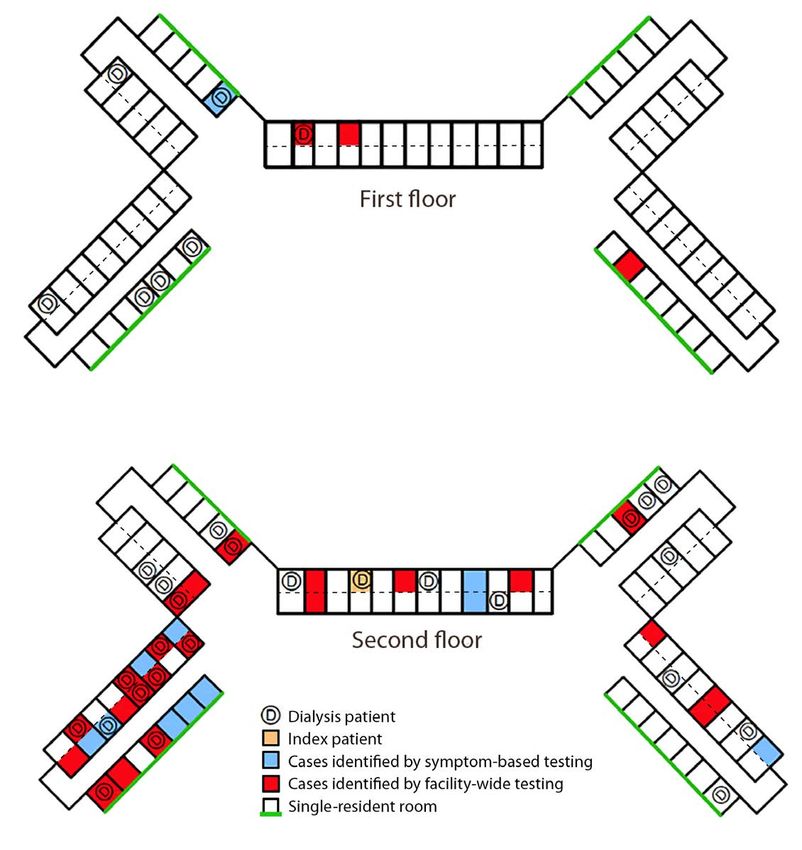
or anxiety (81.5%), nausea or vomiting (77.8%), and pain during pregnancy (aPR = 1.6; 95% CI = 1.2–2.3).
(55.1%) (Figure 2). Additional reported reasons included to
Discussion
have fun or relax (45.7%), relieve symptoms of a chronic con-
dition (24.9%), and other (5.1%). The most common mode Among women in eight states who had a recent live birth,
of marijuana use during pregnancy was smoking (91.0%); 9.8% reported using marijuana before pregnancy, 4.2% during
less frequently reported were eating (12.1%), vaporizing pregnancy, and 5.5% after pregnancy. The observed prevalence
(7.1%), dabbing (4.5%), drinking (0.5%), and other (0.5%) during pregnancy is similar to 2018 estimates from a national
modes. Among 765 women for whom data were available on population-based survey, which found that 4.7% of pregnant
marijuana use before and during pregnancy, 41.2% contin- † Table6.18B, Substance Abuse and Mental Health Services Administration’s
ued use, and 58.8% ceased use during pregnancy (Table). In Results from the 2017 National Survey On Drug Use and Health. https://www.
multivariable analysis, women who continued versus ceased samhsa.gov/data/sites/default/files/cbhsq-reports/NSDUHDetailedTabs2017/
NSDUHDetailedTabs2017.pdf.
US Department of Health and Human Services/Centers for Disease Control and Prevention MMWR / August 14, 2020 / Vol. 69 / No. 32 1059Morbidity and Mortality Weekly Report
FIGURE 2. Reasons for marijuana use during pregnancy*,†,§ (N = 413) — eight states,¶ Pregnancy Risk Assessment Monitoring System, 2017
To relieve stress/anxiety
To relieve nausea/vomiting
Reasons for use
To relieve pain
To have fun/relax
To relieve symptoms of a chronic condition
Other
0 10 20 30 40 50 60 70 80 90 100
Percentage reporting reason for use
* Among 418 women who used marijuana during pregnancy, five did not provide a response to reasons for use. More than one reason for use could be chosen.
† To relieve stress/anxiety also includes written-in responses of to relieve “depression,” “anxiety,” “posttraumatic stress disorder,” “bipolar disorder,” and
“conversion disorder.”
§ To relieve nausea/vomiting also includes written-in responses of “to increase appetite,” “to be able to eat,” and “to gain weight.”
¶ Alaska, Illinois, Maine, New Mexico, New York, North Dakota, Pennsylvania, and West Virginia.
women used marijuana in the preceding 30 days.† The most pregnant women who continue to use marijuana than among
common mode of marijuana use among those in the PRAMS those who cease use during pregnancy (8). Further, among
sample was smoking, which is similar to findings from women pregnant women who reported drinking alcohol in the preced-
attending prenatal care at two California medical centers (5). ing 30 days, tobacco and marijuana were also commonly used
The most common reasons for use during pregnancy were (9). ACOG, AAP, and the United States Preventive Service Task
to relieve stress or anxiety, nausea or vomiting, and pain. Force recommend universal verbal screening during pregnancy
In a qualitative study, women who used marijuana during to identify substance use (including marijuana) and provide
pregnancy reported that it helped them with nausea and opportunity for treatment when indicated (3,4,10).
appetite changes or improved their mood (6). Marijuana was ACOG and AAP recommend discontinuation of marijuana
also described by those women as natural and safe compared use during pregnancy and lactation because of insufficient preg-
with other substances, including prescribed medications (6). nancy- and lactation-specific safety data (3,4). These guidelines
In a national sample, approximately 70% of pregnant women also recommend that marijuana used for medicinal purposes be
perceived slight or no risk of harm from using marijuana once discontinued during pregnancy in favor of alternative therapies
or twice a week (7). Among pregnant women who continued with better pregnancy-specific safety data (3,4). Marijuana is
to use marijuana during pregnancy, 26% perceived it as harm- not currently regulated in the same manner as pharmaceuticals.
ful, whereas 75% of women who ceased use during pregnancy Thus, even in states with comprehensive medical laws, plant-
perceived it as harmful (8). In this analysis, after controlling for derived cannabis products might not have accurate dosing or
other factors, women who continued versus ceased use during content labels. Given the limited evidence surrounding the
pregnancy were more likely to be non-Hispanic white or other treatment effectiveness of marijuana, including a full under-
race/ethnicity than non-Hispanic black, be unmarried, have standing of potential harms during pregnancy, physicians and
≤12 years of education, and use cigarettes during pregnancy. patients should discuss evidence-based pharmacologic and
Co-use of tobacco has been documented among pregnant nonpharmacologic treatments during pregnancy.
women using marijuana (7) and is more likely to occur among
1060 MMWR / August 14, 2020 / Vol. 69 / No. 32 US Department of Health and Human Services/Centers for Disease Control and PreventionMorbidity and Mortality Weekly Report
TABLE. Maternal characteristics by marijuana use and cessation during pregnancy among women who used marijuana before pregnancy –
eight states,* Pregnancy Risk Assessment Monitoring System (PRAMS), 2017
Marijuana use status during pregnancy
weighted % (95% CI)
Prepregnancy use Continuous use Cease use
Maternal characteristic weighted % (95% CI) (n = 765)† (n = 410)† (n = 355)† aPR§ (95% CI)
Total — 41.2 (35.1–47.6) 58.8 (52.4–64.9) —
Age group, yrsMorbidity and Mortality Weekly Report
The findings in this report are subject to at least four limita-
Summary
tions. First, although data are state-specific population-based
What is already known about this topic?
estimates of women who had live births in the eight states
included in this report, these findings are not generalizable to Marijuana is an illicit substance under federal law; however, many
states have legalized medical and nonmedical adult use. The
populations in other states. Second, marijuana use was self- American College of Obstetricians and Gynecologists and the
reported and might be biased because of social desirability and American Academy of Pediatrics recommend refraining from
reporting requirements for substance use during pregnancy,§ marijuana use during pregnancy and lactation because evidence
as well as state legalization status of marijuana.¶ At the time on safety and health effects are inconclusive or insufficient.
of data collection in 2017, medical and adult nonmedical What is added by this report?
marijuana use was legal in Alaska and Maine, and medical use Overall, 9.8% of women reported marijuana use before
was legal in Illinois, New Mexico, New York, North Dakota, pregnancy, 4.2% during pregnancy, and 5.5% after pregnancy.
Pennsylvania, and West Virginia.** Third, written-in responses The most frequently reported reasons for marijuana use during
for other reasons of use were recoded to predetermined response pregnancy were to relieve stress or anxiety, nausea or vomiting,
and pain.
options but might not be reflective of respondents’ intent.
Finally, dependence on marijuana as a reason for use was not What are the implications for public health practice?
captured in this data source; in a national survey, 18.1% of Continuous surveillance of marijuana use in the perinatal period
can inform clinical guidance, provider and patient education,
pregnant women who used marijuana in the past-year met
and public health programs to support evidence-based
criteria for abuse or dependence (7). approaches to addressing substance use.
Given the increasing number of states legalizing medical and
nonmedical use of marijuana, surveillance of marijuana use
References
in the perinatal period can inform clinical guidance, provider
1. Substance Abuse and Mental Health Services Administration. Key
and patient education, and public health programs. Further substance use and mental health indicators in the United States: results
monitoring of frequency, mode, and reasons for marijuana use from the 2018 National Survey on Drug Use and Health. Rockville,
during pregnancy could help characterize its use and inform MD: US Department of Health and Human Services, Center for
research on adverse outcomes and prevention. Robust data are Behavioral Health Statistics and Quality, Substance Abuse and Mental
Health Services Administration; 2019. https://www.samhsa.gov/data/
needed to inform effective policy and public health initiatives sites/default/files/cbhsq-reports/NSDUHNationalFindingsReport2018/
in the context of state legalization status. Provider education NSDUHNationalFindingsReport2018.pdf
on evidence-based approaches for substance use screening 2. National Academies of Sciences, Engineering, and Medicine. The health
effects of cannabis and cannabinoids: current state of evidence and
during pregnancy and subsequent patient-provider discussions recommendations for research. Washington, DC: The National Academies
regarding common reasons for marijuana use during pregnancy Press; 2017.
might improve clinical care. Continued public education on 3. American College of Obstetricians and Gynecologists Committee on
Obstetric Practice. Committee opinion no. 722: marijuana use during
the available science regarding the benefits and harms of can- pregnancy and lactation. Obstet Gynecol 2017;130:e205–9. https://doi.
nabis use overall and during pregnancy is important. org/10.1097/AOG.0000000000002354
4. Ryan SA, Ammerman SD, O’Connor ME; Committee on Substance Use
§ https://www.guttmacher.org/state-policy/explore/substance-use-during-pregnancy. and Prevention; Section on Breastfeeding. Marijuana use during pregnancy
¶ https://www.ncsl.org/research/health/state-medical-marijuana-laws.aspx. and breastfeeding: implications for neonatal and childhood outcomes.
** In North Dakota and West Virginia, medical use of marijuana was legalized in 2017 Pediatrics 2018;142:e20181889A. https://doi.org/10.1542/peds.2018-1889
but enactment might not have occurred by the time of PRAMS data collection. 5. Young-Wolff KC, Adams SR, Wi S, Weisner C, Conway A. Routes of
cannabis administration among females in the year before and during
Acknowledgments pregnancy: results from a pilot project. Addict Behav 2020;100:106125.
States that participated in the Pregnancy Risk Assessment Monitoring https://doi.org/10.1016/j.addbeh.2019.106125
6. Chang JC, Tarr JA, Holland CL, et al. Beliefs and attitudes regarding
System marijuana supplement (Alaska, Illinois, Maine, New Mexico, prenatal marijuana use: perspectives of pregnant women who report use.
New York, North Dakota, Pennsylvania, and West Virginia). Drug Alcohol Depend 2019;196:14–20. https://doi.org/10.1016/j.
Corresponding author: Jean Y. Ko, JeanKo@cdc.gov, 770-488-5200. drugalcdep.2018.11.028
7. Ko JY, Farr SL, Tong VT, Creanga AA, Callaghan WM. Prevalence and
1Division of Reproductive Health, National Center for Chronic Disease patterns of marijuana use among pregnant and nonpregnant women of
Prevention and Health Promotion, CDC; 2Oak Ridge Institute for Science reproductive age. Am J Obstet Gynecol 2015;213:201.e1–10. https://
and Education, Oak Ridge, Tennessee; 3Division of Overdose Prevention, doi.org/10.1016/j.ajog.2015.03.021
National Center for Injury Prevention and Control, CDC; 4Office of the 8. Mark K, Gryczynski J, Axenfeld E, Schwartz RP, Terplan M. Pregnant
Director, Deputy Director for Non Infectious Diseases, CDC. women’s current and intended cannabis use in relation to their views
All authors have completed and submitted the International toward legalization and knowledge of potential harm. J Addict Med
2017;11:211–6. https://doi.org/10.1097/ADM.0000000000000299
Committee of Medical Journal Editors form for disclosure of potential
conflicts of interest. No potential conflicts of interest were disclosed.
1062 MMWR / August 14, 2020 / Vol. 69 / No. 32 US Department of Health and Human Services/Centers for Disease Control and PreventionMorbidity and Mortality Weekly Report 9. England LJ, Bennett C, Denny CH, et al. Alcohol use and co-use of other 10. Krist AH, Davidson KW, Mangione CM, et al.; US Preventive Services substances among pregnant females aged 12–44 years—United States, Task Force. Screening for unhealthy drug use: US Preventive Services 2015–2018. MMWR Morb Mortal Wkly Rep 2020;69:1009–14. https:// Task Force recommendation statement. JAMA 2020;323:2301–9. doi.org/10.15585/mmwr.mm6931a1 https://doi.org/10.1001/jama.2020.8020 US Department of Health and Human Services/Centers for Disease Control and Prevention MMWR / August 14, 2020 / Vol. 69 / No. 32 1063
You can also read