Covid-19 and Carbon Lock-In: Impacts on the Energy transition
←
→
Page content transcription
If your browser does not render page correctly, please read the page content below
IASS STUDY
Institute for Advanced Sustainability Studies (IASS)

Covid-19 and Carbon
Lock-In: Impacts on the
Energy transition
Potsdam, June 2020

Silvia Weko, Laima Eicke, Rainer Quitzow, German
Bersalli, Flávio Lira, Adela Marian, Diana Süsser, Sapan
Thapar, Bing Xue

IASS STUDY
Institute for Advanced Sustainability Studies (IASS)

Covid-19 and Carbon
Lock-In: Impacts on the
Energy Transition
Potsdam, June 2020

Silvia Weko, Laima Eicke, Rainer Quitzow, Germán
Bersalli, Flávio Lira, Adela Marian, Diana Süsser, Sapan
Thapar, Bing Xue
Contents

1.    Introduction ............................................................................................... 4

2.    Key impacts of the pandemic on energy from a global
      perspective................................................................................................ 6

3.    Country cases ......................................................................................... 10

     3.1 United States .................................................................................... 10
        3.1.1 Changes in energy markets: falling demand and
              carbon prices ........................................................................... 10
        3.1.2 Impacts on the energy sector................................................... 12
        3.1.3 Policy response ....................................................................... 12

     3.2 India ................................................................................................. 13
        3.2.1 Impacts on the energy sector................................................... 14
        3.2.2 Policy response ....................................................................... 15

     3.3 China ................................................................................................ 16
        3.3.1 Impacts of the Corona pandemic on energy
              consumption ............................................................................ 16
        3.3.2 Discussions and policy response ............................................. 18

     3.4 Germany .......................................................................................... 19
        3.4.1 Impacts of the Corona pandemic on the power
              market ...................................................................................... 19
        3.4.2 Implications for the energy transition in Germany .................... 21
        3.4.3 Policy responses...................................................................... 21

     3.5 Argentina .......................................................................................... 23
        3.5.1 Large subsidies for a dominant oil and gas sector ................... 23
        3.5.2 Fledgling renewable energy sector threatened by
              the crisis................................................................................... 24
        3.5.3 Strategic integration and spending in a more
              resilient, fairer, and cleaner energy system post-
              crisis ........................................................................................ 25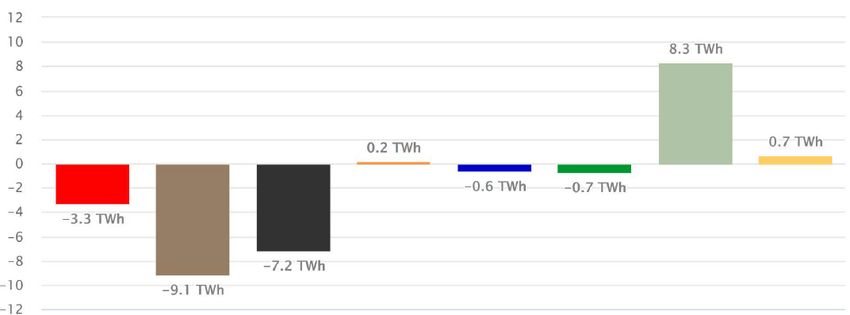
Covid-19 and Carbon Lock-In: Impacts on the Energy Transition
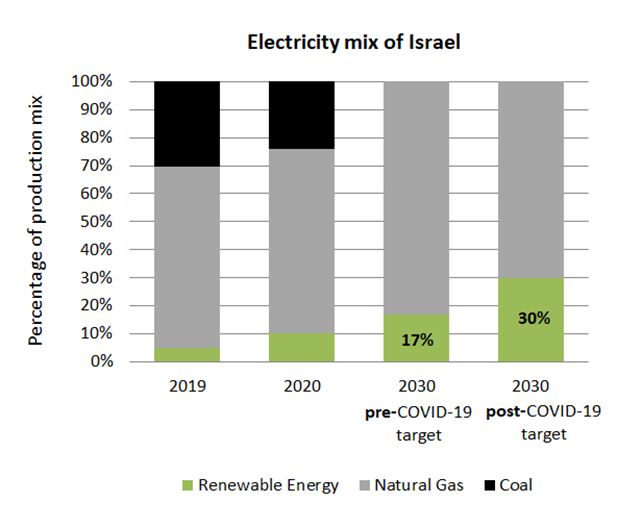
3.6 Israel ................................................................................................ 25
3.6.1 Impact of Covid-19 on the Israeli energy market and
industry .................................................................................... 26
3.6.2 Policy response ....................................................................... 27
3.6.3 Importance of green innovation for Israel’s recovery
from the Covid-19 crisis ........................................................... 28
4. Conclusion .............................................................................................. 30
IASS Study_ 3Covid-19 and Carbon Lock-In: Impacts on the Energy Transition 1. Introduction Around the world, the Covid-19 outbreak has led to shutdowns and decreased energy demand. The economic consequences are also massive, as the world appears to be facing a severe economic reces- sion with potentially stronger effects than the 2008 financial crisis. As countries begin to respond to this recession, policy decisions can influence whether the energy transition accelerates, or if choices will contribute to carbon lock-in. The concept refers to the way in which energy systems have become 'locked in' to a high-carbon path, which is reinforced over time by increasing returns to scale – making changes to these techno-institutional complexes highly costly and difficult. However, it is nevertheless possible for technical and institutional change to occur when there is a shock to the system (Unruh 2002). The economic disruption caused by Covid-19 could open up a window of opportunity for new tech- nologies and ideas. Accordingly, the last major disruption of the status quo, the 2008 financial crisis, led in several countries to 'green recovery' plans and increased investment in clean energy industries; the electric mobility frontrunner Tesla had its beginnings in the US recovery funding and Spanish investment in concentrated solar power advanced technological learning. However, a recession can also result in countries 'doubling down' on high-carbon industries – the German policy response was centered around major support measures for the automotive industry, fostering purchases of gasoline and diesel cars – locking in fossil mobility patterns for these cars' average lifetime of almost two decades. The coronavirus crisis is a double whammy: it has at once drastically lowered energy demand due to lockdowns, and a compounding economic crisis is emerging. Unlike in 2008, some countries also have a relatively high share of cheap renewable energy. How does this combination of factors impact energy mixes, and what role does policy play? This IASS study takes an in-depth look at Covid-19's impacts on the global energy sector, and then zooms in to the country level to see individual country effects and responses. The case studies are compiled by energy researchers on Argentina, China, Germany, India, Israel, and the United States. Despite similar impacts of the corona crisis on energy markets, we expect different national policy responses. This is because the case studies represent different industrial structures and political and social circumstances that may lead to or away from carbon lock-in (see Table 1.1 for a representation of different dynamics). Both the US and Germany have seen a declining importance of the coal industry, and a growing clean energy sector. However, the importance of oil and gas in the US as well as the political situa- tion may make escaping carbon lock-in more difficult there than in Germany, which has reached a consensus on a coal phase-out. Argentina's dominant oil and gas sector is seen as key to the coun- try’s development, and its renewables sector is still relatively small, making a transition in times of crisis less likely. China and India have benefitted from the expansion of renewable energy, but both countries expect increased energy demand in the long term, which may make them reluctant to back away from fossil fuels. The US, China, Israel and India also place high importance on energy securi- ty – and while this may be achieved with renewable energy, countries with local fossil fuel reserves still see these as a security asset. IASS Study_ 4
Covid-19 and Carbon Lock-In: Impacts on the Energy Transition

Table 1.1: Country case studies and factors influencing carbon lock-in

Country                       Importance of        Fossil fuel           RE Share of elec-   Expected energy
                              RE industry          resources             tricity mix         demand to 2050
                                                                         (Worldbank,         (EIA, 2019)
                                                                         2015)
Argentina                     Low                  Oil, gas              10%                 growth
China                         High                 Coal                  12%                 Rapid growth
Germany                       High                 Coal (low)            36%                 stagnation
India                         High                 Coal                  14%                 Rapid growth
Israel                        Medium               Gas                   4%                  growth
USA                           High                 Coal (low), oil, 9%                       stagnation
                                                   gas

The study's comparative approach adds some first empirical insights to the timely discussions on the
design of policy responses in light of the crisis. It highlights learnings from Israel, Germany and, to
some extent, also India and China, which all included measures supporting the renewable energy
sector within their policy responses. Argentina, the US and also China, in turn, run the danger of
becoming even more deeply locked-in into carbon-intensive development pathways. How countries
react to Covid-19 will be decisive for determining whether the global community will accomplish
the Paris Agreement goals in the coming decades.

IASS Study_ 5
Covid-19 and Carbon Lock-In: Impacts on the Energy Transition 2. Key impacts of the pan- demic on energy from a global perspective Flávio Lira and Silvia Weko The global health crisis resulted in lowered energy demand around the world, as industry closures and travel restrictions were implemented. As countries reopen, global energy demand will likely still fall by around 6% this year (IEA, 2020). However, not all fuels have been impacted in the same way. Even as overall demand fell, the demand for renewable energy has increased by around 1.5% in the first quarter of 2020, due in part to its low operating costs: RES made up 13% of overall energy, and 27.5% of the power sector (IEA, 2020). Hydrocarbon production and consumption fell significantly right from the beginning of the Covid-19 pandemic. Early numbers show a general downward trend for natural gas, coal and oil production and consumption, but scenarios for each of these fuels have some peculiarities. A significant part of the available data has been compiled by bodies such as the International Energy Agency (IEA) and country-based official agencies, which provide a clearer picture of specific sectors. Whether or not the drop in fossil fuel production and use will have long- er-term impacts on the world’s energy mix remains to be seen. Renewables So far, the coronavirus pandemic has had mixed effects on the renewable energy sector. While over- all demand for RES has risen, interruptions in financing and supply chains will result in lower instal- lations in the longer term. Firms are already laying off workers, and national governments appear to be slow to react. Although global energy demand is falling, demand for renewable energy has increased by around 1.5% in the first quarter of 2020, due in part to its low operating costs (IEA, 2020). In countries such as Germany where renewable energy is given priority grid dispatch, this resulted in coal being pushed out of the energy mix. Nevertheless, overall falling energy demand in turn impacts pricing schemes for RES installation and carbon emissions. US and European CO2 markets have seen large decreases in the prices per unit of CO2 since the start of the crisis (ICAP, 2020). Lower energy de- mand in systems with large amounts of renewable energy has also resulted in negative power prices in Europe – and revenue losses for power producers overall, RES included (Waldholz, 2020). The health crisis is slowing down the installations of renewable energy, as supply chains are inter- rupted and non-critical infrastructure projects are postponed. Bloomberg New Energy Finance has updated its predictions for the installation of RE in 2020 by 8% less for solar and 12% less for wind. Global supply chains for many different industries have been interrupted by the coronavirus, and clean energy equipment is no exception. Much of the world’s equipment for solar PV is produced in China, which has seen manufacturing shutdowns. In addition to equipment delays, grid connections may also be delayed as many Distribution System Operators (DSOs) are delaying non-critical opera- tions (Energy Community, 2020). Planned projects are facing significant delays around the world, IASS Study_ 6
Covid-19 and Carbon Lock-In: Impacts on the Energy Transition

with 3000MW of solar and wind on hold in India (Mylenka and Novyk, 2020), and as much as
25GW of wind that may not go online in the US because of the crisis, according to wind industry
representatives (Mufson and Grandoni, 2020). A recent Wood Mackenzie report predicted that up to
150GW of renewable energy projects in Asia could be delayed or cancelled until 2024 if the reces-
sion continues (Frangoul, 2020). In the EU as well, countries have postponed auctions for renewable
energy or reduced volumes for forthcoming auctions (Wiegand et al, 2020).

This is in line with the priorities of industry associations, for example the Global Wind Energy
Council, which is currently lobbying for the “extension of crucial policies such as feed-in tariffs, tax
credits, construction deadlines and auction rounds” in response to the crisis (GWEC, 2020). As com-
panies feel the effects of the crisis, major RES players across the value chain are downsizing. Wind
turbine supplier Vestas laid off 400 employees in April and expects further cutbacks if the crisis
continues (Buljan, 2020). Siemens Gamesa, which both manufactures and operates wind turbines,
reported a direct decline in profitability from the coronavirus of €56 million (Siemens, 2020). Vat-
tenfall stated that they will not participate in new RE auctions in order to focus on delivering core
activities (Shumkov, 2020), and Chinese project developer Comtec Solar revealed in its 2019 report
that they expect existing projects to be impacted (Mylenka and Novyk, 2020).

Reactions by national governments to the challenges faced by the RES industry have been mixed so
far. Particularly in Europe, deadlines for construction have been extended. The French Energy Min-
ister has announced that there will be delays in construction and the next call for tenders (Lee, 2020).
Changes in Austria’s Green Energy Law give developers an extra half year of subsidies, and Greece
has extended permit and auction deadlines. Poland, which has in the past seen resistance to any
measures that challenge coal, has reacted to the crisis by allowing RES producers to postpone the
date of their first sale of electricity by up to one year if they face delays in equipment (Rödl & Part-
ner, 2020). India has also responded to developer concerns by extending commissioning deadlines
for new wind farms and by giving developers extensions of the time of the lockdown plus thirty days
on renewable projects.

Coal

The different characteristics of coal use have made it more susceptible to the shocks of lower energy
demand especially where electricity is concerned. Between 2016 and 2018, total coal production
(including steam coal, coke and lignite) ranged between 7,300 and 7,800 Mt (IEA, 2019: 4). In early
2020, coal power use and industrial production have gone down significantly because of the pan-
demic; compared to the first quarter of 2019, global coal demand is expected to fall by 8% in 2020
as coal generation fell by around 10% in the first quarter (IEA, 2020a: 32).

China is by far the world’s largest producer and consumer of coal with around 60% of world output
on a regular basis, as both primary energy and power generation in the country rely heavily on it.
The overall consumption of coal fell by 8% in the country whereas coal power generation fell by
around 9% (IEA, 2020a: 32) coupled with an overall contraction of the economy and industry pro-
duction. Raw coal production in China increased 9.6% y-o-y, reaching 340 million tons, as of March
2020, reversing the declining trend seen from January to February. For the first quarter of 2020 total
raw coal production in China was down 0.5% y-o-y at 830 million tons. Trading prices have contin-
ued to fall, which contributed to higher imports from China in March (up 18.5% y-o-y) and a 28.4%
increase in imports y-o-y (National Bureau of Statistics of China, 2020).

During the first quarter of 2020, India and the United States, the largest coal consumers after China,
have also witnessed a decline in coal consumption. Coal production in the US has seen an overall
decline in the past decade (although not consistently). In the 2018-2019 comparison, production

IASS Study_ 7
Covid-19 and Carbon Lock-In: Impacts on the Energy Transition

went from 756 million short tons (MMst) to 705 MMSt y-o-y, whereas consumption fell from 688
MMst to 587 MMst y-o-y (EIA, 2020b: viii). A milder winter and the abundance of natural gas,
placing downward pressure on prices, has made coal lose terrain in the country during the past year
and the first quarter of 2020. In the EU, demand also fell sharply by more than 20% in the first quar-
ter of 2020 (IEA, 2020a: 33). Coupled with expanding renewables, this fuel’s participation in the
energy mix (particularly in electricity generation) might suffer a long-lasting blow if renewables and
natural gas take on its dominance in historically coal-dominated sectors.

Oil and natural gas

Gas and oil have faced different impacts of coronavirus due to their different uses, as oil is largely
used for transportation and gas is used for electricity generation. Likewise, the structure of the indus-
tries differ in that oil is internationalized and natural gas is more regional (although not as regional as
coal). We see demand for both oil and gas falling due to the pandemic, but the impacts for oil prices
have been far more severe.

Worldwide oil demand has declined heavily mainly due to diminished mobility owing to global
lockdown measures. We have seen both a massive drop in average road transport in the first quarter
and the near halting of air travel in many parts of the globe. Global industry-wide revenue passenger
kilometers (RPKs) fell 52.9% y-o-y in March 2020, the largest decline in recent history (IATA,
2020a); industry-wide cargo tonne kilometers (CTKs) suffered a 15.2% contraction y-o-y in March.
In addition, there was a 22.7% decrease in industry-wide cargo capacity in the same period y-o-y
(IATA, 2020b). This has made for a very complicated scenario for the oil industry. Jet kerosene
demand is predicted to have fallen 1.2 mb/d in the first quarter of 2020 y-o-y, and world gasoline
demand is expected to have fallen 1.7 mb/d and diesel, 1.5 mb/d. As lockdown and other contain-
ment measures have been adopted in several countries falling demand for oil products have spread.
In the first quarter of 2020, oil demand is estimated to have fallen 5.6 mb/d (IEA, 2020a: 19). Global
oil demand in April is expected to be 29 mb/d lower y-o-y whereas global oil supply for the same
month should be down 10.7 mb/d y-o-y (IEA, 2020b).

Prices have fallen accordingly, reaching astonishing lows in the first quarter of 2020. In late April
the WTI price reached negative values for the first time in history (-37.63 USD) (Bloomberg, 2020a)
whereas Brent oil fell to USD 19 per barrel, a 28% decrease month on month and 73% y-o-y
(Bloomberg, 2020b). This price decrease resulted from the failure of Russia and OPEC to agree on
coordinated production cuts to stabilize prices. This group, known informally as OPEC+, gathered in
Vienna in early March 2020 to negotiate a proposed agreement to reduce production by 1.5 mb/d
through the second quarter of 2020 (OPEC, 2020b). After Russia's initial refusal to bear a large share
of this cut, the so-called 2020 oil price war started, radically lowering oil prices. A series of actions
by the Saudi government and Russia (discounts and/or increases in production) have made it hard for
oil prices to pick up significantly again – and ruminations of both Moscow and Riyadh as to how
better manage the shock have not born fruits.

Ironically, this sequence of events has been successful in striking competitors in the US and Canada,
deeply scarring local state/province economies and amounting to difficult problems for both oil in-
dustry workers and the supply chain. These developments cast doubt on the future behavior of the oil
industry, the calculation of break-even prices for traditional and alternative sources of oil (particular-
ly shale) and the ability of oil-dependent countries (both as producers and consumers) to keep their
economy going in face of such uncertainty. In case predictions materialize, global oil supply is ex-
pected to have fallen by 12 mb/d in May after OPEC+ decided on a deal to slash production by “9.7
mb/d, starting on 1 May 2020, for an initial period of two months that concludes on 30 June 2020”
(OPEC, 2020a).

IASS Study_ 8
Covid-19 and Carbon Lock-In: Impacts on the Energy Transition

Policymakers in North America and Eurasia have, therefore, been faced with a conundrum: is it
preferable for stimulus packages to protect and/or somehow revive local oil industries thus hoping
for a return to business as usual (with the same international vulnerabilities that this might entail) or
is it time to make a bolder move towards renewables while trying to factor in oil industry losses?
Conversely, many of the world's oil producing countries might not be able to cope with low prices
for long – mostly due to their economies being heavily dependent on the commodity. There might
not be enough leeway to play the barrel game indefinitely, particularly in light of the current pan-
demic, during which a global economic recession is likely to be lengthy and recovery possibly diffi-
cult. How long such moves by OPEC and non-OPEC members can resist the elephant in the room of
break-even prices remains to be seen.

Compared to oil demand, natural gas is supposed to fare better during the current pandemic since it
is not as widely used as a transportation fuel, a sector which has been hit by Covid-19 containment
measures. However, demand has also fallen over the course of pandemic, and its consumption was
around 3% lower in the first quarter of 2020 compared to the same period in 2019 (IEA 2020, based
on Asian, European and North American markets). An important side effect of lower gas demand
has been a significant build-up of gas in storage – this is supported by exceptionally low spot prices
for the Henry Hub and the TTF (the lowest yet since 1999 and 2003, respectively) (EIA, 2020a; IEA,
2020a: 29). Lower gas prices, in turn, may contribute to the coal-to-gas switch which has been ongo-
ing in the US, China and Europe (BP, 2019: 5). Once seen as a 'bridge' fuel, switching to gas will
nevertheless reinforce lock-in and dependency patterns. As prices remain low, we may expect to see
ripple effects for the world's largest producers and exporters of natural gas: the US, Russia, Iran,
Canada, Quatar and Norway (IEA, 2019a: 16). Russia is also one of the world's exporters, responsi-
ble for around 24% of the global amount (IEA, 2019a: 16) with a significant economic reliance on
natural gas exports for its income. It has already been shown to be vulnerable to changes in demand,
and this will only be worsened in the current pandemic situation.

Conclusions

Although less fossil fuel energy is being produced and consumed due to the pandemic, whether or
not this will result in changes to the structures of the global market remains to be seen. Renewable
energy is also subject to interruptions in finance and supply chains, and needs flexible policy re-
sponses if the transition is to continue. Moreover, the geopolitics of fossil fuel production and con-
sumption will remain important even as demand and prices fluctuate. As crises can act as an incen-
tive to return to familiar scenarios, there is a risk that countries will double down on hydrocarbons.
This may be less likely for coal than for natural gas, given that it is relatively more expensive. If
natural gas generation continues to expand, we may see a reinforced dependency pattern between
gas-producing and gas-consuming actors. Although the coal-to-gas switch is environmentally prefer-
able (from a solely hydrocarbon-based perspective), this can bring out a new type of lethargy in the
energy industry that would jeopardize the significant steps made by RES so far. The very low oil
prices, while they may drive American shale producers out of business, are also hard for countries
whose economies rely on this commodity – especially given the likelihood of an extended recession
due to Covid-19. If policymakers prioritize business as usual, the risk of perpetuating carbon lock-in
remains.

IASS Study_ 9
Covid-19 and Carbon Lock-In: Impacts on the Energy Transition

3. Country cases
3.1        United States

Silvia Weko
The US is seen as a leader in the ‘clean energy race’ and a potential ‘winner’ of the energy transition
(IRENA, 2019). Expanding the green industry was a key priority of the Obama administration,
which supported the clean energy industry following the 2008 financial crisis through a combination
of stimulus programs. These programs provided funding for renewable energy projects, investment
incentives such as loan guarantees, and the Production Tax Credit for wind and the Solar Investment
Tax Credit, both of which are scheduled to be phased out in 2020. Despite uncertain policy support
(Wood, 2020), the renewable energy industry has been one of the fastest growing sectors in the US
in recent years, employing around 250,000 workers in the solar sector (Solar Foundation, 2020) and
120,000 in the wind sector (AWEA, 2020). In comparison, the U.S. Labor Bureau (2020) estimates
that the coal sector employs about 52,000 people. It appears that this growth will be hit hard by the
coronavirus crisis and a lack of response from the federal government.

       3.1.1      Changes in energy markets: falling demand and carbon prices

As in other countries, the US energy demand has fallen significantly since the start of the crisis.
Energy demand fell in March and April, according to data collected by the US Energy Information
Administration (EIA). With lower demand, total coal-fired generation dropped significantly (see
Figure 3.1.1). Natural gas also declined dramatically in April. Still, the share of wind and solar in the
energy mix remained relatively low, at around 13% in January and April, 10% in February and 11%
in March. Gasoline demand also fell sharply after shelter-in-place orders came into force. Carbon
Pulse (2020a) reported a drop in approximately 100 million gallons between the week of March 14-
20 to the following week – the largest drop since January 1994.

IASS Study_ 10
Covid-19 and Carbon Lock-In: Impacts on the Energy Transition
Energy generation in the US, 2020
120000000
Coal
100000000
Natural Gas
Net generation, MW
80000000
Nuclear
60000000
All Petroleum Products
40000000
Hydropower and Pumped
20000000 Storage
Solar
0
January February March April
Figure 3.1.1: Energy generation, complied from EIA data
Average electricity prices also fell through the crisis: EIA data shows prices falling steadily from
January 2020 ($25.75/Mwh), to around $22/hour in February and March, and approximately $18 and
$17 in April and May respectively. In addition, lower overall energy demand has impacted CO2
pricing systems throughout the US. While there is no US-wide carbon price, coalitions of states have
implemented their own cap-and-trade programs: the Regional Greenhouse Gas Initiative (RGGI)
made up of ten states on the east coast and the Western Climate Initiative (WCI) on the west coast,
which includes California and three Canadian provinces.
The RGGI is relatively less ambitious in that it includes only power sector emissions and its carbon
floor price was only $2.32 this year. At the beginning of the crisis, the prices were not significantly
different to pre-Coronavirus levels; the auction on March 11th had a clearing price of $5.65 (RGGI
2020). However, just after the auction, on March 23rd, market prices hit $4.73, their lowest levels
since June 2018. They have since risen again to $5.86, which is nevertheless below pre-corona levels
(Intercontinental Exchange, 2020) and are expected to remain stable. Carbon Pulse claims that the
prices are driven by the planned supply curtailment, when RGGI states will remove surplus allow-
ances after March 2021 – and low emissions from fallen consumption in the Covid-19 pandemic will
be a part of this (Carbon Pulse, 2020c).
California’s carbon price is much higher than the RGGI, with its California Carbon Allowances
valued at a floor price of $16.68 (CCA, 2020a). Pre-Coronavirus auctions in November 2019 and
February 2020 had clearing prices of $17/ton and $17.87 respectively. As energy use falls, however,
producers are cutting their expected allowances and the surplus of allowances will be higher at the
end of 2020. Unsold allowances are not removed until two consecutive sales sell out (in California,
they can be shifted into the containment reserve after two years). Prices on the spot market have
fallen under the floor price, and the latest round of auctions in May was dramatically under-
subscribed, with less than half of the current allowances sold and only about 1/8th of advance allow-
ances (CCA, 2020b).
This implies that carbon pricing needs more than a floor – markets also need to respond to falling
IASS Study_ 11Covid-19 and Carbon Lock-In: Impacts on the Energy Transition
energy demand and remove surplus allowances, which is quoted as keeping the RGGI price from
crashing. However, California policymakers have argued that they cannot take action without first
considering the 2045 goals (Carbon Pulse, 2020b). What makes ambition more complicated is the
fact that regional programs fell apart after the last recession, when the US states of Arizona, New
Mexico, and Utah withdrew from the WCI following the 2011 election due to their concerns about
being ‘uncompetitive’ (Craig, 2011).
3.1.2 Impacts on the energy sector
The decline in energy demand and energy prices has affected both the renewable energy and the
fossil fuel industry in the US. The EIA predicts that energy investment will fall by 25% this year
(DeConcini and Neuberger, 2020). Oil and gas consumption are predicted to be far lower this year,
and projections show the industry’s service sector losing 100,00 workers by the end of 2021
(DeConcini and Neuberger, 2020). Coal, which the Trump campaign promised to revive, has also
continued its downwards trajectory. Before the crisis, the EIA predicted an 11% drop in coal con-
sumption this year – but now expects it to fall by 23% (Meyer, 2020). The Financial Times also
reports that utilities are retiring coal power plants earlier than planned, for example in Minnesota
where Great River Energy will close a 1,151MW coal power station in 2022 and then add 1,100MW
of wind.
As the crisis continues, capital investments in RES may dry up. Until now, firms were given tax
credits to offset their tax burdens – but as investors see overall profits fall, this is less appealing. In
addition, project developers are facing major delays in construction and equipment delivery, both
because of global and local supply chain interruptions. This is especially problematic because pro-
jects must be connected to the grid by 2020 in order to receive subsidies (Bahar for IEA 2020). In-
dustry organizations such as the American Wind Energy Association (AWEA) are currently lobby-
ing Congress to address decreases in tax equity by allowing developers to receive direct pay equal to
the value of credits. They see the potential impacts as catastrophic – AWEA’s impact assessment
found that the health crisis could “put 35,000 jobs at risk and jeopardize $43 billion in investments
and payments to rural communities” (AWEA 2020). Likewise, the Energy Storage Association pre-
dicts falling revenue and layoffs due to equipment and permitting issues, as well as falling demand
for services (ESA 2020). Even more dramatic impacts are predicted by the Solar Energy Industries
Association (SEIA): already, it reports that over half of solar workers are impacted. It sees the possi-
bility for the rooftop solar segment to fall by as much as 70%, and utility-scale down by 50%, and
for the current workforce of 250,000 to be halved this year (SEIA, 2020). The Washington Post
reports that about 106,000 clean energy workers filed for unemployment in March (Mufson and
Grandoni, 2020).
3.1.3 Policy response
So far, the US federal government has passed three aid packages in response to the coronavirus crisis
on March 6th, March 18th, and March 27th 2020 (also called the CARES act). None of these stimu-
lus packages contained specific support for the renewable energy industry – in contrast to the 2008
crisis, when the US congress spent around $112 billion on clean energy (Mufson and Grandoni,
2020). Republicans rejected calls from Democratic representatives for renewable energy tax credit
extensions, with the President tweeting that “This is not about the ridiculous Green New Deal. It is
about putting our great workers and companies BACK TO WORK!”
The USD $2 trillion stimulus included in the CARES Act contains no industry-specific measures,
but observers have noted that its structure rather benefits the fossil fuel industry (DeConcini and
IASS Study_ 12Covid-19 and Carbon Lock-In: Impacts on the Energy Transition Neuberger, 2020). Bloomberg found that oil companies, service firms and contractors claimed over $1.9 billion in CARES Act tax benefits – and as the US Energy secretary Brouillette recommended oil companies take advantage of this ‘liquidity tool’ (Dlouhy, 2020), it seems clear that the benefits to oil companies are a feature, not a bug. Similarly, the Bureau of Land Management has reduced royalty payments for oil companies from its typical 12.% and may reduce them to as low as 0.5% (Lefebvre, 2020). The struggling renewable energy industry has nevertheless welcomed some elements of the CARE act, specifically those that give relief to small businesses through loans and employee protections (SEIA, 2020b). At the state level, some governors are moving to support the solar and wind indus- tries. As part of its corona recovery plan, New York has passed the Accelerated Renewable Energy Growth and Community Benefit Act. It aims at restarting renewable energy development and up- grading the State electricity, while benefiting local communities. It includes the creation of the Of- fice of Renewable Energy Siting and a host of measures to facilitate investments in renewable ener- gy (Haggerty, 2020). New York also passed pro-solar provisions as part of the state budget; the re- formed its permit approval system which allows for large-scale solar projects to be fast-tracked met with approval from solar industry representatives (SEIA, 2020c). California has categorized solar and energy storage workers as essential, meaning that installations will be allowed to resume (Cali- fornia Energy Commission, 2020). The CA state senate mandated in 2015 that its public utilities commission make procurement decisions in accordance with a GHG emission reduction of 40% by 2030; half of its procurement should be from renewable energy. This means that despite falling car- bon and electricity prices, there are incentives to invest in renewables and move away from fossil fuels. Nevertheless, without a federal policy response, the RES industry in the US faces serious dif- ficulties. In conclusion, the coronavirus crisis has resulted in lower US energy demand and falling electricity prices. The share of coal in the energy mix is also falling and there has been a small increase in the share of renewables. Lower energy demand appears to impact CO2 pricing schemes in different ways, as the RGGI (east coast markets) will remove excess credits to keep prices steady. However, the CO2 markets in California have dropped below the floor price and do not appear to be recovering soon, resulting in under-subscribed auctions. Investment in clean energy may slow in the coming months as investors see tax credits as less relevant; and projects are not able to be completed on time due to workforce and supply chain disturbances. Over 100,000 clean energy workers have filed for unemployment in March alone. Given the current response of the Trump administration, which al- lows for oil companies to claim massive stimulus benefits, and the patchy local responses, it seems that the US’s clean energy industry will contract dramatically. 3.2 India Sapan Thapar, TERI School of Advanced Studies, New Delhi Adela Marian, IASS Potsdam India has the third largest power system in the world, with 370 GW installed capacity including 200 GW of coal and 90 GW of renewable energy assets. The electricity generation is about 1300 billion units, with 70% attributed to coal and 10% to renewables. Key consumer sectors include industries (40%), households (25%) and agriculture load (18%). Since 2015, there has been a steady increase in the share of renewable power, both in terms of capacity as well as energy generation. Currently, the country has over 37 GW of wind power and 34 GW of solar power projects. Due to rapidly declining costs of equipment and the setting up of large-scale projects, the cost of solar and wind power has become competitive with coal (CERC, 2020), leading to an increased adoption among energy utili- ties. IASS Study_ 13
Covid-19 and Carbon Lock-In: Impacts on the Energy Transition

As part of its measures to contain the spread of Covid-19, the Indian government enforced a nation-
wide lockdown on March 25, 2020, restricting movement of individuals and halting all non-essential
economic activities. The enforcement was extended until June 8th, when places of worship and
stores began to reopen, though a partial opening of several sectors was allowed during the lockdown
period.

       3.2.1      Impacts on the energy sector

It has been observed that the lockdown severely impacted the power demand in the country. Even
though the power sector, categorized as an essential service, was allowed to operate, Phase I of the
lockdown period from March 25 to April 19 saw a 25% decrease in the power demand compared
with the same period in the previous year, due to a halt in all industrial and commercial activities. A
similar reduction was also observed in the peak demand, with a 30% decrease recorded during this
period, from 160 GW to 115 GW (POSOCO, 2020).

Figure 3.2.1: Demand patterns during the first two weeks of the lockdown (green and purple curves), as
compared to the last normal week before the lockdown (red curve) and a similar week in the previous year
(blue curve)
Source: data from https://posoco.in/covid-19/

During the lockdown period, power generation had to be adjusted to match the reduced demand.
This was achieved by adjusting coal-based generation, since renewables are classified as ‘Must Run’
under the electricity law (MNRE, 2020a). The adjustment has led to a reduction in the load factor of
coal plants and a build-up of coal stock inventory; there has been a drop of over 25% in the offtake
of coal from domestic mining companies (Economic Times, 2020a). The reduced contribution from
the coal sector has increased the share of renewable power in the grid, although there has been no
perceptible increase in green power generation in absolute terms (CEA, 2020).

Another development has been the shift in the preference of distribution utilities towards short-term
procurement through power exchange over the long-term contracts traditionally relied upon. There
has been a 20% reduction in short-term power prices at the Indian Energy Exchange (INR 2.46/ kWh
in March 2020 compared to INR 3.12/ kWh in March 2019), leading to an increase in the traded

IASS Study_ 14
Covid-19 and Carbon Lock-In: Impacts on the Energy Transition
volume by over 18% on account of favorable prices (Economic Times, 2020b).
Several short-, medium- and long-term challenges have arisen in the power sector due to the lock-
down conditions.
One of the main challenges was the reduction in demand and concomitant revenue flow to the power
distribution companies. With most utilities in a financial mess, reduced power offtake may create a
bubble of cash flow crunch (Economic Times, 2020c). For most utilities in India, higher tariffs are
charged to commercial and industrial segments to partly subsidize domestic consumers as part of
social obligations (IEA, 2020). The decreased consumption of the high tariff-paying commercial and
industrial sectors during lockdown will likely cause more hardship for the utilities. In addition, the
cash-starved power distribution companies may find it difficult to settle the dues of their power sup-
pliers, including renewable companies, which in turn, may affect the payment obligations of solar
and wind companies to their service providers, leading to a vicious cycle. A lower than anticipated
growth (BloombergQuint, 2020a) in the country’s gross domestic product (GDP) will reduce power
demand, with fallout for new installations, including related to the renewable energy sector. With
coal plants running at lower operating values, this would put an additional financial burden on the
generation utilities.
Another issue has been the restricted movement of personnel and the halt in industrial and commer-
cial activities. Though routine operation and maintenance activities have been permitted at solar and
wind sites (Economic Times, 2020d), availability of skilled personnel and spare parts may be a chal-
lenge. Manufacturing of solar and wind equipment, as well as project implementation activities at
sites have been partly affected due to the lockdown. The virus has resulted in changes to the work-
force as people travel back to their native places (villages) to minimize economic hardships; over 40
million migrant laborers have been impacted in India (Economic Times, 2020e). Dependence upon
low-cost imported solar modules (especially from China) also affected the work due to restrictions
on cargo movement, both within and outside the country (marine, road and rail). Moreover, the de-
pleting value of the Indian rupee increased the import bills for solar developers. These issues may
delay the commissioning of projects, leading to cost and time overruns, thus impacting the growth of
the Indian renewable energy sector. Though the inclusion of force majeure in the contract clauses
may provide solace, financial losses have to be absorbed by the involved entities – developers, bank-
ers, utilities, or the ratepayers.
An unexpected challenge has arisen for the rooftop solar sector, both for self-financed projects set up
by large companies and projects set up by investor groups under the capital expenditure (CAPEX)
model. Net-metering regulations permit the sale of excess power to the host utility up to certain lim-
its, albeit at lower prices than the applicable tariff for consumers in most cases. Lower captive con-
sumption due to lockdown resulted in higher export of surplus solar power to the local grid, which
presented technical challenges and resulted in lower revenues for rooftop project developers and
investors. In addition, movement and construction restrictions in urban areas resulted in delayed
commissioning of rooftop projects.
3.2.2 Policy response
The government is working towards solving the challenges posed to the economy, including the
energy sector, by way of several policy interventions and packages. The Ministry of Finance has
provided a huge stimulus package to revive the economy (BloombergQuint, 2020b) and increase the
energy demand. To help the power distribution companies facing financial troubles, a liquidity injec-
tion of INR 900 billion is foreseen, which includes waiving-off fixed charges and interstate transmis-
sion charges and raising funds from the markets against the receivables of these companies (Live-
IASS Study_ 15Covid-19 and Carbon Lock-In: Impacts on the Energy Transition
mint, 2020). The phased lifting of lockdown and the arrival of the summer season (associated with
cooling load) may further augment demand. To help project developers, the government has also
permitted construction activities for renewable projects outside city limits and allowed a phased
opening of the manufacturing sector, as well (Economic Times, 2020f); the timelines for commis-
sioning of solar and wind projects have been extended (MNRE, 2020b). To promote the domestic
industry and reduce import dependence, the states have been asked to identify land for setting up
renewable energy manufacturing and export services hubs (Economic Times, 2020g).
Apart from the economic stimulus package, the Ministry of Power has announced draft amendments
to the Electricity Bill to revive the sector. The amendments have specific provisions for developing a
“National Renewable Energy Policy”, with penalty provisions for non-adherence to procurement
targets and tariff rationalization1 by directly routing subsidy to the consumers (MOP, 2020). Gov-
ernment-owned agencies specializing in the power sector have been asked to offer short-term lend-
ing facilities to power distribution companies to help them navigate through the payment crisis
(Economic Times, 2020h). These measures should contribute to a quick recovery of the Indian pow-
er sector besides helping expand the share of renewable energy in the grid.
3.3 China
Bing Xue
The Covid-19 pandemic in China was described as "a major public health emergency that has oc-
curred in China since the founding of New China, with the fastest spread, the widest scope of infec-
tion, and the most difficult prevention and control"(Xi, 2020). On January 23, 2020, Wuhan began to
take measures to close the city for strict control, and subsequently, a wide range of prevention and
control measures were implemented nationwide. On February 7, 2020, Wuhan lifted control of the
lockdown of the city, which means that China has achieved important results in epidemic prevention
and control. Whether in the long-term or short-term, Covid-19 has had various degrees of direct or
indirect impact on various aspects of China's social and economic development (Devonshire-Ellis et
al., 2020); the effects of extensive prevention and control measures such as lockdown, isolation, and
social distancing also extend to the energy system.
3.3.1 Impacts of the Corona pandemic on energy consumption
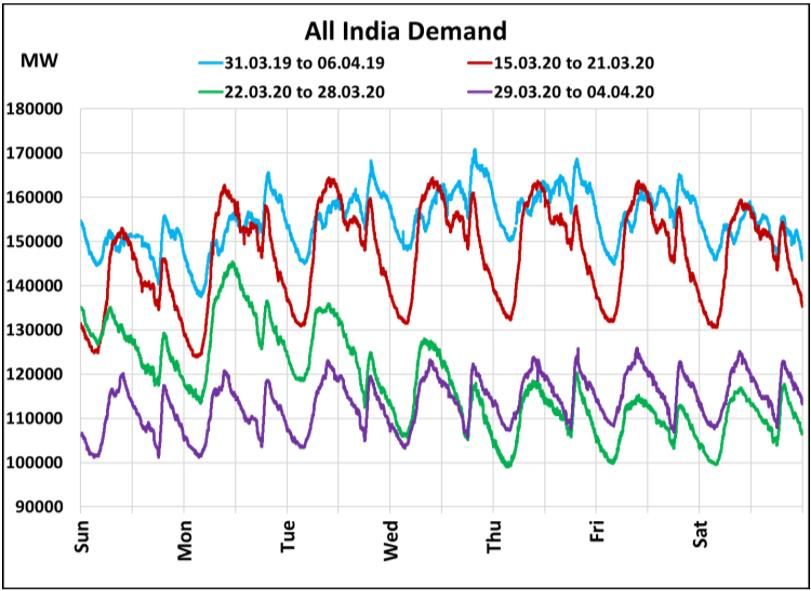
In the period from January to April 2020, total electricity consumption decreased significantly, drop-
ping by about 4.7% compared to the previous year, and by as much as 10.1% in February 2020,
while almost the whole of China was in lockdown (Figure 3.3.1 and Table 3.3.1) (NEA, 2020). Ac-
cording to data from the National Energy Administration of China, the electricity consumption of the
secondary and tertiary industries decreased by 12.9% and 10.0% year-on-year in February 2020. In
March, as China began to resume production, power consumption also increased, but remained low-
er than the previous year by 6.1% and 8.1% respectively.
1
Tariff Rationalization means determination of tariff as per realistic procurement and delivery costs (including
operating and profit margins), without any preference for any consumer category, thus eliminating cross-subsidies
IASS Study_ 16Covid-19 and Carbon Lock-In: Impacts on the Energy Transition
Figure 3.3.1: Total Electricity Consumption in Jan-April of 2018-2020
Source: data from NEA
The epidemic has had a longer-term impact on the tertiary industry, which has been slower to resume
operations than the secondary industry. However, the electricity consumption of the four high-
energy-consuming enterprises, including the building sector, chemicals, steel, and nonferrous metals,
has remained basically stable. Under normal circumstances, these industries account for about 40%
of the entire industrial electricity consumption. Coal consumption in 2019 was 3.94 billion tons, a
year-on-year increase of 1.1%. In 2020, the status of power generation and the four major high-
energy enterprises will be relatively stable. Since coal provides more than 80% of the energy con-
sumed by these five industries, coal consumption in 2020 is expected to be largely the same as last
year.
Table 3.3.1: Total Energy Consumption in Feb and the sum of Jan-April 2020
Sum of Jan – April
Feb 2020
2020
Indicators Unit Percentual
Percentual change
Change
Total compared to Feb Total
compared
2019
to 2019
National electricity consump-
GWh 439.8 -10.1% 2127 -4.7%
tion
Primary industry GWh 5.3 1.9% 22.8 5%
Secondary industry GWh 252.3 -14.6% 1388.4 -6.1%
Industry GWh 245.6 -12.9% 1364.1 -6.1%
Tertiary Industry GWh 83.3 -10.0% 342.4 -8.1%
Electricity consumption of
GWh 98.8 3.1% 373.4 3.4%
urban and rural households
The energy consumption of the secondary and tertiary industries generally declined, showing region-
al and industry differences, while the total energy consumption of private households increased. For
example, from January to February, domestic gasoline and aviation kerosene consumption decreased
by about 10% to 15% year-on-year. In February, gasoline consumption fell more than 40% year-on-
year, diesel consumption fell more than 30% year-on-year, aviation kerosene consumption fell more
than 50% year-on-year, and natural gas consumption fell 10.2% year-on-year (CNPC, 2020). As
people began to spend more time at home, the demand for electricity for heating, lighting, televi-
sions, and computers increased significantly in North, Northeast, and Northwest China, and electrici-
ty consumption by private households continues to be high. Household electricity consumption in-
creased by 12.3% in North China, by 10.6% in Northeast China, and by 9.5% in Northwest China.
Private households in Tianjin, Hebei, Shanxi, Shandong, Liaoning, Jilin, Heilongjiang, Xinjiang, and
other provinces all have growth rates of more than 10%. The proportion of migrant workers in East
China is relatively high. Due to the epidemic, many workers did not return in February. As a result,
household electricity consumption grew by only 2.7%. Households in Shanghai, Jiangsu, and
IASS Study_ 17Covid-19 and Carbon Lock-In: Impacts on the Energy Transition
Zhejiang all experienced negative growth. The electricity consumption of Fujian households only
increased slightly by 3.2%.
The nationwide cumulative average utilization hours (CAUH) of power generation equipment in the
period from January to April 2020 was 1102 hours, 115 hours less than in 2019. This reduction was
concentrated in the area of thermal power equipment (146 hours less), followed by hydropower (94
hours less), with wind power experiencing the smallest drop (only 21 hours less).
Table 3.3.1: Average use of power generation equipment, Jan-April 2020
Jan-April 2020 comparison year-on-year
CAUH hours 1102 -115
Hydropower hours 865 -94
Thermal hours 1266 -146
Nuclear hours 2230 -28
Wind hours 745 -21
In terms of newly installed power generation capacity, the added generation capacity from January to
April 2020 was 20.09GW, which was 3.27GW less than the same period in 2019. Hydropower,
thermal power, and wind power have newly added installed capacities of 1.14GW, 10.78GW, and
3.65GW respectively. However, compared with the same period of last year, hydropower and ther-
mal power increased by 400MW and 410MW respectively, and the newly installed capacity of nu-
clear power and wind power decreased by 1.25GW and 1.95GW respectively.
Table 3.3.3: New installed power generation capacity, Jan-April 2020 (MW)
Jan-April 2020 comparison year-
on-year
New installed power generation capacity MW 20090 -3270
Hydropower MW 1140 400
Thermal MW 10780 410
Nuclear MW 0 -1250
Wind MW 3650 -1950
3.3.2 Discussions and policy response
China is a major energy consumer and the hub of the global manufacturing supply chain, and the
epidemic has had an important impact on the global economy and the international energy market
(Mao et al., 2020). However, at present, it is still difficult to judge the specific impact of the Covid-
19 epidemic on China's energy policy.
In the early stage of the epidemic, many Chinese scholars conducted preliminary discussions on the
theme of "the impact of the epidemic on China's energy system", but mainly qualitative discussions.
For example, the Center for Energy and Environmental Policy Research at the Beijing Institute of
Technology launched the report entitled “Evaluation of the overall impact of the new coronary
IASS Study_ 18Covid-19 and Carbon Lock-In: Impacts on the Energy Transition
pneumonia epidemic on the energy system” on Feb 13 2020, which argued that due to the dual im-
pact of supply and demand, the development of various industries has been inhibited to varying
degrees in the short term, and ensuring emergency energy supply in epidemic areas was the focus of
work at that time. It also pointed out that in the medium and long term, after the epidemic, various
industries will gradually adjust and rebound to the original development track, and the Chinese ener-
gy industry should continue to develop in accordance with the established route and goals (Hao et
al., 2020). With the acceleration of resumption of production and production, China's total energy
consumption has started to pick up. However, due to the global spread of the epidemic and the relat-
ed impact of the domestic epidemic, China's energy consumption will inevitably be affected by
changes in economic and social activities—but at the policy level, there are currently no significant
signals.
On May 22, 2020, Chinese Premier Li Keqiang stated in his government work report that China will
not set a GDP growth target for 2020. This is the first time that China has not set a target for eco-
nomic growth since it began in 1994. However, in the energy field, it is confirmed that ensuring
energy security is one of the key basic goals and it is clearly proposed to promote the clean and effi-
cient use of coal, develop renewable energy, improve the supply and marketing system of oil, natural
gas, and power generation, and enhance energy reserve capacity.
On May 29, 2020, the People's Bank of China, the National Development and Reform Commission,
and the China Securities Regulatory Commission published a draft of their 2020 revision to the
Green Bond-supported Project Catalogue (Green Project Catalogue) for comments (PBC 2020),
which involves multiple energy projects, including energy efficiency for power facilities and the
construction and operation of renewable energy facilities. It also supports manufacturing of wind
power generation equipment, hydroelectric power generation and pumped storage equipment, bio-
mass energy utilization equipment, nuclear power equipment, gas turbine equipment, and geothermal
energy development and utilization equipment. It is worth noting that the coal-related projects,
which are the most controversial points in China's green debt standards, have been eliminated from
the draft for consultation and are in line with international standards, which also help increase Chi-
na's legitimacy to speak in the international arena.
At the time of the epidemic, the global energy system has been impacted to varying degrees (Gor-
don, 2020; IEA, 2020), and the whole China's energy system will certainly be affected, although
these effects have not yet been well quantified. However, in order to strengthen the energy industry's
supply chain resilience, China is likely to become more determined to develop renewable energy as
part of its efforts to reduce energy imports from a longer-term perspective (Zheng, 2020). More
efforts are likely to be conducted, for example, to further promote the intelligent construction of the
energy industry, and strengthen the integration of intelligent technology and coal, oil, electricity,
natural gas and other industries. By constructing a multi-layer network supply chain based on intelli-
gent technology, an efficient, low-cost, and robust supply system can be achieved, so that the energy
supply chain can have instant, visible, perceptible, and adjustable capabilities in any situation.
3.4 Germany
Laima Eicke
3.4.1 Impacts of the Corona pandemic on the power market
Energy demand in Germany fell dramatically throughout March and remained low in April, mainly
driven by decreased industrial production and shutdowns, such as in the automotive sector. As indus-
try and businesses account for half of German electricity demand, the power market has also been
heavily impacted. In the first quarter, the Corona pandemic drove down power demand by around
IASS Study_ 19Covid-19 and Carbon Lock-In: Impacts on the Energy Transition
3%. Electricity production fell even further by 17% due to decreased electricity demand in neighbor-
ing countries (Frauenhofer ISE, 2020a).
The decreased demand for electricity changed the patterns of power generation in the first quarter of
2020. Due to lower marginal costs for renewables and gas, coal has been crowded out within the
merit order process. In comparison to the first quarter of 2019, power generation based on lignite and
hard coal decreased by 32% (9.1 Twh) and 42% (7.2 Twh) respectively, whereas wind- and solar-
based electricity generation increased by 19% (8.3 TWH) and 10% (0.7 Twh). A mild winter and a
sunny spring reinforced this trend. In consequence, 2020 has been the first year in which renewable
electricity generation exceeded fossil power production by 55% in the first quarter and 60% in April
2020 (Frauenhofer ISE, 2020a). During at least three days in April 2020, renewable electricity gen-
eration exceeded the total power demand (Bundesnetzagentur, 2020a).
Nuclear Lignite Hard coal
Changes (TWh)
Gas Hydro Biomass Wind Solar
Figure 3.4.1: absolute changes in net power generation in the first quarter of 2020 in comparison to the first
quarter of 2019 in Germany
Source: Frauenhofer ISE, 2020a
Prices for electricity on the day-ahead spot market have decreased; the EPEX spot price has been
33% lower in the first quarter of 2020 than the year before (Frauenhofer ISE, 2020a). Numerous
times prices were negative, falling below zero for the first time on February 16th and becoming even
lower in March and April, as it was impossible or unprofitable to turn thermal plants down. More
flexible renewable electricity plants had, in turn, no incentive to decrease production, as they receive
fixed feed-in-tariffs per kwh regardless of price changes on the wholesale market (Frauenhofer ISE,
2020b). In cases where the price on the spot exchange remains negative for six consecutive hours,
large installations do not receive feed-in tariffs. However they often continue to produce power due
to uncertainties involved (Amelang, 2020). On the other hand, prices for negative balancing energy
have increased, driven by changes in daily consumption patterns (Sperling, 2020).
A German CO2 price for all sectors is planned for 2021. Currently, the EU-ETS determines carbon
prices for the German energy and industrial sectors. While the demand for carbon certificates on the
EU market decreased due to lower production, the supply increased as many businesses held re-
serves that are now being offered. In consequence, the EU-ETS has seen carbon prices drop dramati-
cally by 40%, from 25.90€/tCO2 to 15.70 €/tCO2 in March 2020 (DEHSt, 2020). The ETS is meant
to adjust the supply by withdrawing allowances and inserting them into the Market Stability Reserve
(MSR) in order to stabilize prices, and plans to withdraw 330 million allowances in 2020. However,
the mechanism has not been able to reverse the declining price trend caused by the Corona pandem-
ic. These decreased carbon prices have a direct effect on the marginal costs of fossil power plants,
lowering electricity prices further.
IASS Study_ 20You can also read