Myths and renewables Southeast Europe facts about deploying in the power systems of - Agora Energiewende
←
→
Page content transcription
If your browser does not render page correctly, please read the page content below
Myths and facts about deploying
renewables in the power systems of
Southeast Europe

Version 2018

Fanni Sáfián, Gabriella Dóci, Dóra Csernus, Ágnes Kelemen, Xuenan Mao

Budapest, December 2018
IMPRESSUM
Delivered by Klimapolitika Ltd. to Agora Energiewende

Prepared by Fanni Sáfián, Gabriella Dóci, Dóra Csernus, Ágnes Kelemen and Xuenan Mao

Contributed by Christian Redl and Sonja Risteska

Supervised by Ágnes Kelemen

Disclaimer

The analysis for the EU countries was performed under the project "South East Europe Energy
Transition Dialogue" which is part of the European Climate Initiative (EUKI). EUKI is a project financing
instrument by the German Federal Ministry for the Environment, Nature Conservation and Nuclear
Safety (BMU). The EUKI competition for project ideas is implemented by the Deutsche Gesellschaft für
Internationale Zusammenarbeit (GIZ) GmbH. It is the overarching goal of the EUKI to foster climate
cooperation within the European Union (EU) in order to mitigate greenhouse gas emissions.

Agora Energiewende acknowledges support by the Austrian Federal Ministry of Sustainability and
Tourism through the project "Western Balkans Energy Transition Dialogue"

The opinions put forward in this publication are the sole responsibility of the author(s) and do not
necessarily reflect the views of the Federal Ministry for the Environment, Nature Conservation and
Nuclear Safety (BMU) and the Austrian Federal Ministry of Sustainability and Tourism.

On the basis of the SEERMAP project

This document is based on the results of the SEERMAP project. Therefore, all information in this
document – which is not cited from another source – is originated from the SEERMAP Reports (Szabó
et al., 2017)1.

1Szabó, L., Mezősi, A., Pató, Z., Kelemen, Á., Beöthy, Á., Kácsor, E., Kaderják, P., Resch, G., Liebmann, L., Hiesl, A., Kovács, M.,
Köber, C., Marković, S., & Todorović, D. (2017). SEERMAP: South East Europe Electricity Roadmap - South East Europe Regional
report 2017. All country reports can be downloaded from: http://seermap.rekk.hu/.
Acknowledgements

We would like to express our gratitude for the valuable comments and inputs received from our
reviewers: Christian Redl, Agora Energiewende; Emanuele Bianco, IRENA; Pippa Gallop, CEE Bankwatch
Network and Sonja Risteska, Agora Energiewende.

Living document

This is a living document meaning that the authors plan to permanently review the content of this
document which will be published yearly.

Your comments and notes are very welcome to improve the document – please send them to Fanni
Sáfián (fanni.safian@klimapolitika.com) or Sonja Risteska (sonja.risteska@agora-energiewende.de).

About SE3T.net

SE3T.net is a regional network of independent energy transition think tanks which focuses
predominantly on Southeastern Europe.

Partners

Association for Sustainable Development             Macedonian Center for Energy Efficiency
(ASOR)                                              (MACEF)
Center for the Study of Democracy (CSD)             National Observatory of Athens (NOA)
Energy Policy Group (EPG)                           NERDA
Green Alternative                                   RES Foundation
Institute for Development Policy – INDEP            University of Zagreb
Content

A. Physical and economic feasibility of RES............................................................................................. 1
   MYTH A1: We don’t need more RES ................................................................................................... 1
   MYTH A2: Decarbonisation is expensive ............................................................................................. 3
   MYTH A3: Fossil energy is cheap ......................................................................................................... 8
   MYTH A4: RES are not competitive ................................................................................................... 12
   MYTH A5: RES increase the price of electricity ................................................................................. 21
   MYTH A6: RES undermine the profitability of fossil fuels ................................................................. 28
   MYTH A7: RES do not require subsidies ............................................................................................ 30
   MYTH A8: RES potential is insufficient to cover energy demand ...................................................... 32
   MYTH A9: PV does not work in cold climates ................................................................................... 41
B. Environmental sustainability ............................................................................................................. 43
   MYTH B1: RES are not sustainable .................................................................................................... 43
   MYTH B2: RES require too much space ............................................................................................. 45
   MYTH B3: RES cannot be sited in cities ............................................................................................. 46
   MYTH B4: The energy balance of RES is negative ............................................................................. 47
C. Social impacts of RES ......................................................................................................................... 48
   MYTH C1: RES cause employment losses .......................................................................................... 48
   MYTH C2: RES cause corruption ........................................................................................................ 52
   MYTH C3: RES create losers............................................................................................................... 54
   MYTH C4: RES are forced on countries by the EU ............................................................................. 55
   MYTH C5: RES inhibit energy efficiency ............................................................................................ 56
   MYTH C6: RES have no short-term benefits ...................................................................................... 57
D. Security of supply .............................................................................................................................. 59
   MYTH D1: RES cannot ensure security of supply – baseload power plants are needed................... 59
   MYTH D2: RES require expensive grid investments .......................................................................... 69
   MYTH D3: RES endanger self-sufficiency........................................................................................... 72
   MYTH D4: Natural gas is required as a bridge fuel ............................................................................ 73
   MYTH D5: Increased interconnectivity has mostly negative impacts ............................................... 75
   MYTH D6: Market coupling will result in revenue losses .................................................................. 76
References ............................................................................................................................................. 77
A. Physical and economic feasibility of RES

INSIGHTS FROM BULGARIA:

The EU 2050 Low Carbon Roadmap implies a 93-99% emission reduction target in the electricity sector;
this can be achieved through using energy efficiency, renewable sources, demand side management,
smart grids as well as other technologies like nuclear power or carbon capture and storage
technologies.

The SEERMAP project (Szabó et al., 2017) uses a model-based assessment of different long-term
electricity investment strategies for Albania, Bosnia and Herzegovina, Bulgaria, Croatia, Greece,
Kosovo*, former Yugoslav Republic of Macedonia, Montenegro, Romania and Serbia. Five models
incorporating the electricity and gas markets, the transmission network and macro-economic system
were used to assess the impact of three core scenarios:
    1. The ‘no target’ scenario reflects the implementation of existing energy policy (including
         implementation of renewable energy targets for 2020 and construction of all power plants
         included in official planning documents) combined with a CO₂ price (which is only envisaged
         from 2030 onwards for non-EU member states). The scenario does not include an explicit 2050
         CO₂ target or a renewables target for the electricity sectors of the EU member states or
         countries in the Western Balkans;
    2. The ‘decarbonisation’ scenario reflects a long-term strategy to significantly reduce CO₂
         emissions, in line with indicative EU emission reduction goals for the electricity sector as a
         whole by 2050, driven by the CO₂ price and strong, consistent RES support;
    3. The ‘delayed’ scenario involves an initial implementation of current national investment plans
         (business-as-usual policies) followed by a change in policy direction from 2035 onwards,
         resulting in the realisation of the same emission reduction target in 2050 as the
         ‘decarbonisation’ scenario. Decarbonisation is driven by the CO₂ price and increased RES
         support from 2035 onwards.

Based on Bulgaria’s status, trends and possibilities, the SEERMAP models show that a significant RES-
based development is not only feasible but also cost optimal. A significant increase in RES shares is
expected even if an emission reduction target is not set. Approximately 45% of current fossil fuel
generation capacity, or more than 2600 MW, is expected to be decommissioned by the end of 2030,
and 97% of today's fossil capacities will be decommissioned by 2050. The model results show that the
contribution of renewables (especially wind and solar) will increase significantly under all scenarios
under the assumed costs and prices: the RES electricity generation share will reach 32.5% in ‘no target’,
53.5% in ‘decarbonisation’ and 54.3% in ‘delayed’ scenarios. The latter means 4.6 TWh hydro, 10.0
TWh wind, 3.8 TWh solar and 3.4 TWh other RES power production by 2050.

                                                   1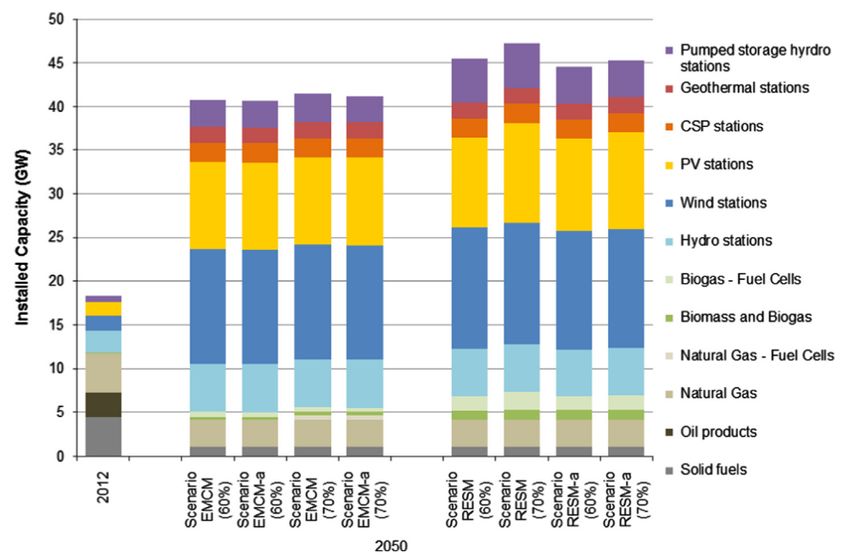
FIGURE 1 - INSTALLED CAPACITY IN THE 3 CORE SCENARIOS UNTIL 2050 (GW) IN BULGARIA, 2020-2050.
SOURCE: SEERMAP COUNTRY REPORT BULGARIA.

IRENA, Joanneum Research, & University of Ljubljana, (2017) also confirms that Bulgaria has high cost-
competitive renewable energy potential, including up to 18 GW wind, more than 6 GW solar, up to 1
GW biomass and 1,6 GW hydro potential.

Bulgaria has significant renewable potential relative to the EU average. However, high RES potential is
not enough for achieving high decarbonisation targets, if it is not coupled with an adequate and
affordable support system. The recent failure of the Bulgarian support system is still a sensitive
experience. The decreasing technology costs and an initially generous and non-capped FIT led to a
raising of electricity prices, which caused public resistance and ultimately led to the resignation of the
government (IRENA, 2017). Thus the introduction of well-designed policies to utilize the RES potential
is indispensable. The SEERMAP model results show that under a well-planned decarbonisation
pathway initial RES support is relatively high, at 7.8 EUR/MWh, but this drops to 3.7 EUR/MWh by 2025
and decreases further to 1.4 EUR/MWh in 2050. This implies that the cost of a transition to a mainly
RES based energy system can be kept in check if implemented in a planned way.

                                                    2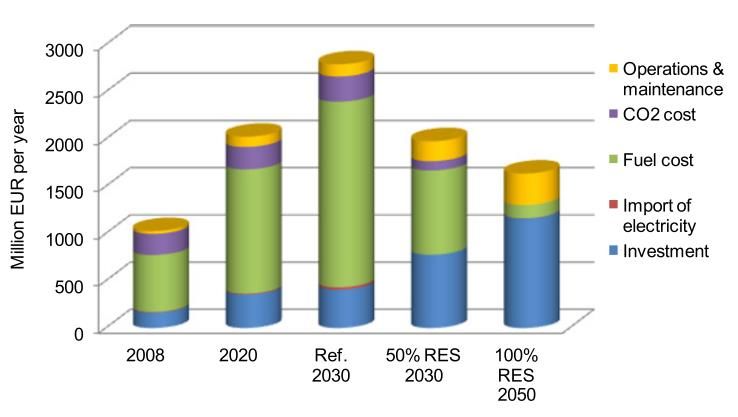
Concerning the cost of decarbonisation, the following should be noted:
   1. a decline in the technology costs of renewables is expected, RES are becoming cheaper;
   2. the investment cost of renewables can be further reduced in the region via reducing
       investment risks and by pooling resources to address high initial investment costs;
   3. long-term RES support schemes help decrease the initial level of subsidies needed for the
       expansion of RES;
   4. a mix of technologies and solutions needs to be used to reach decarbonisation targets most
       cost-effectively

The cost of decarbonisation highly depends on the carbon price (see myth A3), the technology costs
and the cost of capital that influence energy transition in varying degrees both in EU member states
and accession countries from the SEE region (Ecofys, 2017).

RES is not as expensive as many believe it to be

Capros et al. (2014) claim that in a cost-optimal way, “lower than 1% of GDP in the period 2015-2050
in cumulative terms” is needed to reach the European emission reduction targets.

The SEERMAP study shows that in order to achieve a 94% decarbonisation of the electricity sector by
2050, RES support relative to the electricity cost (wholesale price plus RES support) is only 2.6% at its
highest level in the ‘decarbonisation’ scenario, indicating that if renewable energy deployment is well
planned and forward-looking policies are in place, the impact of decarbonisation on households and
businesses can be kept low.

If Europe aims for a 100% renewable based energy system, then “the total calculated annual socio-
economic cost of the (SEE) region is approximately 20 billion EUR lower in the year 2050 than in the
base year (2012)” (Dominković et al., 2016), which proves that decarbonisation is not only
environmentally but also economically the most efficient and sustainable solution. Regarding country-
specific system costs please see myth A4.

In general, according to the report of Energy Union Choices (2017), decarbonisation of the power
sector that is faster than the one needed to reach the actual 2030 targets is technically feasible and
the emissions reduction related to it could be doubled (55% instead of 30% between 2015 and 2030)
compared to the EU reference scenario, while it could save 600 mEUR on system costs and bring 90 000
net jobs to Europe.

The price of renewable technologies has been continuously decreasing in the past decades and the
trend seems to continue. According to IRENA et al. (2017) the technology costs of renewables as well
as the cost of capital will further decline in the coming decades, which will increase the cost-
competitiveness of both solar and wind, thereby making these technologies more cost effective. The
newest World Energy Outlook of the International Energy Agency (IEA, 2017) highlights “the rapid
deployment and falling costs of clean energy technologies” as the first major trend in global energy
system. In particular solar energy, where the “growth in solar PV capacity was larger than for any other

                                                   3
form of generation” in 2016. Since 2010 the new PV panel costs have decreased by 70% (while wind
energy costs decreased by 25%, batteries by 40%)(IEA, 2017). Between 2014 and 2016, the average
photovoltaic system price decreased by 23% (EY & Solar Power Europe, 2017).
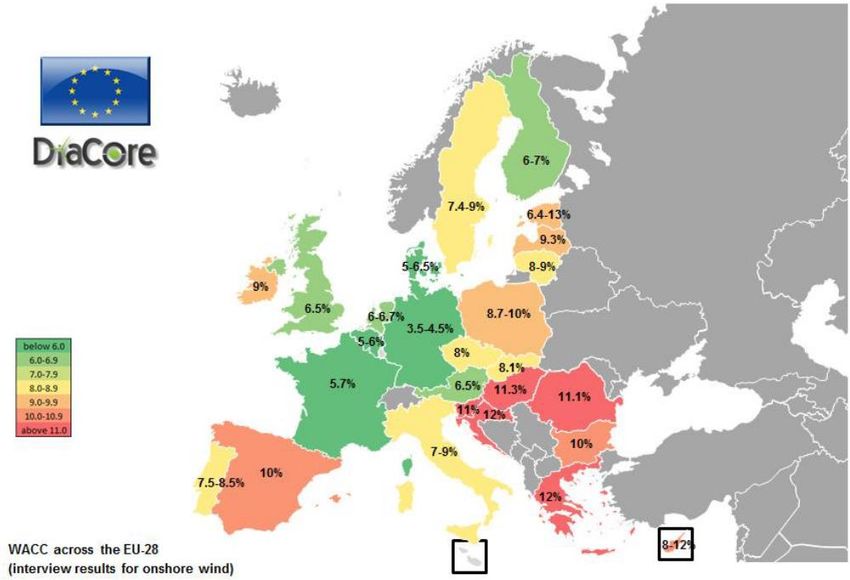
Investment risks need to be addressed to further lower costs of RES
The fact that initial investment costs are higher for RES than for traditional fossil fuel-based
technologies implies that the cost of capital is an important factor. The weighted average cost of capital
(WACC) is significantly higher in the SEE region than in countries in Western Europe. In the SEERMAP
report, WACC values in the region are assumed to be between 10 and 15% in 2016. Ecofys – Eclareon
(Ecofys, 2017 via Szabó et al., 2018) estimated current WACC values for onshore wind to be between
7-13.7% and for PV between 7-12.4% for Bulgaria, Greece and Romania. IRENA et al. (2017) assumed
medium level WACC values of 8 to 12% for SEE countries in 2016. The components of the risk premium
which needs to be paid to investors include general country risk, policy risks specific to the energy
sector, as well as technology related risks.
The DiaCore project results showed that insufficient RES policies and unreliable frameworks increase
risk and therefore capital costs for investors (Noothout et al., 2016), which therefore decreases the
utilization of the available RES potential – this is happening in South East Europe. One way to reduce
policy risk is therefore to implement consistent long-term energy policies.
FIGURE 2 - WACC ESTIMATIONS FOR ONSHORE WIND PROJECTS IN 2014. SOURCE: NOOTHOUT ET AL., 2016.
Technology risk is also an important factor. The choice of investing in wind and PV increases the overall
risk of the investments in question, as renewables are considered to be more risky than other average
investments, which means “an additional 7% points to the cost of equity in Bulgaria and Romania, 5%
points in the Slovak Republic, and 6% points in Hungary. However, in Greece, renewable energy
investments are regarded as safer compared to average investments and decrease the risk by 2%
points in the case of wind onshore and 3% points in the case of solar PV”, according to Ecofys (2017).
4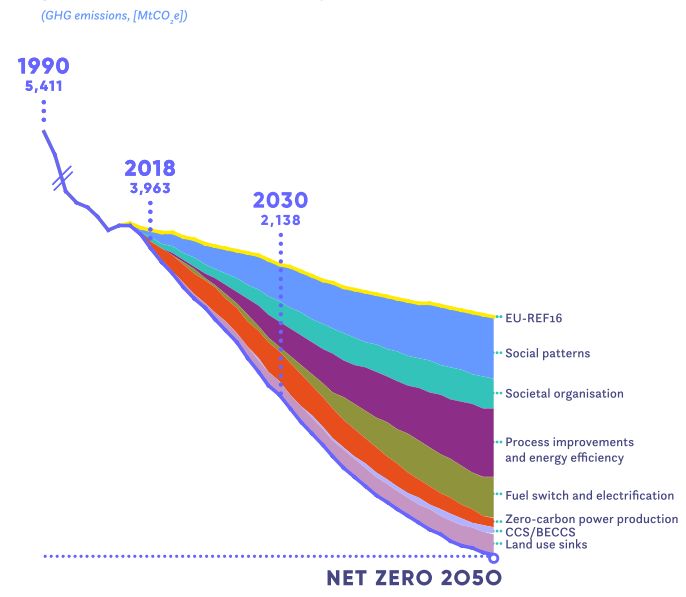
FIGURE 3 - CUMULATIVE ADDITIONAL COST-COMPETITIVE RENEWABLE POWER POTENTIAL FOR SEE IN 2016 UNDER
DIFFERENT COST OF CAPITAL SCENARIOS. SOURCE: IRENA ET AL., 2017.

IRENA et al. (2017) show that if these issues associated with higher risks are managed, then under a
low cost of capital scenario almost 300 GW of additional RES potential could be utilized compared with
the current high-risk scenario. The study also reveals that under a medium cost of capital scenario
(compared to today’s high investment risk), 17% of the identified technical potential, equivalent to
126.9 GW RES could be installed in a cost-effective way in the SEE region. This is “15 times higher than
the 8.2 GW of additional total capacity planned up to 2020, as required by the NREAPs”.

Temperton, Buck, Graf, & Brückmann (2018) recommended a Renewable Energy Cost Reduction
Facility towards the EU to reduce investments costs of RES and therefore save taxpayers’ money. The
SEERMAP report also claims that de-risking policies to address high cost of capital are important for
the SEE region and that options for implementing regional level de-risking facilities should be
considered. Policy related risks can also be reduced at the national level, by ensuring stable, long term
renewable energy policy frameworks are in place. This should be a priority for subsequent
governments in countries of the region.

One way of addressing the barriers associated with high initial investment costs is to pool resources.
Community renewable energy production has already achieved success in low cost local energy
production which is effective in dealing with energy poverty in some Western- and Northern European
countries (Dryzek, Norgaard, & Schlosberg, 2011; Sáfián, 2014). For example in a peripheral Danish
region of Samsø island, locally grown renewable-based community district heating solutions offer
cheap residential district heating prices (sometimes defined by a local committee) and also jobs to the
island which was lacking of it before (Jørgensen, 2007).

Long term planning is important to lower costs
According to the SEERMAP reports, strong, well-planned and consistent RES support schemes –
starting as soon as possible – help the implementation of a feasible and effective decarbonisation of
the energy sector. Delayed action on renewables is also an option, but compared to a long-term
planned RES support scheme has distinct disadvantages such as stranded costs (see myth A3). In case

                                                   5
of a long-term RES support scheme, the need for support decreases as the electricity wholesale price
increases and thereby incentivises significant RES investment even without support.

The RES support relative to the electricity cost (wholesale price plus RES support) is only 2.6% at its
highest level in the ‘decarbonisation’ scenario, indicating that if renewable energy deployment is well
planned and forward-looking policies are in place, the impact of renewable subsidies on households
and businesses can be kept very low.

To lower the cost of decarbonisation a mix of different technological solutions must be used

A fresh study of Climact & ECF (2018) modelled a wide range of methods (here: levers) to reduce
emissions in all sectors (power production, industry, buildings, transportation, agriculture, forestry and
land-use) to find cost-optimal pathways to reach net zero emissions by 2050 in the EU. The levers were
categorized in six groups where not only technological but also organisational and other soft solutions
such as diet change were taken into consideration. They used them in different mixes and with
different importance in three main scenarios: the “Shared efforts” utilizes all levers in all sectors with
no specific emphasis; the “Technology” scenario focuses on “efficiency and innovative technological
options by raising their ambition to the highest levels”; the “Demand-focus” scenario utilizes demand-
side levers to reduce demand for energy (-64% by 2050), meat, technological solutions etc. According
to the results, they claim, that “social patterns, societal organisation and energy efficiency are key to
make it easier to reach net-zero” future in the EU. Different results of the “Shared effort” scenario can
be seen in the following graphs compared to the EU Reference scenario.

FIGURE 4 - DIFFERENCE IN TOTAL SYSTEM COSTS BY LEVER GROUP BETWEEN THE EU-REF16 AND THE SHARED EFFORTS NET-
ZERO SCENARIO (UPPER FIGURE); COSTS AND INVESTMENTS COMPARED TO THE POTENTIAL IMPACT OF CO-BENEFITS AND
CLIMATE DAMAGES (BOTTOM, LEFT); UNDISCOUNTED CUMULATED TOTAL ENERGY SYSTEM COSTS BY LEVER CATEGORY [x103
BILLION EUR] (BOTTOM, RIGHT). SOURCE: CLIMACT & ECF, 2018.

                                                    6
The results show that the total system costs – if a more holistic approach is applied – are lower in the
case of a net zero GHG emission scenario than the BAU (EU-Ref16), creating a win-win situation for the
society and economy. “If all available levers are actioned, particularly on the demand side, the total
energy system costs (Investment costs + operational expenditures + fuel costs) will be lower than in a
business-as-usual scenario (the EU-REF16 scenario from the EU Commission). Essentially a net-zero
society uses its resources much more efficiently across all sectors: products with longer lifetimes and
increased asset utilisation (e.g., using fewer cars but using them more than the 5% of the time that is
currently the case). (…) It shows how strong the impact of improving the way our society is organised
can be.” (Climact & ECF, 2018)
FIGURE 5 - GHG EMISSION REDUCTIONS BY LEVER TYPES IN A SHARED EFFORTS (SEE THE SECTION ON THE “ANALYTICAL
BASIS” P.7 TO READ ON THE VARIOUS SCENARIOS USED IN THIS REPORT.) NET-ZERO SCENARIO [MTCO2E]. SOURCE: CLIMACT
& ECF, 2018.
7In the current legislative and market environment in South East Europe, especially countries which are
not yet Member States, electricity production from existing fossil fuel power plants may be the
cheapest option, as most of them are depreciated and investment costs have been recovered, enabling
them to operate at prices which recover short term marginal costs only. However, policy makers also
need to consider at least the following additional factors:
1. The projected increase in the carbon price2 compared with current levels will make fossil fuel
plants, especially coal and lignite less competitive and, eventually, render them non-
competitive
2. The phasing out of direct and indirect subsidies to fossil fuel plants needs to take place to fulfil
the requirements of the EU State aid rules that also have to be followed by Parties to the
Energy Community Treaty. This is especially important in the Western Balkans, where such
support is still significant. This will decrease the competitiveness of fossil-based generation;
3. New emission BAT requirements for large combustion plants published in 2017 need to be
implemented for all new plants being permitted and from 2021 onwards for existing plants in
the EU. For Energy Community countries a similar requirement is expected to be introduced
but some of the Contracting Parties already include the EU BAT requirements in their domestic
legislation. This will make investment in new coal installations and compliance with the rules
for existing installations significantly more costly;
4. The cost of negative externalities caused by fossil fuel generation is high, especially
environmental and health costs.
The SEERMAP project took into account only the first of these factors. Even if the other three factors
are ignored, the analysis shows that over the medium to long term coal and lignite-based electricity
generation will be priced out of the market by cheaper options. Policy makers therefore need to
address the trade-offs which characterise fossil fuel investments. In particular stranded costs3 related
2
The carbon prices in the SEERMAP models were applied for all EU member states, and from 2030 onwards also in non-
member states. The carbon price is assumed to increase from 33.5 EUR/tCO₂ in 2030 to 88 EUR/tCO₂ by 2050, in line with the
EU Reference Scenario 2016. The corresponding carbon price, although significantly higher than the current price, is a
medium level estimate compared with other estimates of EU ETS carbon prices by 2050. The EU ETS carbon price is
determined by the marginal abatement cost of the most expensive abatement option needed to stay within the emissions
cap.
3 Stranded assets “are now generally accepted to be fossil fuel supply and generation resources which, at some time prior to
the end of their economic life (as assumed at the investment decision point), are no longer able to earn an economic return
(i.e. meet the company’s internal rate of return), as a result of changes associated with the transition to a low-carbon
economy” (Carbon Tracker Initiative, 2014). The common belief is that stranded costs are higher under a high RES scenario
than under a low RES scenario. However, in the SEE region this is not the case, as most existing coal and lignite plants are old
and have already recovered their initial investment costs. It is therefore not these generation assets which risk becoming
stranded, but those newly built assets which are currently included in national plans and strategies. These new plants will not
be profitable for long enough to recover the initial investment cost if the carbon price increases and the cost of renewable
technologies continues to decrease, resulting in stranded assets. A well-planned high RES share pathway can help avoid such
an outcome as it enables policy makers to switch to RES early on, avoiding significant investment in fossil fuel technologies.
8to coal, lignite and natural gas generation assets need to be weighed against any short-term benefits
that such investments may provide.
Carbon pricing will make coal expensive
Europe is currently experiencing a high increase in the carbon price, which has been fluctuating at
around 20 EUR/tCO2 since Summer 2018, even reaching 24.85 EUR/t in September (Markets Insider,
2018).
FIGURE 6 - EU CARBON PRICES CONSTANTLY GROWING IN 2017-2018 – CO2 EUROPEAN ALLOWANCES PRICE IN EUR. SOURCE:
MARKETS INSIDER, 2018.
This increase is expected to continue in the future. The European Commission’s revision for ETS phase
4 (2021-2030) is meant to ensure the achievement of the EU's overall greenhouse gas emissions
reduction target by 2030, according to which “sectors covered by the EU Emissions Trading Scheme
(EU ETS) must reduce their emissions by 43% compared to 2005 levels” (European Commission,
2018a). It also includes plans for the EU to double the carbon price by 2021 and further increase it to
55 EUR/t by 2030 (Carbon Tracker, 2018).
If we consider exclusively the accession countries, the further penetration of coal, which is there still
on-going, is a politically and economically short sighted and questionable path to follow. A recent study
of CEE Bankwatch Network (2017a) reveals that once their power plants are also subject to the ETS,
even the small Pljevlja II coal-based power plant in Montenegro would have to pay nearly 8 mEUR
annually with an extremely low (5 EUR/t) CO2 price, while considering a more realistic price (35 EUR/t)
by 2030, the yearly costs rise to 55.6 mEUR. The same development would mean 21-146 mEUR extra
costs for Ugljevik III in Republika Srpska, which will be the largest plant in the region if it is built.
Due to carbon pricing, investments made in coal power plants, and to some extent also natural gas
power plants, will be stranded. Regarding stranded costs of fossil generation, a financial calculation
was carried out in the SEERMAP project to determine these costs of fossil generation for plants that
are built in the period 2017-2050. The utilisation rate of coal generation assets drops below 15% and
gas generation below 25% in most SEERMAP countries in the ‘delayed’ and ‘decarbonisation’ scenarios
by 2050. This means that capacities which generally need to have a 30-55-year lifetime (30 for CCGT,
40 for OCGT and 55 for coal and lignite plants) with a sufficiently high utilisation rate in order to ensure
a positive return on investment will face stranded costs. Large stranded capacities will likely require
public intervention, whereby costs are borne by society/electricity consumers. If these costs are
collected as a surcharge on the consumed electricity over a period of 10 years after these gas and coal
9capacities finish their operation then fossil plants which are retired early would have to receive 2.6
EUR/MWh, 2.5 EUR/MWh and 0.6 EUR/MWh surcharge to cover their economic losses in the ‘no
target’, ‘delayed’ and ‘decarbonisation’ scenarios respectively. This result shows that switching from
fossil fuels to renewables early on can result in lower stranded assets. Stranded costs are particularly
high in Bosnia and Herzegovina, Greece and Kosovo* in both the ‘no target’ and ‘delayed’ scenarios.
Stranded costs reach 7.3 EUR/MWh, 3.9 EUR/MWh and 7.8 EUR/MWh in the no target scenario in
these three countries, respectively. Most of these costs can be avoided by taking early action to
decarbonise the electricity sector and avoiding investment in additional fossil fuel plants.
Coal subsidies will need to be phased out, making coal less competitive
The fossil-based energy production is in many cases believed to be cheaper just because it is financed
by complex systems of state aids and other subsidies. The subsidies for fossil fuels can be extremely
high in the SEE region compared to GDP.
Estimation of fossil fuel subsidies Energy subsidies (% of GDP,
(% of GDP, 2005-2009) 2015)
Albania 7-8% 1.9%
Bosnia and Herzegovina 9-10% 37.0%
Bulgaria n.a. 33.9%
Croatia 5-6% 3.7%
Greece n.a. 2.6%
Kosovo* 35-36% n.a.
FYR of Macedonia 8-9% 18.0%
Montenegro 10-11% 16.7%
Romania n.a. 6.50%
Serbia 7-9% 34.7%
FIGURE 7 – FOSSIL FUEL SUBSIDIES IN THE REGION. SOURCE: KOVACEVIC, 2011; REN21 & UNECE, 2017 VIA KOPAČ, 2018.
The subsidies paid for fossil-based energy production are the highest in Kosovo* in the SEE region.
Kosovo* has also state aid issues: Energy Community Secretariat concluded in June 2018 that state aid
rules were not respected regarding the coal-fired Kosova e Re power plant (Balkan Green Energy News,
2018). Energy subsidies in general are high (more than third of the GDP) in Bosnia and Herzegovina,
Bulgaria and Serbia.
Changes in the LCP BAT REF will shut down many existing coal plants and make new coal plants more
expensive
EU member states as well as accession countries need to adhere to the requirements of the Industrial
Emissions Directive. On 28th April 2017, a “new round of controls on air pollution” was adopted.
(Gerrard Wynn & Coghe, 2017; CEE Bankwatch Network, 2017b; DNV GL-Energy, 2016). The limits
approved stand as reference in the EU in large thermal power plants permission procedures. They are
in accordance with the BREF document (best available techniques reference document) for Large
Combustion Plants (LCP). The LCP BREF contains limits for air pollutant emissions such as nitrogen,
oxides of sulphur, particulate matter or mercury. Not only newly built large combustion plants will
have to follow BREF requirements: existing units will also have to comply by 2021, which means that
management will have to decide in the near future on investments in pollution control technologies
(Gerrard Wynn & Coghe, 2017). According to DNV GL-Energy (2016), 84 823 MW hard coal and 53 432
MW lignite power plant capacities will be in operation in EU-28 countries by 2021. Of these, only
1018 991 MW hard coal-based (22.4%) and 5 956 MW lignite-based (11.1%) power plants will be
compliant that time. Gallop & Ciuta (2017) highlight that new BAT standards had to be applied in
countries of the Energy Community from the moment they entered into force in the European Union,
as the IPPC Directive has been transposed to national legislation in the Contracting Parties with
provisions stating that the EU BREF has to be used if there is no national-level BREF.
Gerrard Wynn & Coghe (2017) analysed the most polluting power plants in terms of SOX and NOX
emissions above 300 MWth. Most of them were concentrated in Eastern Europe and the Western
Balkans and were at least 40% above the relevant BREF limits. The “best-in-class NOX abatement would
add 2-4 EUR/MWh” according to Wynn & Coghe (2017), and 0.3-7.7 EUR/MWh according to DNV GL-
Energy (2016). The “best-in-class SOX abatement would add 6-7 EUR/MWh” according to Wynn &
Coghe (2017) and 0.4-221 EUR/MWh according to DNV GL-Energy (2016). Gerrard Wynn & Coghe
(2017) concluded that particularly in the case of older power plants, these costs are so significant that
it will be more rational to shut down these power plants. “BREF represents a significant new source of
additional financial stress for much of Europe’s coal power fleet”, which will force asset owners to
implement expensive investments in a few years, significantly restrict their operation or close the
plants.
Pollution from coal incurs additional costs to society
In addition to the above costs, the costs of negative externalities, such as health costs should be also
considered in the financial evaluation of fossil-based energy production as usually only a fraction of
these costs (negative externalities) are taken into consideration. In general, among fossil fuels, coal-
based energy production is the worst from many perspectives, but most importantly, it has substantial
effect on the climate and environment.
An average coal-fired power plant emits 40% more CO2 compared to a gas-fired power plant and 20%
more CO2 compared to an oil-fired power plant. In addition, the probability of making coal-based
power plant cleaner is small, as well as its efficiency of energy production. In the first place, the “ultra-
supercritical” (newly developed efficient) coal power plants would still produce more CO2 compared
to gas-based power plants (Tagliapietra, 2017).
In the SEE region, air pollution, energy poverty and coal dependency are important aspects of the daily
life and the externalities related to them – if properly appearing in the calculations – outweigh the cost
of RES deployment. In other words: RES scenarios can seem to be expensive, but they save lives and
have lower social (external) costs.
Annually around 400 000 people die prematurely in Europe because of air pollution. Coal plants in
Romania cause 1 600 deaths abroad (Jones et al., 2016). The emissions are not only CO2, but SOx, NOx,
PM2.5 and ashes, as well as radioactive particles and heavy metals such as mercury which “can impact
the immune system, with children most at risk”. IRENA (2018) calculates that an amount of between
USD 19 billion and 71 billion could be saved yearly until 2030 thank to the avoided negative health
effects and that the increase of the share of renewable energy could help avoid yearly environmental
costs of a minimum of USD 8 billion and a maximum of USD 37 billion for the same period.
11The cost of renewable technologies is continuously falling and in some countries these technologies
are already cheaper than traditional fossil fuel-based electricity generation technologies (IRENA et al.,
2017; see also myth A2). In 2017, more investments were carried out in installation of new renewable
energy capacities than of fossil-based units. In fact, IRENA, IEA, & REN21 (2018) claims that renewables
have become a “technologically mature, secure, cost-effective and environmentally-sustainable
energy supply option”. According to the IEA’s New Policies scenario, renewables become the most
economic generation option for many countries by 2040, when the majority (two-thirds) of global
power generation investments are expected to be renewable-based (IEA, 2017). However, in most
locations renewable technologies still require support. In addition, initial investment costs are often
high for RES technologies.
Currently renewable energy technologies are not yet fully competitive in the SEE region, but SEERMAP
results show that over the short to medium term the support required to ensure RES expansion will be
relatively low. Required support will reach 6.6 EUR/MWh at its highest on average in the SEERMAP
region. However, by 2050 the necessary RES support level will drop to 2 EUR/MWh. At the same time,
a reduction in the wholesale electricity price by 16 EUR/MWh can be achieved by 2050 compared with
scenarios with a lower share of RES, thereby benefitting society.
There will be a significant increase in the price of carbon, to around 33 EUR/tCO2 by 2030 and 88
EUR/tCO2 by 20504, meanwhile the cost of renewable energy technologies will fall. The price of coal
and lignite is expected to increase by approximately 15% by 2050 compared with 2016, according to
IEA projections. All these factors are expected to make coal and lignite-based electricity production
less competitive in future. This means, that coal and lignite-based power plants cannot remain
operational until the end of their lifetime and some of the investment cost cannot be recovered (as
formerly explained in myth A3, this is called stranded cost). A financial calculation was carried out on
the stranded costs of fossil-based generation plants that are expected to be built in the period 2017-
20505. Both total stranded cost as stranded cost relative to total electricity production annualised over
a 10-year period were calculated.
According to the SEERMAP results, driven by a high carbon price, a significant amount of fossil fuel-
based generation capacity will be replaced by 2050. That time in ‘decarbonisation‘ scenario the RES
share in net electricity generation will be 86% while nuclear 12% and fossil penetration only 2%. Coal,
lignite and oil capacities are phased out almost completely under all scenarios. However, despite the
almost complete phasing out of fossil fuels, in the ‘decarbonisation’ scenario generation and system
adequacy indicators remain favourable.
4 It is hard to project future CO2 prices. However, the price level is currently EUR 13 and the cap reduction factor will increase
from 2021 onwards. Therefore, reaching EUR 33 in 2030 does seem feasible.
5 The calculation is based on the assumption that stranded costs will be collected as a surcharge on the consumed electricity
(as is the case for RES surcharges) for over a period of 10 years after these lignite based capacities become unprofitable.
12An analysis was carried out by Öko-Institut commissioned by Agora Energiewende to determine and
compare total system costs – including generation, grids and storage – of alternative (RES-based, coal-
based and natural gas-based) energy systems in Germany by 2050 (Öko-Institut, 2017).
FIGURE 8 - COMPARISON OF TOTAL SYSTEM COSTS OF PREDOMINANTLY RENEWABLE, COAL AND NATURAL GAS-BASED
POWER SYSTEMS WITH CO₂ PRICES OF 50 EUR, 2050. SOURCE: ÖKO-INSTITUT, 2017.
The results showed three important key findings:
1. In most cases, a 95% RES energy system is cheaper or is on the same price level as other, fossil-
based scenarios. High coal share is only significantly cheaper if the CO2 prices will be around
20 EUR/t which is lower than the expectations, while gas-based systems need low gas prices
and CO2 prices below 100 EUR/t.
2. High renewable shares stabilize energy prices as variable costs are only 5% while 30-67% in
fossil-based systems, highly depending on variability of fuel and CO2 prices.
3. While estimated CO2 damage costs are 80 EUR/t on the short-term and 145-260 EUR/t on the
long-term, a high share (95%) RES-based electricity system is able to decrease CO2 emissions
by 96% only for 50 EUR/t, providing a cost-efficient solution for tackling climate change. (Öko-
Institut, 2017)
INSIGHTS FROM ROMANIA:
The SEERMAP modelling assumes that current coal and lignite fired generation plants are retired in all
scenarios by 2030, in accordance with national plans. The model does not build any new lignite or coal
capacities and he total share of fossil fuel-based generation decreases in all scenarios compared with
current levels by 2050. This confirms – in line with the national strategies dealing with that period of
time containing no new coal or lignite power plants – that coal is not a cost-efficient generation option
in Romania. However, in spite of that, the draft of the new Energy Strategy of Romania does contain a
new 600 MW lignite power plant to be built until 2030 (Romanian Ministry of Energy, 2018).
The sensitivity analysis showed that a low carbon price which is half of the level assumed in the
‘decarbonisation’ scenario is still not enough to make lignite and coal-based generation profitable in
Romania over the medium term.
Renewables play an increasingly important role in all three scenarios meaning that they are
economically feasible solution in the future. New wind capacity investment is particularly strong,
13almost tripling by 2050 in the ‘delayed’ scenario and also increasing significantly in the
‘decarbonisation’ scenario, due to a combination of high wind potential, decreasing cost of technology
and the price of carbon. New solar investments increase at an even higher rate, reaching five times
2016 levels by 2050 in the ‘decarbonisation’ scenario, but in absolute terms solar additions are more
moderate, and the same applies to biomass. Meanwhile hydro capacity increases by approximately
20% across the period in both the ‘delayed’ and ‘decarbonisation’ scenarios.
See also myth A3 and A5.
IRENA et al. (2017) also confirm that the cost-competitive renewable energy potential is comparably
high in Romania. Moreover, it “has the largest additional cost-competitive solar capacity in the whole
SEE region (up to 16.9 GW)” and it also has a significant wind potential of 84 GW. IRENA et al., (2017)
also highlights that “the total additional cost-competitive renewable energy potential (up to 71 GW) is
approximately six times higher than the deployment level today or the level envisaged in the NREAP
by 2020”.
INSIGHTS FROM GREECE:
SEERMAP results show that coal, lignite and oil capacities are phased out under all scenarios by 2050.
The decrease in the share of these fuels begins early, mainly driven by the rising price of carbon and
the low marginal cost of RES which results in unprofitable utilisation rates of existing fossil fuel
capacities. The share of coal falls to around 10% of total generation by 2040 in all scenarios. Whether
or not Greece pursues an active policy to support renewable electricity generation, fossil fuel
generation capacity will decline precipitously driven by the price of carbon. The sensitivity analysis
showed that a 50% lower carbon price would increase the utilisation rates of coal power plants only
by 11% in 2030 and by 10% in 2050. However, this is not enough to make coal competitive by 2050 as
significantly higher utilisation rates are required to avoid plant closure. Policy makers need to address
the trade-offs which characterise fossil fuel investments. Coal and oil generation capacities are
expected to be priced out of the market before the end of their lifetime in all scenarios; coal
investments made at any time during the modelled time period will result in stranded assets.
The decarbonisation of the electricity sector in Greece is “inevitable with or without new measures
and policies and even without very high CO2 prices6” based on the results of the 10 scenarios from
CRES, NOA, SEERMAP and the EU 2016 Reference Scenario (Lalas & Gakis, 2017).At the same time the
abatement costs related to fossil energy production should be also considered, when comparing costs
of fossil-based and RES-based capacities in the energy system. The Dimitrios ST Ι-II power plant in
Greece has NOX emissions more than 150% above BREF (Best Available Techniques Reference; see
myth A3)(Gerrard Wynn & Coghe, 2017). This means, that by 2021, the plant should be ready with new
technological investments – which could add 2-4 EUR/MWh cost on electricity generation (Gerrard
Wynn & Coghe, 2017) – or it has to be closed.
Roinioti, Koroneos, & Wangensteen (2012) designed and calculated 4 different long-term scenarios
besides a reference scenario to provide an outlook to the Greek electric system by 2030 focusing on
RES development. The scenarios’ narratives are:
− Green scenario: low emissions, high growth; advanced RES technologies;
− Orange scenario: high emissions, high growth; traditional energy & RES;
− Red scenario: high emissions, low growth; traditional energy;
− Blue scenario: low emissions, low growth; advanced RES & traditional energy.
6 They expect 8-15 EUR/MWh by 2020, 20-33.5 EUR/MWh by 2030 and 30-88 EUR/MWh by 2050.
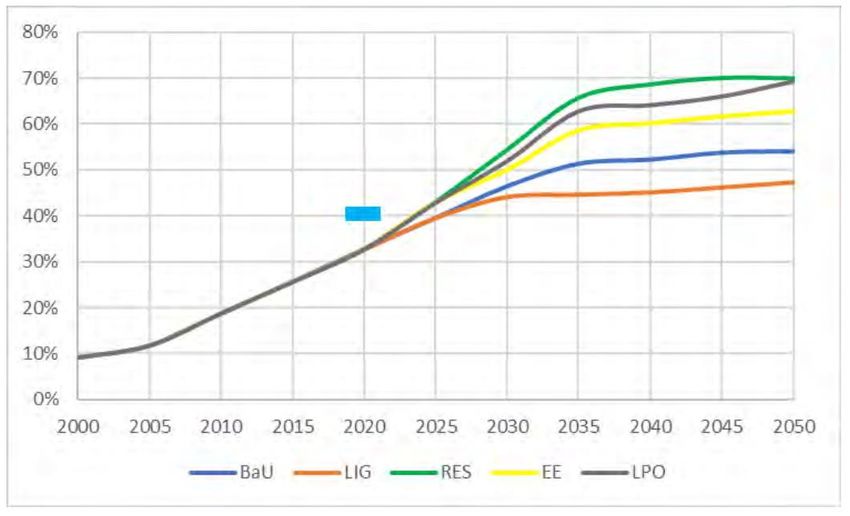
14FIGURE 9 - ELECTRICITY GENERATION PER TECHNOLOGY TYPE AND SCENARIO (GWH). SOURCE: ROINIOTI, KORONEOS, &
WANGENSTEEN, 2012.
Under the Reference scenario, natural gas-based electricity will expand from 19% in 2009 to 48% in
2030. In Green scenario, it increases to 32% by 2020 and does not change until 2030. Small hydro
production share expands from 10% to 15% of electricity generation between 2020 and 2030. The RES
share reaches 53.1% in the Green, 41.9% in the Blue, 33.7% in the Orange and 25.4% in the Red
scenario by 2030 (Roinioti et al., 2012). This research clearly shows that in any scenarios, including the
Reference scenario, the role of lignite-based power production will decrease while electricity from gas,
wind and PV will increase dynamically by 2030.
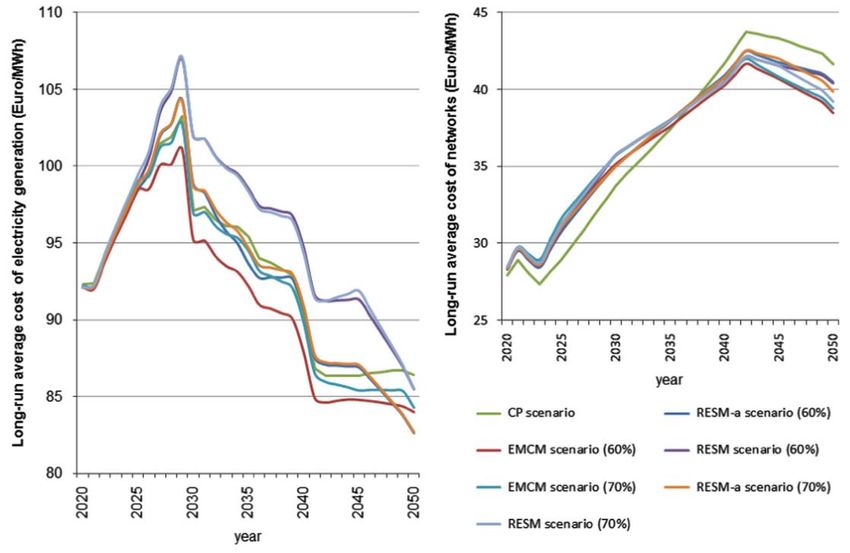
Tigas et al. (2015) modelled 3 different scenarios (CP – current policies, RESM – renewable electricity
share maximalisation, EMCM – environmental measures and cost minimalization) with several versions
(RES-a with electricity import, EMCM-a uses CCS in lignite power plants).
15FIGURE 10 – LONG-RUN AVERAGE COST OF ELECTRICITY GENERATION AND NETWORK EXPANSION IN GREECE BETWEEN 2020
AND 2050. SOURCE: TIGAS ET AL., 2015.
The model results pointed out that Current Policies Scenario is the worst choice as it resulted in the
most expensive generation and also network costs by 2050, while other scenarios’ expenditures are
falling after 2030. It is not only uneconomical but also cannot fulfil the CO2 reduction expectations.
Meanwhile the other scenarios provide 60-70% emission reduction compared to 2005, lower import
dependency, more stable energy prices and create a domestic RES industry (Tigas et al., 2015).
A new research report from WWF and National Observatory of Athens investigating the potential for
significant decarbonisation in Greece analysed the following scenarios (WWF & NOA, 2017):
1. Business as Usual (BaU)
2. Expansion of Lignite Use (LIG)
3. Expansion of RES Use (RES)
4. Energy Efficiency (EE)
5. Efficiency and Lignite Phase-Out (LPO)
The concluding remarks highlight that without phasing out lignite, the EU targets for 2030 cannot be
achieved. RES share is expected to increase in all scenarios, which will require – depending on which
scenario is followed – total investment costs of between 23 and 33 billion EUR (including new
conventional power plants in some cases). The BAU and LIG scenarios, where the nowadays cheap
lignite is further used or even expanded, do not provide cheap electricity by 2030. The reason is that
cheap wind power will compete with lignite where fuels as well as emission allowances (25 EUR/t CO2
in the study) have to be purchased.
INSIGHTS FROM THE FORMER YUGOSLAV REPUBLIC OF MACEDONIA:
The SEERMAP results showed that based on market model simulations, in all scenarios, phasing out
lignite and reaching 61-89% RES share is the cost-optimal solution by 2050.
16Taseska et al. (2011.) created three different energy scenarios for Macedonia with software modelling
and optimizing tools to analyse the consequences of substituting two lignite power plants with gas-
based CHPs (first mitigation scenario) or with more (180 GWh in 2050) renewables (second mitigation
scenario).
FIGURE 11 – MITIGATION COSTS IN BASELINE, FIRST AND SECOND MITIGATION SCENARIO. SOURCE: TASESKA, MARKOVSKA,
CAUSEVSKI, BOSEVSKI, & POP-JORDANOV, 2011
According to the results, the total system cost in the first mitigation scenario is slightly more expensive
than the baseline scenario, resulting in mitigation costs of 7.84 $/t CO2-eq. Taseska et al. (2011)
concludes that “the second mitigation scenario has a potential for reduction of almost 80 000 kt CO2eq
at negative price (win-win mitigation)”, pointing out that decarbonisation is inexpensive with high-
share RES scenario. This is possible by the liberalisation of the electricity market including the industrial
sector and also due to the increasing investment costs of lignite power production because of the EU’
Industrial Emission Directive (see myth A3 about BREFs).
A study of Ćosić, Krajačić, et al. (2012) reveals that by implementing energy efficiency measures that
decrease consumption levels and with the installation of new generation capacities, a 100%
renewables based electricity system is achievable by 2050.
FIGURE 12 - ELECTRICITY GENERATION BY TECHNOLOGIES FOR DIFFERENT SCENARIOS. SOURCE: ĆOSIĆ, KRAJAČIĆ, ET AL., 2012
17According to this study, biomass makes the most significant contribution to primary energy production
(19,8 PJ). In order to achieve an electricity system relying 100% on renewables, high share of hydro
(2.9 TWh), wind (7.08 TWh) and solar power (2.69 TWh) is necessary as well as the application of
different storage technologies (including electric vehicles and heat pumps). If a high share of biomass
and hydro is to be avoided for sustainability reasons, additional energy efficiency measures may be
required especially in a region where numerous conflicts between renewable energy development and
nature protection exist (see myth B1).
FIGURE 13 - ANNUAL OPERATING COSTS OF THE VARIOUS SCENARIOS. SOURCE: ĆOSIĆ, KRAJAČIĆ, ET AL., 2012
According to the hourly detailed energy system model of Ćosić, Krajačić, & Duić (2012), with a CO2
price of 25 EUR/t, the “reference scenario in the year 2030 is the most expensive scenario due to high
consumption of fossil fuels and because of CO2 emissions”. The 100% renewable energy system has
the lowest fuel cost compared to reference scenario, but in this scenario annual investment costs are
the highest. Total annual investment cost for the 50% renewable energy system is 776 mEUR while the
annual investment costs for the 100% renewable energy system is 1161 mEUR.
INSIGHTS FROM SERBIA:
A report of UNEP (2013) provides an overview and starting point for Serbia’s transition to a green
economy based on a modelling research for 2030. The “results indicate that there are significant long-
term benefits from a transition to a green economy in each of the (analysed) sectors” (energy demand,
supply, agriculture and transportation) that would also decrease electricity prices making renewables
a more affordable solution.
18FIGURE 14 – COMPARISON OF ANNUAL INVESTMENTS (POSITIVE VALUES) AND AVOIDED COSTS (NEGATIVE VALUES) FOR
POWER AND TRANSPORT IN SERBIA BETWEEN 2012 AND 2030. SOURCE: UNEP, 2013.
Regarding energy demand, “avoided costs will be higher than investments by 2030, reaching a
cumulative net benefit of 1 to 2 billion EUR, or approximately 50 to 100 million EUR per year.
Simulation reveals that the overall payback time is seven to 10 years, with the breakeven point (from
an economy-wide perspective) being reached in 2019-2022.”
On the supply side, 5 000 to 10 000 GWh coal-based energy production is avoided in 2030, resulting in
approximately 1.3 billion EUR of capital savings. “Based on rough assumptions (at 20 EUR per ton) on
the current and future cost of coal for power generation, the net investment for energy supply reaches
a total of 10 to 40 million EUR in 2030, or reaching up to 50% of the annual investment.” (UNEP, 2013)
INSIGHTS FROM BOSNIA AND HERZEGOVINA:
The SEERMAP results show that stranded costs equal 7.3 EUR/MWh in the ‘no target’ scenario and 7.6
EUR/MWh in the ‘delayed’ scenario, which adds up to total 1513 mEUR and 1565 mEUR, respectively,
to the whole modelling period. The annualised stranded cost figure is the second highest figure (after
Kosovo*) in the SEERMAP region and is significantly higher than the renewable support per MWh
needed to enable Bosnia and Herzegovina to meet EU emission reduction targets in the
‘decarbonisation’ scenario.
INSIGHTS FROM KOSOVO*:
SEERMAP results show that stranded costs equal 7.8 EUR/MWh in the ‘no target’ scenario and 8.1
EUR/MWh in the ‘delayed’ scenario, which adds up to a total of 629 mEUR and 664 mEUR, respectively,
over the whole modelling period. This annualised stranded cost figure is the highest figure in the
SEERMAP region and is significantly higher than the renewable support needed to enable Kosovo* to
meet EU emission reduction targets in the ‘decarbonisation’ scenario. By contrast, the stranded asset
surcharge is only 0.1 EUR/MWh and 9 mEUR in total in the ‘decarbonisation’ scenario.
Other studies confirm that fossil-based energy production is the most expensive solution in the future
in Kosovo*. According to the World Bank’s Expert Panel’s estimation, the new coal-based power plant
in Kosovo* cannot be competitive with renewable generation as the LCOE of it is estimated to be
approximately 81.42 EUR/MWh when it will be finished. The official “target” consumer price of the
contract is 80 EUR/MWh – which does not contain all costs (Gerard Wynn & Azemi, 2018). The contract
19includes “availability payments”, which seems to be prohibited state aid according to the new EU
guidelines according to the Energy Community (Balkan Green Energy News, 2018).
Kittner, Dimco, Azemi, Tairyan, & Kammen (2016) find that a range of alternatives exists to meet
present supply constraints all at a lower cost than constructing Kosova e Re, the proposed 600 MW
coal plant7. The options include energy efficiency measures, combinations of solar PV, wind,
hydropower, biomass and the introduction of natural gas.
For example, the Euro 2030 path is a pathway that meets Kosovo’s future electricity demand in an
economical and reliable manner. It is a trajectory that uses the original EU 2030 targets, namely 27%
increase in energy efficiency, 27% reduction in Co2 emissions and 27% RES share in final energy
consumption. It can be seen that fossil based generation is decreasing over time while the share of
renewables grow. By 2025, solar PV is expected to increase steeply which will lead to electricity
production higher than consumption, thus even make the decrease of imports possible.
Figure 15 - EURO 2030 PATH: ENERGY EFFICIENCYMEASURES (27% INCREASE), 27%CO2 REDUCTION,>27%RENEWABLE
CONSUMPTION, EXPANDED POWER EXCHANGE. SOURCE: KITTNER, DIMCO, AZEMI, TAIRYAN, & KAMMEN (2016).
7 The contract was later signed for an 500 MW power plant in December 2017 by Kosovo's government and ContourGlobal
(USA) (Jonuzaj, 2017). The construction works are planned to start in 2019, the power plant is expected to work from 2023
(Jonuzaj, 2018a).
20Retail prices consist of the wholesale price plus subsidies, taxes, fees and network costs. Of these retail
price components the SEERMAP report covered wholesale prices and RES support.
The most important result of the SEERMAP models is that the price of electricity follows a similar
trajectory in all scenarios in all countries in the SEERMAP region, only diverging after 2045 when prices
are lower in the scenarios which have decarbonisation targets as a result of the low marginal cost of
RES electricity production. The SEERMAP model calculations show that compared to a scenario with
no emission reduction target, decarbonisation policies do not drive up wholesale electricity prices. The
wholesale price of electricity is not driven by the level of decarbonisation but by the CO₂ price, which
is applied across all scenarios, and which apply in all EU member states irrespective of their RES targets,
and the price of natural gas. See also myth A3.
FIGURE 16 - WEIGHTED AVERAGE RES SUPPORT PER MWH OF TOTAL ELECTRICITY CONSUMPTION AND WEIGHTED AVERAGE
WHOLESALE PRICE, 2016-2050 (EUR/MWh). SOURCE: SEERMAP REGIONAL REPORT SOUTH-EAST EUROPE.
Despite the significant investment needs associated with renewables, the renewables support needed
to incentivise investments in the two decarbonisation scenarios decreases over time if a long-term RES
support policy is implemented which enables countries to increase high RES shares gradually. The RES
support needed to achieve almost complete decarbonisation in the ‘decarbonisation’ scenario is only
21You can also read