REPUBLIC OF KOREA FINANCIAL SECTOR ASSESSMENT PROGRAM - International Monetary Fund
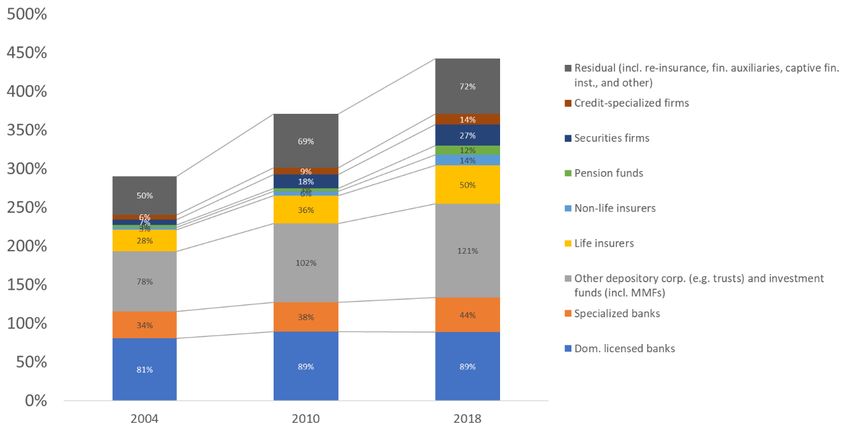
←
→
Page content transcription
If your browser does not render page correctly, please read the page content below
IMF Country Report No. 20/279

 REPUBLIC OF KOREA
 FINANCIAL SECTOR ASSESSMENT PROGRAM
[MONTH] [YY
September 2020
 TECHNICAL NOTE— SYSTEMIC RISK ANALYSIS,
 FINANCIAL SECTOR STRESS TESTING, AND AN
 ASSESSMENT OF DEMOGRAPHIC SHIFT IN KOREA

 This Technical Note on Systemic Risk Analysis, Financial Sector Stress Testing, and an
 Assessment of Demographic Shift in Korea for the Republic of Korea FSAP was prepared
 by a staff team of the International Monetary Fund as background documentation for the
 periodic consultation with the member country. It is based on the information available at
 the time it was completed in September 2020.

 Copies of this report are available to the public from

 International Monetary Fund • Publication Services
 PO Box 92780 • Washington, D.C. 20090
 Telephone: (202) 623-7430 • Fax: (202) 623-7201
 E-mail: publications@imf.org Web: http://www.imf.org
 Price: $18.00 per printed copy

 International Monetary Fund
 Washington, D.C.

 © 2020 International Monetary Fund
REPUBLIC OF KOREA
 FINANCIAL SECTOR ASSESSMENT PROGRAM
September 1, 2020

 TECHNICAL NOTE
 SYSTEMIC RISK ANALYSIS, FINANCIAL SECTOR STRESS
 TESTING, AND AN ASSESSMENT OF DEMOGRAPHIC SHIFT
 IN KOREA

 The content of this Technical Note is based on information available as of end-
 June/December 2019, before the global intensification of the COVID-19 outbreak. It
 focuses on the Republic of Korea’s medium-term challenges and policy priorities and
 does not cover the outbreak or the related policy response, which has since become the
 overarching near-term priority.

 Prepared By This Technical Note was prepared in the context of
 Monetary and Capital Markets an IMF Financial Sector Assessment Program (FSAP)
 Department in the Republic of Korea in August 2019 and
 December 2019 that was led by Udaibir Das. Further
 information on the FSAP can be found at
 http://www.imf.org/external/np/fsap/fssa.aspx
REPUBLIC OF KOREA

 CONTENTS
Glossary __________________________________________________________________________________________ 5

EXECUTIVE SUMMARY _________________________________________________________________________ 7

MACRO-FINANCIAL ENVIRONMENT, SYSTEM STRUCTURE, AND SCOPE OF THE SYSTEMIC
RISK ANALYSIS __________________________________________________________________________________ 9
A. Financial System Structure and Trends _________________________________________________________ 9
B. Macro-Financial Environment _________________________________________________________________ 20
C. Korean Housing Market Structure and Dynamics _____________________________________________ 22
D. Scope of the Systemic Risk Analysis __________________________________________________________ 23

RISKS, VULNERABILITIES, AND MACRO-FINANCIAL SCENARIOS ___________________________ 29
A. Risks, Vulnerabilities, and Macro-Financial Scenarios _________________________________________ 29
B. Fintech Developments in Korea _______________________________________________________________ 34

FORWARD-LOOKING BANK SOLVENCY ANALYSIS ___________________________________________ 36
A. Methodology _________________________________________________________________________________ 36
B. Results ________________________________________________________________________________________ 50
C. Recommendations ____________________________________________________________________________ 61

FORWARD-LOOKING BANK LIQUIDITY ANALYSIS ___________________________________________ 62
A. Overview ______________________________________________________________________________________ 62
B. Current Liquidity Conditions and Banks’ Liquidity Profiles ____________________________________ 62
C. Methodology _________________________________________________________________________________ 63
D. Results ________________________________________________________________________________________ 63
E. Recommendations ____________________________________________________________________________ 64

RISK ANALYSIS FOR THE INSURANCE AND PENSION FUND SECTOR _______________________ 68
A. Insurance Sector ______________________________________________________________________________ 68
B. Pension Fund Sector __________________________________________________________________________ 73
C. Recommendations ____________________________________________________________________________ 75

NETWORK AND CONTAGION ANALYSIS _____________________________________________________ 75
A. Analysis _______________________________________________________________________________________ 75
B. Recommendations ____________________________________________________________________________ 76

2 INTERNATIONAL MONETARY FUND
REPUBLIC OF KOREA

DEMOGRAPHIC DEVELOPMENTS IN KOREA __________________________________________________ 78

BOXES
1. The Z-Score Methodology ____________________________________________________________________ 39
2. Hybrid PD-Satellite-Z-factor Methodology and Dynamic Balance Sheets _____________________ 41
3. Lifetime (LT-) ECL and Provision Stock and Flow Calculations _________________________________ 45
4. Fintech Overlay – Methodology _______________________________________________________________ 49

FIGURES
1. Financial System Structure ____________________________________________________________________ 11
2. Depository Institutions’ Business Models _____________________________________________________ 13
3. Structure of the Insurance Sector _____________________________________________________________ 14
4. Financial System Performance ________________________________________________________________ 17
5. Bank Profitability (Significant Institutions): Key Trends ________________________________________ 18
6. Korean Banks’ Asset Portfolio Structure, Liability Structure, and P&L Components____________ 19
7. Solvency and Profitability of the Insurance Sector_____________________________________________ 20
8. Macrofinancial Environment __________________________________________________________________ 25
9. Housing Market _______________________________________________________________________________ 26
10. Demographics Shift and Household Debt ___________________________________________________ 27
11. Baseline and Adverse Macro-Financial Scenario _____________________________________________ 32
12. Baseline and Adverse Scenario Paths for Real GDP in Historical Perspective _________________ 33
13. Cumulative Real GDP Deviations (Adverse Relative to Baseline) _____________________________ 34
14. Implications of Open Banking and E-Money Developments in Korea ________________________ 34
15. Dependencies Captured in Top-Down Solvency Model Suite for Korean Banks ______________ 36
16. P&L Structure and Model Approaches Adopted for the Korea Solvency Analysis ____________ 37
17. Credit Risk Module Structure ________________________________________________________________ 38
18. Baseline and Adverse Scenario-Conditional PDs _____________________________________________ 38
19. Perfect Foresight and Risk Parameter Behavior after Initial 5-Year Horizon __________________ 42
20. Baseline and Adverse Scenario-Conditional LGDs ____________________________________________ 43
21. Effective Interest Rates for ECL Discounting Purposes _______________________________________ 44
22. Banks’ Historical Effective Interest Rate Evolution for Korean Banks _________________________ 47
23. Nonlinear Solvency-to-Funding Cost Feedback for Korean Banks ___________________________ 48
24. Solvency Stress Test Results: CET1 Ratios, Sub-Sector Aggregates ___________________________ 51
25. Changes in CET1 Capital Ratios from Starting Point to Low Point Under the Adverse Scenario52
26. Capital Depletion Under the Adverse Scenario_______________________________________________ 52
27. Asset Exposure Shares vs. Credit and Market Loss Shares Under the Adverse Scenario ______ 52
28. Fintech Overlay—Impact on Banks’ Capitalization Under Conservative Assumptions ________ 54
29. Fintech Overlay—Impact on NIMs ___________________________________________________________ 55
30. Solvency-Liquidity Cost Feedback ___________________________________________________________ 55
31. Capital Ratios’ Sensitivity to Stronger House Price Shock for Residential Mortgage Portfolios56
32. Mortgage Insurance Shares Across Korean Banks____________________________________________ 57

 INTERNATIONAL MONETARY FUND 3
REPUBLIC OF KOREA

33. Impact on Accounting Provision Stocks, Flows, and Risk Weights when Assuming that Mortgage
Insurance was Absent ___________________________________________________________________________ 58
34. Capital Ratio Differentials under Different Static and Dynamic Balance Sheet Variants (Adverse
Scenario _________________________________________________________________________________________ 59
35. Loan Loss Coverage as of End-2018, Regulatory Provision-based vs. Top-down Model based
(Adverse Scenario) _______________________________________________________________________________ 59
36. Impact of Regulatory Loan Loss Coverage on Capital Ratios and Depletion _________________ 60
37. Sensitivity of Capital Ratios to RWA Pass-Through Strength under the Adverse Scenario____ 60
38. Liquidity and Stable Funding_________________________________________________________________ 65
39. Liquidity Stress Test __________________________________________________________________________ 66
40. Insurance Stress Test Sample—Fixed-Income Portfolio ______________________________________ 71
41. Insurance Stress Test—RBC Coverage _______________________________________________________ 72
42. Insurance Stress Test—Contribution of Individual Shocks____________________________________ 72
43. Insurance Profitability Projections After Stress _______________________________________________ 73
44. The National Pension Fund __________________________________________________________________ 74
45. Financial System Network Structure _________________________________________________________ 76
46. Sector-Level Default Simulation: Capital Depletion __________________________________________ 77
47. Network Centrality (Eigenvector Centrality) __________________________________________________ 77
48. Demographic Developments Proportion of Population Ages 65+ ___________________________ 78
49. Old Age Poverty Across OECD Countries ____________________________________________________ 79
50. Channels through which Demographic Developments May Impact the Financial System ____ 81
51. Korean Financial System’s Total Asset Dynamics _____________________________________________ 82
52. Scenarios for Population Growth and Dependency Ratios in Korea until 2067 _______________ 82
53. Demographics Scenario-Conditional Total Asset Dynamics __________________________________ 83

TABLES
1. Main Recommendations _______________________________________________________________________ 8
2. Financial System Structure ____________________________________________________________________ 12
3. Core Financial Soundness Indicators, 2012–17 ________________________________________________ 16
4. Selected Economic Indicators, 2017–24 _______________________________________________________ 24
5. Korean Banks In-Scope of the Systemic Risk Analysis and Stress Test _________________________ 28
6. Insurance Firms Included in the Stress Test ___________________________________________________ 29
7. Baseline and Adverse Macro-Financial Scenario—Main Features______________________________ 31
8. Insurance Stress Test Scenario ________________________________________________________________ 70

APPENDICES
I. FSAP Risk Assessment Matrix (RAM) ___________________________________________________________ 85
II. Solvency and Liquidity Stress Test Matrices for Banks and Insurers (STeMs) __________________ 86
III. Liquidity Stress Test – Calibration Details _____________________________________________________ 91
IV. Solvency Stress Test – Mapping MR and CR Methodology ___________________________________ 94
V. Solvency Stress Test – Credit and Interest Income and Expense Models ______________________ 96

4 INTERNATIONAL MONETARY FUND
REPUBLIC OF KOREA

 Glossary
AC Amortized Cost
AFC Asian Financial Crisis
BMA Bayesian Model Averaging
CC Consumer Credit
CCC Credit Community Cooperative
CCyB Countercyclical Capital Buffer
CR Credit Risk
CU Credit Union
DBS Dynamic Balance Sheet
D-SIB Domestic Systemically Important Institutions
EAD Exposure at Default
ECL Expected Credit Loss
EIR Effective Interest Rate
FVOCI Fair Value through other Comprehensive Income
FVPL Fair Value through P&L
GFC Global Financial Crisis
HF Korea Housing Finance Corporation
HM Household Mortgages
HUG Korea Housing & Urban Guarantee Corporation
IFRS International Financial Reporting Standard
KFS Korea Forest Service
IFRS International Financial Reporting Standard
IRB Internal Ratings-Based Approach (under Basel II/III)
LCR Liquidity Coverage Ratio
LGD Loss Given Default
LL Loan Loss
LRM Long-Run Multiplier
MoAFRA Ministry of Agriculture, Food and Rural Affairs
MoIS Ministry of the Interior and Safety
MoOaF Ministry of Oceans and Fisheries
MR Market Risk
MSB Mutual Savings Bank
MtM Mark-to-Market
NFD Non-Deliverable Forward
NFC Nonfinancial Corporate
NFCI Net Fee and Commission Income
NII Net Interest Income
NIM Net Interest Margin
NPS National Pension Service
NSFR Net Stable Funding Ratio
NTI Net Trading Income

 INTERNATIONAL MONETARY FUND 5
REPUBLIC OF KOREA

 OCI Other Comprehensive Income
 ODIs Other Depository Institutions
 OOE Other Operating Expense
 PD Probability of Default
 PiT Point-in-Time
 P&L Profit and Loss
 RBC Risk-Based Capital
 RWA Risk-Weighted Assets
 SBS Static Balance Sheet
 SGI Seoul Guarantee Institution
 SME Small and Medium-Sized Enterprise
 SOV Sovereign
 STA Standardized Approach (under Basel II/III)
 TM Transition Matrix
 TR Transition Rate
 TTC Through-the-Cycle
 WEO World Economic Outlook

6 INTERNATIONAL MONETARY FUND
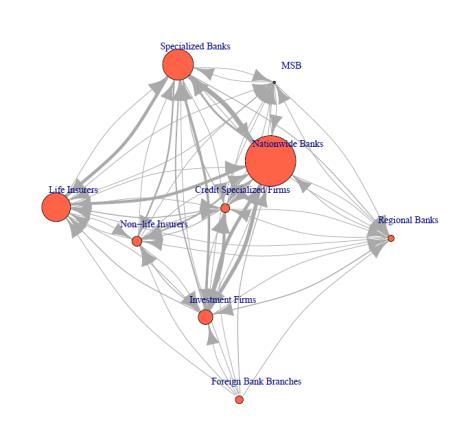
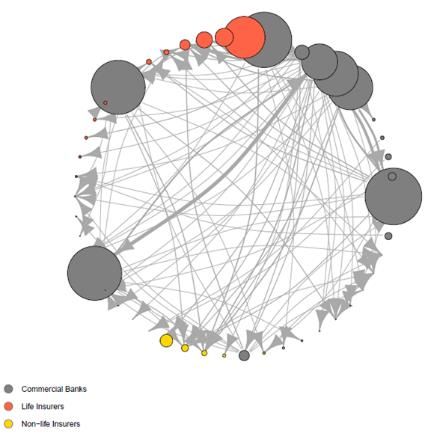
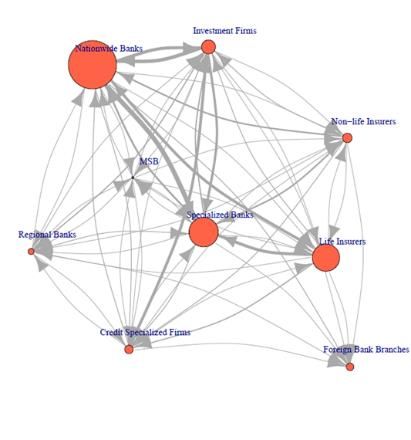
REPUBLIC OF KOREA

EXECUTIVE SUMMARY 1
This note presents the systemic risk analysis conducted for the Republic of Korea in the course
of the 2019 Korea FSAP. It comprises a forward-looking solvency analysis for banks, insurers, and
pension funds, a liquidity stress test for banks, and an assessment of network and
interconnectedness for a wide range of financial sector entities and their ties to the real economy.
Various structural characteristics of Korea’s economy and its financial system informed the
features and focus for its forward-looking risk analysis. They include Korea’s strong export
orientation, limited diversification, and its key role as a node in regional and international supply
chains. Korea’s financial system has grown by 40 percentage points of GDP since 2013, enhancing
the importance of a deep financial sector analysis as conducted through the FSAP. Mortgage
insurance schemes are widely used—which was reflected in the way the risk assessment for banks
was conducted. Korea’s life and non-life insurance sector is large, highly concentrated and saturated.
Fintech developments keep accelerating, in terms of its Open Banking system and e-money
providers. Demographic developments in Korea are among the most adverse world-wide, implying a
continuous drag on demand, downward pressure on interest rates, financial firms’ income, and
hence their capitalization unless they will be altering their business models.
The bank solvency risk analysis concludes that the Korean banking system is broadly resilient
to a severe economic downturn scenario. The performance of banks under a macro-financial
downturn scenario would be to an extent heterogeneous, with the drop in specialized banks’ capital
ratios being most pronounced, and those of ODIs, including Mutual Savings Banks and Credit
Cooperatives, being most dispersed. None of the nation-wide, regional, and specialized banks are
found to fall short of regulatory capital minima. Fintech-implied rising competition in the banking
system can have notable implications in terms of systemic liquidity, implied solvency as well as
system-wide operational risks.
The FSAP team’s assessment is that the adverse FSAP macro-financial scenario is severe
enough to encapsulate a COVID-19 implied fallout on economic activity. This assessment
stands both in terms of the expected depth and duration of the shock (the FSAP’s scenario’s deep
downturn spans over two full years before normalizing).
Measures have been taken to strengthen the liquidity of the Korean banking system and
banks have ample room to withstand liquidity shocks. Overall, the banking system is likely to
maintain adequate liquidity, both in terms of domestic and foreign currency, following hypothetical
asset price falls, retail funding and wholesale funding shocks. In general, this is the assessment for all
types of banks in Korea. However, state-owned banks’ reliance on unsecured wholesale funding
would lead to a fall in FX liquidity coverage from 112 percent to 85 percent.

1 This author of this note is Marco Gross (overall workstream lead; scenario design, bank solvency, network analysis,
demographics analysis), member of the FSAP 2019 team led by Udaibir Das, as well as, Farid Jimmy Boumediene
(housing market analysis and bank liquidity stress testing), Timo Broszeit (insurance sector stress testing), and
Elizabeth Mahoney (research assistance). Selected inputs were provided by Sohrab Rafiq. The analysis has benefitted
from discussions with the staff of the BOK, FSC, FSS, the Korea FSAP team, and reviewers at the IMF. The FSAP team is
grateful for the excellent cooperation of the Korean authorities and for sharing all data for conducting the systemic
risk analysis.

 INTERNATIONAL MONETARY FUND 7
REPUBLIC OF KOREA

Insurance firms’ capital would decline substantially under the stress scenario, while all firms
would stay above regulatory thresholds. The top-down solvency stress test for life and non-life
insurance firms covered about 75 percent of the market. The same narrative and severity of the
scenario from the banking sector solvency analysis were adopted. Under the current accounting
regime, held-to-maturity designation is still allowed—and widely used among life insurers—hence a
significant portion of insurers’ investments were shielded from market price changes. Life insurers
specifically would experience a significant decline in income, pointing to the need for them to
restructure their business to restore underwriting profitability, and shifting further from guaranteed
savings products into lower guarantees and protection business.
The interconnectedness analysis for the Korean financial system suggests that specialized
banks are as systemic as nation-wide commercial banks. Nation-wide banks are net lenders to
specialized banks, and hence are more vulnerable to specialized banks than the other way around.
Insurers are not as systemic but vulnerable to stress, should it arise, in the banking system; insurers
are net lenders to all other sub-segments of the financial system in Korea.
The recommendations derived from the systemic risk analysis pertain in many respects to
enhancing the Korean authorities’ quantitative assessment frameworks (Table 1). They include
the urgent need for a detailed quantitative impact analysis of Fintech developments in terms of
systemic liquidity and system-wide operational risks which the Open Banking and e-money
developments may imply—despite their positive intent and expected benefits. Real estate market
structures in Korea, including the Jeonse leasehold system, ought to be better reflected and the
related risks be assessed, amid a slowing economy due to adverse demographic developments.

 Table 1. Korea: Main Recommendations
 Recommendations Timing*

 Systemic Risk Analysis
 Conduct an impact assessment related to Fintech developments (Open Banking, e-money developments); I
 addressing possible repercussions of such developments in terms of systemic liquidity, competition (solvency
 impact for financial institutions), and system-wide operational risks.
 Further develop risk assessment models to reflect real estate market structures in Korea, including Jeonse ST
 leasehold market system; thereby help assess rollover risk implied by the leasehold system and its inherent
 connectedness to other financial market segments through leasehold investments.
 Categorize ODIs (including Credit Unions, Mutual Savings Banks, and Credit Cooperatives) as banks, not non- MT
 banks; to avoid potentially misleading inference about overall banking system dynamics.
 Solvency Analysis and Stress Testing
 Further develop analytical capacity for capturing loan insurer structures (e.g. HF, SGI, etc.), accounting for MT
 their implied significant nonlinear system behavior under economic downturn scenarios.
 Develop solvency stress test models to account for banks’ continuous selling of NPLs to the NPL market. MT
 Develop lifetime expected credit loss models to allow K-IFRS 1109-compatible top-down stress testing to MT
 help oversight institutions gauge the adequacy of financial institutions’ provision coverage.
 Broaden range of insurance stress test scenarios, basing them on regularly updated medium-term risk ST
 outlook.
 After the implementation of the new insurance capital standard (K-ICS), use stress test results as an input MT
 factor for the determination of the level of supervisory intensity and, if implemented, capital add-ons.
 Liquidity Analysis and Stress Testing
 Continue to improve bank liquidity stress test framework for domestic currency and develop FX liquidity ST
 stress test by major currencies.
 Expand the methodology of the joint BOK and FSS FX liquidity stress test to include FX LCRs. MT
 Source: IMF staff. * I = immediate, ST = short-term, MT = medium-term.

8 INTERNATIONAL MONETARY FUND
REPUBLIC OF KOREA

MACRO-FINANCIAL ENVIRONMENT, SYSTEM
STRUCTURE, AND SCOPE OF THE SYSTEMIC RISK
ANALYSIS
A. Financial System Structure and Trends
1. As of 2018Q4, total assets of financial Financial Institutions' Assets
 (in percent of total)
institutions in Korea reached about 300 percent of 2013

GDP. Since the previous 2013 FSAP, Korea’s financial 2018 Commercial Banks

system has grown by about 40 percentage points of
 22.7

 Other Depository

GDP. Real estate is the central asset class where
 21.7
 Corporations36.3

 38.9
 Specialized Banks
leverage is high. The asset management industry and 7.4
 8.7

second-pillar pension funds are less developed than 4.6 Credit-specialized
 Financial Companies
other segments of the financial system but are
 5.0 16.9 10.5
 Investment Companies

becoming increasingly important amid the material 17.1
 10.3

 Insurers
demographic transition observed and further expected
 Sources: FSS/FISIS and IMF staff calculations.
in Korea. The rapid growth of Fintech is also adding to
such changing dynamics. Growth in the onshore FX derivatives market lags cross-border investment
flows while similarly with other emerging currency markets, the offshore NDF market in Korean won
remains large and growing, most likely reflecting electronification in NDF markets and global legal
and regulatory reforms for derivatives markets which incentivized greater central clearing of NDFs.
Selected indicators of the Korean financial system structure are presented in Figure 1.
2. The banking sector comprises a vast spectrum of entities. It is composed of nation-wide
and regional commercial banks, specialized (policy) banks and Other Depository Institutions (ODIs);
see Table 2. The state-owned financial firms are a prominent part of this landscape. The KHFC
provides mortgages insurance and issues fully guaranteed mortgage-backed securities composed of
“conforming” loans2 for which it sets the maximum amount, maturity and interest rates in advance.3
KAMCO has played an instrumental role after the Asian crisis when it acquired about USD 100bn of
bad loans from the banking system and has also bought substantial amounts of NPLs in the wake of
the credit card crisis (2003), global financial crisis (2008), and household debt crisis (2013). The
National Pension Service (NPS) is the third largest in the world with USD 600bn in assets and is the
largest investor in Korea. The Korean Investment Corporation (KIC) is a sovereign wealth fund with
about USD 130bn assets under management.
3. Financial holding companies (FHCs) play a systemically important role. As of end-2018,
nine FHCs held about 40 percent of total financial institutions’ assets (114 percent of GDP) through
complex networks of subsidiaries with operations across all segments of the financial system; four
FHCs have been identified as D-SIBs. The financial firms belonging to the bank holding companies

2 A conforming loan is a long-term, fixed-rate mortgage loan provided by the KHFC.
3 Loans, securities and guarantees issued and provided in 2017 amounted to about 7 percent of GDP.

 INTERNATIONAL MONETARY FUND 9
REPUBLIC OF KOREA

operate across a broad cross-section of the financial sector, with subsidiaries being engaged in
insurance, capital markets and asset management business.
4. The business models of Korea’s banks are broadly conventional (Figure 2). Banks,
including ODIs, are primarily funded by retail deposits. Assets are concentrated in loans, mostly
related to real estate. Bank loans are split about equally across lending to households and firms,
with 80 percent of the stock of corporate bank loans outstanding to SMEs. Most SME loans are
collateralized against real estate. Commercial banks have a relatively diversified loan portfolio and
securities’ holdings. State-owned banks are focused on lending to SMEs, which is reflective of
Korea’s economic policy priorities.
5. The insurance sector is large, highly concentrated, and saturated (Figure 3). The sector
comprises 24 life insurance firms and 30 non-life insurers, managing KRW 1170 trillion in total.
Insurance penetration (premiums to GDP) is one of the highest in the world, exceeded only by
Taiwan Province of China and Hong Kong SAR. This reflects, in part, the central role that life
insurance has played as a conduit of savings in Korea, where life insurance assets account for more
than 20 percent of household financial assets, well above the OECD average. Cross-sectoral linkages
exist as insurers typically also offer financial consulting services and are involved in asset
management. The bancassurance market is well developed and 50 percent of new business in life is
sold via banks. The market is dominated by large firms owned by FHCs and Korea’s largest
conglomerates (chaebols).
6. The Korean capital market is one of the most active markets in Asia. The equity market
has a market capitalization of around USD 1.8 trillion with foreigners holding around 35 percent of
the listed Korean stocks. The largest five conglomerates account for over 50 percent of market
capitalization. Compared with major advanced and emerging market economies, the price-to-book
and price-to-earnings ratios of Korean companies are notably lower, which has been coined the
“Korea discount” and attributed to various factors, such as in relation to North Korea, and the
complicated ownership and governance structure of many Korean corporations and especially large
firm conglomerates.
7. The Korean bond market is dominated by government and other public debt, while
‘green’ or ESG bonds’ importance is rising. Korea’s asset management industry has experienced
robust growth over the past few years reflecting changing saving patterns but also a search for yield
by households and other investors. Assets under the management of privately placed funds,
derivatives-linked products such as equity-linked securities, etc., all grew at double digit rates over
the past year and now amount to about KRW 500 trillion; roughly 30 percent of GDP.

10 INTERNATIONAL MONETARY FUND
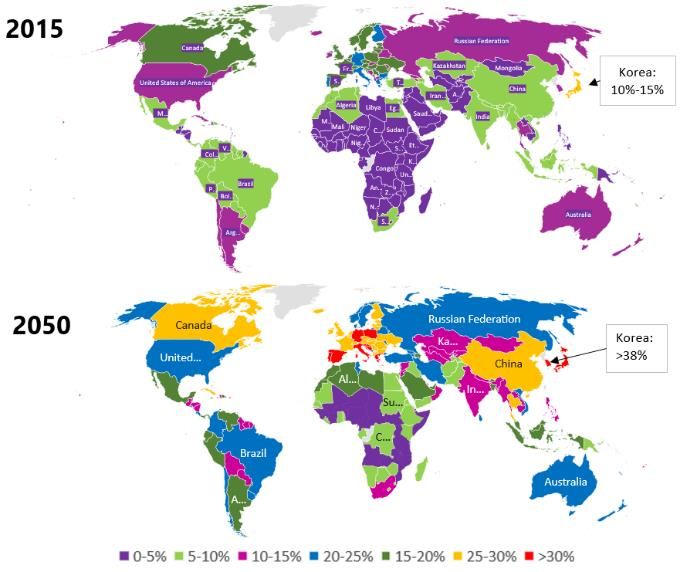
REPUBLIC OF KOREA

 Figure 1. Korea: Financial System Structure
Korea’s financial system is among the most developed in …with both financial markets and institutions broadly
Asia1… developed.
 Financial Development Index, 1980-2017 Financial Development Index, 1980-2017
 (Range 0 to 1: the higher the value, the more developed the financial system) (Range 0 to 1: the higher the value, the more developed the financial system)
 1 1
 Range for Asia Pacific Economies
 0.9 0.9
 Korea
 0.8 0.8
 Asia Pacific Median
 0.7 0.7

 0.6 0.6
 0.5 0.5
 0.4 0.4
 0.3 0.3 Financial Development

 0.2 0.2 Financial Institutions

 0.1 Financial Markets
 0.1
 0 0
 1980 1989 1998 2007 2016 1980 1989 1998 2007 2016

Market-based financing is low but comparable with other …while banks and other depository institutions hold most
advanced economies… financial institutions’ assets.
 Financial Institutions' Assets
 (in percent of GDP)
 350

 Insurers
 300

 Investment
 250 Companies

 Credit-specialized
 200 Financial Companies

 Specialized Banks
 150

 100 Other Depository
 Corporations

 50 Commercial Banks

 0
 2013 2014 2015 2016 2017 2018

Nonbank financial intermediation is dependent on short- …but remains relatively small compared to other major
term funding… jurisdictions.

Sources: Bloomberg, IMF Financial Development Index, IMF World Economic Outlook, FSB Global Monitoring Report on
Nonbank Financial Intermediation 2018, FSS.
1/ For more details about the financial development index and its financial institutions and markets subcomponents see IMF
SDN/15/08 and IMF WP/16/5.

 INTERNATIONAL MONETARY FUND 11
REPUBLIC OF KOREA

 Table 2. Korea:
 Table 2. Korea:Financial System
 Financial System Structure
 Structure

 Size

 Percent of Financial Number of
 Percent of GDP
 System Assets Institutions

 2013 2018 2013 2018 2013 2018
Depository Financial Institutions (Banks) 175.0 190.2 66.3 63.6 2,435 2,373
 Domestic Commercial Banks 89.3 93.6 33.8 31.3 58 57
 Nationwide (including internet-only) 79.1 83.0 30.0 27.8 7 8
 Local 71.6 76.3 27.1 25.5 5 6
 Foreign Subsidiaries 7.6 6.7 2.9 2.2 2 2
 Regional 10.2 10.5 3.9 3.5 6 6
 Foreign Bank Branches 13.4 14.8 5.1 5.0 40 38
 Specialized Banks 44.5 51.1 16.9 17.1 5 5
 Mutual Savings Banks 2.5 3.7 0.9 1.2 79 79
 Credit Unions 3.9 4.7 1.5 1.6 915 888
 Agricultural Cooperatives 19.8 20.4 7.5 6.8 1,161 1,122
 Fisheries Cooperatives 1.2 1.6 0.5 0.5 86 90
 Forestry Cooperatives 0.4 0.4 0.1 0.1 136 137
Non-Depository Financial Institutions 89.1 108.7 33.7 36.4 440 660
 Credit-Specialized Financial Firms 12.2 14.9 4.6 5.0 67 105
 Credit Card Companies 6.0 7.1 2.3 2.4 8 8
 Leasing Companies 2.4 3.2 0.9 1.1 26 25
 Installment Finance Companies 3.3 3.9 1.3 1.3 19 21
 New Technology Venture Capital Companies 0.4 0.7 0.2 0.2 14 51
 Investment Companies 19.6 26.0 7.4 8.7 315 501
 Securities Companies 18.9 24.9 7.2 8.3 63 56
 Futures Companies 0.2 0.3 0.1 0.1 7 5
 Asset Management Companies 0.3 0.4 0.1 0.1 85 243
 Investment Advisory Companies 0.1 0.0 0.0 0.0 148 185
 Real Estate Trust Companies 0.1 0.2 0.0 0.1 11 11
 Merchant Banks 0.1 0.1 0.0 0.0 1 1
 Insurance Companies 57.2 67.8 21.7 22.7 58 54
 Life Insurance Companies 45.3 51.7 17.1 17.3 27 24
 Nonlife Insurance Companies 12.0 16.1 4.5 5.4 31 30
Total Financial System 264.1 299.0 100.0 100.0 2,875 3,033
 of which: Financial Holding Companies 136.2 113.8 51.6 38.1 13 9

 Sources: FSS/FISIS; IMF, World Economic Outlook database; and IMF staff calculations.
 Note: 2018 as of 2018Q3. Excludes community credit cooperatives.

12 INTERNATIONAL MONETARY FUND
REPUBLIC OF KOREA

 Figure 2. Korea: Depository Institutions’ Business Models
Domestic bank assets are concentrated in domestic ……primarily funded by deposits, exception for specialized
currency loans… banks which rely extensively on wholesale funding.
Composition of Banks' Assets, 2013-18 Composition of Banks' Liabilities, 2013-18
(in percent of total assets) (in percent of total liabilities)
100% 100% Deposits in Won

 90% Loans in Won
 Deposits in FX
 80% 80%
 Loans in FX
 Wholesale
 70%
 funding in Won
 Securities
 60% 60% Wholesale
 funding in FX
 50% Cash and due Borrowing in
 from banks 40%
 40% Won
 Other assets Borrowing in FX
 30%
 20% 20%
 Tangible Other liabilities
 assets
 10%
 0% Retained
 0% earnings
 2013 2018 2013 2018 2013 2018 2013 2018
 2013 2018 2013 2018 2013 2018 2013 2018
 Other equity
 Nationwide Regional Internet Specialized
 Nationwide Regional Internet Specialized
 -20%

Other depository corporations’ assets are also
 …funded by deposits.
concentrated in domestic lending…
 Other Depository Corporations' Assets Other Depository Corporations' Liabilities
 (in percent of total assets) (in percent of total assets)
 100 Loans 100 Deposits

 90
 Investment Borrowing
 80 Securities using 80
 Equity Method
 70 Cash and Due from Other liabilities
 Banks
 60
 60 Investments in
 Trading Securities
 partnership
 50
 Available-for-Sale
 40 Capital surplus
 40
 Securities
 30 Retained earnings
 Held-to-Maturities 20
 20 Securities
 Common & Preferred
 10 Other Assets (incl. Stock
 tangible) 0
 0 Other
 Mutual Savings Banks Credit Unions
 Mutual Savings Banks Credit Unions
 -20
 Sources: FSS/FISIS and IMF staff calculations. Sources: FSS/FISIS and IMF staff calculations.

Banks’ exposures to property markets has increased
 …and lending to firms for real estate and leasing.
through their mortgage lending…
Composition of Banks' Loans by Borrower, 2013-18 Composition of Banks' Loans by Industry, 2013-18
(in percent of total loans) (in percent of total loans)
 100% 100% Manufacturing
 Business: Large
 90% 90% Real Estate and
 Companies
 80% Leasing
 80%
 Others
 70% Business: Small 70%
 Companies Wholesale and Retail
 60% 60%

 50% 50% Construction
 Households:
 Mortgages 40%
 40% Transportation
 30%
 30%
 Households: Hotels and
 20%
 20% Unsecured & other Restaurants
 10% Telecommunication
 10%
 Public Purpose 0%
 0% Agricultural, Forestry,
 Loans and others 2013 2018 2013 2018 2013 2018
 2013 2018 2013 2018 2013 2018 2013 2018 and Fishery
 Nationwide Regional Specialized
 Nationwide Regional Internet Specialized

Source: FSS/FISIS and IMF staff calculations.

 INTERNATIONAL MONETARY FUND 13
REPUBLIC OF KOREA

 Figure 3. Korea: Structure of the Insurance Sector
 …as insurers play an important role in household wealth
 Insurance penetration in Korea is amongst the highest in
 management, with a life insurance reserves representing a
 the world…
 significant share of household financial assets
 Life Insurance Reserves
 (In percent of total household financial assets)
 40

 35

 30

 25

 20

 15

 10

 5

 0

 Korea

 Germany

 Switzerland
 Denmark

 Italy

 United Kingdom
 France

 Spain

 Netherlands
 Japan

 United States
 Sweden
 Total assets of the insurance account are sizeable, with The top 3 life insurers hold over 50 percent of the life
 limited foreign ownership. sector’s assets…
 Insurance Assets by Ownership, 2013-18 Top Ten Life Insurers by Asset Size
 (in percent of nominal GDP) (in percent of life insurance assets & GDP)
 60
 Samsung Life Insurance

 50
 HANWHA LIFE INSURANCE CO,. LTD

 Domestic
 Kyobo Life Insurance
 40
 NongHyup Life Insurance Company Top 3 life insurers
 30 hold over 50% of
 SK Life Insurance
 life insurers'
 Orange Life Insurance assets
 20
 Foreign Shinhan Life Insurance

 10 Tongyang Life Insurance
 % of life insurance assets
 Hungkuk Life Insurance
 0 % of GDP
 2013 2014 2015 2016 2017 2018 2013 2014 2015 2016 2017 2018 MetLife Insurance

 Life Non-life
 0 10 20 30 40

 Assets are concentrated in bonds, but loans are also
 …as do the top 3 non-life insurers.
 sizeable.
 Top Ten Non-Life Insurers by Asset Size
 (in percent of non-life insurance assets & GDP)
 Life Insurance Assets
 (in percent of total life insurance assets)
 Cash&deposits
 Samsung Fire 2%
 17% Bonds
 Hyundai Marine and Fire Insurance Co., Ltd

 DB Insurance Co.,Ltd Stocks

 KB Insurance Co., Ltd Top 3 non-life 4% Investment funds
 insurers hold over 39%
 Meritz Fire and Marine Insurance Co., Ltd. 2%
 50% of non-life Other securities
 Hanwha General Insurance Co., Ltd. insurers' assets
 Loans
 Lotte Non-Life Insurance Co., Ltd.

 % of non-life insurance 15%
 Heungkuk Fire and Marine Insurance Co., Real Estate
 Ltd. assets
 Korean Reinsurance Co., Ltd.
 % of GDP Other assets
 NongHyup Property & Casualty Insurace
 Company
 12% 5% Separate account
 4%
 assets
 0 10 20 30

 Sources: FSS, IMF World Economic Outlook Database, and IMF staff calculations.

14 INTERNATIONAL MONETARY FUND
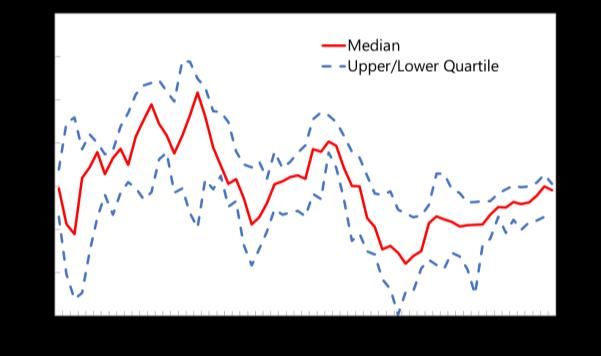
REPUBLIC OF KOREA

8. Fintech innovations are rapidly taking root in the retail payments service sector and
altering the market structure. The ongoing push to foster Fintech innovation by the Government
is facilitating this. Defining features of the Korean retail banking sector include great financial
institution depth and a saturated credit card market, high smartphone penetration, and customer
eagerness to embrace cutting-edge technologies—providing a fertile environment for mobile
payment services to thrive. The entry of large technology companies in the payment services market
(as providers of stored value payment products and of payments-initiation interfaces) is beginning
to alter the market structure. These developments affect the degree of concentration and
competition, catalyzed by the authorities’ work plan to facilitate innovation, specifically the
introduction of an “Open Banking” system, in parallel with loosening of legal restrictions for
electronic financial transactions and use of personal data.
9. Korean banks have improved their capital position and asset quality since the 2013
FSAP (Table 3, Figures 4 and 5). Banks’ aggregate capital ratio at about 16 percent of risk-
weighted assets does not stand out compared to other banks in the region. NPL ratios are
structurally low but must be interpreted cautiously because banks sell NPLs swiftly into an active
market for distressed assets4. Korean banks underperform their regional peers in terms of
profitability. The share of foreign business in total assets remains relatively small at about 6 percent,
up from 4 percent in 20135. Nation-wide banks’ asset exposures are diversified, regional banks’ and
mutual savings banks’ exposures are concentrated in SME lending, and ODIs’ lending is
concentrated in consumer credit (Figure 6).
10. Insurers are currently well capitalized but low interest rates are weighing on
profitability (Figure 7). The median life insurers recorded a coverage of its risk-based capital (RBC)
at end-2018 of 239 percent, well above the regulatory minimum of 100 percent and the
recommended level of 150 percent. In the non-life sector, the RBC coverage was even higher, at 263
which is the highest level since 2012. Increasing difficulties to match higher interest rate guarantees
with dwindling returns have led most insurers to extend asset durations (such as through foreign
investments) and to offer more ‘protection’ instead of savings products. Still, profitability is low; the
sector's return on assets stood at 0.3 percent in 2018, reflecting decreasing investment yields which
declined continuously from 5.1 percent in 2012 to 3.4 percent in 2018. With unfavorable
demographics and competition from other financial institutions, growth prospects are limited,
triggering foreign expansion and cooperation with fintech providers. Non-life companies, too, have
material exposure to long-term saving and protection business. Profitability is impacted by
underwriting losses, especially in health insurance where the government aims for lower cost of
private coverage. For the non-life sector, the combined ratio hovered slightly above 100 percent in
recent years, indicating that claims and operating costs exceed premium income. Nevertheless, the
return on assets is still higher than in the life sector, with 1.3 percent for the median company in
2018.

4 There are several Asset Management Corporations and an active NPL market around them in Korea. Their presence
is deemed to foster cost efficiency since banks outsource the NPL management process to specialized firms.
5 Nation-wide banks’ largest exposure is to China, amounting to 1.7 percent of total assets in 2018 (1.1 percent in

2013).

 INTERNATIONAL MONETARY FUND 15
REPUBLIC OF KOREA

11. While well capitalized under the current regime, additional capital needs are expected
under the new regime, which requires close supervisory attention. The new solvency regime,
which is going to be aligned with IFRS 17, will introduce a market-consistent valuation of assets and
liabilities by 2022. An initial quantitative impact study in 2018, based on the IAIS’ Insurance Capital
Standards and Solvency II, showed a notable capital shortfall in the life insurance sector. A more
recent study in 2019 implies substantially smaller capital needs as several parameters were adjusted
to local market conditions6. The transition to the new regime has already triggered an increased
issuance of subordinated debt. An increased re-classification of fixed-income assets from available-
for-sale to held-to-maturity, observed recently, would need to be reverted when transitioning to a
fully market-consistent asset valuation.
 Table 3. Korea: Core Financial Soundness Indicators, 2012–17

 2012 2013 2014 2015 2016 2017
 (In percent)
 Core FSIs
 Regulatory capital to risk weighted assets 14.3 14.5 14.0 13.9 14.8 15.2
 Regulatory Tier 1 capital to risk-weighted assets 11.1 11.4 11.4 11.7 13.1 13.1
 Non-performing loans net of provisions to capital 3.1 3.6 2.8 2.1 2.1 1.7
 Non-performing loans to total gross loans 0.6 0.6 0.5 0.5 0.5 0.4
 Return on assets 0.7 0.3 0.5 0.5 1.9 0.7
 Return on equity 8.2 4.0 6.0 6.6 24.3 8.5
 Interest margin to gross income 78.3 82.2 62.1 62.9 65.0 58.7
 Non-interest expenses to gross income 71.4 75.3 73.5 59.6 65.4 65.6
 Liquid assets to total assets 36.2 33.8 37.9 34.4 32.9 29.9
 Liquid assets to short-term liabilities 111.3 107.9 122.0 105.0 102.6 101.2
 Net open position in FX to capital 0.2 -0.2 0.5 0.0 0.0 -1.0
 Sectoral distribution of loans
 Domestic residents 93.2 92.5 92.5 91.0 92.6 92.6
 Deposit takers 3.5 3.5 4.0 3.7 3.6 4.3
 Central bank 0.5 0.4 0.6 0.5 1.2 0.5
 Other financial corporations 0.8 0.8 0.7 0.8 0.9 1.1
 General government 0.3 0.6 0.8 1.0 2.0 0.7
 Nonfinancial corporations 53.3 50.7 50.0 48.7 49.5 46.1
 Households 34.8 36.5 36.3 36.3 35.3 39.9
 Nonresidents 6.8 7.5 7.5 9.0 7.4 7.4

 Additional FSIs
 Capital to assets (leverage ratio) 8.2 8.3 8.1 8.0 7.9 8.0
 Large exposures to capital 76.3 72.9 64.4 70.0 46.6 37.9
 Gross assets position in derivatives to capital 19.0 15.0 16.6 17.0 20.2 17.1
 Gross liabilities position in derivatives to capital 18.1 16.8 17.8 18.5 21.9 18.0
 Trading income to total income 2.1 2.5 5.8 9.3 8.4 6.2
 Personnel expenses to total income 29.6 32.2 32.5 41.5 38.2 31.6
 Customer deposits to total non-interbank loans 84.1 84.1 81.6 76.0 71.2 75.4
 FX loans to total loans 13.2 12.8 13.4 12.2 11.7 10.9
 FX liabilities to total liabilities 14.4 14.3 14.6 13.7 11.6 13.2
 Sources: IMF Financial Soundness Indicators.

6 Most notably, the ultimate forward rate used in the interest rate term structure modeling for deriving the value of
insurance liabilities was increased to 5.2 percent, which is significantly above the 3.9 percent used in the EU’s
Solvency II regime for KRW-denominated liabilities.

16 INTERNATIONAL MONETARY FUND
REPUBLIC OF KOREA

 Figure 4. Korea: Financial System Performance
Capitalization of Korean banks has improved with the …and capital is of high quality compared to a broad set of
implementation of Basel III… comparator countries.
 Capital Adequacy
 (Commercial banks, in percent of risk-weighted assets)
 20

 18
 15.8 15.8 15.9 Tier 2
 16 15.2 14.9 14.7
 14
 Other Tier 1
 12

 10

 8 Common
 Equity Tier 1
 6

 4
 Total
 2

 0
 2013 2014 2015 2016 2017 2018

 Specialized banks have seen also some improvement in
…and across Korean commercial banks.
 capital adequacy but from a lower base.
 Capital Adequacy Capital Adequacy
 (Commercial Banks, total capital in percent of risk-weighted assets) (By type of bank)
 18
 Tier 1 Capital Other Capital
 30
 16

 25 14

 12
 20 10

 8
 15
 6

 10 4

 Total capital ratio - median 2
 5
 0
 Nationwide Nationwide Regional Regional Specialized Specialized
 0
 1/1/2013 2/1/2014 3/1/2015 4/1/2016 5/1/2017 6/1/2018 2013 2018 2013 2018 2013 2018

 …and in comparison, to other jurisdictions reflective of
NPLs are low across all loan categories… rapid disposable of bad loans to asset management
 companies.
 Bank Asset Quality
 (Non-performing loans in percent of total loans, commercial banks)
 1.2
 Total Loans
 1 Business Loans

 Household Loans
 0.8

 0.6

 0.4

 0.2

 0
 1/1/2013 2/1/2014 3/1/2015 4/1/2016 5/1/2017 6/1/2018

Sources: FSS, Haver, and IMF staff calculations.

 INTERNATIONAL MONETARY FUND 17
REPUBLIC OF KOREA

 Figure 5. Korea: Bank Profitability (Significant Institutions):1 Key Trends
 Korean banks have experienced comparably low
 Bank asset quality has been improving since 2013, though
 profitability relative to neighboring economies in the
 there has recently been some dispersion across banks.
 region.
 NPL ratio
 Return on Assets (ROA)2 (Percent)
 (Percent, 2019Q1 or latest)

 While NPL ratios are dispersed across banks, there is no
 significant dispersion in profitability… …though across all quartiles, profitability remains low.
 Return on Assets (ROA) Return on Equity (ROE)
 (Percent) (Percent)

 Bank’s cost-to-income ratio has remained stable since the …with trading income making up a significant portion of
 GFC… non-interest income.
 Cost-to-Income Non-interest Components
 (Percent of total assets) (Percent of total assets)

 Sources: Haver, FISIS, IFS.
 1
 Includes commercial and specialized banks that are currently active.
 2
 Includes internet-only banks.

18 INTERNATIONAL MONETARY FUND
REPUBLIC OF KOREA

Figure 6. Korean Banks’ Asset Portfolio Structure, Liability Structure, and P&L Components
 Korean banks’ asset portfolio structure as of end-2018

 Liability structure as of end-2018

 P&L as of 2018

Sources: Supervisory data from the FSS, publicly available data for banks, and IMF staff calculations.
Notes: Based on data for underlying 8 nation-wide banks, 5 regional banks, 6 specialized banks, and 2,316 ODIs (888 Credit
Unions, 79 Mutual Savings Banks, 1,122 Agricultural Cooperatives, 90 Fisheries Cooperatives, 137 Forestry Cooperatives).

 INTERNATIONAL MONETARY FUND 19
REPUBLIC OF KOREA

 Figure 7. Korea: Solvency and Profitability of the Insurance Sector
 The life sector records a median solvency ratio of 239 For the median non-life company, the solvency ratio
 percent, above the 100 percent minimum requirement. stands at 263 percent, the highest ratio since 2012.

 Profitability in life insurance is weak with returns on assets Investment returns have been steadily declining in recent
 well below the non-life sector. years.
 Insurers' Return on Assets, 2013-18
 (in percent)

 1.8
 1.6
 1.4
 1.2
 1.0
 0.8
 0.6
 0.4
 0.2
 0.0
 2013

 2014

 2015

 2016

 2017

 2018

 2013

 2014

 2015

 2016

 2017

 2018
 .

 .

 .

 .

 Life Non-Life

 The combined ratio in non-life hovers above 100 percent, mainly driven by underwriting losses in health insurance.

 Source: IMF staff calculations based on FSS data.

B. Macro-Financial Environment
12. Macro-financial stability in Korea remains vulnerable to external shocks. Korea’s
economy is very open and closely integrated with international supply chains. The export-oriented
manufacturing sector, accounting for about a quarter of GDP, comprises Korea’s steel,
telecommunications equipment, electronics, auto, and shipping industries. Production is
concentrated, with the top five conglomerates dominating the Korean stock index.

20 INTERNATIONAL MONETARY FUND
REPUBLIC OF KOREA

13. The macroeconomy has performed well since the last FSAP but faces headwinds. GDP
growth was robust at around 3 percent in 2017 and 2018, reflecting strong export growth and
business and construction investment. The semiconductor industry, a stable driver of South Korea’s
growth, has experienced a cyclical slowdown. Growth is expected to remain sluggish (Table 4) due to
ongoing trade tensions and low business confidence, notwithstanding a boost from monetary and
fiscal policy easing. Cross-border financial flows have been volatile, while the Korean won has
depreciated partly on the back of trade tensions between the United States and China.
14. The financial cycle has reached an advanced phase with household debt among the
highest for OECD countries (Figure 8). Financial conditions in mid-2019 were close to historical
average after several years in easy territory, while the recent monetary policy loosening should
counter the impact of rising market risks somewhat. The ratio of total non-financial private sector
debt to GDP has reached an elevated level—standing close to 200 percent—and core debt (debt of
the non-financial sector owed to banks) amounts to about 130 percent of GDP, which is high in
international comparison. Although the trend has been upward, an accelerating trend is not evident.
The credit-to-GDP gap is close to zero. After some deleveraging, corporate credit growth has picked
up again, particularly to the SME sector driven by sole proprietors and often secured by lending
against real estate.
15. The upward trend in house prices has moderated, but household leverage in real
estate remains high (Figure 9). Housing supply has expanded over recent years and large sections
of the financial sector are exposed to the housing market. Household lending growth, primarily
related to housing, has slowed but remains above nominal GDP growth while household debt as a
ratio of disposable income stands at about 180 percent, which is among the highest across the
OECD countries.
16. Demographic shifts are posing a long-term challenge for the financial sector
(Figure 10). By 2050 almost 40 percent of the population is expected to be older than 65, up from
13 percent now, while the working-age population will shrink significantly given Korea’s low birth
rate. One implication is that the proportion of debt held by older households will increase, also
reflecting reverse mortgages promoted by the KFHC, and the DSTI may rise significantly. Adverse
demographic developments are having an impact on capital flows as a rising share of growing
retirement savings is invested abroad by pension funds, insurance firms, and asset management
companies. This demographic shift, combined with competitive pressures from China, has raised
concerns that Korea might be destined for a prolonged period of low growth and inflation with an
erosion of its financial buffers. Structural changes and long-term implications that these
demographic shifts are expected to exert on banks, insurers and other economic agents will be
discussed later in this note.
17. The rapid rise in COVID-19 virus cases in South Korea since February 2020 likely
implies a significant drag on economic activity, which is being tempered by a proactive policy
response of Korea’s government. The Korean authorities have taken bold steps to contain the
COVID-19 outbreak and mitigate its impact on public health and the economy, including through
large-scale testing of the population to rapidly identify, isolate, and treat infected patients. The
Korean government is also using its fiscal space to mitigate the macroeconomic impact of the

 INTERNATIONAL MONETARY FUND 21
REPUBLIC OF KOREA

outbreak, including through a proposed KRW 11.7trn (0.6 percent of GDP) supplementary budget
that provides resources to step up disease control efforts, support small merchants and SMEs,
provide transfers to sustain consumption and employment, and support local economies hit hardest
by the spread of COVID-197.

C. Korean Housing Market Structure and Dynamics
18. House prices appear to have developed in line with fundamentals at the national level,
but regional heterogeneity can be observed (Figure 9). Korean nominal house price growth has
moderated since the GFC. Nation-wide median house price and apartment price to disposable
income ratios have trended upward to an extent since 2014 (sub-figure 3 in Figure 9). Debt-to-
income ratios have been rising steadily since 2010 for younger age cohorts (up to age 50), and also
for people at 60 and above. A model-based valuation, based on regional data, points to
overvaluations in the Seoul market and the larger capital region of 10 percent and 5 percent
respectively. More rural areas have seen house prices increase less than fundamentals in relation to
income and mortgage interest rates would have predicted8.
19. The leasehold deposit market (Jeonse) is a unique feature of the Korean financial
system and implies potential vulnerabilities for the Korean real estate market. Jeonse tenants
give landlords a deposit equivalent to on average about 50-70 percent of the house price that is to
be paid back to the tenant at the end of the two-year contract, if the lease contract is not extended9.
To finance these deposits, tenants often turn to banks for Jeonse loans which doubled to KRW
72.2trn since 2014, while loan-to-deposit ratios have increased to 42 percent in 2018. In lieu of
rental income, Jeonse landlords then rely on house price increases and return on any financial
investments made using the Jeonse deposit. Given that landlords do not accrue a yield on Jeonse
properties, in the cases where the Jeonse deposit is used to fund the property purchase, the total
return on such an investment is entirely dependent on house price increases. Consequently, the
investment in Jeonse properties is not sustainable in an environment in which house prices would
fall over an extended period.
20. The rollover risk of Jeonse contracts could amplify negative shocks to house prices and
the prices of financial assets. In a severe adverse scenario in which Jeonse deposit prices would
fall, landlords may have to cover the resulting capital shortfall using their own funds. If this is done
by selling financial assets, this would put pressure on asset prices. In an extreme case, landlords may
need to sell their properties, which would further amplify the fall in house prices. An assessment
conducted by the BOK shows that following a 20 percent fall in the Jeonse deposit price, about 78
percent of landlords could cover total leasehold deposits with their own financial assets, while a
remaining 22 percent would need an additional loan10.

7 Assessment as of March 2020.
8 For an additional assessment in terms of house price dynamics see the Korea 2019/20 Technical Note titled
“Macroprudential Policy Framework and Tools”.
9 The Jeonse deposit price is determined by demand and supply conditions in the Jeonse market. Historically, the

leasehold deposit to house price ratio has been relatively stable over time.
10 The Bank of Korea, Financial Stability Report (June 2018), assumed a 20 percent fall in the Jeonse deposit price and

a 13 percent house price fall. Financial assets were limited to accumulations and deposit-type savings with high
liquidity, and mortgage loans to those on housing currently being resided in.

22 INTERNATIONAL MONETARY FUND
REPUBLIC OF KOREA

21. The authorities need to be vigilant on the following aspects of the Jeonse market
structure: (i) who the ultimate holder of risk is and potential claims on the public exchequer; (ii) a
rise in rollover risk of Jeonse contracts; and (iii) negative shocks to house prices and the economy
more broadly could be amplified through adverse conditions in the Jeonse market. The potential
vulnerability associated with household leverage with Jeonse leasing of their properties, possibly in
addition to bank debt, could be mitigated by a policy tool that can consider and capture various
factors, including the combined value of mortgage and Jeonse deposits, dynamics between house
prices and Jeonse prices, and Jeonse loans held by tenants.
22. The public sector has a large footprint in the housing market. The Korean Housing-
Finance Corporation (HF) offers a number of products with both a social function and a risk-sharing
objective. The HF engages in direct funding of mortgages with funding from the Ministry of Land,
Infrastructure and Transportation. It also offers subsidized mortgage loans to lower income
households via banks, which are then securitized by the HF11. The HF securitizes non-subsidized
long-term mortgages and total MBSs issued and guaranteed by the HF amounts to 116tr KRW, a
large portion of which are held by insurance companies. The HF also guarantees other housing-
related loans, including loans using Jeonse deposits as collateral and loans by landlords needed to
cover falls in Jeonse deposit prices12. The HF offers reverse mortgages to the rapidly growing group
of low-income pensioners. There is lack of transparency regarding the public sector’s total
contingent liabilities related to the housing market and whether the capital buffers held are
adequate. While housing market subsidies and guarantees may have a social function, it is not clear
to what extent these distort the market price of risk.

D. Scope of the Systemic Risk Analysis
23. The FSAP risk analysis covers the banking and insurance sector. The analysis as
presented in this note was based on public and supervisory data for 24 banks, covering 95 percent
of banking system assets at end-2018. Five banks of the 24 are sub-aggregates, forming the ODI
category (Credit Unions, Mutual Savings Banks, credit cooperative banks). Table 5 lists the banks in-
scope of the banking system stress test, including information about their D-SIB status.
24. Seven life and six non-life insurers were included in the insurance sector stress test. In
terms of end-2018 balance sheet assets, the analysis covers 73 percent and 76 percent of the life
and non-life sector, respectively. Table 6 presents the main characteristics of the insurance
undertakings included in the analysis.

11 These loans, known as Didimdol and Bogeumjari, are available to households meeting certain criteria regarding
income, price of property, size of property, mortgage loan size and LTV.
12 There are two additional housing market insurers, one private (Seoul Guarantee Insurance) and one public

(Housing and Urban Guarantee Corporation).

 INTERNATIONAL MONETARY FUND 23
You can also read