ENERGY MIX DIVERSIFICATION STRATEGY FOR THE UGANDA ELECTRICITY GENERATION COMPANY LTD ("UEGCL")
←
→
Page content transcription
If your browser does not render page correctly, please read the page content below
ENERGY MIX DIVERSIFICATION STRATEGY
FOR THE UGANDA ELECTRICITY
GENERATION COMPANY LTD (“UEGCL”)
March 3, 2021

Submission Date:                    March 3, 2021

Contract Number:                    USEA/LEI-2020-765-75-01
Activity Start Date and End Date:   May 15, 2020 – March 3, 2021
Activity Location:                  Kampala, Uganda [Remote Consultation]

Submitted by:                       London Economics International
                                    717 Atlantic Avenue, Suite 1A
                                    Boston, MA 02111

Prepared for:                       United States Energy Association
                                    1300 Pennsylvania Avenue NW
                                    Suite 550, Mailbox 142
                                    Washington, DC 20004

  July 2008                                                                 1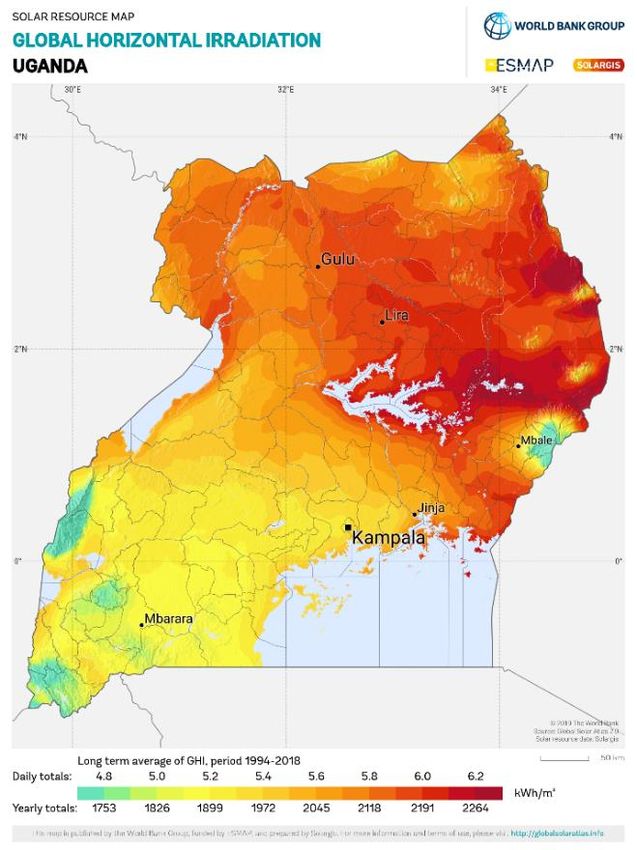
ENERGY MIX DIVERSIFICATION STRATEGY
FOR THE UGANDA ELECTRICITY
GENERATION COMPANY LTD (“UEGCL”)

DISCLAIMER

This publication was made possible by the support of the American people through the United States Agency
for International Development (“USAID”). The contents are the responsibility of the Consultants and the
United States Energy Association, and do not necessarily reflect the views of USAID or the United States
Government.

                                                                                                       2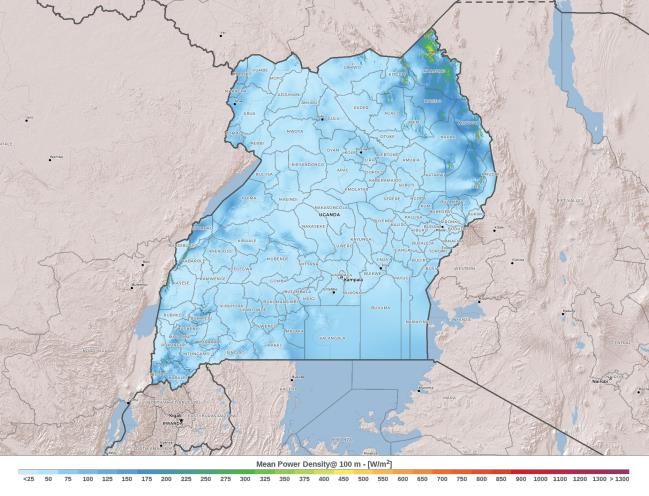
TABLE OF CONTENTS
TABLE OF CONTENTS....................................................................................................................................3
TABLE OF FIGURES...........................................................................................................................................5
ACRONYMS AND ABBREVIATIONS ..........................................................................................................7
       EXECUTIVE SUMMARY ..........................................................................................................................9
   1.1             UEGCL Strategy highlights ...................................................................................................... 12
   1.2             Recommendations for the sector ......................................................................................... 14
       PLANNING FOR AN ENERGY MIX DIVERSIFICATION ........................................................... 15
   2.1             Diversification for a more resilient utility ........................................................................... 15
   2.2             Institutional structure to support efficient planning strategy ......................................... 17
   2.3             Review of best practices planning in international jurisdictions..................................... 17
   2.4             Key takeaways from case studies and recommendations for the UEGCL and Uganda
                   25
    ASSESSING PROSPECTIVE TECHNOLOGIES FOR THE ENERGY MIX
DIVERSIFICATION ......................................................................................................................................... 27
   3.1             Technical and operational considerations for prospective technologies ..................... 27
   3.2             The case for solar development in Uganda......................................................................... 27
   3.3             The case for wind development in Uganda ......................................................................... 30
   3.4             The case for geothermal development in Uganda ............................................................. 32
   3.5             Key takeaways for UEGCL ..................................................................................................... 36
    ANALYZING AND QUANTIFYING THE NEEDS TO BE ADDRESSED BY THE ENERGY
MIX DIVERSIFICATION ................................................................................................................................ 38
   4.1             Developing a load forecast (demand) ................................................................................... 40
   4.2             Developing an energy production forecast (supply) ......................................................... 44
   4.3             Summary of results from supply-demand balance analysis .............................................. 53
   4.4             Opportunities for the incorporation of new renewable generation ............................ 54
   4.5             Hedging against uncertainties ................................................................................................. 55
   4.6             Known restrictions imposed by the transmission system ............................................... 57
   4.7       Potential feasible locations to connect generation resources to the Ugandan
   transmission system .................................................................................................................................... 59
   4.8             System Connection Costs ....................................................................................................... 61
    PROPOSED STRATEGY (IN THE SHORT TO LONG TERM) TO ACHIEVE ENERGY MIX
DIVERSIFICATION ......................................................................................................................................... 63
   5.1             Action items for the Short-term (2020-2024) ................................................................... 63
   5.2             Action items for the Mid-term (2025-2030)....................................................................... 64
   5.3             Action items for the Long-term (2031-2040) .................................................................... 64

                                                                                                                                                                 3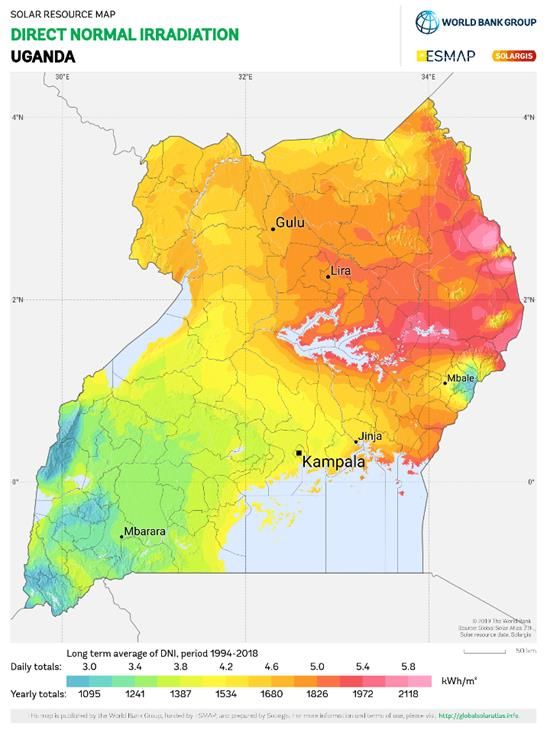
FINANCING THE ENERGY MIX DIVERSIFICATION STRATEGY .......................................... 66
    6.1              Financing activities in the short term: capacity building and planning ........................... 66
    6.2              Financing activities in the mid-term: renewables development ...................................... 66
    6.3              Financing activities in the long-term ..................................................................................... 74
        ADDITIONAL THOUGHTS AND INDUSTRY WIDE RECOMMENDATTIONS ............... 75
    7.1              Recommendations for the sector ......................................................................................... 75
    7.2              Recommendations relative to project development ........................................................ 76
        APPENDIX A – DETAILED SUPPLY-DEMAND BALANCE ANALYSIS .................................. 78
    8.1              Illustration of Supply-demand balance (capacity) over the 2020-2040 horizon ......... 79
    8.2              Illustration of supply-demand balance (energy) over the 2020-2040 horizon ............ 80
   APPENDIX B – FRAMEWORK FOR DEVELOPING A POWER SYSTEM EXPANSION
PLAN ................................................................................................................................................................... 84
                     APPENDIX C – ATTACHMENT - LCOE MODEL DEVELOPED FOR UEGCL ...... 89
        APPENDIX D– SUMMARY OF COST ANALYSIS: IMPACT OF VARIOUS
FINANCING STRUCTURES ON PROJECT ($/KW-YEAR) AND ENERGY COST ($/MWH) .. 90
    11.1      Impact of the choice of financing structure on development ($/kW) and energy
    costs ($/MWh) ............................................................................................................................................. 90
    11.2             Sensitivity analysis ...................................................................................................................... 93
                     APPENDIX E – WORKS CITED ........................................................................................... 96

                                                                                                                                                                              4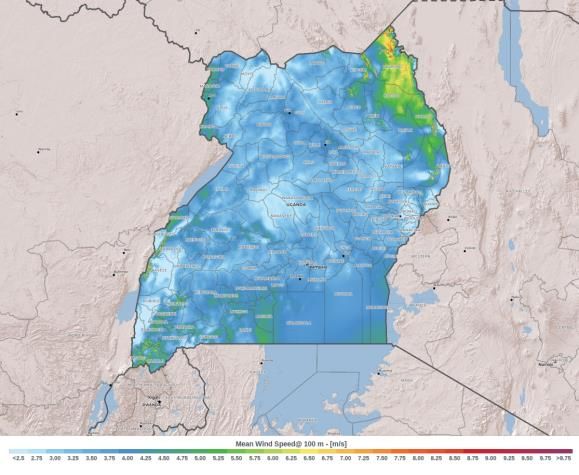
TABLE OF FIGURES
Figure 1. Key lessons for Uganda from case studies................................................................................ 10
Figure 2. Illustration of the 5-step methodology ...................................................................................... 11
Figure 3. UEGCL strategy highlights and key recommendations for Uganda .................................... 12
Figure 4. Uganda installed capacity and generation .................................................................................. 15
Figure 5. Case studies key characteristics .................................................................................................. 18
Figure 6. Kenya economy and electricity sector snapshot ..................................................................... 19
Figure 7. Kenya institutional framework..................................................................................................... 20
Figure 8. Panama economy and electricity sector snapshot .................................................................. 21
Figure 9. Panama institutional framework .................................................................................................. 22
Figure 10. Ghana economy and electricity sector snapshot .................................................................. 23
Figure 11. Ghana institutional framework .................................................................................................. 24
Figure 12. Solar irradiation in Uganda ......................................................................................................... 28
Figure 13. Wind resource maps of Uganda ............................................................................................... 31
Figure 14. Risk profile of geothermal development ................................................................................. 34
Figure 15. Illustration of the 5-step methodology .................................................................................... 39
Figure 16. 2020-2029 Base and high load forecasts adopted in this study ......................................... 41
Figure 17. Base and High Load Demand Forecasts, 2020-2040 ............................................................ 42
Figure 18. Energy Demand Forecasts (GWh) (Base and High), 2020-2040 ....................................... 43
Figure 19. Capacity (MW) Forecasts (Base and High), 2020-2040 ...................................................... 43
Figure 20. Power Plants in Uganda (Q2 2020) .......................................................................................... 45
Figure 21. Generation Projects Currently Licensed ................................................................................ 46
Figure 22. Capacity available in year 2024 to meet load demand from existing and future licensed
power plants (by technology) ........................................................................................................................ 48
Figure 23. Annual average energy output from existing power plants ................................................ 50
Figure 24. Annual average energy output from future licensed power plants .................................. 51
Figure 25. Base Case electricity supply and demand in the Ugandan power system (2020-2024)
.............................................................................................................................................................................. 51
Figure 26. Actual energy production from the Nalubaale and Kiira power plants (2004-2011) .. 52
Figure 27. Electricity supply and demand in the Ugandan power system under drought
conditions (2020-2024) ................................................................................................................................... 53
Figure 28. Summary of Results from Supply-Demand Balance Analysis ............................................ 53
Figure 29. Summary of deficit (capacity and energy) (no drought) ...................................................... 54
Figure 30. Energy Hedging with a 300 MW VRE Plant ............................................................................ 57
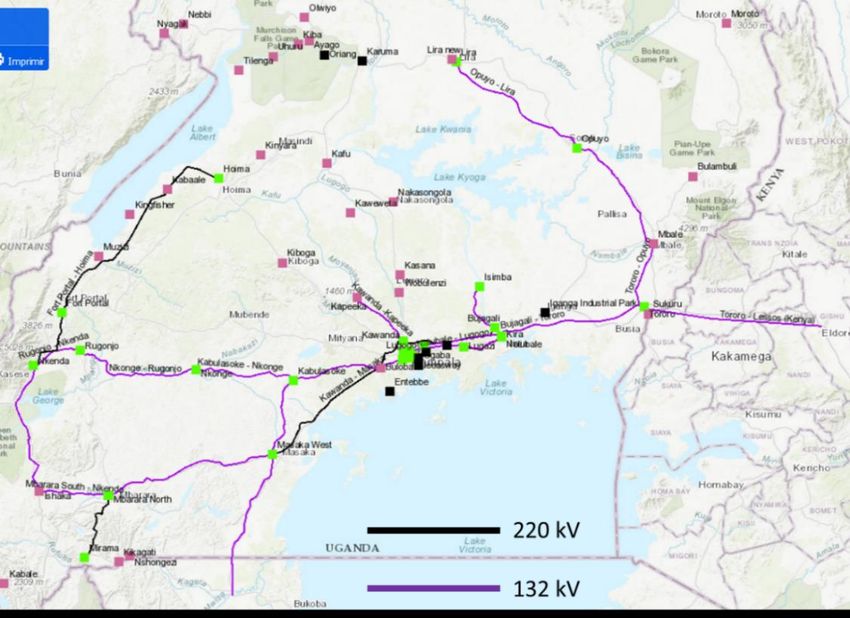
Figure 31. Main 220 kV and 132 kV Actual Transmission System in Uganda .................................... 60
Figure 32. Unit costs........................................................................................................................................ 62
Figure 33. Sample of tools available to UEGCL in a government-sponsored financing model ...... 68
Figure 34. Summary of pros and cons of public financing tools ............................................................ 69
Figure 35. Sample of key players per type.................................................................................................. 69
Figure 36. Sample of tools available to UEGCL in a private financing model .................................... 70
Figure 37. Summary of pros and cons of private financing tools .......................................................... 71
Figure 38. Sample of key players per type.................................................................................................. 72
Figure 39. Sample of tools available to UEGCL in a hybrid financing model ..................................... 73
Figure 40. Summary of pros and cons of hybrid approach financing tools ......................................... 73
Figure 41. Annual supply-demand balance in Uganda (2020-204) with existing and licensed (but
not yet operational) generation .................................................................................................................... 78
Figure 42. Supply-Demand capacity balance 2020-2040 (Base Load Case) ........................................ 79
Figure 43. Supply-Demand capacity balance 2020-2040 (High Load Case)........................................ 80
Figure 44. Supply-Demand energy balance 2020-2040 (Base Load Case) .......................................... 81
5
Figure 45. Supply-Demand energy balance 2020-2040 (Base Load Case, Drought Conditions) .. 82
Figure 46. Supply-Demand energy balance 2020-2040 (High Load Case) .......................................... 83
Figure 47. Supply-Demand energy balance 2020-2040 (High Load Case, Drought Conditions) .. 83
Figure 48. Power Systems Planning Approach .......................................................................................... 85
Figure 49. Solar baseline LCOE estimates across various financing structures ................................ 91
Figure 50. Wind baseline LCOE estimates across various financing structures ............................... 92
Figure 51. Geothermal baseline LCOE estimates across various financing structures ................... 93
Figure 52. Solar: illustration of LCOE sensitivity to key underlying variables ................................... 94
Figure 53. Wind: illustration of LCOE sensitivity to key underlying variables .................................. 94
Figure 54. Geothermal: illustration of LCOE sensitivity to key underlying variables ...................... 95

                                                                                                                                           6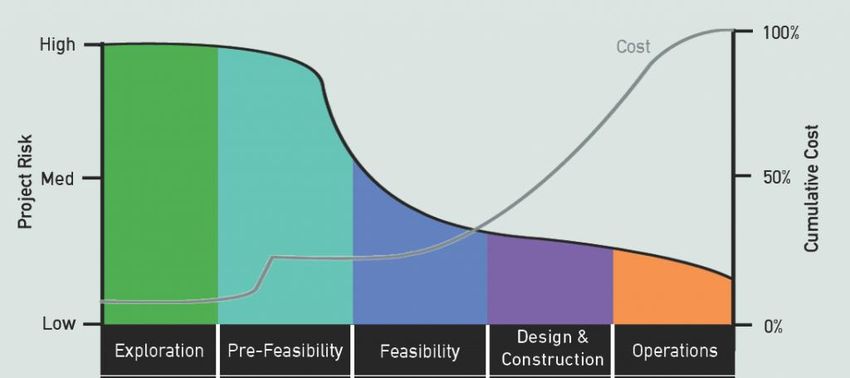
ACRONYMS AND ABBREVIATIONS

AFD         Agence Francaise de Developpment
ASEP        Autoridad Nacional de los Servicios Públicos
ATB         Annual Technology Baseline
BEIS        UK Department of Business, Energy and Industrial Strategy
BESS        battery energy storage system
CSP         Concentrated Solar Power
EAIF        Emerging Africa Infrastructure Fund
ECG         Electricity Company of Ghana
EGESA       Electricity Generation Company
EIB         European Investment Bank
ENS         Energy-Not-Served
EPP         emergency power producers
EPRA        Energy and Petroleum Regulatory Authority
ERA         Electricity Regulatory Authority
ERERA       ECOWAS Regional Electricity Regulatory Authority
ESMAP       Energy Sector Management Assistance Program
ETESA       Empresa de Transmisión Eléctrica S.A.
EXIM Bank   Export-Import Bank of the United States
FIT         Feed-In Tariff
GA          Grid Advisors
GDC         Geothermal Development Company
GDevP       UETCL Grid Development Plan
GoU         Government of Uganda
GRIDCo      Ghana Grid Company
GRMF        Geothermal Risk Mitigation Facility
HFO         Heavy Fuel Oil
IDB         Islamic Development Bank
IFC         International Finance Corporation
IPP         Independent Power Producers
IPS         Industrial Promotion Services
IRENA       International Renewable Energy Agency
IRP         Integrated Resource Plan
ISO         Independent System Operator
KENGEN      Kenya Generation Company
KIF         Danish Climate Investment Fund
KPLC        Kenya Power and Lighting Company

                                                                        7
LCEEP    Least Cost Electricity Expansion Plan
LCOE     levelized cost of energy
LEI      London Economics International LLC
MEMD     Ministry of Energy and Mineral Development
MoEP     Ministry of Energy and Petroleum
NDPII    National Development Plan II
NEDCo    Northern Electricity Distribution Company
NGS      National Geothermal Strategy
PAUESA   Power Africa Uganda Electricity Supply Accelerator
PURC     Public Utilities Regulatory Commission
PV       Photovoltaic
RPO      Renewable Energy Purchase Obligation
SAEMS    South Asia Energy Management Systems
SGPU     Strategic Geothermal Planning Unit
SMR      Small Modular Reactor
SNE      Secretaria Nacional de Energia (National Energy Secretariat)
SPCC     System Planning Coordination Committee
SPV      special purpose vehicle
UDB      Uganda Development Bank
UEGCL    Uganda Electricity Generation Company Limited
UETCL    Uganda Electricity Transmission Company Limited
UIA      Uganda Investment Authority
USEA     United States Energy Association
USTDA    United States Trade and Development Agency
VRE      variable renewable energy sources
WAPP     West African Power Pool

                                                                        8
EXECUTIVE SUMMARY
London Economics International LLC (“LEI”) and Grid Advisors LLC (“Grid Advisors” or “GA”), together
the “LEI team,” were retained by the United States Energy Association (“USEA”) to support the Uganda
Electricity Generation Company Limited (“UEGCL”) in developing an Energy Mix Diversification Strategy
in order to meet UEGCL´s 5-Year Strategic Plan 2018-2023, as well as its longer-term development plans.
Ahead of this report, the LEI team completed two deliverables – an inception report and a technical
report. The inception report documented the project kickoff with USEA and UEGCL, and summarized
the team’s preliminary findings from the review of existing information and data received from UEGCL.
The technical report detailed the team’s collection and review of technical data including existing studies
on network infrastructure, project development, renewables integration, generation planning, and grid
development.
Throughout the engagement, the LEI team regularly met and engaged with government agencies active in
the Ugandan Electricity Supply Industry (“ESI”), including the Electricity Regulatory Authority (“ERA”), the
Ministry of Energy and Mineral Development (“MEMD”), the Uganda Electricity Transmission Company
Limited (“UETCL”), and the Uganda Investment Authority (“UIA”). The LEI team also interviewed other
stakeholders in the power sector such as Power Africa Uganda Electricity Supply Accelerator (“PAUESA”),
and the Uganda Development Bank (“UDB”), as well as two renewable energy developers, Tryba Energy,
and Industrial Promotion Services (“IPS”).
As a first step in the development of a diversification strategy, the LEI team reviewed the drivers
underpinning the requirement for a more diversified energy mix in Uganda. Rigorous, orderly, and
organized planning being a prerequisite to achieving any diversification goal, the team then explored best
practices in institutional design and planning through the review of a sample of emerging economies with
hydro-dominated power systems. A summary of findings and recommendations is presented in Figure 1
below.
9Figure 1. Key lessons for Uganda from case studies
Key lesson Country observed in Details
Integrated resource ▪ Kenya ▪ It is important to establish harmonization of sector
planning at a country planning into a single long-term plan with a common set of
▪ Panama
level inputs and assumptions
▪ Ghana
▪ For Uganda, the benefits of developing an IRP process may
outweigh the costs, for instance streamlining the various
planning processes taking place across multiple entities
Generation planning ▪ Kenya ▪ The LEI team observed various generators acquiring
at a company level internal capabilities and skillset that allow them to
▪ Ghana
develop their own generation plan
▪ The LEI team would recommend UEGCL to develop its
own independent generation plan which findings would
then be inputted into an industry wide planning
▪ Similar to Ghana, one might envision the Sector Planning and
Coordination Committee (“SPCC”) to also carry out short
term planning at the country level to track opportunities
and threats to the system; this could further enhance
UEGCL’s generation planning
Next, under the technical review, a five-step deterministic supply-demand balance analysis was performed
to quantify the needs a diversified energy mix would address. Consistent with the LEI team’s mandate to
solely rely on existing documentation and resources, the team refined available supply/demand projections
to derive credible load and generation forecasts that would inform the determination of system needs
UEGCL would consider while implementing its diversification strategy. The five-step methodology relied
upon in the technical review is depicted in Figure 2.
Following this analysis, and while taking into account total capacity already controlled by UEGCL, it was
determined that in order to address growing demand and reach goals of energy mix diversification, UEGCL
should consider installing up to 300 MW of available capacity1 by year 2030, and between 894 MW and
1,938 MW of additional available capacity by the year 2040. Given the lead time, and the nature of activities
associated with project development in general i.e., scouting and securing land, data gathering,
interconnection process, financing planning and else, UEGCL should strive to plan for these additions as
early as possible.
1
Available capacity means nameplate capacity times the expected availability of the specific technology.
10Figure 2. Illustration of the 5-step methodology
Step 5: Assess
feasibility of integration
of renewables into
system
Step 4: Identify
opportunities for
renewable
development
Step 3: Develop
deterministic supply-
demand balance
Step 2: Refining
existing generation
expansion plans
Step 1: Refining existing
demand forecast
The LEI Team determined that capacity additions for UEGCL (in the mid-term in particular) should be
primarily made up of solar (with or without battery energy storage system –“BESS”), wind and/or
geothermal technologies, based on a number of criteria ranging from the availability of the primary energy
resources in Uganda (solar irradiation, wind regime or geothermal potential), the consideration of these
resources in both UEGCL’s strategic plan and the country’s overall development plan, along with the
potential ripple effects deploying such technologies could generate throughout Uganda’s economy. Uganda
is naturally endowed with generous solar irradiation, there is extensive accumulated knowledge regarding
greenfield development of solar farms (more than 50 MW currently operating in the country), technology
costs have been on a steady decline and the trend is expected to continue. Solar is proven to be technically
feasible and financeable in Uganda. Although wind and geothermal technologies were reviewed in detail,
we recommend that UEGCL consider these technologies when the quality of resources is proven and/or
when lessons learned from actual development of these resources in Uganda are available.
Once the system needs and the energy mix composition were identified, we next conducted a high-level
assessment of the state of the grid by reviewing available studies that discuss the existing electricity
network, grid planning, and the grid’s ability to evacuate power under existing constraints. From the team’s
review, we established that the grid could integrate over 100 MW (on aggregate) of wind and solar at
specific locations without any upgrades to the transmission network. However, to accommodate the full
suggested 300 MW of renewable technologies by 2030 plus as much as 1,938 MW of a mix of renewable
and conventional generation by 2040, a series of improvements will need to occur, and additional
transmission system investments may be warranted.
Based on the LEI team’s findings and the assumed composition of the energy mix, an implementation
strategy was developed to guide UEGCL toward its goals. This strategy was supplemented with feedback
gathered from stakeholders and comments received from UEGCL. As a result, we propose in this report
11a combination of guidelines applicable not only to UEGCL but also to the rest of the industry. In fact, we
conclude that some targeted regulatory changes and planning reforms at the system level might be key in
enabling a successful implementation of any energy mix diversification (for UEGCL). In the following
paragraphs, we highlight key aspects of the strategy developed for UEGCL and point out key
recommendations for the sector.
Figure 3. UEGCL strategy highlights and key recommendations for Uganda
For UEGCL For Uganda’s Power Sector
• Acquire the capability to independently develop a long • Developing an Integrated Resource Plan (“IRP”) at
term generation plan (for UEGCL and Uganda) the country level. The IRP could be sponsored by
• Hire, retain and train staff on regulatory, planning, MEMD which in turn would delegate the technical
engineering, construction, and project development work to a dedicated entity independent of the
Short term
matters regulatory authority
• Scout, acquire and secure land for project development
• Preserve institutional knowledge of renewables and • Legislative review of all key institutions and agencies
storage technologies via skills-transfer mechanisms with to better define roles and responsibilities in
IPPs generation planning; MEMD and ERA to provide
• Maintain and improve operations of existing fleet support to UEGCL for executing its mandate to lead
• Continue working on ongoing initiatives (such as co- generation planning activities while collaborating
location of solar on hydro sites; geothermal wellhead) narrowly with all relevant stakeholders
• Synching up licensing and other generation expansion
• Continue updating generation plan on an annual basis
Medium term
activities under a centralized generation planning
• Develop new renewable resources preferably in modular
process, to enable new development to primarily be
plants of 50 MW
based on system needs
• Engineer, procure and construct renewable resources
based on system needs and UEGCL’s plan • Regulatory framework guiding the formalization of an
• Carry out conceptual engineering studies for the ancillary service market under which services
renewable power plants providers will be compensated
• Continue updating the least cost generation expansion
Long term
on an annual basis
• Continue development of new installation based on
system needs
• Leverage opportunity to develop up to 1.9 GW of
generation by 2040
1.1 UEGCL Strategy highlights
Short term (2020-204)
• Solicit the support from MEMD and ERA to lead generation planning activities in cooperation and
collaboration with the other key stakeholders.
• Hire and retain staff to nurture and preserve institutional knowledge on matters related to
regulatory, planning, engineering, construction and project development; cultivating such internal
knowledge will empower UEGCL to execute its mandate with limited reliance on external
technical support while developing expertise that could be in turn leveraged and potentially
monetized. Concurrently, we recommend that ERA and the MEMD consider setting up a process
for knowledge sharing / skill transfer to improve UEGCL’s competitiveness. In the case of wind
technology for instance, we would hope IPPs developing the first few wind projects in Uganda to
share critical data (such as data on wind regime) and lessons learned with UEGCL in a systematic
fashion.
12• Acquire the capability (i.e., hire personnel, acquire tools, and training) to independently develop
long term least-cost generation plans and to update them on an annual basis; and actively
participate in the joint planning committee.
• Improve operations of ongoing fleet; UEGCL should take all the necessary steps to ensure it
maximizes the life duration of the assets under its control to avoid extended forced outages or
early retirement, which then could trigger additional needs of capacity additions.
• Start the development process of new renewable resources by scouting, acquiring and securing
sites where these plants could be located, and perhaps establishing measurement equipment to
ascertain the quality of the renewable resource (e.g., wind or solar).
• Continue ongoing initiatives such as the co-location of solar installation on hydropower sites and
consider implementing geothermal wellhead plants.
By 2024, once the foundational work has occurred UEGCL would be in a position to carry out the
required capacity addition that it will rely upon to diversify its supply mix.
Action items for the Mid-term (2025-2030)
The LEI team makes the following recommendations for the mid-term:
• UEGCL to continue updating its least cost generation expansion plan on an annual basis.
• Carry out conceptual engineering studies for the renewable power plants, including the
infrastructure required to connect the plant to the grid and the need for additional reinforcements
in the transmission system.
• Findings of studies carried out until then, would be leveraged to derive an estimate of
development, operation and maintenance costs, which will be used to further refine estimate of
the economic feasibility of the projects.
• We recommend that UEGCL continue the development process of new renewable resources
preferably in modular plants of 50 MW by completing the licensing process with ERA, and by
performing all necessary feasibility and environmental studies.
• Engineer, procure and construct renewable resources as determined by the latest version of the
generation expansion plans that UEGCL would be updating on a continuous basis.
Action items for the Long term (2031-2040)
The LEI team makes the following recommendations for the long-term:
• UEGCL to continue updating the least cost generation expansion plan on an annual basis.
• UEGCL can participate in the provision of the system needs with a mix of renewable, BESS and
conventional technologies.
• With the demand forecast presented, for the 2031-2040 period, the new generation requirements
are such that VREs alone might not be sufficient to address the system needs – rather it would
need to be complemented with other technologies. Findings from the LEI team’s technical review
suggest the opportunity to add between 894 MW and 1,938 MW by 2040 depending on the actual
13load demand that materializes in the future. For this purpose, the possibility of exploiting hydro
and geothermal sources, and adding efficient thermal sources of diverse nature should be
explored.
1.2 Recommendations for the sector
• Develop an Integrated Resource Plan (“IRP”) at the country level. The development of an
Integrated Resource Plan based on assumptions agreed upon by key stakeholders will enable
better consistency across planning activities, reduce inefficiency and will be conducive to orderly
transmission and generation expansion in Uganda. We envision the IRP to be sponsored (issued)
by an entity such as MEMD which could, if necessary, delegate the technical work to a dedicated
entity independent of the regulatory authority.
• Existing planning activities from ERA (including licensing), MEMD or UEGCL are not coordinated
and are rooted in different assumptions and long-term outlook. As a result, the Uganda system
has increasingly become over-supplied, giving way to new challenges such as generation
curtailment or the limited ability of the grid to continuously absorb large influx of generation. We
recommend that licensing and generation development activities in Uganda become driven by
system needs and remain tied to a common generation expansion plan. A way to formalize this
process would be to develop an annual procurement whereby total capacity injection required in
the system is allocated to developers in a competitive process. This would result in a generation
addition process that is orderly (quantity, location and timing of needs will be identified in the
system planning) and cost effective (i.e., based on a competitive process).
• We recommend a legislative review of all key institutions and agencies to better define roles and
responsibilities in generation planning and procurement. We recommend that UEGCL benefits
from the support of MEMD and ERA to lead planning activities on the generation side (similar to
UETCL on the transmission side) while collaborating closely with all relevant stakeholders.
• As of now, it is our understanding that none of the resources providing spinning reserves for the
entire system are compensated for this grid-wide reliability service. In other words, there are
limited incentives to provide such ancillary services, whose need is increasing with the large influx
of renewables. We recommend that ERA with the support of MEMD lays out the regulatory
framework guiding the formalization of an ancillary services regime under which ancillary service
providers are compensated when providing these services. Compensating ancillary services
providers will not only remunerate existing providers for services already delivered to the grid,
but it will also stimulate participation in the provision of these services, thus further enhancing
reliability across the overall system.
• Finally, we would encourage not only UEGCL but also the other key stakeholders to solicit
technical and financial support from USAID, Power Africa and USEA, while navigating through the
suggested reforms and acting on the various recommendations. It is reasonable to assume that
key stakeholders could benefit from some level of support and assistance in planning, capacity
building, software acquisition, training and else.
14PLANNING FOR AN ENERGY MIX
DIVERSIFICATION
Energy system planning best practice suggests that an energy mix consisting of resources complementary
to each other is more resilient and reliable in the face of ever changing operating conditions.2 Specifically,
system planners should ensure both resource and location diversity in their energy mix in order to achieve
their goals of a secured, sustainable and reliable system.3 Implementing a long-term energy plan requires
not only actively coordinating with various relevant stakeholders across the industry, but also a strong
and coherent institutional framework to ensure that the plan is carried out effectively. This section first
provides a discussion on the drivers underpinning the need for a more diversified energy mix in Uganda.
Formal, orderly, and organized planning is a prerequisite to achieving any goal of energy mix diversification.
Once we highlighted the need for energy mix diversification in Uganda, we explored best practices in
institutional design and planning through the review of a sample of case studies to provide guidance to
UEGCL’s in its generation planning and provide recommendations to improve planning at the country
level.
2.1 Diversification for a more resilient utility
Uganda has about 1.3 GW of installed capacity, with hydro comprising ~1 GW (80% of total installed
capacity).4 Recent data on annual generation shows that in 2018, large hydro and small hydro combined
for nearly 90% of total generation in Uganda. A summary of these operating statistics is illustrated in Figure
4 below.
Figure 4. Uganda installed capacity and generation
Installed capacity (2020) Generation (2018)
Thermal (HFO) Cogeneration Solar Thermal Bagasse
8% 1% 6% 4%
8%
Solar PV Small
4% Hydro
7%
Large
Hydro Hydro
80% 82%
Total = 1,293 MW Total = 3.9 TWh
Source: ERA, UEGCL
2
IESO website. Managing A Diverse Supply of Energy. 2020.
3
Li, Xianguo. "Diversification and localization of energy systems for sustainable development and energy security."
Energy policy 33.17 (2005): 2237-2243.
4
Data received from UEGCL on June 15, 2020.
15Looking at the fuel and generation mix, it is apparent that Uganda is heavily reliant on hydro generation
and therefore susceptible to hydrological fluctuations and changing weather patterns. This vulnerability
was observed in 2005 and 2006, as well as between 2011 and 2012, whereby Uganda endured periods of
drought which resulted in load-shedding and procurement of power from costly emergency power
producers (“EPPs”).5 These events had a negative impact on the economy through productivity loss
originating from poor electricity access during load shedding events, lost revenues through energy not
served, and higher electricity costs due to costly EPPs.
As a result of this vulnerability, it is prudent for Uganda to seek a more diverse supply mix that includes
a variety of fuel sources, that are reliable, secure and affordable. For UEGCL, the case to diversify its
supply mix is derived from its own strategic plan. Specifically, UEGCL has indicated it seeks to be a leading
power producer in the Great Lakes region, and to achieve this goal, it is sound business strategy to have
a diverse portfolio to ensure it has a fleet available to meet a variety of needs, under variable market
conditions. In addition, as a state-owned entity, UEGCL can position itself as a champion of Government
policy to diversify the power supply in Uganda, while supporting the goals of the National Development
Plan and the national energy policy.
While UEGCL may decide to pursue diversification through a mix of renewable and non-renewable or
thermal technologies, it is likely that renewables offer the most optimal pathway for diversification. The
case for renewables as a tool to diversify the UEGCL supply mix is made by considering the various
national planning objectives, the availability of favorable resources within Uganda, the opportunity to
accelerate human capacity development (with training and other transfer of knowledge), and the chance
to create jobs and stimulate economic growth. Specifically, Uganda’s National Development Plan (“NDP”)
III target for 2025 is 3,500 MW of installed capacity, and the country has an ambitious target of 41,738
MW by 2040.6 The relatively short development times for renewables such as solar and the availability of
abundant natural resources (solar irradiation in particular) in Uganda can support these goals. In addition,
Uganda has expressed a desire to remain committed to its emissions reduction and sustainability goals as
part of NDP III; renewable technologies would be pivotal in meeting its goals.7
A review of multiple documents made available to the team (including, among others
“2016_ERALeastCostGenerationPlan2016”, “2015_REP_ERAGridAnalysisReport” and “SPCC Report on Load
Growth”) revealed a general consensus among stakeholders that the existing planning and implementation
paradigm is fragmented. This is seen particularly in the nature of plans and strategies within the sector,
such as the UEGCL Strategic Plan (2018 – 2023),8 UETCL’s Grid Development Plan (2018 – 2040), and
other policy papers such as the Rural Electrification Strategy Paper 2030 and Electricity Connection Policy
2017. While all these plans and strategies have a common direction, they do not appear to be directly
complementary or specifically coordinated. The creation of the System Planning Coordination Committee
(“SPCC”), a working committee regrouping key stakeholders of the power sector, remains nonetheless a
key step in the right direction toward increased collaboration and organized planning. The LEI team
reviewed planning practices and institutional design in a sample of jurisdictions sharing commonalities with
5
Eberhard, A. & Godinho, C. Lessons from Power Sector Reform: The Case of Uganda. World Bank Group. April 2019.
P. 16.
6
. National Planning Authority. Third National Development Plan (NDPIII) 2020/21 – 2024/25. June 2020.
7
National Planning Authority. Third National Development Plan (NDPIII) 2020/21 – 2024/25. June 2020.
8
UEGCL. Five-Year Strategic Plan (2018-2023). 2018.
16Uganda with the goal of extracting key takeaways that could be leveraged to provide guidance on
improving planning at both the UEGCL and the country levels.
2.2 Institutional structure to support efficient planning strategy
A generation planning exercise is one that allows the utility, region, or state to meet growing demand
safely and reliably in the future. The key principle of reliability is also supported by the other planning
principles of least cost supply, and in a manner that maximizes resources and mitigates environmental
impact. A summary of best practices in utility resource planning is discussed in the following textbox.
Best Practices in Utility Resource Planning
For electric utilities, an integrated resource plan (“IRP”) represents a utility plan for meeting
forecasted annual peak and energy demand, as well as a pre-determined established reserve margin
for reliability purposes. To do this, a utility can seek to use a combination of supply-side and demand-
side resources for a specified period of time. This planning process is resource-intensive, and typically
mandated by the regulator, but its benefits typically outweigh the costs because it could be designed
for the entire system (country). The key principles established from best practice in the US indicate
the following traits of a good IRP process:
• stakeholder engagement: involvement of a varied group of stakeholders, including
consumers and developers, is a key input into the planning process;
• regulatory oversight: an independent third party, typically a regulator, is an important entity
in ensuring fairness in the process, and setting and enforcing rules; and
• establishing a process: a regular time period with clear processes should be set. Other
processes should include fuel prices, environmental costs and constraints, evaluation of
existing resources, selection plans and action plans.
Source: Wilson, Rachel and Bruce Biewald. "Best Practices in Electric Utility Integrated Resource Planning." Regulatory
Assistance Project and Synapse Energy Economics. 2013.
In several jurisdictions around the world, this planning function is undertaken by a single planning entity,
usually the utility, but with support from other organizations. Where the utility is unbundled, the planning
would often reside with the system operator, which is responsible for forecasting demand, and who may
even be responsible for identifying, proposing, or procuring least cost solutions to meet demand. The LEI
team understands that UETCL would be the entity mandated to develop such planning at the country
level.
2.3 Review of best practices planning in international jurisdictions
The purpose of the case studies exercise is to extract useful and practical recommendations to improve
planning process in Uganda. We have considered three case studies: Kenya, Panama, and Ghana. Figure 5
summarizes key characteristics of the jurisdictions of study.
17Figure 5. Case studies key characteristics
Uganda Kenya Panama Ghana
Population (2019) 44.3 million 52.6 million 4.2 million 30.4 million
GDP/Capita
$777 $1,817 $15,731 $2,202
(US$, 2019)
Installed
Capacity 1,252* 2,712 3,854 5,172†
(MW)
Peak Demand
629 1,859 1,969 2,613
(MW)
Share of
hydroelectric 80% 30% 46% 31%
capacity (%)
Electricity
Market Unbundled Partially-unbundled Unbundled Unbundled
Structure
*Includes 5.9 MW of off grid supply
†Includes 181.6 MW of embedded generation.
Sources: ERA; Energy and Petroleum Regulatory Authority (Kenya); National Authority of Public Services (Panama); Public Utilities
Regulatory Commission (Ghana).
In each case study, we answer the following questions:
• What is the existing institutional framework in the power sector as it pertains to planning and
diversification?
• To what extent does the current framework support energy mix diversification?
• What is the key function of a state-owned generation company in energy mix diversification?
Across the jurisdictions reviewed, we observed a distinct planning paradigm for the electricity sector that
we highlighted. For instance, in Kenya, while the long-term sector plan is managed and issued by the
Ministry of Energy and Petroleum (“MoEP”), there are elements of planning performed internally by
entities such as the Geothermal Development Company (“GDC”) and the transmission company,
KETRACO. In Ghana, long-term planning is driven by the Energy Commission, while short-term planning
is carried out in a collaborative process by a committee of industry stakeholders (a committee akin to the
SPCC in Uganda). In Panama, both short and long-term planning activities are concentrated within one
18entity, the Secretaria Nacional de Energia (“SNE”). We explore each of these elements in greater detail
in the following sub-sections.
Kenya: centralized planning and private market participation
Neighboring Uganda to the east, and a member of the East African Community (“EAC”), Kenya is Uganda’s
major economic trading partner in the region. The two East African nations share a border and access to
Lake Victoria, along with Tanzania. With regards to resource endowment, Kenya has historically relied on
hydroelectric generation, but over the last decade has increasingly relied on geothermal capacity to
provide a significant proportion of baseload generation.9 Kenya’s power sector is characterized by a blend
of state and private sector participation in the generation sector, and a state-owned monopoly in
transmission and distribution. A snapshot of the sector is shown in Figure 6 below.
Figure 6. Kenya economy and electricity sector snapshot
Key Facts Installed capacity by fuel
Population 52.6 Million Solar
Co-generation 2%
1%
GDP/Capita (US$) 1,817 Wind
12% Hydro
31%
Transmission lines (KM) 7,420
Distribution lines (KM) 226,279 Geothermal
24%
Thermal
Peak demand (MW) 1,859
Oil
30%
Installed capacity (MW) 2,712
Sources: Energy and Petroleum Regulatory Authority.
Kenya began sector reforms in the 1990s, but its unbundling was limited to the generation sector, through
the unbundling and eventual partial listing of Kenya Generation Company (or “KenGen”). In the wires
segment, transmission and distribution remained under the purview of the Kenya Power and Lighting
Company (“KPLC” or “Kenya Power”). In 2008, the Kenya Transmission Company (“KETRACO”) was
established to build new transmission lines – existing high voltage lines would remain under the ownership
and maintenance of KPLC. Also, in 2008, the Geothermal Development Company (“GDC”) was formed
to undertake geothermal exploration, and support sector de-risking – a detailed discussion on the
geothermal sector in Kenya is found in Section 3.4 later in this report. Sector policy is set by the Ministry
of Energy and Petroleum, and the regulator is the Energy and Petroleum Regulatory Authority (“EPRA”),
formerly the Energy Regulatory Commission. A summary of the institutional framework in Kenya is shown
in Figure 7 below.
9
Eberhard, A. & Godinho, C. Learning from Power Sector Reform: The Case of Kenya. World Bank Group. April 2019.
19Figure 7. Kenya institutional framework
Policy and Regulation Market Participants
Planning
Ministry of Energy and
Petroleum (“MoEP”)
Generation
Energy Tribunal (e.g. GDC, KenGen, IPPs)
(“ET”)
Energy & Petroleum
Regulatory Authority
(“EPRA”) Transmission & Distribution
(Kenya Power, REA, KETRACO)
National Land
Commission
(“NLC”)
Sources: Energy and Petroleum Regulatory Authority
One of the key events in Kenya’s power sector development was the prolonged drought of 1999 to 2000.
Similar to Uganda, the drought conditions and poor hydroelectric output resulted in frequent load
shedding events that had damaging consequences for both the utilities and the economy. Some estimates
suggest that because of the reduced industrial activity, Kenya’s GDP declined 0.6% and Kenya Power
revenues declined by nearly $20 million.10
As of this writing, Kenya has seen investments in a variety of technologies, including a large scale and
successful geothermal program of over 650 MW, over 400 MW of wind generation, and over 50 MW of
utility-scale solar. This mix of baseload and intermittent renewable technologies has allowed Kenya to
diversify its fuel mix such that it is no longer reliant on its legacy hydroelectric assets. Most recently, the
system operator has indicated that geothermal now provides the bulk of the baseload generation, and
Kenya operates the world’s ninth largest geothermal fleet. The MoEP is the entity responsible for planning,
and the textbox below highlights its function.
MoEP as a planner
With respect to long-term planning, the responsibility for development of a sector strategy and
plan resides within the Ministry of Energy and Petroleum (“MoEP’). MoEP develops a medium- and
long-term strategy for both generation capacity development and transmission expansion. The
most recent plan covers a 5-year and 20-year planning horizon, from 2015 to 2020 for the medium
term, and 2015 to 2030 for the long term.
Sources: Ministry of Energy and Petroleum. Development of a Power Generation and Transmission Master Plan.
October 2016
10
Parry, Jo-Ellen, et al. "Climate risks, vulnerability and governance in Kenya: A review." Commissioned by: climate
risk management technical assistance support project (CRM TASP), joint initiative of bureau for crisis prevention and
recovery and bureau for development policy of UNDP (2012).
20A combination of state policy direction,11 robust public, donor and private market investment, and an
independent regulatory regime has allowed for a diverse energy mix in Kenya. Although several marquee
independent power producers are renewable generators (e.g., Lake Turkana Wind Project), a significant
proportion of IPPs are thermal plants. The experience in the geothermal sector is instructive, as it
illustrates the role for capacity building within state-owned entities, and the potential for the state to
reduce risk in a specific sector.
Panama: capitalizing on renewables
Like Uganda, the country of Panama began reforming the electricity sector in the mid-1990s. In 1995,
Panama initiated the reform of its electricity sector with the passage of legislation allowing private
participation in power projects. This was followed in 1996 by the Public Services Regulatory Agency Law,
which established the new institutional arrangements for regulation of public services, including electricity.
Panama is a smaller country than Uganda, located in Central America, but has historically been mostly
supplied by hydroelectric power (close to 50%), with several legacy hydro assets in its system. A summary
of the economy and power sector is illustrated in Figure 8 below.
Figure 8. Panama economy and electricity sector snapshot
Key Facts Installed capacity by fuel
Solar
Population 4.2 Million Wind 5%
7%
GDP/Capita (US$) 15,731
Transmission lines (KM) 3,018
Hydro
46%
Bunker &
Distribution lines (KM) 40,739 Diesel
32%
Peak demand (MW) 1,969
Natural
Installed capacity (MW) 3,854 Gas
10%
Sources: ETESA; World Bank data
Reforms in the sector were driven by the “Electricity Law,” enacted in February 1997. 12 This law
delineates the design of the reformed sector and transitional arrangements to achieve these reforms. At
this time, the state-owned vertically integrated utility, the Hydraulic Resources and Electrification Institute,
was unbundled into separate entities.
The Autoridad Nacional de los Servicios Públicos (National Authority for Public Services – ASEP) is the
industry oversight and regulatory body. Independent System Operator (“ISO”) functions are performed
11
The Energy Act of 2006 established the Energy Regulatory Commission and provided the framework for fuel
pass-throughs and tariff setting. The policy also established the GDC and KETRACO, as well as setting the course
for the partial listing of KenGen on the Nairobi Securities Exchange. In addition, in 2008, a Feed-In Tariff (“FIT”) of
US¢12/kWh was implemented for renewables, and combined with a public procurement legislation established in
2007, allowed for a framework for private sector participation.
12
“Ley No.6 de Febrero de 1997 por la cual se dicta el Marco Regulatorio e Institucional para la Prestación del
Servicio Público de Electricidad.”
21by Empresa de Transmisión Eléctrica S.A. (“ETESA”). ETESA is responsible for transmission system
expansion and operation, indicative generation system expansion planning, and system dispatch. The
Secretaria Nacional de Energia (National Secretariat of Energy – SNE) develops national policies, strategic
plans, and proposes laws in relation to the energy sector. Figure 8 illustrates Panama’s institutional
structure and organization.
Similar to Uganda, Panama has historically relied on hydroelectric power which made it susceptible to
changes in hydrology. Specifically, in 2014, extended drought conditions significantly reduced the output
of the country’s nearly 1.8 GW of hydro capacity. 13 In 2006, the Electricity Generation Company
(“EGESA”), a state-owned generation company was created to develop projects and compete in the
generation market.
Figure 9. Panama institutional framework
Policy and Regulation Market Participants
Ministry of Generation
Environment (EGESA, AES Panama, etc.;
Self-/Co-generators)
National Authority
of Public Services
(“ASEP”) Transmission
(Electricity Transmission Company, “ETESA”)
Planning
National Energy
Secretariat
(”SNE”) Distribution
(EDEMET, EDECHI, ENSA)
National Science
and Technology Operations & Operational Planning
Secretariat (National Dispatch Centre, “CND”)
Sources: International Renewable Energy Agency. Renewables Readiness Assessment - Panama. 2018; Secretaría Nacional de Energía.
Generación Eléctrica (CEE 1970-2019). August 8, 2020.
Since 1997, Panama has evolved to full competition in the wholesale electricity market, including the
creation of an hourly energy market. It also has a contract market for long-term PPAs between generators
and off-takers. Because Panama uses auctions to determine prices for capacity within the contract market,
the regulator is responsible for setting auctions for certain technologies such as wind and solar. These
auctions have resulted in the increase in the solar and wind capacity from little to no capacity in 2010, to
143 MW and 270 MW respectively.14 As a way of diversifying its electric supply and taking advantage of
favorable resource, wind and solar PV plants first came online in 2013. We discuss the role of SNE in this
planning process in the textbox below.
13
IRENA. Renewables Readiness Assessment: Panama. 2018. International Renewable Energy Agency, Abu Dhabi.
14
Fábrega, José, Denise Delvalle, and Alexis Baúles. "Electricity sector overview." World Small Hydropower
Development Report 2019 4 (2019): 90.
22SNE as the planning entity
The mission of the National Energy Secretariat (“SNE”) is to establish and advance the country’s
energy policy, with the aim to guarantee security of supply.
The SNE was the entity responsible for developing the latest National Energy Plan 2015-2050 (PEN
2015-2050), which was established as a long-term roadmap for diversifying the energy sector, and to
allow it to achieve a goal of 70% renewable energy supply by 2050. Under this strategy, solar, wind,
hydro and biomass comprise 77% of total installed capacity, and solar and wind combined will
comprise nearly 8 GW. Under this plan, it is anticipated that renewable development will continue
to be a priority for auction development.
Sources: Secretaría Nacional de Energía. Acerca De.
Ghana: balancing role of hydrocarbons and renewables
Historically, Ghana has relied heavily on hydroelectric power and in particular the 900 MW Akosombo
Hydroelectric power station provided sufficient supply for the country’s industries and allowed for export
to neighboring Togo, Burkina Faso, and Benin.15 Similar to Uganda, Ghana’s economy is largely driven by
agricultural output, and its key products of gold, cocoa and wood comprise a significant portion of exports.
Ghana has also greatly expanded its hydrocarbon extraction through offshore drilling of oil and gas
reserves at the Jubilee and TEN Fields.16
Figure 10. Ghana economy and electricity sector snapshot
Key Facts Installed capacity by fuel
Population 30.4 Million Solar,
1%
GDP/Capita (US$) 2,202
Hydro, 30%
Transmission lines (KM) 6,472
Distribution lines (KM) >72,000
Thermal†,
69%
Peak demand (MW) 2,613
Installed capacity (MW)* 5,172
* Includes 181.6 MW of embedded generation.
† Thermal sources of generation include natural gas, oil, heavy fuel oil, coal and diesel.
Sources: GRIDCo; Energy Commission of Ghana.
The Ministry of Energy is responsible for policy development and implementation, while generation is
supplied by state-owned Volta River Authority, Bui Power Authority and other Independent Power
Producers (“IPPs”). Transmission is the purview of the Ghana Grid Company (“GRIDCo”), and
15
Kumi, Ebenezer. The Electricity Situation in Ghana: Challenges and Opportunities. 2017. CGD Policy Paper.
Washington, DC: Center for Global Development
16
Tullow Oil website. Tullow in Ghana.
23You can also read