WIND ENERGY implications of large-scale deployment on the GB electricity system - April 2014
←
→
Page content transcription
If your browser does not render page correctly, please read the page content below

WIND ENERGY
implications of large-scale deployment
on the GB electricity system
April 2014

                                  Wind energy c1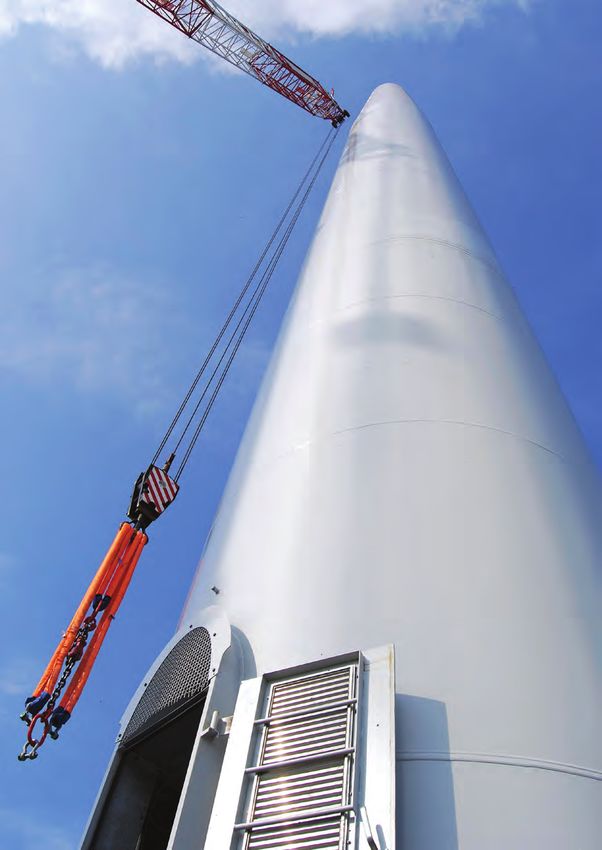
© Royal Academy of Engineering

                    April 2014

                    www.raeng.org.uk/windreport

                    ISBN: 978-1-909327-07-8

                    Published by
                    Royal Academy of Engineering
                    Prince Philip House
                    3 Carlton House Terrace
                    London SW1Y 5DG

                    Tel: 020 7766 0600
                    Fax: 020 7930 1549
                    www.raeng.org.uk

                    Registered Charity Number: 293074

                    All photos © istock, unless otherwise stated
c2 Royal Academy of Engineering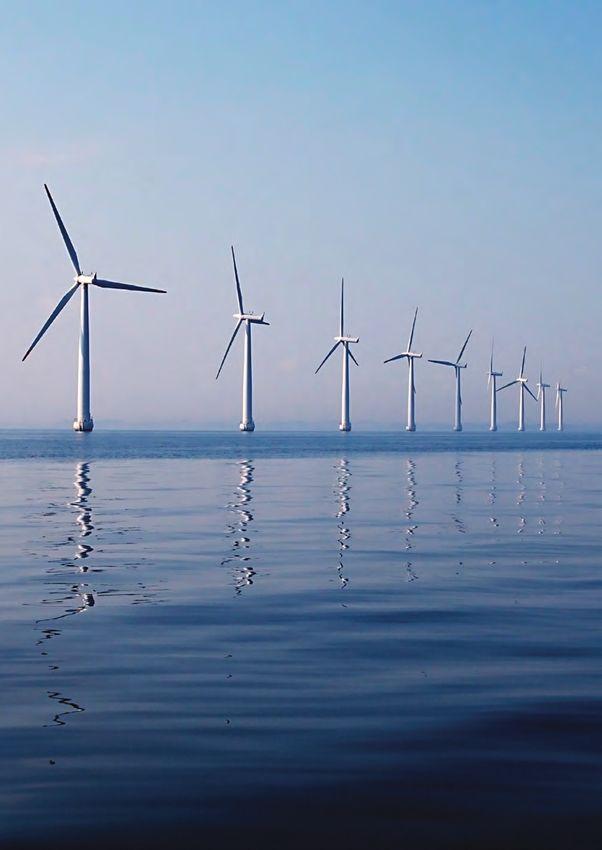
Contents

Foreword                                                       2   4. Integrating wind into the grid system                 28

Executive summary                                              3     4.1   The GB electricity market                        28

  Introduction                                                 3     4.2   Demand                                           29

  Wind capacity                                                3     4.3   Supply                                           30

  The technology                                              4            4.3.1 Load factor                                30
                                                                           4.3.2 Dispatchability/flexibility                31
  Integrating wind into the national grid system              4
                                                                           4.3.3 Predictability                             32
  Carbon emissions                                             5
                                                                           4.3.4 System inertia and grid frequency          33
  Economics                                                    5
                                                                     4.4   The generation mix                               34
  Wind and the future energy system                           6
                                                                     4.5   System security                                  36
  Conclusions                                                  7
                                                                           4.5.1 Capacity margin                            36
                                                                           4.5.2 Operating margin                           37
1. The technology                                             9
                                                                     4.6   How wind is dealt with on the system             38
  1.1   Basic physics behind wind power                       9
                                                                           4.6.1 Too much wind or not enough                38
  1.2   Size of turbines and arrays                           10
                                                                           4.6.2 Rapid changes in wind output               40
  1.3   Design of a turbine                                   11
                                                                     4.7   Summary                                          40
        1.3.1 Rotor and blades                                11
        1.3.2 Drive train                                     11
                                                                   5. Carbon emissions                                      42
        1.3.3 Tower and foundations                           12
        1.3.4 Control and monitoring system                   12     5.1   Embodied carbon                                  42
        1.3.5 Offshore turbines                               13     5.2   System-avoided carbon emissions                  44

  1.4   Maintenance                                           13
  1.5   Connection                                            15
                                                                   6. Economics                                             47

        1.5.1 Electricity transmission connections to the            6.1   Levelised costs                                  47
        GB system                                             15     6.2   Financial support mechanisms                     49
        1.5.2 Offshore transmission electricity connections                6.2.1 Government support mechanisms              50
        to the GB system                                      15
                                                                     6.3   UK content of wind industry                      51

2. Capacity of wind in the UK                                 17     6.4   Summary                                          52

  2.1   Current levels in the UK                              17
                                                                   7. Operating the grid in 2030                            54
  2.2   Contribution to energy supply                         18
  2.3   Drivers for increasing wind capacity in the UK        18     7.1   Demand side management                           55

  2.4   Comparison with other countries                       19     7.2   Interconnection                                  56

  2.5   How much will there be?                               20     7.3   Storage                                          57

        2.5.1 Expected capacity in 2020                       21     7.4   Summary                                          57
        2.5.2 Expected capacity in 2030                       21
                                                                   References                                               60
3. The wind resource                                          23
  3.1   Long-term characteristics of wind output              23   Acronyms                                                 62
  3.2   Comparison to other European countries                25
  3.3   Further analysis of the wind resource                 26   Appendices                                               63
  3.4   Summary                                               27     1.    Working group                                    63
                                                                     2.    Terms of reference                               64
                                                                     3.    Call of evidence submissions                     66
                                                                     4.    Oral evidence sessions                           67

                                                                                                                     Wind energy 1
Foreword

                                 The Royal Academy of Engineering has undertaken a considerable body of policy work on
                                 aspects of the UK energy system because it is critical to the UK economy and to society as
                                 a whole.

                                 Wind energy has emerged as the first variable renewable generating technology to be
                                 deployed at scale on the system. In its deliberations on whether to undertake this study,
                                 the Academy’s Engineering Policy Committee was aware that the debate around wind
                                 energy has become polarised and, in some respects, heated. The committee therefore
                                 felt that the Academy could make a useful contribution by setting out the engineering
                                 characteristics of the technology and exploring the implications of increasing the amount
                                 of wind energy on the electricity system.

                                 The study did not seek to form a position on whether wind power should play an increased
                                 role in the energy system but rather to identify the engineering issues that need to be
                                 addressed with this form of generation. The study took as its starting point the need,
                                 enshrined in law, to reduce greenhouse gas emissions by 80% from 1990 levels by 2050
                                 and the requirement by the EU for 15% of total energy to be generated from renewable
                                 sources by 2020.

                                 To avoid any perception that the study was inclined towards or against wind energy, it was
                                 agreed that it should be chaired by an Academy Fellow with no connection to the energy
                                 industry. In that role, I have been ably supported by a small expert working group and an
                                 Academy staff secretariat.

                                 In preparation for our report, we undertook a search of the literature, invited written
                                 evidence and held sessions in which we took evidence from people with a range of
                                 expertise, experience and views. The report has been reviewed both by expert Academy
                                 Fellows and other experts outside the Academy.

                                 As I have learned in the course of this study, the issues raised by wind energy are many,
                                 novel and complex. The deployment of deep offshore wind energy especially brings with
                                 it many challenges in terms of operation and maintenance and connection to the grid.
                                 However, the challenge of the wider transformation of the grid that is needed by 2030 is
                                 far greater; a higher level of penetration of wind will be only one of the pressures on the
                                 grid system of the future.

                                 These matters deserve debate. I hope that readers will find that this report on wind energy
                                 provides a helpful and balanced assessment of the challenges that engineers are tackling
                                 and will need to tackle as the UK seeks to create an energy system that is fit for the future.

                                 Rear Admiral John Trewby CB FREng
                                 Chair of the working group

2 Royal Academy of Engineering
Executive summary

GOVERNMENT          Introduction
POLICIES ARE
COMMITTED TO        Wind power is set to play an increasingly significant part in the future energy system
                    of Great Britain. Government policies are committed to providing 15% of energy from
PROVIDING 15%       renewables by 2020 and to cutting 80% of greenhouse gas emissions by 2050.

OF ENERGY FROM      The Academy has, in previous reports, assessed the impact of these policies on the

RENEWABLES          country’s overall energy system and, separately, on the transport and heat sectors. This
                    report considers wind energy, the first variable renewable technology to reach significant
BY 2020 AND TO      levels of deployment on the GB electrical system and one that is expected to increase

CUTTING 80% OF      penetration levels in the future.

GREENHOUSE GAS      The purpose of this report is to identify the engineering challenges that are associated
                    with the deployment of wind energy and the implications of its deployment at greater
EMISSIONS BY 2050   scale from the perspective of the energy ‘trilemma’ – security, cost and decarbonisation.

                    Wind capacity
                    The UK has some of the best wind resource in Europe. Wind generation in the UK has
                    increased significantly since the 1990s, and the latest provisional figures indicate that it
                    now accounts for around 7.7% of major sources of electricity generation. This remains,
                    however, less than 2% of total energy demand, with heat and transport continuing to rely
                    predominantly on gas and oil. The level of penetration of wind energy is some way behind
                    other countries such as Germany, Denmark, Spain and Ireland, whose experience can be
                    drawn on to inform the UK programme.

                    Estimates for the amount of wind capacity expected in the future vary but, by 2020, it
                    is possible that the installed capacity of wind could more than double to around 26GW
                    and provide around 20% of electrical energy consumed. Estimates for 2030 are more
                    uncertain, but should deployment rates continue at the upper end of industry forecasts,
                    the level of capacity could more than double again and reach levels that are currently
                    unknown on any large-scale grid system. Before this increased proportion of wind energy
                    can be accommodated, there are many engineering challenges to be overcome and an
                    acceptable risk profile achieved.

                                                                                                    Wind energy 3
AS MOVES ARE MADE The technology
INTO DEEPER WATER
AND HARSHER        Onshore wind turbines are a mature technology. Improvements in power output,
                   reliability and connection to distribution networks are still being made but there are over
CONDITIONS, NEWER, four decades of operational experience to draw on. Offshore wind is less mature with
OFFSHORE-SPECIFIC early,  shallow water turbines being mainly onshore turbines adapted for the marine
                   environment. As moves are made into deeper water and harsher conditions, newer,
DESIGNS ARE BEING  offshore-specific designs are being developed that are easier to install, operate and

DEVELOPED THAT     maintain. However, the marine environment will always be demanding and, as a result,
                   offshore wind energy is likely to remain more challenging and expensive than onshore.
ARE EASIER TO      Moreover, there remain a number of important issues affecting offshore transmission

INSTALL, OPERATE   connections that need to be resolved.

AND MAINTAIN       The payoff with offshore wind is a better wind resource and higher load factors with
                   greater space to exploit and less impact on local communities. However, it is important to
                                     note that the seas around the UK are extremely busy and any offshore wind developments
                                     must be integrated carefully with close cooperation and sensitivity to existing industry and
                                     ecosystems.

                                     Integrating wind into the national grid system
                                     Traditionally, the electrical system has consisted mainly of thermal generation plant that
                                     could be dispatched – or called on – as and when demand required. The primary energy
                                     for this has predominantly come from fossil fuels (gas, coal and oil), with nuclear power
                                     and now a small but increasing proportion of renewables. Each of these different types
                                     of generation has its own characteristics: from the constant base load of nuclear to fast
                                     response open cycle gas turbines. The market determines the basic overall mix of plant
                                     and within that the system operator, National Grid, must ensure the secure operation of
                                     the system.

                                     Wind energy has its own particular characteristics, some of which present novel challenges
                                     for the system operator. The most obvious difference with wind energy is that its output is
                                     determined by local weather conditions. Whether or not this presents a problem, however,
                                     depends on a number of factors, not least the level of demand. Low wind at times of
                                     low demand and high wind at times of peak demand are not a problem for the system
                                     to manage. But low wind at times of peak demand could potentially put the system into
                                     difficulties. Equally, high wind at a time of low demand presents a different set of issues.

                                     Managing these events is fundamental to the operation of the system and, to date, the
                                     balancing mechanisms already in place have been sufficient to cope with the amount of
                                     wind energy on the system. Only recently has wind output needed to be considered as a
                                     specific uncertainty to be addressed by means of additional balancing mechanisms. Issues
                                     will arise but evidence suggests that, at penetration levels for wind energy of up to around
                                     20% of electricity demand, the established grid system mechanisms should be able to
                                     cope. This level of penetration is expected sometime around 2020 or soon thereafter.

                                     In order to run the grid securely, the system operator needs to know what demand and
                                     generation conditions are coming over various timescales – annually, daily and hourly.
                                     Forecasts of wind output already provide accurate predictions up to a day in advance.
                                     Research continues to improve these forecasts but the chaotic nature of the wind will
                                     always result in uncertainties the system will need to cope with.

4 Royal Academy of Engineering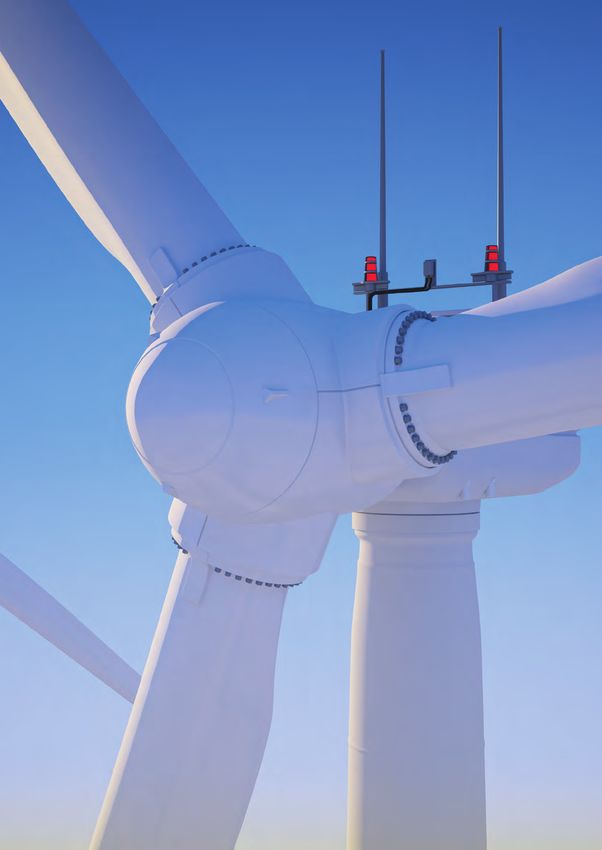
Executive summary

                                      The longer-term analysis of wind output over many years should give system operators
                                      the information they need to plan the type and scale of back-up services required to
                                      operate the grid securely. The shorter-term forecasting of wind conditions, looking just
                                      a few hours into the future, enables system operators to manage the mix of generation
                                      more efficiently and securely. Further research in these areas will be critical to keeping
                                      system costs down.

                                      In calculating the system capacity margin, the total capacity of the wind fleet is not
                                      counted, as the wind cannot be guaranteed to blow when demand is at its highest. A
                                      measure known as ’equivalent firm capacity’ determines what proportion of wind capacity
                                      can be counted towards the overall margin. In its latest assessment of the capacity margin,
                                      Ofgem, the gas and electricity market regulator, determined that 17 to 24% of wind
                                      capacity could be counted towards the overall margin. This does not mean that wind is
                                      expected to produce at least 17% or more of its total installed capacity all the time; this
                                      measure is part of a more general probabilistic calculation on the overall risk that supply
                                      might fall below demand. However, there is debate regarding the figure used by Ofgem
                                      and work continues to refine the assessment of capacity margins.

EVIDENCE INDICATES Carbon emissions
THAT WIND ENERGY
WILL REDUCE THE     Evidence indicates that wind energy will reduce the amount of fuel burnt to generate
                    electricity where it displaces fossil fuel plant, as is the case on the current GB system. The
AMOUNT OF FUEL      scale of the reduction in carbon emissions depends on a complex range of factors including

BURNT TO GENERATE the   type of generation that is replaced by the wind energy, the structure of the market and
                    reserve requirements. Some inefficiency from part-loaded plant and additional operating
ELECTRICITY WHERE reserves will further attenuate the carbon emissions reduction, but on a well-engineered
IT DISPLACES FOSSIL system this ought to be negligible.
FUEL PLANT          For the GB grid, the marginal avoided emissions for wind energy are roughly equivalent to
                    the average emissions of coal and gas plant but slightly less than the amount of emissions
                                      that would be avoided by reducing demand by the same amount.

                                      Economics
                                      It is tempting to look for one figure to give the definitive cost of energy from wind but
                                      any potential metric, such as the levelised cost of energy, will always have limitations
                                      and uncertainties. Despite this, most cost estimates suggest that onshore wind is one
                                      of the cheapest forms of low carbon electricity and that offshore wind is currently more
                                      expensive. This is borne out by the recent announcements on ’strike prices’ for the new
                                      Contracts for Difference feed-in tariff subsidy mechanism. These are the prices that each
                                      low carbon generating technology will be guaranteed for each unit of electricity produced.
                                      Over the next five years, onshore wind will receive £95 –£90/MWh and offshore wind will
                                      receive £155 –£140/MWh on contracts that will last 15 years.

                                      In terms of the system and the cost to the customer, different generating technologies
                                      have different economic characteristics. Gas or coal plant (without carbon capture and
                                      storage) are cheaper but do not meet carbon reduction criteria. They have low capital costs
                                      per MW but are subject to higher and more volatile running costs. Adding carbon capture

                                                                                                                      Wind energy 5
GOVERNMENT POLICY                and storage would make them better in terms of carbon emissions but would increase
                                 both the size and uncertainty of the capital costs. Nuclear energy has higher capital costs
IS DRIVING TOWARDS               but lower and more certain running costs. Wind energy also has high capital costs and low

A FUTURE WHERE                   running costs. The future energy system is likely to be a mix of all these technologies and
                                 will need to balance the required level of capital investment with the expected price of
WIND ENERGY PLAYS                energy to the consumer.

A MUCH GREATER                   Increasing the level of UK manufactured content in the wind industry would also help

ROLE IN THE ENERGY               the overall economic impact. Even though the UK leads the world in installing offshore
                                 wind, only around 25% of the capital is spent in the UK. None of the major wind turbine
SYSTEM                           manufacturers currently have a factory in the UK, although, at the time of writing, plans
                                 were being announced. There is a variety of reasons for the lack of a UK supply chain;
                                 political uncertainty concerning the electricity market in the UK has almost certainly been
                                 a major factor. The implementation of the government’s Electricity Market Reform should
                                 help remove some of this uncertainty, but the industry needs confidence that the offshore
                                 wind industry has a secure future in order to invest in infrastructure (particularly ports),
                                 the supply chain and the skilled jobs that this would create.

                                 Wind and the future energy system
                                 Government policy is driving towards a future where wind energy plays a much greater
                                 role in the energy system. This will by no means be the only pressure on the future
                                 energy system. In order to meet the targets set out in the Climate Change Act, the grid
                                 will need to be largely decarbonised by around 2030. To achieve that, it is likely that
                                 much of the energy requirement for domestic heating and transport would need to be
                                 electrified in the form of heat pumps and electric vehicles. This would significantly increase
                                 overall electricity demand as well as affecting the fluctuations in demand, both daily and
                                 seasonally.

                                 Such a future system would require a number of new tools alongside low carbon
                                 generation so that it could be operated securely and cost-effectively. Foremost
                                 among these are demand side management, flexible generation, energy storage and
                                 interconnection.

                                 This combination of the engineering challenges of deploying renewable energy at a much
                                 greater scale alongside a very different load profile would represent a paradigm shift in
                                 the country’s energy system. A programme of change and investment in infrastructure of
                                 this scope and scale is unprecedented in peacetime Britain. The engineering challenges
                                 involved would be huge and complex but, with sufficient, sustained political will, strategic
                                 planning and innovative engineering, such a system could be built. However, such a future
                                 system would also require a fundamental shift in society’s attitude to and use of energy.
                                 This would require an honest conversation with the public on the spectrum of issues. But
                                 without a clear, consistent strategy agreed by all stakeholders, it is highly likely that the
                                 future energy system would be less robust or much more expensive than it needed to be.

6 Royal Academy of Engineering
Executive summary

Conclusions
• Wind energy can make a significant contribution to electricity supply in the UK. Onshore
  wind is already a mature generation technology. Offshore wind brings more and complex
  engineering challenges, but engineers are providing innovative solutions.

• For levels of penetration of wind energy up to around 20% of electricity consumption on
  current demand profiles, as expected early in the 2020s, the system will remain secure
  using the balancing mechanisms already in place. Technical issues will arise, such as
  those relating to system inertia and frequency control, but these will be manageable if
  given sufficient consideration.

• Wind energy has a small carbon footprint and does reduce the carbon intensity of the
  grid system, although calculating the actual savings is complex and varies according to
  the location of the turbine and the generation mix of the system.

• At current fuel and carbon prices, onshore wind energy is more expensive than gas or
  coal plant but is one of the cheapest low carbon sources of electricity. Offshore wind
  is more expensive, as reflected in the strike prices offered for the new Contracts for
  Difference feed-in tariffs, but shows potential for cost reduction. The ultimate effect
  of wind energy on the price of energy to consumers is difficult to evaluate precisely
  because of inherent limitations and uncertainties in calculating current and future
  energy costs.

• Energy systems and technologies are global in nature and several countries are ahead of
  the UK in aspects of developing wind energy. Lessons should be learned where possible.

• Industry needs clarity and confidence in the regulatory regime and support mechanisms.
  The completion of legislation to enact Electricity Market Reform is encouraging but it
  needs to be implemented without delay and the trajectory to decarbonise the grid made
  clear as part of the next Carbon Budget. Long-term, cross-party consensus on future
  energy policy will be vital to ensuring sufficient investment and establishing a UK
  supply chain.

• By 2030, a wholesale transformation of the UK energy system will be required if
  government targets on carbon emissions are to be met. Integrating higher levels of wind
  energy will be one challenge among many. As well as low carbon generation such as wind
  energy, the future system would need to deploy such tools as demand reduction and
  management, flexible generation, interconnection, and storage. Significant changes in
  heating and transport are also expected.

• These challenges require a fundamental shift in society’s attitude to and use of energy
  and will only be met with the support of both domestic and business customers. High
  levels of wind energy will result in large numbers of very large turbines. Whether these
  are onshore or at sea, they will inevitably have an impact on local communities and
  stakeholders. Government and industry must both play their respective parts in engaging
  honestly with these stakeholders, setting out clearly both the impacts and the benefits.

• The government must take the strategic lead in preparing for the transformation of
  the UK energy system, in partnership with industry and other stakeholders. The future
  energy system needs to be mapped out, at least in general terms, with solid engineering
  evidence backed up by economic and social considerations. Wind energy can play a
  significant role along with other forms of low carbon generation as well as demand
  reduction and management, interconnection and storage. However, without careful
  strategic planning incorporating all these elements as a system, the challenges will not
  be met.

                                                                                Wind energy 7
8 Royal Academy of Engineering
1. The technology

                                                                    1.1. Basic physics behind                            energy contained in the primary fuel (in this
                                                                                                                         case wind) is converted into electrical energy,
                                                                    wind power                                           the reality is that wind energy efficiency
                                                                                                                         compares favourably with other technologies.
                                                                                                                         Turbines achieve overall efficiencies of
                                                                    A wind turbine, like all forms of power-             almost 50% compared to approaching 60%
                                                                    generating technologies, is a device that            for a modern combined cycle gas turbine or
                                                                    converts one type of energy into electrical          a maximum of around 30% for an internal
                                                                    energy: in this case, the kinetic energy of          combustion engine.
                                                                    the wind. The turbine does this by slowing
                                                                    down the stream of air flowing past it and the       In practice, a wind turbine will produce its
                                                                    resulting change in momentum is converted            maximum power output over a range of wind
                                                                    to electrical output via a generator.                speeds and will be designed in such a way as
                                                                                                                         to maximise the energy output for the wind
                                                                    In order for the turbine to be 100%                  speed distribution at the location where it is
                                                                    efficient, all the kinetic energy would need         to be installed. In general, a turbine will not
                                                                    to be removed from the air stream. But this          produce any output for wind speeds below
                                                                    would mean that the air behind the turbine           around 3m/s (7mph); it will attain maximum
                                                                    blades would be stationary and no air could          output at around 12m/s (27mph) and will
                                                                    flow. In the early part of the 20th century,         cut out at about 25m/s (56mph). Cut-out at
                                                                    Frederick Lanchester, Albert Betz and Nikolay        high wind speed can create problems for the
                                                                    Zhukovsky independently determined that              grid system as it occurs more abruptly than
                                                                    the theoretical maximum efficiency of any            cutting in from low wind speeds but current
                                                                    turbine, irrespective of design, is 59.3%.           turbines are being designed to cut out in a
                                                                    This is similar to the theoretical efficiency        more gradual and controlled fashion.
                                                                    of heat engines that are limited by Carnot’s         In terms of energy conversion, wind
                                                                    theorem and, as is the case in heat engines,         turbines are relatively efficient machines,
                                                                    in the real world, this theoretical maximum          comparing favourably with other types of
                                                                    is never reached. Additional losses occur            generating technologies.
                               Rated output speed   Cut-out speed
                                                                    as the result of a variety of factors such as
                                                                    wake rotation, tip-loss and turbulence 1.
                                                                    In practice, the highest attainable power
                                                                    coefficient is around 0.47 or about 80% of
                                                                    the theoretical limit.
Power output

                Cut-in speed                                        It is often said that wind power is ‘inefficient’,
                                                                    but ‘efficiency’ can be confused with ‘load
                                                                    factor’, the measure of how much electricity
                     3                12                 25
               m/s                                                  is actually generated relative to its theoretical
                                                                    potential (See Section 4.3.1). Taking
       Figure 1.1 Typical wind turbine power output with            efficiency to mean how much of the available
       steady windspeed

                                                                                                                                                           Wind energy 9
THE LARGEST 1.2. Size of turbines densities in the order of 500MW/km2. Fossil
fuel powered thermal plant also have higher
MACHINE IS and arrays energy densities but they are high carbon and
CURRENTLY AN 8MW non-renewable. Other forms of renewable
power tend to have energy densities of a
TURBINE WITH A The basic physics of a turbine tells us that its similar order of magnitude to wind.
ROTOR DIAMETER power output increases with swept area (or
the square of the diameter of the blade). So,
The reason why energy density is important
is the amount of land area required to
OF 164M – FOR for example, a turbine with a blade diameter supply meaningful amounts of electricity.
COMPARISON, THE of 40m gives a maximum power output
of 0.5MW compared to a similar design of
Wind energy needs a lot of space, which is
limited in the British Isles, especially when
WINGSPAN OF AN turbine with double the blade diameter of restricted to non-built-up regions with a
80m that gives a maximum output of four
AIRBUS A380 IS 80M times that amount of 2.0MW 2. The increased
suitable wind resource. However, it should
be noted that wind farms do not necessarily
OR THE DIAMETER power output is at least partly offset by
increased costs resulting from bigger and
consume all the land that they occupy. Only
OF THE LONDON EYE more expensive rotors. And given that the
a fraction (1–3%) of the land is taken up
by the turbines and farming can still take
IS 120M rotor mass increases with the cube of the
rotor diameter, there is an argument that
place around them; Whitelee wind farm near
Glasgow even has a thriving visitor centre
larger turbines should be less cost-effective, and parklands. However, land will always
although to date, innovations in turbine be limited and planning permission on the
design have countered this trend. best sites is increasingly difficult to obtain,
In practice, the optimum size of the turbine which is one of the compelling reasons for
can be calculated by a cost optimisation developing offshore wind where there is less
model that takes into account the marginal of a premium on space.
change in costs that result from a change in Wind energy is relatively low density and
one of the design parameters. requires a significant land or sea area.
In general, turbines have increased in size Although the land can still be used for
from relatively small, 50kW machines with other purposes, the level of generation
a rotor diameter of around 15m in the needed to meet the UK’s targets is likely
early 1980s, to 2MW machines with a rotor to require a greater area than can be
diameter of 80m in 2000. Today, the largest readily be accommodated on land, hence
machine is an 8MW turbine with a rotor the move to offshore.
diameter of 164m – for comparison, the
wingspan of an Airbus A380 is 80m or the
diameter of the London Eye is 120m. Larger,
10MW machines are being developed, but it is
likely that the continued increase in size will
level out to some degree.
Bigger turbines do produce more power
but, when placed together in arrays, they
need to be further apart, thus limiting the
possible overall energy density of the wind
farm. Compared to other types of electricity
generation, wind energy is relatively low
density. The actual energy density will
depend on the specific location and MacKay3
gives figures ranging from 6MW/km2 or
more for sites with high load factors or less
than 1MW/km2 for less productive sites.
In comparison, nuclear power has energy
10 Royal Academy of EngineeringThe technology
1.3. Design of a turbine glass/polyester ply or laminate, glass/epoxy
ply, and wood/epoxy laminate.
The use of wind turbines to generate 1.3.2. Drive train
electricity dates back to the late 19th century
but the development of large-scale grid The drive train, which consists mainly of the
systems meant there was little interest gearbox and generator in most cases, takes
in wind turbines until the later part of the the rotating shaft energy and converts it to
20th century. At this point, two drivers electricity. The aim is to produce the most
emerged that encouraged both industry and efficient power output from the turbine while
governments to push the development and balancing torsion and load requirements
deployment of wind turbines. The first was on the machinery and electrical output
the oil crisis of 1973 and the second was the characteristics for the grid connections.
need to decarbonise the energy system.
Early turbines operated at fixed speed and
As with most technologies in the early stage fixed pitch but that mode of operation has
of development, it took some time for an essentially disappeared as the technology has
optimum design to become established. The developed. Modern turbine designs operate
1980s saw the three-bladed, horizontal axis at variable speed. At low wind speeds, the
design gain prominence, although this is by rotational speed of the turbine is low; as the
no means the only design, and even within wind speed increases, so does the rotational
this design there are a number of variations speed, keeping the tip speed ratio (ratio of
and new developments, particularly for the tip speed of the blade to the oncoming
offshore turbines. The following subsections wind speed) at the optimum level just like
assess some of the basic engineering cruise conditions on an aeroplane. When
considerations in wind turbine design and the turbine reaches its maximum (rated)
likely future developments. power, the blade pitch and electrical torque
are adjusted to keep constant power and
1.3.1. Rotor and blades constant rotational speed.
Closely linked to the type of drive is the
The rotor converts the movement of the
type of generator. The majority of large,
wind into rotational shaft energy in the
thermal generators on the grid system use
hub. In blade design, there are two major
synchronous generators that synchronise
considerations: the number of blades and the
to the national grid system at the same
material.
frequency. However, for a variety of technical
The number of blades is determined by reasons, mainly torsional and damping, this
a variety of factors including cost versus was not possible on early turbine designs.
performance, noise and visual appearance. This meant that induction generators had to
Most modern horizontal axis turbines have be used which led to higher energy losses in
two or three blades. The optimum design is the rotor than synchronous machines and
determined by a complex calculation that will problems with integrating the turbine into
take into account the expected operational the grid system.
parameters of the turbine such as the
As turbines have increased in size, drive
power rating, tip speed and loadings on the
systems have evolved. Fixed-speed induction
hub. Noise constraints will generally favour
generators were the drive system of choice
slower moving blades and there is a general
on early turbines and worked effectively on
consensus that three-bladed turbines are
turbines up to 1.5MW. Doubly-fed induction
visually more acceptable. Combining these
generators became common around 2000,
factors has led to three-bladed designs being
offering the benefits of variable speed
favoured.
operation. At a similar time, full power
Materials are chosen for a combination of conversion designs were developed that use
strength-to-weight ratio, cost, stiffness and both gearbox and direct drive set-ups with
fatigue life. The most popular materials are either wound rotor or permanent magnets.
Wind energy 11FOUNDATION DESIGN Developments continue with no clear
consensus on the best drive train system
of offshore wind turbines, it is an area of
intense research. Not only does the design
FOR ONSHORE for the future, but very large turbines with for offshore support structure have to take
INSTALLATIONS IS variable speed systems are now the norm. into account the load from the nacelle and
rotor, but it also has to account for wave
WELL UNDERSTOOD,
The high cost of maintaining offshore
loading. Monopiles (cylindrical steel tubes
turbines has focused developments
driven into the seabed) have been the most
IN THE CASE OF on drive train reliability. Low ratio gear
common subsea support structure to date.
boxes and direct drive permanent magnet
OFFSHORE WIND generators are being proposed for offshore
These have experienced issues on a large
number of offshore turbines, particularly
TURBINES, IT IS AN turbines, where higher upfront capital
costs are rewarded by lower operation and
with the transition piece that connects the
AREA OF INTENSE maintenance costs.
tower to the foundation. This has resulted
in expensive remedial work, but solutions to
RESEARCH the problem are being developed. As water
1.3.3. Tower and foundations depth increases and wave forces become
more significant, the weight of the monopile
Towers are made mostly from steel and
becomes excessive. Steel jacket structures,
designed to support the nacelle and rotor
gravity bases and piling have also been used,
safely under both extreme and fatigue
and as offshore wind farms move further
loading. Computational dynamic models
offshore and into deeper water, the option of
are now routinely applied to undertake
floating turbines is also being investigated.
comprehensive calculations of the aeroelastic
response of the turbines. The dynamics are a
vital part of the design. Modern steel rolling 1.3.4. Control and monitoring
techniques allow a smooth taper from base system
to nacelle. The diameter at the base can
be restricted by the size of loads allowed Control systems are incorporated into all
on the roads during transport to final site. turbines to allow them to operate unattended
Transport requirements can therefore be one and implement continuous optimisation
of the main size restrictions on the maximum of both the power performance and load
turbine capacity. alleviation.
The foundation will be designed to cope As turbines get more sophisticated, the
with the maximum overturning moment of control system has become central to the
the turbine under extreme wind conditions. performance of the turbine. Indeed, data
A variety of slab, multi-pile and monopile gathering and modelling techniques are
designs have been used depending on the being used at all stages of turbine and wind
local ground conditions. farm design to improve performance. This
is especially important for offshore wind
Although foundation design for onshore turbines where better monitoring can limit
installations is well understood, in the case the amount of repairs and maintenance
12 Royal Academy of EngineeringThe technology
THE UK IS UNUSUAL required to keep the turbines available to
generate electricity for longer periods (see
experience, despite over 20 years of large-
scale offshore wind farms. This is developing
IN THAT AROUND Section 1.4). rapidly, but the potential technical issues
35% OF ITS WIND 1.3.5. Offshore turbines
and uncertainties relating to the large-scale
deployment of deep water offshore wind
FLEET IS OFFSHORE; farms far from the shore should not be
underestimated.
GLOBALLY ONLY
Although there are clearly many similarities
between the designs of onshore and
Safety at sea is also of vital importance. The
AROUND 2% OF offshore wind turbines, there are differences
that result from the particular operating
waters around the UK are extremely busy and
WIND CAPACITY IS environment. The marine environment
offshore wind farms are covering increasingly
large areas that interact with shipping lanes.
OFFSHORE offers both advantages and disadvantages.
Installation in water is obviously more difficult
The design of offshore wind arrays that
seeks to optimise output can conflict with the
than on land and becomes increasingly harder
requirements for marine safety, particularly
with deeper water (Section 1.3.3 has already
relating to the boundary of the array and
dealt with foundation issues). Salt water is
navigation of ships. Close cooperation
also highly corrosive. These negative factors
between wind developers and organisations
are offset by stronger and less turbulent
such as Trinity House is important in order to
winds and fewer restrictions on the area
resolve potential issues.
available. Given their distance from domestic
residences, there are also fewer constraints The design of turbines continues to
on noise, allowing faster blade tip speeds. progress, particularly in the drive train
and control systems. More radical design
Originally, offshore installations took
innovations are being considered for
advantage of the most appropriate sites,
offshore wind as it moves into deeper
close to land in shallow water, and utilised
waters further from land.
onshore turbine designs. Even early large-
scale offshore farms such as Horns Rev 1 used
turbines that had originally been designed for
onshore installations.
1.4. Maintenance
However, the further exploitation of offshore
wind energy will require sites much further
from shore and in much deeper water. The longevity of mechanical plant is always
Experience of offshore operations has a concern to owners and developers and
already refined the turbine design, but major wind turbines are no exception. The owners
developments are underway including more of wind farms will have committed a large
radical designs. The Energy Technologies amount of capital to the construction and
Institute, for example, has investigated a installation of the turbines on which they will
number of new possibilities including tension only obtain a return if the turbine is available
leg floating platforms, vertical axis turbines, to generate electricity. Keeping the turbine
large blades and optimised deep-water operational in increasingly hostile locations
horizontal axis designs 4. The main aim of is therefore critical to the profitability of
these projects, as with most offshore wind the development. This is particularly true
research, is to improve reliability and for offshore developments where access is
reduce costs. limited by weather conditions. Turbines are
typically designed for 20 years’ life and now
The UK is unusual in that around 35% of its many early turbines have completed such
wind fleet is offshore; globally only around lifespans. Typically, modern onshore turbines
2% of wind capacity is offshore (see are available to generate electricity 97–98%
Section 2). This reflects the leading position of the time. Availability of offshore wind is
of the UK in the installation of offshore lower but improving, particularly as access
wind but also the fact that offshore wind for maintenance has increased from around
is at a much earlier stage of development 30% of the time five years ago to around
than onshore wind in terms of operational 70% today.
Wind energy 13TURBINES ARE As the installed capacity of the wind fleet has
grown, so has the level and sophistication
analysis systems to investigate the behaviour
of the operational farms and a high level
TYPICALLY DESIGNED of operations and maintenance (O&M). of understanding has developed, allowing
FOR 20 YEARS’ LIFE In the first few years, the O&M is usually
undertaken by the original equipment
optimisation of both wind farm design and
operation. This task is more complicated for
AND NOW MANY manufacturer. Later on, large owners may wind farms than for large conventional plant
have their own O&M division, but there are since there are many external influences
EARLY TURBINES also other specialist companies that fulfil this that play an important part, including
HAVE COMPLETED role. The wind energy business is coming of
age in the context of O&M; however, it is not
topography, local flow conditions, forests,
wakes from the turbine blades and ice. There
SUCH LIFESPANS yet up to quite the same level as conventional are sophisticated tools for examining both
plant since, for example, condition monitoring the behaviour of operational farms and
is still at a fairly early stage. Offshore, the also the estimation of the performance of
task is, of course, much more demanding but the farms pre-construction. The latter has
vital. In the early days of offshore operations, benefited greatly from recent developments
access was a major problem but now access in meteorology – remote sensing, satellite
arrangements have been developed and data and computational tools – as well as the
availability is steadily rising. Increasing the application of computational fluid dynamics to
level of early-stage engineering and testing promote understanding of the local flow over
of components prior to installation will also the site. This subject does however remain an
improve the performance of the turbines essential field for research and development
and the industry is steadily improving in this and the science is moving fast.
regard. Research has indicated that, as they
Early stage engineering, monitoring and
age, the load factors of UK onshore wind
maintenance are vital to keep turbines
farms have decreased at an average rate of
available to generate energy and improve
around 0.4 percentage points a year, which is
performance.
a similar rate to the performance degradation
observed in other kinds of power stations.
There are signs, however, that newer farms
are losing output at a slower rate than this.5
Comprehensive Supervisory Control and Data
Acquisition (SCADA) systems are employed in
all commercial wind farms. They collect data
from individual turbines and from substations.
Often there are meteorological masts that are
also used to gather wind data for the site. In
the last 10 years or so, a great deal of effort
has been expended on the development of
14 Royal Academy of EngineeringThe technology
1.5. Connection 1.5.2. Offshore transmission
electricity connections to the
GB system
1.5.1. Electricity transmission
The process for connection of offshore
connections to the GB system generation is more complicated. When
Wind turbines can be connected either to offshore wind was first planned, it was
the high-voltage transmission network or to assumed that operators would also manage
a distribution network. Most individual wind the connection to shore, which is sensible for
turbines, erected for businesses or local wind farms close to land.
communities, are connected to the latter, For wind farms that are far from land, it
while large wind farms are connected to makes sense for there to be a common
the former. connection for several wind farms. In 2010,
Ofgem introduced regulations establishing
FOR WIND FARMS To obtain an electrical connection and
capacity on the GB transmission network, the concept of an offshore transmission
THAT ARE FAR FROM an application for connection must be made owner (OFTO). The regulations prohibit the
OFTO being the same entity as the wind
to National Grid which has the role of the
LAND, IT MAKES National Electricity Transmission System farm owner and also prohibit National Grid
SENSE FOR THERE Operator (NETSO). from acting as an OFTO. Although introduced
to increase competition and bring new
TO BE A COMMON As a result of this application, analysis will
be undertaken to assess the impacts on the
participants and capital funding into the
industry, this arrangement suffers from a
CONNECTION FOR GB transmission network and identify what serious ‘chicken and egg’ problem: potential
SEVERAL WIND reinforcements are required and when they
are likely to be completed. A connection date
wind farm operators are reluctant to commit
capital to building a wind farm with no
FARMS is then agreed with the new generation guarantee of a grid connection when they
project and contracts are signed that place need it and potential OFTOs are reluctant
obligations on the developer of the project, to invest in a new connection without
the NETSO and the transmission operator to guarantees that there will be customers for
which the project is connecting. the capacity they are installing.
During the lifecycle of the project, up to final One option that is available to developers is
connection, the developer of the project to build the offshore transmission connection
is required to underwrite and provide themselves and then to transfer it to an
security against the liability inherent in the OFTO when the wind farm is commissioned,
investment required by the transmission in return for a payment based on the asset
operator. Once connected, the developer value and set by Ofgem.
pays an annual locational charge for use of
the transmission network. The current arrangements for connecting
offshore wind farms to the grid are
The technical requirements for a connection complicated and may be a deterrent to
to the GB transmission network are detailed investment; continued efforts are needed
in the Grid Code and the rules that determine involving all stakeholders if this matter is to
the reinforcements required are contained be addressed.
within the Security and Quality of Supply
Standards.
Wind energy 1516 Royal Academy of Engineering
2. Capacity of wind
in the UK
2.1. Current levels in This level of capacity relates to a total
electrical system that averages around 43GW
the UK of total supply, ranging from about 20GW
overnight in summer to about 55GW at peak
times in winter (see Figure 3.1).
As of the third quarter 2013, the UK had
10.8GW of wind installed (approximately While there are few parts of the UK that are
7.1GW onshore and 3.7GW offshore) 6. Of this, without wind turbines, Figure 2.2 overleaf
around 8GW is connected to the transmission shows that they are not distributed evenly 7.
system, meaning that almost 3GW of onshore The highest density is in the central belt of
wind is embedded in the distribution system Scotland as well as the northern Highlands
and not visible to the transmission system and Grampians. Wales and the West Country
operator. also have significant numbers of wind
turbines, as does Northern Ireland, while
Figure 2.1 shows how this has progressed the West Midlands and southern England
from virtually nothing 20 years ago to more have the fewest. This reflects the desire by
rapid deployment over the last 10 years. The wind developers to locate turbines in the
figure shows that, after four years of around windiest and least populated locations but
1GW installed per year, with an increasing also results in the turbines generally being
proportion from offshore wind, 2012 saw a built a long way from the centres of demand,
jump to 2GW of new capacity split roughly thus requiring extensions and upgrades of
equally between on and offshore. 2013 has transmission lines.
seen this trend continue.
onshore 12
offshore
total 10
8
6
4
2
GW
0
Figure 2.1 UK installed
1990
1991
1992
1993
1994
1995
1996
1997
1998
1999
2000
2001
2002
2003
2004
2005
2006
2007
2008
2009
2010
2011
2012
2013
wind capacity 8
Wind energy 17Wind farm installed capacities (MW)
onshore
40
offshore
500
Figure 2.2 Geographical
distribution of wind
capacity 8
2.2. Contribution to 2.3. Drivers for
energy supply increasing wind capacity
in the UK
In terms of total energy, electricity makes
up around 20% of total final energy
consumption, with heating and transport still The proportion of renewable energy,
relying almost exclusively on gas and oil. The including wind, is set to change over the
latest provisional figures from government 9 course of this decade as we move towards
estimate that wind energy accounts for 7.7% the first of government’s primary energy
of electricity but less than 2% of UK total targets – the European 2009 Renewable
energy. This highlights the fact that wind Energy Directive that requires the UK to
energy still contributes relatively little to the obtain 15% of its total energy consumption
um ot
h UK’s total energy demand, although these from renewable sources by 2020. Latest
le
figures show that in 2012, 4.1% of energy
o
coal figures are increasing as more capacity is
er
tr
pe
added to the system. consumption came from renewable sources.
elect
gas The UK has over 10GW of wind capacity, To meet the 2020 renewable energy target,
ricity
making up almost 8% of electrical the government expects wind to play a major
nuclear demand and just around 2% of total role. Its Delivery Roadmap 10, which assessed
wind energy demand. potential deployment rates in terms of costs,
other build rates and policy framework, took the
natural gas view that wind could contribute between
57TWh and 90TWh of electricity by 2020
Figure 2.3 Primary fuel mix for total
which would be between 3.7% and 5.8%
UK energy demand in 2013 8
18 Royal Academy of EngineeringCapacity of wind in the UK
THE UK HAS THE of the estimated total energy demand in
2020, or between 18% and 28% of electrical
2.4. Comparison with
THIRD HIGHEST demand. If current build rates are maintained, other countries
AMOUNT OF these targets are attainable, but they are
challenging.
INSTALLED WIND The other policy driver for wind energy is
The UK has the third highest amount of
installed wind capacity in the EU, similar in
CAPACITY IN THE EU, the 2008 Climate Change Act that requires scale to France and Italy but significantly less
the UK to reduce its total emissions of
SIMILAR IN SCALE TO greenhouse gases by 80% by 2050 relative
than Germany and Spain, which have three
to four times more installed capacity. In 2013,
FRANCE AND ITALY to 1990 levels. Intermediate, five-year carbon
budgets are recommended by the Committee
wind produced 21.1% of Spain’s electricity
– more than any other form of generation 14.
BUT SIGNIFICANTLY on Climate Change (CCC), four of which have Denmark, while lower in terms of installed
BEHIND GERMANY been adopted by government, covering the
period up to 2027. These require a 50%
capacity, has the highest levels of wind
penetration at over 25% (see Figure 2.4
AND SPAIN reduction in greenhouse gas emissions by for further comparisons).
2025 relative to 1990 levels. The CCC have
reported that the first carbon budget has Globally, as of 2013, there were 318GW of
been met and the UK is on track to meet the wind capacity. China and the US together
second budget but is not currently on track made up almost half of that total with the
to meet the third or fourth 11. UK accounting for just over 3% 15. Where
the UK does lead is in offshore wind, with
The CCC has also recommended that the over half of the global capacity at the end of
electricity system be largely decarbonised by 2012. However, this still only accounts for
2030 (50gCO2e/kWh from its current level about 2% of global installed wind capacity,
of above 500gCO2e/kWh) 12. An amendment indicating that offshore wind is at a very
was put forward to the recent Energy Bill for early stage of deployment compared to
a decarbonisation target for the electricity onshore wind.
sector, but this was defeated 13 and any 2030
target will now have to wait until the fifth There are alternative ways of measuring
carbon budget is set in 2016. the amount of wind energy, including
installed capacity per person or per unit of
Increasing wind capacity is being GDP. Relative to the number of people in the
driven by both domestic and European country, the UK is just outside the top 10
legislation to reduce greenhouse gas and, in terms of GDP, the UK is about 20th
emissions and increase renewable in the world 16. In both cases, countries such
energy. as Denmark, Portugal, Germany and Ireland
are significantly ahead of the UK in terms of
installed wind capacity.
installed capacity (GW) 35 30 Rest of the world
percentage of
comsumption 30 Portugal China
25
Canada
25
20 France
20 Italy
15
15 UK
10
10
India
5 5
USA
GW
0 0 Spain
%
Denmark
Portugal
Spain
Ireland
Germany
Romania
UK
Greece
Sweden
Netherlands
Poland
France
Germany
Figure 2.4 Global
installed wind capacity 17
Wind energy 19GW (no. of turbines) Operational Under construction Consented Total
Onshore 6.76 (4,169) 1.51 (644) 4.45 (1,881) 12.72 (6,694)
Table 2.1 UKWED state Offshore 3.65 (1,075) 1.18 (304) 3.13 (738) 7.96 (2,117)
of UK wind capacity in
Total 10.41 (5,244) 2.69 (948) 7.58 (2,619) 20.68 (8,811)
February 2014 18
Overall, this indicates that, while the UK has
seen significant development of wind energy,
2.5. How much will
it is by no means exceptional in global terms. there be?
Certain renewable forms of generation can
be more suited to certain regions; there are
aspects of the UK that are favourable for The Renewables UK wind energy database
wind and others that are not. (UKWED) gives a breakdown of wind
developments that are operational, under
The UK is the windiest region in Europe 19, construction and consented. Projects listed
and being an island provides the opportunity as consented are not guaranteed to be built,
for offshore wind. But it is also a densely as economic circumstances can change
populated country with fewer wide open and there are other projects that may be
spaces for large wind farms compared to, for under consideration but not yet consented;
example, Spain or the US. however, this database gives the best current
The fact that some countries are some way picture of plans for wind developments in
ahead of the UK in deploying wind energy the immediate future. The table above is a
means that many of the technical issues that summary of the situation in February 2014.
arise from integrating wind energy into the Several organisations have made estimates
system will already have been encountered. of how much wind capacity might be installed
Each system is unique and the GB grid has in the UK. The methods used vary from
particular characteristics as an island system; indicative scenarios in the case of National
even so, there will still be an opportunity to Grid to assessments based on costs and policy
learn lessons from those countries that have constraints by Arup. Below is a table that
more experience of deploying wind than the shows a variety of estimates of the capacity
UK. Spain is perhaps one of the most useful of wind on the GB system in 2020 and 2030.
comparators, given that it has a grid system
of a similar size and level of interconnection Although there is a wide range covered in
to the GB grid system but it also has a very the above scenarios, both in the totals and
different mix of generation that must be the split between onshore and offshore, the
taken into account. central estimates show a reasonable level of
agreement. For the purposes of this report,
The UK has, by most measures, an assumptions have been made on how much
above average amount of installed wind wind capacity can be expected in 2020 and
capacity – more than most but still some 2030 as well as the proportion of electrical
way behind such countries as Denmark, demand that will be met by wind energy.
Germany, Spain and Ireland. The UK has These will only be indicative figures but will
the largest amount of installed offshore be used as representative figures to assess
wind capacity in the world. the impact on the system at those two points
in time.
2020 2030
onshore offshore total onshore offshore total
National Grid 20 Slow progression 7.5 10.1 17.6 20.8 13.6 34.4
Gone green 12.1 14.2 26.3 36.0 21.0 57.0
Government 21 Low 10 10 20
Central 13 18 31
High 19 16 35
Arup 22 Low 9.8 14.1 23.9 14.6 35.3 49.9
Central 10.9 17.6 28.5 17.3 41.3 58.6
High 14.1 22.3 36.4 23.6 51.7 75.3
Table 2.2 Estimates of RAEng GtF 23 13.5 9 22.5 18.5 19 37.5
future installed wind
Poyry 24 High 15 13 28 21 38 57
capacity in GW
20 Royal Academy of EngineeringCapacity of wind in the UK
BY THE EARLY PART 2.5.1. Expected capacity in 2020 For example, if the uptake of electric vehicles
(EVs) increases significantly, this would have
OF THE 2020s, THE Considering first the outlook for 2020, the a considerable effect on electrical demand
various estimates range between 17GW
UK IS LIKELY TO and 36GW, averaging at around 26GW. This
as every million new EVs would add around
70TWh per year to demand. However, this
HAVE BOTH LEVELS would require an additional 16GW of capacity
to be added in around seven years. If split
is likely to be much more of a factor in 2030
than in 2020. Assuming, therefore, that
OF CAPACITY AND roughly equally between on- and offshore demand stays broadly the same up to 2020,
CONTRIBUTION TO wind, this would equate to something in the
order of an extra 1GW of both being installed
26GW of wind capacity would account for
approximately 20% of electricity. (Assuming
ELECTRICAL DEMAND each year – similar to what was installed in load factors of 27% for onshore wind and
OF UP TO THREE 2012. This is still somewhat higher than the
20GW given in the UKWED for current, under
35% for offshore wind, amount of embedded
wind capacity broadly unchanged at 3GW and
TIMES HIGHER THAN construction and consented wind capacity. system losses of 8%.)
PRESENT
Completion times for the consented projects
Much obviously depends on levels of
are difficult to determine precisely, especially
investment, which are linked closely to
for the larger offshore developments, but it
government support mechanisms and the
could be expected that if consented projects
development of manufacturing and supply
go ahead, they should be completed by 2020.
chain capabilities. It is highly possible that
It is also possible that additional projects not
wind capacity is built more quickly or slowly
currently listed on the UKWED are completed
than we assume but the above figures
by 2020. The Academy’s own 2010 report 25
suggest that, by the early part of the 2020s,
gave an estimate of 22.5GW, but installation
the UK is likely to have both levels of capacity
rates since then have already been shown
and contribution to electrical demand of up to
to be higher than expected, so it is possible
three times higher than present. This would
that this figure was a little low. So, overall, the
be similar to levels currently seen in countries
estimate of 26GW of installed wind capacity,
such as Denmark, Spain and Ireland.
split equally between onshore and offshore
would appear to be a reasonable, if optimistic, For the purposes of this report, by 2020,
estimate for 2020. the UK is expected to have 26GW of
wind capacity meeting 20% of electrical
When considering the technical issues of
demand.
integrating certain levels of wind into the
GB system, this figure has been used to give
some indication of when certain milestones 2.5.2. Expected capacity in 2030
can be expected to be reached and to stress
test the system. The various estimates noted Looking further out to 2030, the estimates
above show that there is a high degree of become much less certain but, again for the
uncertainty concerning exact deployment purposes of this report, it is helpful to have
rates and 26GW is simply an average to be a representative estimate for the level of
used for illustrative purposes. It is possible deployment that might be expected by that
that this level will not be reached in 2020 but date. Considering the estimates given in
it is likely that it will be reached sometime Table 2.2 and current deployment rates, it is
close to that date and that the technical possible that there could be around 50GW
issues relating to it will be similar. or more of wind capacity, albeit with a wide
margin of error. The percentage of electrical
In terms of levels of penetration, the National demand that 50GW of wind capacity would
Grid Gone Green scenario, estimates electrical represent is much more difficult to estimate
demand in 2020 to be broadly the same in any meaningful way. The demand profile of
as now at around 320TWh. This estimate the system could have changed dramatically
is subject to a number of uncertainties, by then, with the deployment of EVs and
particularly economic growth forecasts and electrified heat. This could significantly
changes in the heat and transport sectors. change both the average and peak demands
Wind energy 21You can also read