Generation Adequacy Report - on the electricity supply-demand balance in France - 2005 EDITION
←
→
Page content transcription
If your browser does not render page correctly, please read the page content below
Generation
                                                  Adequacy Report
                                                  on the electricity supply-demand
                                                  balance in France

Tour Initiale - 1, Terrasse Bellini - TSA 41000
92919 Paris La Défense cedex
                                                                        2005 EDITION
Tél : +33 (1).41.02.10.00

www.rte-france.com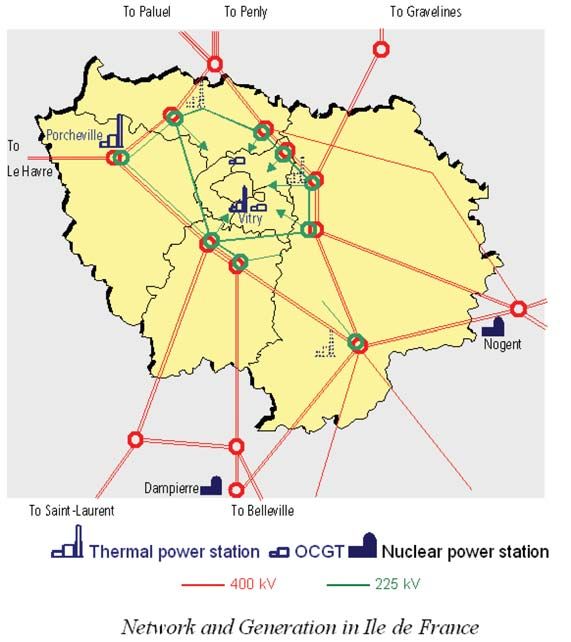
2005 EDITION
GENERATION ADEQUACY REPORT
ON THE ELECTRICITY SUPPLY-DEMAND BALANCE IN FRANCE
                                                                                                     CONTENTS

  Synopsis                                                   3    3      Exchange hypotheses                                 26
                                                                      3.1. Interconnections with neighbouring systems        26
  Introduction                                               4        3.2. Energy exchanges                                  26
                                                                      3.3. Exchanges and security of supply in the
                                                                      French system                                          28

  PART ONE:
                                                                         Generation adequacy
  OVERALL SUPPLY–DEMAND                                           4      measurement                                         30
  BALANCE IN MAINLAND FRANCE                                 5
                                                                      4.1.   Adequacy criterion                              30
                                                                      4.2.   Associated shortfall outlook                    30
                                                                      4.3.   Risk perception                                 31
    1       Consumption forecasts                            5        4.4.   Link with the markets                           32

        1.1. Recent trends                                    5
        1.2. Energy forecasts                                 8
                                                                         Generation adequacy in the
               1.2.1. Methodology                             8   5      coming years                                        33
               1.2.2. Three scenarios                         9
               1.2.3. Annual energy forecasts                11
                                                                      5.1. Methodology                                       33
               1.2.4. Generation Adequacy Report
                                                                             5.1.1. LOLE calculation                         33
               consumption forecasts in relation to…         11
                                                                             5.1.2. Identifying capacity needs               33
        1.3. Power level forecasts                           13
                                                                             5.1.3. Soundness of proposed capacity
               1.3.1. Power demand                           13
                                                                             expansion regarding major uncertainties         33
               1.3.2. Load management                        14
                                                                             5.1.4. Energy balance sheets                    34
                                                                      5.2. Medium term–up to 2010                            34
                                                                             5.2.1. Capacity needs                           34
    2       Generation facilities outlook                    15              5.2.2. Energy balance sheets                    36
                                                                      5.3. Long term – 2010 to 2016                          37
        2.1. Overview of existing generation facilities      15
                                                                             5.3.1. Capacity needs                           37
        2.2. Nuclear thermal generation                      15
                                                                             5.3.2. Energy balance sheets                    39
                2.2.1. Existing facilities                   15
                2.2.2. Future developments                   16
        2.3. Centralised conventional thermal generation
                2.3.1. Existing facilities
                                                             17
                                                             17
                                                                  6      Conclusion                                          40
                2.3.2. Environmental regulations             18
                2.3.3. Prospects                             19   PART TWO:
        2.4. Decentralised thermal generation                20   REGIONAL SUPPLY–DEMAND
                2.4.1. Overview                              20   BALANCES                                                   41
                2.4.2. Combined Heat and Power facilities    20
                2.4.3. Thermal plants running on Renewable
                                                                         The Provence Alps Côte d’Azur
                Energy Sources
        2.5. Hydraulic generation
                                                             21
                                                             21
                                                                  1      (PACA) region                 42
                2.5.1. Existing facilities                   21
                2.5.2. Regulatory context                    22       1.1. Background                                        42
        2.6. Wind power                                      22              1.1.1. Demand                                   42
        2.7. Three prospective scenarios                     23              1.1.2. Generation                               43
                2.7.1. Common assumptions for thermal                        1.1.3. Transmission network                     44
                generation                                   23       1.2. Security of supply                                45
                2.7.2. Three different scenarios for RES                     1.2.1. In the eastern part of the PACA region   45
                development                                  23              1.2.2. Tavel–Realtor congestion                 47
                2.7.3. Supply side scenarios recap           25       1.3. Conclusion                                        48   >

                                                                                                                              1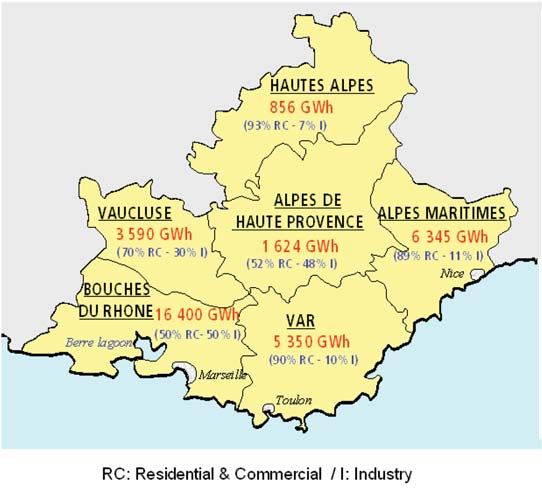
GENERATION ADEQUACY REPORT
ON THE ELECTRICITY SUPPLY-DEMAND BALANCE IN FRANCE

      2       Western France                                 49   APPENDICES                    62
          2.1. Background                                    49
                 2.1.1. Demand                               49    A1   Wind generation         62
                 2.1.2. Generation                           49
                 2.1.3. Transmission System                  50
          2.2. Security of supply                            51
                 2.2.1. Voltage control
                 2.2.2. Line capacity in Southern Brittany
                                                             51
                                                             51
                                                                  A2    Observed exchanges      66
                 2.2.3. Line capacity in Northern Brittany   52
                 2.2.4. Line capacity in Vendée              53
                                                                        Supply-Demand balance
                                                                  A3    simulations             70
      3       Ile de France region                           54
          3.1. Background                                    54
                 3.1.1. Consumption                          54
                 3.1.2. Generation                           54
                 3.1.3. Transmission system                  55
          3.2. Security of supply                            55
                 3.2.1. Active power restrictions            55
                 3.2.2. Voltage control                      55
          3.3. Conclusion                                    55

     PART THREE: INSULAR SYSTEMS                             56

      1       Corsica                                        56

          1.1. Demand                                        56
          1.2. Supply                                        57
          1.2.1. Thermal generation                          57
                  1.2.2. Hydro-electric generation           57
                  1.2.3. Other renewable generation          57
                  1.2.4. Links with other countries          57
          1.3. Requirements                                  58

      2       French overseas
              départements and Mayotte                       58
          2.1. Demand                                        58
          2.2. Supply                                        59
                 2.2.1. Installed capacity in 2005           59
                 2.2.2. Development prospects                60
          2.3. Requirements                                  61

 2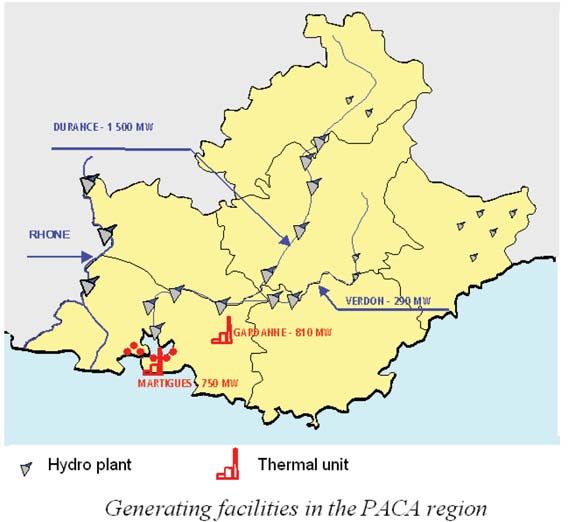
2005 EDITION

Synopsis

U
           nder the terms of the Law of 10th              consumption with renewable energy by 2013, sees
           February 2000, RTE is required to draw up      wind generation expand by 14,000 MW. Under the
           a multi-annual Generation Adequacy             median scenario, the figure of 4,000 MW of wind
Report on the electricity supply-demand balance in        generating capacity by 2010 seems to reflect estima-
France. The present 2005 edition has been compiled        tes deemed realistic by players in the sector.
in close conjunction with the working group in            According to consumption growth and RES develop-
charge of PPI (Programmation Pluriannuelle des            ment hypotheses adopted there will be a need for
Investissements de production électrique, or Long-        additional capacities between 2008 and 2010.
term Investment Programmes) at the French                 When reference scenario ”R2” is combined with the
Directorate for Energy Demand and Markets,                ”Low RES” hypothesis, some 1,200 MW of new
DIDEME. The purpose of RTE's Generation Adequacy          capacities are needed by 2010. Under the high
Report is to quantify the additional electric genera-     demand scenario ”R1”, 1,500 MW of additional
ting facilities that need to be commissioned in the       capacity is needed by summer 2008 if the necessary
years ahead. It is based on various scenarios for the     level of security of supply is to be maintained throu-
development of supply and demand, adopted on 1st          ghout that winter. Under the same scenario, even
January 2005, and covers the period 2006–2016.            taking account of the potential 4,000 MW supplied
Three different consumption forecast scenarios have       by wind farms, the capacity needed would be 1,700
been used. All include a substantial drop in consump-     MW by 2010.
tion by the Eurodif plant between 2010 and 2015.          All of the simulations carried out for the period 2010-
The two upper scenarios (called R1 and R2) fall within    2016 show that the electric system is entering a new
current trends, with annual growth of 1.7% and            period in its development, in which regular invest-
1.5% until 2010 and a slowing down thereafter; they       ment in generating facilities is needed to maintain the
can be considered as equally likely to occur in the       security of supply. Beyond 2010, a further 1,000 MW
short-term. The low consumption growth scenario           of new capacity will be required each year, if demand
(R3) is intended to depict a context of environmental     side management initiatives are not put into practice.
commitments. It is based on the assumption that           In all cases, the generating installations that need to
demand side management initiatives will have an           be developed must be a combination of peak facili-
immediate impact, which makes it rather unlikely in       ties (such as combustion turbines) and mid merit faci-
the short-term. Under the reference scenario (R2),        lities (such as combined cycle gas turbines or CCGTs).
French    domestic     consumption,      which    was     The requirements estimated above are based on a
468.5 TWh in 2004, reaches 508 TWh by 2010 and            specific criterion, according to which the risk of a
552 TWh by 2020. Consumption at peak time in win-         shortfall in the electricity supply, referred to as the
ter increases by around 1,000 MW per year.                Loss of Load Expectation or LOLE, must not exceed
Up until 2016, France's fleet of generating facilities    three hours per year on average–consistent with one
will be determined by a number of changes: the re-        shortfall every ten years. This criterion is part of a pro-
commissioning of three of EDF's fuel-oil-fired units ,
                                                     1
                                                          babilistic approach, and meeting it does not necessa-         (1) It was
                                                                                                                        announced in
the expected arrival of the EPR in 2012, and the defi-    rily guarantee that there will be no power cuts in the
                                                                                                                        May 2005 that a
nitive shutdown by 2015 of coal-fired plants that do      event of an unusually cold spell of weather. Although         fourth unit would
                                                                                                                        also be re-
not meet the requirements imposed by environmen-          the LOLE limit has not yet been exceeded, difficult
                                                                                                                        commissioned,
tal regulations. In the field of renewable energy sour-   situations have already been encountered in the               but this has not
                                                                                                                        been taken into
ces (RES), three different scenarios are considered.      recent past.
                                                                                                                        account in the
The main difference between them is the way wind          Lastly, the Generation Adequacy Report details speci-         present report.

generating facilities develop. Under the ”Low RES”        fically what new generating capacities are required to
hypothesis it grows by 1,500 MW. Meanwhile, the           strengthen the security of supply to the Provence
”High    RES”    scenario,    which    includes    the    Alps Côte d’Azur (PACA) and Brittany regions, as well
Government's target of covering 21% of domestic           as in insular systems.                                   ■
                                                                                                                                            3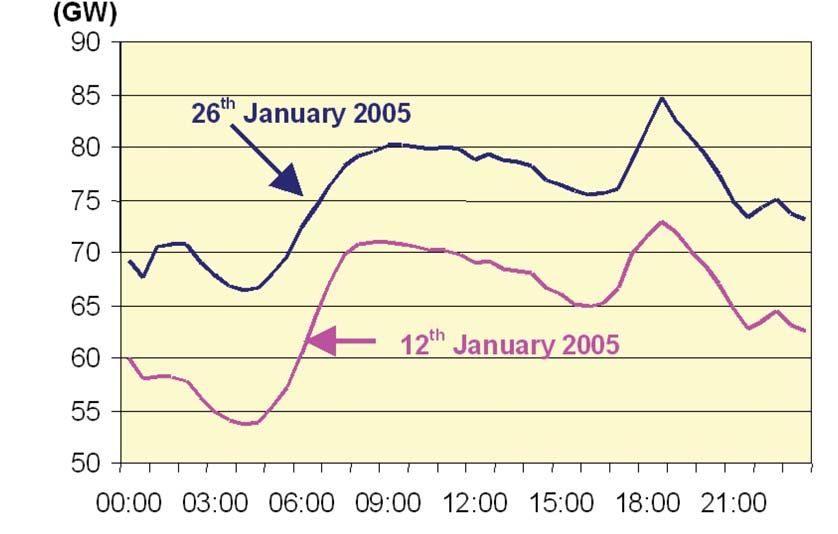
GENERATION ADEQUACY REPORT
ON THE ELECTRICITY SUPPLY-DEMAND BALANCE IN FRANCE
Introduction
Purpose of the Generation reby leading to some customers being cut off.
Adequacy Report Security of supply can be measured by the risk of
such ”shortfall situations” arising. A quantitative
Under the terms of Article 6 of the Law of 10th criterion can be set out to define an acceptable
February 2000 concerning the modernisation and level of risk. The amount of new generation facili-
development of public service electricity, the trans- ties must comply with this criterion.
mission system operator is required to draw up a Chapters one to three respectively describe hypo-
multi-annual Generation Adequacy Report, no less theses for consumption, known developments in
than once every two years and subject to the scru- generation facilities and exchanges. The choice of
tiny of the State. the adequacy criterion and what it physically means
The purpose of the Generation Adequacy Report is is discussed in chapter four. Chapter five includes
to evaluate the amount of new generation facilities an estimate of the new facilities that need to be
that must be commissioned in the future in order to commissioned, in addition to those that have
maintain security of supply for all French territories. already been decided upon.
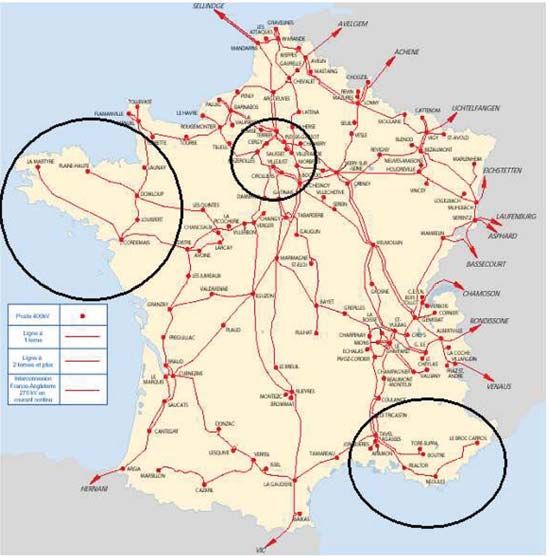
The information it contains is used by the Ministry ◗ specific situations of some importing areas inside
(2) At the for Energy to make final decisions on investment
2
France:
Ministry of
planning control through the PPI (standing for Whereas the overall supply–demand balance focu-
Industry, the
department Programmation Pluriannuelle des Investissements, ses on consumption and generation, security of
responsible for
or Long-term Investment Programme). The PPI has supply may also be affected by transmission net-
energy-related
issues is the been enforced by the above cited law, and is aimed work limitations. Three areas merit special atten-
“Direction
at specifying the fuel mix of generating facilities tion, since they import energy: the PACA (Provence-
Générale de
l’Energie et des with respect to French energy policy targets. Alps-Côte d’Azur) region, Western France, and Ile
Matières
Two reports were completed by RTE, in 2001 and de France, the region around Paris.
Premières”
(DGEMP – General 2003 respectively. This third report was carried out ◗ the supply-demand balance of insular systems:
Directorate for
in the first semester 2005, in close conjunction with the island of Corsica and some other French over-
Energy and Raw
Materials), to the working group in charge of preparing a PPI seas territories have their own insular electric sys-
which is affiliated
report for Parliament. It covers the period from tems. Generation Adequacy in each of them is
the “Direction de
la Demande et 2005 through 2016. assessed by their operators: Electricité de Mayotte,
des Marchés
for Mayotte Island, and EDF–Systèmes Electriques
Energétiques”
(DIDEME – Methodology and contents Insulaires, for all the others.
Directorate for
Energy Demand
and Markets) This report is broken down into three parts, dealing Warnings about confidentiality
with: requirements
◗ the overall supply–demand balance in mainland
France: For the purposes of drafting this Generation
Assessing generation adequacy typically involves Adequacy Report, RTE has used information sup-
forecasting domestic electricity consumption and plied directly by players involved in the French elec-
exchanges between France and neighbouring tric system.
countries, and comparing them with known deve-
lopments in generation facilities. Due to the fact that this information should remain
Since electricity cannot be stored, and both confidential, the presentation of certain hypotheses
demand and supply are subject to random varia- and results has been restricted. Some detailed
tions, under adverse circumstances available gene- elements have therefore been omitted, or figures
ration may not be able fully to satisfy demand, the- aggregated. ■
4
2005 EDITION

PART ONE:OVERALL SUPPLY–DEMAND
BALANCE IN MAINLAND FRANCE

     1         Consumption forecasts
All the data presented in this chapter refer to    1.1    Recent trends
gross domestic consumption. They include
transmission and distribution losses, but do               nnual energy consumption levels and
not include consumption by auxiliaries in
power stations, or consumption by pumps in
pumped storage facilities.
                                                  A        maximum loads recorded over recent
                                                           years are listed in the table below:

                                 2001             2002            2003             2004

Gross Consumption (TWh)          448.7            449.9           466.8            477.3
Maximum load (GW)                79.6             79.5             83.1             80.1
                           (December 17th) (December 10th) (January 9th) (December 22nd)

As regards maximum loads, a new record of         price signal: within the price schedules EJP
86.0 GW was reached on 28th February              (standing for Effacement en Jour de Pointe:
2005.                                             peak day load shedding) or Tempo, prices
These raw data do not show the actual             are set at a very high level for 22 periods of
underlying consumption trends. The high           18 hours each year from 1st November
degree of volatility which can be observed,       through 31st March, and much lower at
especially in the case of maximum loads,          other times. Peak days are decided by the
can be ascribed to two main factors:              supplier, with just one day’s notice to consu-
◗ High sensitivity to climatic conditions in      mers. These price schedules are now availa-
winter, mainly due to widespread use of           ble exclusively to non-eligible consumers
electric heating:                                 (mainly in the Residential sector). In 2005,
Demand for electricity rises by approxima-        power demand can be reduced by 3,000
tely 1,500 MW for every 1°C drop in the           MW by activating the EJP signal.
outside temperature. Annual consumption           Eligible consumers entered into new
may vary by as much as a dozen TWh, bet-          contracts with their suppliers by the turn of
ween very cold and very mild winters.             2000. Although EJP type provisions were
◗ Load management:                                not continued in these new contracts,
In order to mitigate power peak excursions        power demand reduction is still possible
on extreme cold spells, load management           from some consumers, at the request of the
has long been a feature of the French elec-       supplier. The maximum reduction that can
trical landscape. The first means that appea-     be achieved in this way is estimated at
red, and still the most important in respect      1,500 MW, as experienced on 28th
of power demand reduction, relies on a            February 2005.                                   >

                                                                                                                5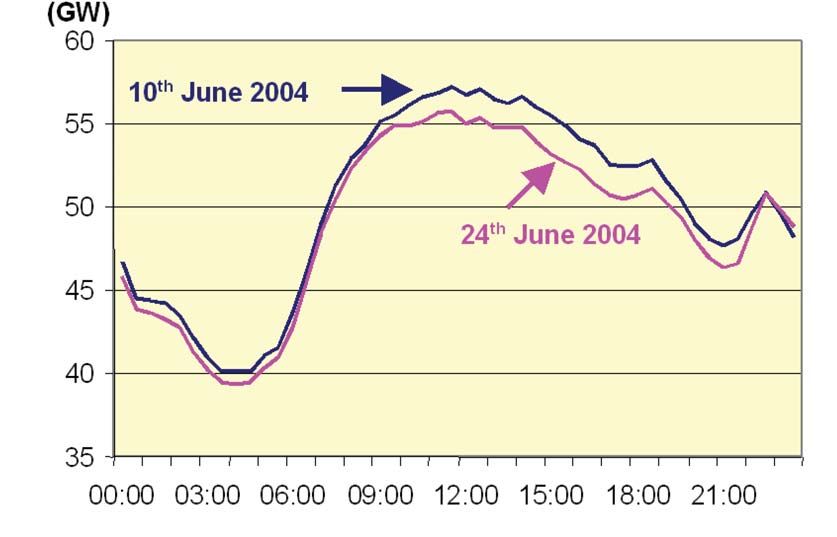
GENERATION ADEQUACY REPORT
ON THE ELECTRICITY SUPPLY-DEMAND BALANCE IN FRANCE

>                               Dependence on these two parameters can           value; however, it was not the coldest day
                      1         clearly be seen on daily load curves3.           of last winter (-3.0°C recorded on 28th
                                Load curves on Wednesday 12th and 26th of        February);
                 Consumption
                    forecasts

                                January 2005 are plotted on the next chart.      ◗ +7.4°C on 12th, which was not unusually
                                The same week days, just two weeks apart,        mild: the temperature rose to or above that
                                should exhibit similar consumption patterns      level nine days on average during each month
                                over the day. The difference observed is         of January alone over the last ten winters;
                                mainly due to outside temperatures4:             ◗ load shedding was not necessary on 12th.
                                ◗ -1.2°C on 26th, which can be considered as     EJP was activated on 26th, reducing demand
                                a cold day: during four out of the past ten      by up to 3 GW from 7 a.m. onwards.
  (3) Daily load curves at
                                winters, the temperature never fell below that
   half-hourly points from
         1996 onwards are
    available on RTE’s web
site: www.rte-france.com.
                                                              Load curves on winter days
   (4) All temperatures in
       this section refer to
     average daily values
             recorded in 26
  meteorological stations
       located throughout
France, weighted to take
        account of climate-
        sensitive electricity
              consumption.

  6
2005 EDITION

Climate sensitivity is now well established in     Nonetheless, the statistical dispersion of
summer too, increasing year on year with the       power demand in summer remains well
rising use of air conditioning equipment.          behind that seen in winter. Not only do loads
                                                   vary less for each degree of temperature, but
Unlike in winter, when temperature sensiti-        the range of temperatures experienced is
vity is fairly even throughout the day, sensiti-   narrower: a +5 °C deviation from the daily
vity in summer is higher in the afternoon,         average in summer is almost as uncommon
when it is close to 500 MW/°C, than at night       as a –8 °C deviation from the daily average
or early morning.                                  in winter.

                              Load curves on summer days

Bearing in mind these considerations, a sound      The chosen reference, called “normal tempe-
assessment of consumption trends needs to          rature”, is the expected outside temperature
adjust raw data to take account of the             for each day of the year5.                      (5) Due to climate
                                                                                                   change, a new “normal
influence of the weather and load manage-
                                                                                                   temperature” time series
ment. To do this, an outside temperature refe-     Once adjusted to take account of the            for the coming years
                                                                                                   was fixed in October
rence has to be set. The hourly power demand       weather    and     load    management,
                                                                                                   2003.
actually measured (including the power reduc-      consumption figures showed annual
tion achieved by activating any load manage-       growth of 1.6% to 1.7% in 2003 and 2004
ment schemes) is converted into what it would      ◗ equivalent to an increase of 7 to 8 TWh
have been under this reference temperature.        per year.

                                                                                                   >

                                                                                                                       7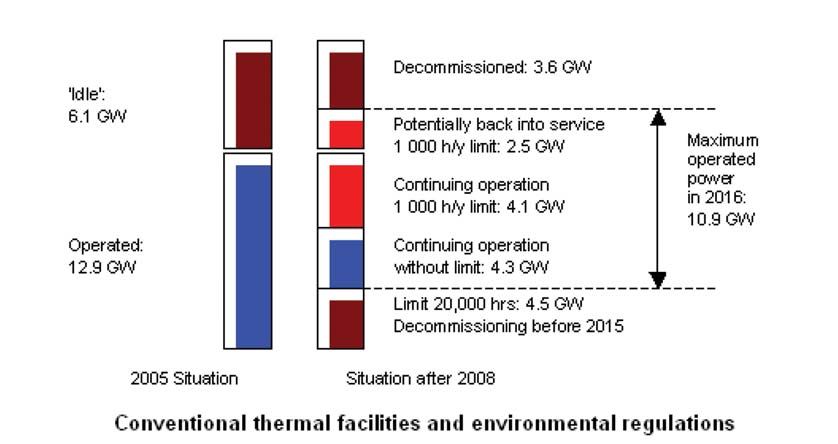
GENERATION ADEQUACY REPORT
ON THE ELECTRICITY SUPPLY-DEMAND BALANCE IN FRANCE

>                      As will be seen in the next section, the consump-    end-use sectors, adjusted for weather and load
             1         tion forecast process relies on detailed kno-        management and taking account of the leap
                       wledge of end-use consumption. The following         year effect (for 2004):
        Consumption
           forecasts

                       table provides consumption data for the main

                        (TWh)                                 2001           2002               2003              2004

                        Adjusted domestic
                        consumption                          444.4           453.6             461.0             468.5
                        Industry                              136.0          135.7             134.5             137.6
                        Commercial                            108.6          112.6             114.1             115.4
                        Residential                           131.1          135.0             138.5             141.3
                        Energy (including Eurodif)             30.0           30.2              33.3              33.8
                        Transport                              9.1            9.2               9.0               9.1
                        Losses                                 29.6           30.9              31.6              31.4

                       1.2 Energy forecasts                                 technological advances, at a pace which may
                       1.2.1. Methodology                                   vary according to energy prices and energy/
                                                                            environmental regulations.
                                 lectricity consumption is driven by a      Forecasts on the key drivers are drawn up in

                       E         wide range of factors: economic acti-
                                 vity, demography, user behaviour,
                       technological advances, market sharing of
                                                                            such a manner that they are consistent with
                                                                            macroeconomic (namely GDP) and demogra-
                                                                            phic (total population, employed workforce,
                       energy sources, etc.                                 number of households) indicators. They include
                       To take account of these various factors, RTE’s      end-use energy switching from or to electricity.
                       long term forecasts are based on a detailed          Total domestic consumption forecasts take the
                       breakdown of consumption:                            form of the sum of each sub-sector or end-use
                       ◗ to begin with, total consumption is divided into   consumption forecast.
                       industry, residential and commercial sectors;        Uncertainties are attached to all these factors.
                       ◗ within these sectors, further divisions are        In order to obtain a plausible range for future
                       made into different sub-sectors of activity (iron    electricity consumption, three possible scena-
                       and steel, chemical, etc.) and electricity end-      rios are outlined for social and political deve-
                       uses (heating, lighting, engines, etc.);             lopments, leading to three sets of parameters
                       ◗ for each sub-sector or end-use, one key dri-       for sub-sectors and end-uses, and then three
                       ver is identified (usually industrial output for     electricity consumption scenarios.
                       industry sub-sectors, number and category of
                       houses for residential end-uses, floor area or       Common underlying background:
                       employed workforce for commercial end-uses,          All forecasts are drawn up on the basis of:
                       etc.). Consumption in each sub-sector or for         ◗ a steady 2.3% annual growth in GDP through
                       each end-use is estimated as the product of this     to 2020,
                       key driver and an energy intensity value (e.g.       ◗ a rise in the population to 62.7 million people
                       the number of kWh used to produce one ton            by 2020,
                       of steel, or to heat one house, etc.).               ◗ an employed workforce of 28.5 million people
                       The current energy intensity values are derived      in 2020 (leading to a 4% unemployment rate),
                       from known current consumption and driver            ◗ a rise in the number of households to 28.1
                       values. Their expected future values include         million in 2020,

8
2005 EDITION

◗ stability in relative end-users prices for gas and   One particular sector: the energy sector
electricity, thereby leading to little change in       Within the energy sector, one particular
market shares in end-uses where both can               consumer merits special attention, namely
compete.                                               the uranium enrichment plant operated by
                                                       Eurodif, which is by far the largest one in
The decisive drivers:                                  France. Eurodif has announced that the cur-
◗ Industry: Although industrial output growth          rently operated plant based on gaseous diffu-
is set at the same 1.3% per year rate for the          sion will be decommissioned around 2012,
three scenarios, sub-sector growth rates differ        and replaced by a new one using centrifuge
from one to another, as do energy efficiency           technology. Switching to this process will lead
improvements.                                          to a steep decline in energy consumption,
The possible relocation outside France of some         worth approximately three years of consump-
large energy consuming industries is not taken         tion growth in all other sectors.
into account.
◗ Commercial sector: There are different sce-          1.2.2. Three scenarios
narios depending on the development of energy
regulation for buildings and their impact on hea-      As in previous “Generation Adequacy”
ting requirements and air conditioning develop-        reports, three consumption scenarios have
ment.                                                  been drawn up. They differ from each other
◗ Residential sector: The main differences             in terms of social, economical, and political
arise in the structure of new housing (individual      factors.
houses vs. apartment buildings), evolution of
energy regulations for buildings and their             ”Reference” scenario R2
impact on heating requirements, air conditio-          In broad terms, scenario R2 assumes that the
ning development, domestic appliances                  behaviour of the Government and economic
consumption.                                           and social players will not undergo any dras-
                                                       tic change.
Demand Side Management (DSM):                          The Government remains deeply involved in
The effects of actions taken to curb demand,           energy and environment matters – as has
which are already contributing to the observed         been highlighted in the POPE Law (standing
drop in growth rates, are expressly taken into         for: “loi Programme fixant les Orientations
account in energy forecasts. They are described        de Politique Energétique” – the law enacting
differently depending on the scenario used.            French Energy Policy) dated 13th July 2005.
In the industrial sector, DSM actions are often        Energy regulations are set to be reinforced,
undertaken spontaneously if economic profita-          notably for buildings, moving a step further
bility is achieved rapidly. Use of efficient proces-   every five years. Regulatory requirements are
ses (such as variable speed engines) as well as        assumed to be properly implemented.
improvements in specific processes will occur          For each sub-sector and end-use, the most
under any scenario.                                    likely outcome, according to past trends and
In the residential and commercial sectors,             on-going technological advances, is assumed
demand is curbed largely due to regulatory             for energy intensity improvement.
measures, involving electrical appliances label-       Scenario R2 will be taken as the reference
ling (based on energy efficiency), and energy          scenario for the “Generation Adequacy
regulations for buildings.                             Report”.
                                                                                                         >

                                                                                                                      9
GENERATION ADEQUACY REPORT
ON THE ELECTRICITY SUPPLY-DEMAND BALANCE IN FRANCE
> “Market oriented” scenario R1 ring of regulatory measures will lead to a
1 Under scenario R1, the Government is assu- mere 15% drop in unitary heating require-
med to play a less far-reaching role in the ments between 2002 and 2020, instead of a
Consumption
forecasts
development of the national economy and in 20% drop under scenario R2.
the fields of energy and the environment.
Decisions regarding energy end-use are made “Environmentally concerned” scenario R3
in a market oriented way, sometimes detri- Conversely, under scenario R3, the
mental to environmental issues. Government pays greater attention to envi-
As an example, it is assumed that 72% of ronment related issues, and intervenes hea-
new lodgings to be built through 2020 will vily in the quest for improved energy
be individual houses, which are more energy efficiency.
consuming, rather than 60% under scenario Energy conservation schemes are actively pro-
R2. At the same time, less stringent monito- moted, for electricity as well as for fossil fuels.
102005 EDITION
1.2.3. Annual energy forecasts
The annual energy forecasts for scenarios R1, R2 and R3 are provided in the following table. Figures
refer to energy demand expected under “normal” weather conditions, without application of any
load management scheme.
Annual energy consumption forecasts (TWh)
2002 2003 2004 2010 2015 2020 AAGR* AAGR*
2002-2010 2010-2020
R1 515 534 569 1.7% 1.3%
R2 453.6 461.0 468.5 508 522 552 1.5% 1.1%
R3 494 499 518 1.2% 0.7%
* AAGR: Average Annual Growth Rate – not including Eurodif consumption
1.2.4. Generation Adequacy Report-consumption forecasts in relation to…
… historical trends:
The rise in average annual consumption reached 10 TWh per year in the 1980s (not including
Eurodif consumption). Since the beginning of the 1990s, the pace has slowed down to 7 to 8
TWh per year.
Domestic consumption trend since 1950
Under scenario R1, the same pace is maintained through 2010. It is only slightly lower under scena-
rio R2. At the opposite end of the scale, scenario R3 exhibits a sudden drop to less than 5 TWh per
year in the coming years.
>
11GENERATION ADEQUACY REPORT
ON THE ELECTRICITY SUPPLY-DEMAND BALANCE IN FRANCE
> … economic growth:
1 Continuing the trend highlighted in the recent past years, consumption growth is slower than GDP
growth in all three scenarios.
Consumption
forecasts
Consumption vs. economic growth
… Government forecasts:
(6) “Direction Générale
de l’Energie et des In June 2004, the DGEMP6 published a business-as-usual scenario projecting energy supply and use
Matières Premières” until 2030 (“Scenario Tendanciel à l’horizon 2030”, available on the web site www.industrie.gouv.fr).
(General Directorate for
Energy and Raw This scenario only takes account of policies which have already been put in place, or those that are
Materials) at the expected with certainty. As such, it is not intended to be predictive, but rather to stand as a bench-
Ministry of Industry.
mark in evaluating new policies.
Comparison with DGEMP’s forecast
Forecasts for electricity consumption in 2010 are the same under the “Scenario tendanciel” and sce-
nario R1 of the “Generation Adequacy Report”. Beyond that timeframe, the DGEMP’s forecasts,
considering no further moves towards improved energy efficiency, are higher.
122005 EDITION
The impact of DSM measures under each scenario has been evaluated against 2020 annual consumption:
Estimates of consumption savings arising from DSM by 2020 (TWh)
TWh R1 R2 R3
Resid. Comm. Ind. Resid. Comm. Ind. Resid. Comm. Ind.
Buildings
regulation 6 2 - 6 2 - 11 3 -
Technological
9 - - 12 2.5 2.5 16 10 8
advances
Production
- - - - - - - - 7
output
TOTAL 17 25 55
… previous “Generation Adequacy Report” forecasts:
Any comparison with the forecasts contained in the 2003 “Generation Adequacy Report” publication
is difficult due to the changing outside reference temperature. Once the previous forecasts are trans-
lated into the current temperature reference, 2010 figures for scenarios R1 and R2 appear about
4 TWh higher than expected in the previous Report. This upward revision is mainly due to the growth
observed between 2002 and 2004.
1.3 Power level forecasts casts are drawn up on the basis of typical load
curves for each sector, which convert annual
1.3.1. Power demand energy forecasts for that sector into power for
every time slot throughout the year; then, for
ore than annual energy consump- each time slot, total power demand is obtained
M tion, the main challenge when
attempting to ensure the security
of supply is in matching power demand during
by summing up all the sectors.
For reference scenario R2, the resulting power
winter cold spells. Power consumption fore- levels at peak time are given in the table below:
Forecasts for peak power load (Scenario R2)
(GW) 2002/03 2003/04 2009/10 2015/16 2019/20
Normal temperature peak 76.6 77.6 84.0 88.5 92.3
1/10 chance peak 87.2 88.2 95.2 100.1 104.1
◗ Figures refer to half-hourly points and so are a 10% chance of being reached or exceeded at
consistent with data available on RTE’s website. some point during the winter, depending on
◗ The “normal temperature peak” corresponds cold spells. This value provides a more realistic
to the forecast (or climate and load manage- picture of the supply that needs to be develo-
ment-adjusted values, for 2003 and 2004) ped to meet it.
under “normal” climatic conditions at 7 p.m. ◗ None of these data take account of any reduc-
on a mid-January working day. tion arising from the activation of load manage-
◗ The “1/10 chance peak” is the level which has ment schemes. >
13GENERATION ADEQUACY REPORT
ON THE ELECTRICITY SUPPLY-DEMAND BALANCE IN FRANCE
> The forecasts drawn from scenarios R1 and R3 are grouped together in the following table:
1
Forecasts for peak power load (Scenarios R1 and R3)
Consumption
forecasts
(GW) 2003-2004 2009-2010 2015-2016
Peak at normal temperature 77.6 81.6 – 85.4 84.4 – 90.9
Peak reached one chance in ten 88.2 92.6 – 96.9 95.5 – 103
1.3.2. Load management On the other hand, part of the lost reduction
capability could be regained, through different
As previously mentioned, power demand may steps:
(7) Since differences currently be reduced by up to 4.5 GW by acti- ◗ commercial agreements between consumers
between forecast and
vating load management schemes (3 GW from and their suppliers: should electricity prices
actual volumes may arise
either on the generation non–eligible customers under EJP price sche- become very high at peak times, load reduc-
side (unit outage, etc.) or
dules, and a further 1.5 GW from eligible cus- tion (rather than building new peak facilities)
on the demand side, RTE
has to control some tomers). By the end of the 1990s, EJP activa- may prove economically efficient once again;
capacity in order to
tion was leading to reductions of more than 6 ◗ large consumers submitting “upward offers”
maintain the balance
between consumption GW. Subsequently, the first stage in the pro- on the Balancing Mechanism (BM)7; although
and generation. This
cess of opening the market up to competition possible, this step has not been used in prac-
capacity is procured from
the Balancing had the effect of reducing the effectiveness of tice until now;
Mechanism, where
load management schemes. ◗ direct agreement between a consumer and
generators can offer
upward/downward The gradual opening of the market to other RTE for load reduction at RTE's request, as
output variations from
consumers, which took place on 1st July 2004 mentioned in Article 4 of the Law dated 9th
their generating units,
and where consumers for professionals and is scheduled for 1st July August 2004.
may offer to reduce their
2007 for all others, might reduce the impact Considering all the uncertainties involved, a
consumption (equivalent
to an upward output of EJP still further. However, it remains to be prudent assumption has been made for this
variation from any
seen what kind of offers new suppliers can “Generation Adequacy Report”: demand
generating unit). More
detailed information on and will make to these customers, and how reduction capability will continue to fall, rea-
the French BM is
attractive they will be to existing EJP price ching 3 GW in 2010, and will stabilise the-
available on
www.rte-france.com schedule holders. reafter. ■
142005 EDITION
2 Generation facilities outlook
All generating capacity figures given in this section relate to net capacity, excluding consumption
by power stations auxiliaries. This ensures consistency with the demand figures provided in the
previous section.
2.1 Overview of existing least not at full rated power levels. The table
generation facilities below provides a breakdown of global figure
into four main types of generation, depending
s of 1st January 2005, the total instal- also on what grid facilities are connected to
A led capacity of generating facilities
sited in France stood at 116.7 GW.
However, for reasons that will be explained later,
(either the Public Transmission Grid, or distribu-
tion networks; it should be remembered that, in
France, the Public Transmission Grid covers all
some of these facilities cannot be operated, or at voltage levels higher than 45 kV):
Installed and operated capacity as of 1st January 2005 (GW)
Nuclear Conventional Wind Hydro Total
Thermal Thermal
Installed capacity 63.4 27.5 0.4 25.4 116.7
Of which: 63.4 24.0 e 24.0 111.4
Connected to
Transmission Grid 0 3.5 0.4 1.4 5.3
Operated capacity 63.3 21.1 0.4 25.4 110.2
The following sections will provide information on current status and projections for each type of
generation, with the ”Conventional Thermal” category broken down further into “centralised”
(mainly large plants) and “de-centralised” categories.
2.2 Nuclear thermal to 1,500 MW for the newest. Altogether they
generation provide a capacity of 63.13 GW.
2.2.1. Existing facilities The main question regarding these units relates
to the duration of their working lives. In France,
he majority of French nuclear genera- unlike in other countries, there has been no
T tion comes from 58 units, all based on
the same PWR (“Pressurised Water
Reactor”) technology. These units were com-
regulatory limit set on that duration: licences
are granted by the Nuclear Safety Authority
after each refuelling outage, once compliance
missioned between 1977 and 1999. Their with safety requirements is ascertained.
rated power varies from 900 MW for the oldest
>
15GENERATION ADEQUACY REPORT
ON THE ELECTRICITY SUPPLY-DEMAND BALANCE IN FRANCE
> Nuclear Power Units
2 Year of first connection
Generation
facilities outlook
Despite this uncertainty, the most common 2.2.2. Future developments
thinking is that they may be operated for at
least forty years. This thinking is supported by No existing nuclear units are expected to have
the current technical condition of the installa- their power ratings upgraded in the next few
tions, and the assumption that the tightening years.
of safety requirements which occurs every ten
years will be economically achievable. The building of a new EPR (European
Assuming the units have a working lifetime of Pressurised water Reactor) type nuclear unit
40 years (at least), decommissioning should not was announced in 2004. Rated 1,600 MW, it
start until the early 2020s. will be sited at Flamanville, and should be com-
missioned in 2012. This project has to be consi-
In addition to the PWR fleet, the FBR (Fast dered with the replacement of existing nuclear
Breeder Reactor) prototype Phenix, commissio- units in mind, and is intended to ensure that
ned in 1973, is still in operation. However, it is tried and tested EPR technology is available
now used as a laboratory for research and prior to 2020. As continued commitment to
development (in the field of transmutation of the nuclear option is a cornerstone of French
long-life radio nuclides) rather than as a gene- energy policy, highlighted in the POPE8 Law
(8) “loi Programme
rating facility. The maximum authorised output dated 13th July, completion of this project
fixant les Objectifs de
Politique Energetique”, for these experiments is 125 MW, less than its looks quite certain.
the Law enacting French
233 MW rated power. It will be decommissio-
energy policy
ned in 2008.
162005 EDITION
2.3 Centralised much lower. Indeed, as a response to the over-
conventional thermal capacity that built up in the late 1980s, several
generation fuel oil- and coal-fired units were taken out of
service. Some of them were decommissioned
2.3.1. Existing facilities immediately, but others have simply been kept
on stand-by, as a reserve which could be
entralised facilities are considered to brought back into operation if necessary. Since
C be those units, usually of large size and
connected to the Public Transmission
Grid, which are scheduled to maintain the
re-commissioning notice is longer than one
year, and none were engaged in this process on
January 1st 2005, these idle units cannot be
balance between electricity supply and demand operated in 2005. Their total capacity, which is
within the European electric system as a whole. still accounted for in “installed capacity”,
This category includes all coal- and fuel-oil-fired amounts to 6.1 GW.
units larger than 100 MW, Combined Cycle Gas
Turbines (CCGT) and Open Cycle Gas Turbines Most of the centralised conventional thermal
(OCGT - used as peaking facilities) along with a facilities are ageing. With the exception of 1.1
few dual fired (furnace gas/fuel-oil) units. GW of CCGT, which were just in the process of
being commissioned at the beginning of 2005,
According to this definition, installed centralised and some OCGT built during the 1990s, all the
conventional thermal capacity stood at 19.0 others are now more than twenty years old.
GW, as of 1st January 2005.
Operated capacity at that time was however
Conventional thermal units - Date of first connection
>
17GENERATION ADEQUACY REPORT
ON THE ELECTRICITY SUPPLY-DEMAND BALANCE IN FRANCE
2.3.2. Environmental regulations ◗ for fuel oil-fired facilities which will not
> 2 operate for more than 2,000 hours per year
The fate of ageing conventional thermal (which is the case for peak facilities), limits
Generation
facilities outlook
units depends greatly on environmental are not set on concentrations of pollutants in
regulations, which are becoming increasingly exhaust gases, but rather on the quantities
stringent. New emissions limits on air pollu- emitted each year: for a 600 MW rated unit,
tants (sulphur dioxide SO2 et nitrogenous caps are set at 735 t/year SO2 and 1,155
oxides NOx) are particularly important. The t/year NOx. In practice, these caps will reduce
limits are laid down in the Order dated 30th average annual generation by the facilities
July 2003, which transposes European concerned to under 1,000 hours per year,
Directives 2001/80/EC (known as the Large even if they use fuel-oil with lower sulphur
Combustion Plants directive - LCP) and content than at present.
2001/81/EC (National Emission Ceilings) into
French law. The total capacity of facilities operated in
2005 which are potentially concerned by the
The main purpose of this legislation is to bring first exception stands at 7.7 GW (from the
emission limits for existing plants (e.g.: com- total of 12.9 GW in operation, the following
missioned before 2002) into line with those are discounted: 1.1 GW of new CCGT which
permitted for new plants: 400 mg/Nm3 SO2, comply with new regulations, 3.3 GW of
400 mg/Nm3 NOx. Additional abatement fuel-oil fired units, which will opt for the
devices need to be installed in units built second exception, and 0.8 GW of OCGT
before 1985, to ensure that they comply with which are not concerned by this regulation).
the limits and to enable them to continue Operators made their decision in June 2004:
operating beyond 2008. However, some only 3.2 GW will be retrofitted to comply
exceptions are allowed for, of which two are with new limits; the remaining 4.5 GW will
of particular interest: be restricted to 20,000 hours of operation
◗ less stringent limits (1,800 mg/Nm3 SO2, from 1st January 2008 onwards.
900 mg/Nm3 NOx) may be imposed on coal- As regards “idle” units, in light of this envi-
fired units, providing they are operated for ronmental regulation, as well as the costs
no more than 20,000 hours starting from 1st incurred in rehabilitating units which have
January 2008 and are stopped no later than not been run for more than ten years, it is
31st December 2015. This opens up the pos- deemed that only four fuel-oil fired units, for
sibility of postponing the decommissioning a total amount of 2.5 GW, may be brought
of old facilities, for which abatement invest- back into operation as peak facilities (second
ments would not prove cost effective. exception).
182005 EDITION
Conventional thermal facilities and environmental regulations
The other main environmental concern relates to of information provided by operators, RTE has
Greenhouse Gas (GHG) emissions. European drawn up the following time schedule for plant
directive 2003/87/EC establishing a trading closure:
scheme for GHG emissions permits, came into ◗ 1,350 MW from 2005 through summer
force in 2005. The National Allocation Plan was 2009 (mainly units capped by the 20,000
drawn up by the French Government and appro- hours LCP credit, which will be stopped for
ved by the European Commission in 2004. It other reasons before this credit is exhausted9), (9) of which 480 MW
were permanently shut
may be consulted on the Ministry of Industry ◗ 1,000 MW from summer 2010 through
down during the first
website: www.industrie.gouv.fr. summer 2012 (units capped by the LCP credit, half of 2005.
which will be stopped for credit exhaustion),
CO2 emissions permits place new restrictions on ◗ 2,450 MW from summer 2013 through to
the operation of conventional thermal plants. the end of 2015 (including 2,100 MW of
However, they are not deemed to result in more coal-fired units capped by the LCP credit; it
stringent limits than those imposed by the Large should be noted that, to allow operation
Combustion Plants Directive. beyond 2013, annual average generation
duration between 2008 and 2013 may not
2.3.3. Prospects exceed 3,000 hours, which is rather less than
the generation times observed the last few
Centralised conventional thermal operated years).
capacity will develop as units are commissioned Decommissioning dates are very uncertain,
(or re-commissioned) and decommissioned. since operators are not required to give RTE
Decommissioning decisions will be influenced much notice of such decisions, and may even
greatly by environmental regulations, as discus- adapt their strategy depending on market
sed above. They may also be influenced by other developments. The indicative agenda given
considerations, with the effect that many units above is a plausible one, consistent with all
will be decommissioned earlier than would be known information to date, but it cannot be
strictly necessary under regulations. On the basis considered as certain.
>
19GENERATION ADEQUACY REPORT
ON THE ELECTRICITY SUPPLY-DEMAND BALANCE IN FRANCE
> Conversely, re-commissioning of idle units Their production can then be considered as
2 will raise operated capacity. RTE has been inevitable. However, since purchase prices are
advised that three fuel-oil-fired units, total- more profitable in periods extending from
Generation
facilities outlook
ling 2.0 GW, are to be brought back into 1st November through 31st March, power
operation, one each year between summer output is higher in winter, when demand for
2006 and summer 200810. electricity is itself higher.
Moreover, several operators have publicly The only exception concerns Diesel groups, all
announced plans to build new capacity in embedded in distribution networks, which
France, mainly based on natural gas techno- can be started up at RTE’s request. They are
logy (CCGT). However, at the beginning of used as peak facilities, in the same way as
2005, there is no certainty that they will pro- ”centralised” OCGT. Their cumulative capa-
ceed to completion. city is close to 800 MW.
2.4 Decentralised thermal 2.4.2. Combined Heat and Power
generation facilities
(10) On 25th May 2005, 2.4.1. Overview CHP expansion has been impressive between
EDF announced the re- 1998 and 2002, with the commissioning of
commissioning of a
s a definition, decentralised thermal nearly 4 GW of new facilities, most of them
A
fourth fuel-oil-fired unit
by summer 2008, as generation involves all other facili- burning natural gas. This can be explained by
well as the
commissioning of 500 ties which do not fall into the “cen- favourable regulatory rules, notably “compul-
MW of OCGT, half in tralised” category discussed above. Total sory purchase” by the Public Service Operator,
2007, half in 2008.
installed and (supposedly) operated capacity and the as yet underexploited potential both
amounts to 8.5 GW as of 1st January 2005, in industrial sites and in association with dis-
of which 3.5 GW are embedded in distribu- trict heating networks. However, the pace of
tion networks. It includes all conventional development has slowed in recent years, with
thermal facilities on Corsica (284 MW), where a mere 150 MW of new facilities commissio-
there is no Public Transmission Grid. ned in 2002 and 2003.
Most of the decentralised thermal facilities
located on the mainland are operated In the years ahead, development of CHP will
without taking account of market prices or be led by the PPI (standing for Programmation
the supply – demand balance. These are Pluriannuelle des Investissements – Long Term
mainly: Investment Programme) Order dated 7th
◗ units which benefit from “compulsory pur- March 2003, which sets a range of 250 to
chase”: a contract agreed with the “Public 1,000 MW to be commissioned between 1st
Service Operator” ensures that all the power January 2003 and 1st January 2007. Given
generated will be sold at a guaranteed price; the recent trend and the lack of new incenti-
a large number of Combined Heat and Power ves, the Generation Adequacy Report is based
(CHP) facilities are granted this kind of on the lower end of this range. Moreover,
contract. “compulsory purchase” is now dependent on
◗ units burning non-commercial fuels (such as a more stringent global energy efficiency cri-
forestry or paper industry by-products, refi- terion, which is deemed to limit further deve-
nery gas, and so on), where generation is dri- lopment.
ven by fuel availability.
202005 EDITION
“Compulsory purchase” agreements have a considered renewable, 2003 thermal RES
twelve year duration. Most of them will termi- generation is estimated at 3.4 TWh.
nate around 2010, and there is no certainty
that they may be renewed or prolonged. The long term capability of thermal RES has
been explored on the basis of economically
2.4.3. Thermal plants running on available resources. 8.2 TWh in 2010 and 12
Renewable Energy Sources TWh in 2016 seem to be the highest achie-
vable output. Turning this potential output
Renewable Energy Sources (RES) used in into reality will require government support.
thermal power generation include biomass
(wood, etc.), bio-gas (landfill gas, or gas 2.5 Hydraulic generation
resulting from the methanisation process),
and municipal waste (50% of its calorific 2.5.1. Existing facilities
content is conventionally assumed to origi-
(11) POPE stands for “loi
nate in renewable sources). ydro-electric facilities have not
According to European directive 2001/77/EC
(which promotes RES power generation),
H changed greatly in the last 20 years.
The total installed capacity amounts
to 25.4 GW. Average annual producible
Programme fixant les
Orientations de
Politique Energétique” –
the law enacting French
Energy Policy
France aims to have RES generation cover energy from natural water inflows is 70 (12) average annual
21% of its domestic electricity consumption TWh12 ; dispersion around this average figure, energy which would be
generated from natural
by the year 2010. This target is included in depending on rain- and snow-falls, is relatively inflows if installations
the POPE 11 Law dated 13th July 2005. wide: up to +/- 10 TWh. Due to inevitable pro- were always operated
under optimal
duction losses (overflows, machinery failures, conditions.
In the mean time, the PPI Order dated 7th etc.), expected annual generation is 67.5 TWh,
March 2003 sets development objectives for with current equipment and under existing
each kind of generation: 50 to 100 MW for operating regulations.
bio-gas, 200 to 400 MW for biomass, and
100 to 200 MW for waste, to be commissio- Pumped Storage facilities provide supple-
ned between 1st January 2003 and 1st mentary generation, by taking water pum-
January 2007. ped and stored at an earlier time when elec-
tricity prices were lower, and using it to drive
Considering that development had lagged turbines when prices are high.
behind objectives, and as a complement to
“compulsory purchase” for small-scale facili- There are virtually no plans to develop large
ties, the Ministry of Industry issued a call for power installations, with the exception of
tenders for units larger than 12 MW. one on the Romanche river (Alps). However,
Fourteen projects were declared successful in this project involves replacing old equipment
early 2005, for a cumulative capacity of 232 (more than a century old for some stations),
MW (216 MW biomass – mainly wood – and and will yield only moderate gains in terms
16 MW bio-gas). of power capacity and annual producible
energy. Consequently, the 200 to 1,000 MW
In 2003, 3.3 TWh were generated from target set by the PPI Order for commissio-
waste, 1.3 TWh from biomass and 0.4 TWh ning of hydro plants between 2003 and
from bio-gas. As half of the waste used is 2007 will prove difficult to achieve.
>
21GENERATION ADEQUACY REPORT
ON THE ELECTRICITY SUPPLY-DEMAND BALANCE IN FRANCE
> 2 2.5.2. Regulatory context 21% RES target. With a view to making sub-
stantial developments in wind power capabili-
Generation
facilities outlook
The above mentioned POPE Law emphasises ties, RTE has undertaken a study on how to
the importance of hydroelectricity both as a accommodate this kind of generation in the
form of RES generation (which must cover French electric system. The study's conclusions
21% of national consumption by 2010) and are presented in Appendix 1.
for its fast moving capability (thus improving One important point is that, although there
the security of electricity supply). can be no guarantee on the output of wind
generators, installing them does reduce the
However, the French parliament is also set to amount of thermal generating capacity nee-
debate another piece of legislation, concer- ded to achieve the same security of supply. In
ning water and the aquatic environment. This this respect, it can be said that wind genera-
Water Law may impact hydroelectric genera- tors provide capacity credit.
(13) as opposed to the
flows diverted through tion in three ways: This capacity credit is close to the average win-
turbines, which in some ◗ a rise in the so-called “reserved flows” to ter load factor of wind generators (around
cases return to the river
some way downstream be maintained in the natural river bed13: 30%, i.e. installing 1 GW of wind generators
from the dam. now set at 1/40 of the average annual natu- saves 300 MW of thermal facilities) when there
ral flow (module), they may be lifted up to are few wind generators. It decreases as instal-
1/10 from 2013 on (or when licenses are led wind capacity rises, but still remains around
renewed, if sooner). With no changes to 20% when installed wind capacity lies in the
existing installations, it would result in a range of 15 to 20 GW.
3 TWh loss of annual producible energy. It should be emphasised that these results are
◗ limits on flow variations: water inflows are established for the French mainland system
usually stored during periods of low demand, and are based on:
and then released at a higher rate during peak ◗ wind conditions: wind speeds in the
demand periods; limits on daily downstream Mediterranean and the Channel areas are not
flow variations might have negative conse- correlated; within the latter, correlation bet-
quences for available capacity at peak time. ween western (Brittany) and eastern (Nord-
◗ a ban on new constructions along rivers (or Picardie) regions is poor. Geographically balan-
part of rivers) which have not been equipped ced development across these areas will allow
up to now: part of the (low) expansion poten- for inter-regional compensation;
tial would be frozen. ◗ the electric system: the amount of thermal
facilities required to achieve an acceptable
2.6 Wind power level of security of supply depends heavily on
power demand volatility, which is high in win-
ind power generation is still limi- ter due to outside temperature sensitivity.
W ted in France, with installed capa-
city less than 400 MW as of 1st
January 2005. France still has high potential in
Adding wind generators provides some power,
thus reducing thermal capacity requirements.
It also means that the demand to be covered
this field, especially in areas located along the by thermal facilities is more volatile, thus requi-
Mediterranean coast and the Channel. ring additional thermal capacity. However,
since there is no correlation between outside
Since thermal RES and hydroelectric capabili- temperature and wind speed in winter, this
ties are limited, wind power is essential if the volatility is moderately increased. This increase
country is to reach or even get close to the in volatility is negligible for just a few installed
222005 EDITION
wind generators, and becomes slightly more 2.7.1. Common assumptions for
acute as installed wind generation is in the thermal generation
range of 10 to 20 GW.
Hypotheses regarding centralised thermal
These conclusions do not apply in other sys- generation are unique, and based on the most
tems, such as those in French overseas territo- plausible outcome outlined in paragraphs
ries (or other European systems) where geo- 2.2.2. et 2.3.3.
graphical concentration leads to a more ◗ Nuclear generation: 58 REP remaining in
widespread statistical dispersion of wind gene- operation through 2016 at least, Phenix shut-
rators' output, and where the statistical disper- down in 2008, and commissioning of one EPR
sion due to other random events is less mar- unit in 2012,
ked: in those cases, the capacity credit of wind ◗ Conventional thermal generation: re-commis-
power is much lower. sioning of 3 fuel-oil fired units (2,000 MW) from
2006 to 2008, gradual phasing out of 4,800
The PPI Order dated 7th March 2003 sets a tar- MW coal-fired units from 2005 to 2015.
get of between 2,000 et 6,000 MW of new A unique hypothesis has also been made for
generators to be completed between 2003 et CHP, despite uncertainty about whether the
2007. Two support mechanisms have been “compulsory purchase” scheme will be rene-
introduced to achieve this goal: wed beyond 2010. It has been considered that
◗ “compulsory purchase” at guaranteed pri- at that time installations will be fully amortised,
ces: until 2005, all wind farms less than so that operation will be profitable as long as
12 MW were covered by this scheme; under earnings recoup operating and maintenance
the POPE Law, this cap will be removed and all costs. If the supply–demand balance is tight, pri-
wind farms located in newly-created “Zones ces on power markets will be high enough to
de Développement de l’Eolien” (Wind energy support extended operation; if not, some CHP
development areas) will be eligible; capacity might be shut down, but in such a
◗ the Government issuing call for tenders for situation of overcapacity, these closures would
wind farms greater than 12 MW: a first call for not result in a need for additional capacity.
tender has gone out for 500 MW offshore
installations, and a second one for 500 MW 2.7.2. Three different scenarios for
onshore wind farms; both are pending. RES development
2.7 Three prospective Uncertainties regarding the development of
scenarios RES are considered on the basis of three sup-
ply scenarios, which will be detailed in this sec-
he above considerations indicate that tion.
T future prospects for nuclear and cen-
tralised conventional thermal genera-
tion are fairly clear, at least until 2010.
The ”Low RES” scenario only takes account of
capacity developments that can be considered
Uncertainties on the supply side mainly stem as certain:
from decentralised generation (thermal RES, ◗ wind power: between now and 2010, capacity
wind power) whose development requires already in place or under construction in 2005
public support, and to a lesser extent, from will be increased by the addition of 1,000 MW
hydropower, depending on changes to the resulting from the Government's two calls for
regulatory framework. tender; >
23You can also read