Reviewing methods and assumptions for high-resolution large-scale onshore wind energy potential assessments
←
→
Page content transcription
If your browser does not render page correctly, please read the page content below
Reviewing methods and assumptions for high-resolution large-scale
onshore wind energy potential assessments
Russell McKenna1, Stefan Pfenninger3,4, Heidi Heinrichs5, Johannes Schmidt6, Iain Staffell2,
Katharina Gruber6, Andrea N. Hahmann9, Malte Jansen2, Michael Klingler6, Natascha Landwehr6, Xiaoli
Guo Larsén9, Johan Lilliestam8,10, Bryn Pickering4, Martin Robinius5, Tim Tröndle8, Olga Turkovska6,
Sebastian Wehrle6, Jann Michael Weinand7, Jan Wohland4
1
  School of Engineering, University of Aberdeen, Aberdeen, United Kingdom
2 Faculty  of Natural Sciences, Centre for Environmental Policy, Imperial College London, London, United Kingdom
3 Department of Engineering Systems and Services, TU Delft, Netherlands
4 Institute for Environmental Decisions, Department of Environmental System Science, ETH Zurich, Zürich
5 Institute of Energy and Climate Research – Techno-Economic Systems Analysis (IEK-3), Forschungszentrum Jülich, Jülich, Germany
6 Institute for Sustainable Economic Development, University of Natural Resources and Life Sciences Vienna, Vienna, Austria
7 Chair of Energy Economics, Institute for Industrial Production, Karlsruhe Institute of Technology, Karlsruhe, Germany
8 Institute for Advanced Sustainability Studies (IASS), Potsdam, Germany
9 Department of Wind Energy, Technical University of Denmark (DTU), Roskilde, Denmark
10 Department of Economics and Social Sciences, University of Potsdam, Germany.

Abstract
The rapid uptake of renewable energy technologies in recent decades has increased the demand of energy
researchers, policymakers and energy planners for reliable data on the spatial distribution of their costs and
potentials. For onshore wind energy this has resulted in an active research field devoted to analysing these resources
for regions, countries or globally. A particular thread of this research attempts to go beyond purely technical or
spatial restrictions and determine the realistic, feasible or actual potential for wind energy. Motivated by these
developments, this paper reviews methods and assumptions for analysing geographical, technical, economic and,
finally, feasible onshore wind potentials. We address each of these potentials in turn, including aspects related to
land eligibility criteria, energy meteorology, and technical developments relating to wind turbine characteristics
such as power density, specific rotor power and spacing aspects. Economic aspects of potential assessments are
central to future deployment and are discussed on a turbine and system level covering levelized costs depending on
locations, and the system integration costs which are often overlooked in such analyses. Non-technical approaches
include scenicness assessments of the landscape, expert and stakeholder workshops, willingness to pay / accept
elicitations and socioeconomic cost-benefit studies. For each of these different potential estimations, the state of
the art is critically discussed, with an attempt to derive best practice recommendations and highlight avenues for
future research.

Keywords: onshore wind, renewable energy, resource assessment, GIS, cost curves

            1. Introduction
Renewable energy has become an important player in global energy and development policy, representing 62% of
new power generation capacity from 2009 to 2018 [1]. The most significant non-hydropower renewable technology
is onshore wind energy, which has grown from 13% to 24% of the renewable energy capacity over this period [2].
To ensure climate protection and sustainable development, renewable energy capacities including wind must grow
four times faster than this from now to 2030 [1].
         Achieving such growth requires an accurate assessment of the potential available to achieve this objective
in a cost-efficient and socially acceptable way. In this context, resource assessments for renewable energy have
become an active field of research, driven by the worldwide push towards more sustainable energy systems. The
significant attention devoted to this area in research over the past decades has led to substantial methodological
improvements and more reliable resource estimates. This includes improvements in atmospheric modelling and data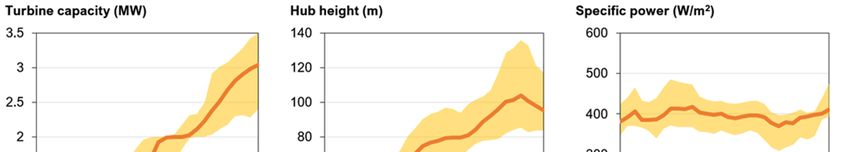
availability, land use mapping with open source data, as well as understanding of techno-economic turbine
characteristics. One additional area which has seen particular methodological focus is improving the ways in which
such studies account for non-technical (e.g., social) constraints for renewable resources like onshore wind (e.g. [7–
10]).
         Using a manual internet search and by screening 880 articles1 and 88 reviews2 in the Scopus database, we
were able to identify and examine several previously published reviews on onshore wind energy. These include
bibliometric analyses of general trends in this research area [11] or, for example, of specific factors that influence
the economics of wind energy projects [12]. Other studies focus on the history of wind turbines [13] and global
developments of wind energy diffusion in recent years [14]. A large stream of research deals with the forecasting
of wind power generation or meteorological aspects, such as wind speeds, and has already resulted in many reviews
[15–19]. Further reviews deal with onshore wind related to markets [20], environmental impacts [21], or detailed
technical resource assessments of individual wind turbines in specific locations [22,23] such as urban environments
[24]. Reviews of onshore wind potentials have mostly examined studies on specific aspects, such as the system
integration of wind turbines, e.g., in electricity grid analyses [25] or energy system planning models [26]. There are
also review studies that address onshore wind potential assessments in general, but usually only in a short section
and mainly with a focus on the geographical potential [15,27,28]. Others have reviewed methods and tools for
onshore wind potential assessments in the context of the broader spectrum of renewable resources, whilst focussing
mainly on the technical aspects [29].
         In summary, there is no review of best practices in identifying different (geographical, technical, economic)
onshore wind potentials in large regions consisting of multiple countries or continents. At the lower end of the
geographical scale, this review excludes detailed studies of wind park layout and planning (e.g. [30–32]) as such
detailed analysis are not feasible at large scale. In addition, we similarly exclude sub-national or national resource
assessments (e.g. [33–44]) that can be considered case studies and are therefore simply an application of standard
state of the art methods reviewed here. The exception is when such studies employ a novel method, in which case
they are considered with respect to these particular characteristics. Furthermore, the present review also considers
non-technical, social aspects of onshore wind energy planning. Finally, the scope is limited to Horizontal Axis Wind
Turbines (HAWTs), which are by far the most widespread due to higher aerodynamic efficiencies and lower costs
than alternatives [45].
         In the field of resource assessments for renewable energies, it is common to distinguish between different
degrees of potential. Hence Hoogwijk et al. [46] distinguish four categories of potentials (cf. Table 1):
     • The theoretical or physical potential refers to the total energy content of the wind within a specific region.
     • The geographical potential equals the total area available for wind turbine installation accounting for
         technical, ecological and social constraints, such as minimum distances to infrastructure, protected areas or
         settlements.
     • The technical potential corresponds to the wind power generated within the geographical potential. It
         considers constraints such as wind turbine characteristics, wind farm array losses and electrical conversion
         losses.
     • The economic potential is the subset of the technical potential which satisfies criteria of economic
         profitability, which may differ between social welfare and private firm’s profit-maximizing perspectives
         respectively. The economic potential strongly depends on prevailing energy-political and market
         frameworks.
     • The above taxonomy can be extended further to consider that fraction of the technical potential considered
         practically achievable or desirable. So, for example, Jäger et al. [7] define the feasible potential as “the

1
  Search query on 12/15/2020: TITLE ("onshore wind" OR "wind power" OR "wind energy" AND (evaluat* OR assess* OR analy* OR pot* OR plan* OR simul* OR optimi* OR
model*)) AND TITLE-ABS-KEY (wind AND (power OR generation OR energy) AND (evaluat* OR assess* OR analy* OR pot* OR plan* OR simul* OR optimi* OR model*) AND
(potential OR locat*) AND (generation OR cost OR lcoe OR econom*)) AND SRCTYPE (j) AND (LIMIT-TO (DOCTYPE, "ar"))
2
  Search query on 12/15/2020: TITLE ("onshore wind" OR "wind power" OR "wind energy" AND (evaluat* OR assess* OR analy* OR pot* OR plan* OR simul* OR optimi* OR
model*)) AND TITLE-ABS-KEY (wind AND (power OR generation OR energy) AND (evaluat* OR assess* OR analy* OR pot* OR plan* OR simul* OR optimi* OR model*) AND
(potential OR locat*) AND (generation OR cost OR lcoe OR econom*)) AND SRCTYPE (j) AND (LIMIT-TO (DOCTYPE, "re"))

                                                                               2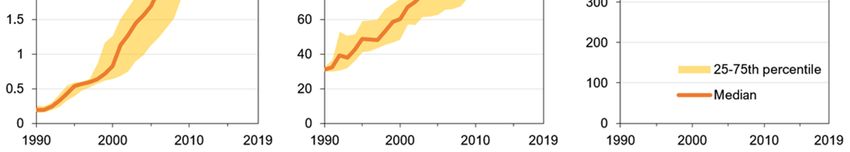
actual achievable economic potential, whilst accounting for market, organizational and social barriers,
          which mean that in practice the economic potential is not realized.”
          Table 1 summarises how the above potentials are defined and relates them with examples to energy policy.
Whilst theoretical/physical and geographical potentials are generally irrelevant for energy policy, technical,
economic and feasible potentials are highly policy-relevant. On the one hand, these potentials are influenced by the
laws, targets, and incentives at regional, national and international levels; on the other hand, these potentials and
their dynamics arguably have a strong impact on policymaking, especially but not only in terms of the feasible
potentials.
          In this paper, we follow the same categorization of potentials, although we also highlight that this is an
oversimplification, in particular the difference between geographical and feasible potential is vague. In the
discussion in sections 5 and 6, we address these conceptual challenges in more detail. With the above framework
of potentials as a structure, this paper provides an overview of recent developments in the field of resource
assessment for onshore wind. In doing so, it discusses the state of the art in each of these areas and provides impetus
for further research. Section 2 provides an overview of the geographical potential, especially the different land
eligibility criteria employed in the literature on onshore wind energy. Section 3 then focuses on the technical aspects
of onshore wind potentials, including the meteorological challenges and datasets, the technical characteristics of
wind turbines, the issue of extreme wind speeds, and the spacing of wind turbines in wind parks. Subsequently,
section 4 discusses economic aspects of onshore wind assessments, including the definition of the economic
potential, the economic characteristics of turbines, various economic potential estimates for onshore wind, and the
question of system/integration costs. Section 5 then turns to the so-called feasible potentials, reviewing the literature
addressing those aspects not falling within a solely technical and/or economic framework, e.g., public acceptance,
noise etc. Finally, section 6 critically assesses the methodological approaches presented in the preceding sections
and presents some outlooks for further research.

Table 1: Overview of different potential definitions and examples of their policy relevance.

 Potential term                Definition                                                                 Policy relevance
 Theoretical or physical       Total energy content of wind, e.g. globally.                               Generally irrelevant
 potential
 Geographical potential        …the geographical area available for wind turbines, e.g. globally.         Generally irrelevant
 Technical potential           Electricity that can be generated from wind turbines within the            Wind         industry      R&D,
                               geographical potential, over a given period of time (e.g. a long-term      innovation       and      market
                               average or an hourly time series over a specific year), and with a given   dynamics
                               turbine technology (e.g. current, future).
 Economic potential            Subset of the technical potential that can be realized economically.       Energy-political frameworks
 Feasible potential            Subset of the economic potential after accounting for non-technical and    Public    acceptance,     market
                               non-economic constraints.                                                  barriers, inertia / resistance

         2. Geographical onshore wind potential
The geographical potential of wind energy is mostly defined as specific geographical areas available to install wind
turbines (e.g. [7,47–50]). Other names for this type of wind energy potential in literature are practical potential [51],
preliminary area definition [52], environmental factor [53], generally suitable sites [10] or suitable construction area
[54]. Some studies include the geographical potential in part or fully into the technical potential (e.g. [33,34,48]),
while others do not even cover this step at all [35]. Other studies further divide the geographical potential, e.g. into
geophysical suitability as well as technical and environmental permission [48]. In most studies, determining the
geographical potential is one of the first steps in analysing the wind energy potential. However, this step can also
be carried out after determining the technical potential (e.g. [51]).

                                                                      3
This section provides an overview and justification of the constraints applied to determine the geographical
potential and ranges of buffer/offset distances in literature are given (section 2.i). Subsequently, approaches to
process the set of constraints and often used databases are listed with their main characteristics (2.ii).
i. Criteria
The availability of specific areas for wind turbines is most often derived from a set of primarily geographical criteria.
Set definition and the utilisation of criteria to determine geographic suitability differ in literature. In most cases
these criteria are used as strict exclusion criteria with or without buffer distances (e.g. [7,48,50]) or combined into
indicators like a suitability factor (e.g. [10,36,46]), which adds a quality criterion to the geographical potential
beyond the mere binary exclusion of areas.
Table 2 gives an overview of typical criteria and the range of buffers applied to the geographical potential.
Those criteria can be categorised into different types like physical or technical constraints (e.g., slope, altitude and
water bodies), exclusion criteria in the context of the built environment (e.g., settlements or roads) and related
legislation, and environmental constraints to protect flora and fauna. While some criteria like settlements, protected
areas, roads and railways occur in several studies, others like agricultural area [49], power plants [48], firing areas
[47], glaciers [37,55] and tropical forests [46] are applied only infrequently; the latter three result mainly from
different characteristics of the studied regions. In addition, the criterium forests is handled differently in literature
ranging from full exclusion (e.g. [38,39,49,51,54]) to allowing some shares being suitable for wind turbines
(sometimes dependant on the respective scenario) (e.g. [36,46,51,55]). Furthermore, the listed criteria and their
respective buffer distances are divided into sub-criteria in several studies depending on the availability of databases
and their underlying level of detail and definition of categories like settlement types (e.g. [36,40,50]).
Table 2: Overview of criteria applied to derive the geographical potential of onshore wind energy.
Criteria Excludes References
Slope Values above 1 – 30° [10,36,37,40,48–50,55]
Altitude Values above 2 – 3.5 km [39,46,48–51,55]
Water bodies Distances below 0 – 1 km [7,37–39,42,48–50,54,55]
Settlements Distances below 0 – 3 km [7,9,10,34,36–40,42,46–48,50,53–55]
Roads Distances below 60 – 500 m [7,9,34,36–40,47–50,54]
Power Plants Distances below 1 km [48]
Airports Distances below 1 – 6 km [7,9,36,37,39,40,42,47–50,53],
Transmission lines Distances below 60 – 250 m [7,9,37,48,50,53],
Railways Distances below 60 – 500 m [7,9,36,37,39,40,47–50,53,54]
Protected areas Distances below 0 – 2 km [9,34,36–40,42,46–51,53,55,56]
Forests Distances below 500 m [38,39,49,54]
Tropical forests Distances below 0 m [46]
Glaciers Distances below 0 m [37,55]
Firing areas Distances below 0 m [47]
Sandy areas Distances below 0 m [50]
National borders Distances below 3 – 50 km [47]
Mining areas Distances below 0 – 3 km [7,50,54]
Apart from studies explicitly focussing on urban areas, there is a general consensus about excluding settlements and
in most cases employing offset distances [41]. Distances between dwellings and wind power installations are
ensured mainly in two ways. First, immission control regulations enforce levels of noise and visual impacts to be
below well-defined thresholds. Whether a turbine can be built in a certain location thus depends on the
characteristics of the planned turbine and is decided on a case-by-case basis. Hence, some studies (e.g. [10,42,53])
list noise as dependent on distance from the wind turbine as a criterium in their geographical potential. Second,
distances can be ensured by enforced setbacks, which in most cases are standardised but, in some cases, depend on
the height of the wind turbine. Setback distances are usually much larger than necessary for immission control and
4therefore exclude larger areas from wind power installations. The amount of excluded area depends not only on the
setback distance, but also on the definition of settlements. In Germany, for example, the available area for wind
power installations at a setback distance of 1 km is reduced by more than 30% when setbacks are considered not
only for pure settlement areas but also for areas of mixed-use [43]. Immission control thresholds vary between
countries and setback distances are often defined on the subnational level; sometimes as low as the municipal level.
Wind resource assessments whose geographical scale is multi-national therefore have to include a plethora
of different regulations, which is considered a challenging task. While most studies with sufficiently high
geographical resolution consider setback distances to settlements, these setback distances are only rarely based on
existing, actual regulation in the assessed regions of multi-national studies and instead are generic assumptions such
as a uniform distance (e.g. 600 m) or a multiple of the tower height [8,9,44,57,58]. Whether the magnitude of setback
distances has a large impact on study results likely depends on the settlement structure. For Germany, which has a
high population density, the magnitude of setback distances can have a large impact on wind potentials, with the
technical potential with a 1000 m setback being just 1/3 of the potential with a 600 m setback [59].
Even while several studies (e.g. [37,38,46,49,50,60]) include wind speeds in their set of criteria for the
geographical potential, we classify this as belonging to the technical potential (cf. section 3). However, if the size
of the covered area might result in computational challenges, excluding areas below a specific minimum wind speed
can be a good way to overcome this computational barrier.
The arguments for selecting specific criteria and their buffer for the geographical potential range from
technical, economic to societal and legal aspects. For example, the fall in wind power due to a reduction in air
density is used to explain the exclusion of high altitude locations (e.g. [36,46,48,55]). Other examples are regional
planning catalogues and existing legislations, which build the basis for buffer distances [9,36] or biodiversity and
natural health, which are used as an argument to exclude protected areas [49]. A distinct argumentation is
particularly important for criteria which either exclude large areas or whose overlap with other criteria is small.
While the impact of criteria varies geographically, Ryberg et al. [61] show that forests, habitats, slopes, and
settlements are most impactful and mining areas and airports are least impactful for studies in Europe. However, a
quantification of the impacts on the reuslts probably cannot be derived for all criteria, and, therefore, some studies
have started to incorporate surveys [62]. However, this issue seems to be more related to the feasible potential
addressed in section 5.
Most often the set of criteria and their buffers are chosen once. Only some studies include further scenarios
to explore the impact of different settings or future developments in the context of sensitvity analyis (e.g.
[10,38,47,50,51]). Such scenarios typically add or remove restrictions and vary buffer zones to non-eligible areas
or vary suitability factors. Hence, up to now most approaches for the geographical potential are more or less static.
ii. Approaches and databases
Several studies (e.g. [38,48]) utilize only the previously selected criteria or combine them with an additional buffer
distance to exclude further non-suitable areas. Hence, those studies interpret the criteria as distinction between
eligible or non-eligible areas. In contrast, another type of studies applies suitability factors (e.g. [36,46,51,55]).
Suitability factors are used for different purposes like to address uncertainty in the database due to a lack in level of
detail [55] or to combine different level of details in databases [36]. These suitability factors typically range between
0 and 1 and are most often translated as the fraction of land eligible for wind turbines in a specific geographical
category or grid cell (e.g. [46,50]). Besides suitability factors, applying fuzzy sets to define an acceptable level in
terms of selected criteria, which are then combined into an integrated satisfaction degree via a multi-criteria decision
making approach, is another approach in literature [42]. A combination of approaches, considering some cirteria as
pure exclusion criteria and others via suitability factors or as fuzzy sets, exists in literature as well (e.g. [42,51]).
Moreover, another study combines exclusion zones, economic viability and social acceptability into a suitability
score [9]. However, we consider this type of score to belong more to the feasible potential types discussed in sections
5 and 6.
Even if the regional scope of studies on wind energy potential differ, some databases are frequently used
due to their global or continental scope and their open availablity (Table 3). These databases are most often
5complemented with further national or regional databases including both open and closed data. These regional data
can range from landuse data [7,10] to military air traffic lanes [63]. Furthermore, natural protected areas are also
often defined by regional datasets [34]. The utilized databases can bear different spatial resolutions ranging from
around 100m2 to several km2, whereby the lowest spatial resolution typically determines the level of detail of the
wind energy potential analysis, with some studies combining several different databases (e.g. [7,47]). Nonetheless,
only rarely a validation or uncertainty analysis is performed, implying that a dedicated analysis on the impact of
using different types of databases is still missing.
Table 3: Overview of global and continental databases utilized in determining the geographical potential.
Dataset Classes Openly Spatial Resolution Regional
Available coverage
Corine land cover [64] 44 Yes 100 m linear Continental
phenomena
25 ha areal
phenomena
ESA Land Cover Climate 22 (compatible with GlobCover) Yes 300 m globally higher Global
Change Initiative [65] resolution Africa includes
yearly maps
Natura 2000 [66] Sites designated under Birds Yes Varying Continental
Directive and Habitats Directive
EU's Common Database on Individually for each area In most Varying Continental
Designated Areas [67] parts
World Database on Individually for each area Yes Varying Global
Protected Areas [68]
Global 30 Arc Secon Elevation Yes Lateral resolution Global
Elevation project [69] ~1km at equator
GlobCover land cover 22 Yes 300 m Global
dataset [70]
Digital chart of the world Country border Yes - Global
[71]
Geographical information Biodiversity Limited - Global
system for the analysis of
biodiversity data [72]
Moderate Resolution 5 different land cover classification Yes ≥ 500 m Global
Imaging Spectroradiometer schemes, primary land cover scheme
(MODIS) [73] with 17 classes defined by the IGBP
USGS HYDRO 1k Stream lines, basins, Yes 1 km Global
elevation dataset [74]
Open Street Maps Project 28 primary features with various Yes Varying Global
[75] subfeatures
NASA. SRTM 90m Digital Elevation Yes 90 m at the equator Global
Elevation Data [76]
Google Earth [77] Various Varying Varying Global
In terms of the accuracy of the employed geospatial databases, some studies use sources such as Open Street Map
(OSM) to consider existing buildings. Whilst this open-source data is widely available, it differs greatly in its
coverage. The OSM database is constructed with user-volunteered input, which naturally calls into question its
completeness. For example, Barrington-Leigh et al. [78] assessed OSM’s completeness of roads on average
globally, concluding that roughly 80% of all roads are accurately represented in the database, a coverage which
varies by country. In most European countries, the estimated road completeness is well above the global average,
often around 99% complete, with the exceptions of Turkey (79%), Albania (75%), and, most notably, Russia (47%).
In addition, Hecht et al. [79] estimated the completeness of buildings in several regions of Germany, and found
significant discrepancies from known building locations. In the state of North Rhine-Westphalia buildings
6completeness was found to be 25%, while in the state of Saxony it was only 15%. For example, much more recently,
Broveli and Zamboni [80] evaluated OSM building completeness in Lombardy Italy and found the dataset to be
57% complete. Another promising dataset in this context is the World Settlement Footprint, which has global
coverage at 10 m resolution and to our knowledge has not yet been employed for global onshore wind potential
analyses [81].
3. Technical onshore wind energy potential
This section discusses the technical potential of onshore wind generation, beginning with the meteorology (section
3.i) and wind turbine technical characteristics (3.ii), followed by a discussion of the influence of extreme wind
events on wind power potential (3.iii) and wind turbine spacing in parks (3.iv). These aspects culminate in the
technical potential, as defined in Table 1. Selected international studies are summarized in terms of technical and
economic potentials for onshore wind in Table 6. The technical potentials in this table, based on about 20 cited
studies, range from 96-580 PWh globally (up to 717 PWh including offshore) or 0.4-77 PWh for Europe. The latter
is shown for selected studies in Figure 2 at the end of this section and the economic potentials are discussed in
section 4.iii.
i. Meteorological wind power potential
Broadly, there are two types of wind resource assessment that lead to two types of data requirements. First, there
are static or climatological wind potential assessments, requiring a wind atlas with wind speeds and/or power
densities. Second, there are models of time-resolved renewable generation variability for use in energy system
modelling (e.g., [82–84]), requiring appropriate input data such as from wind masts or meteorological reanalyses.
These two types of assessment can also be combined: for example, static products like the Global Wind Atlas can
be used to bias-correct reanalysis-based time series [85–89]. Wind speeds increase with altitude through the lower
atmosphere, which is typically modelled by a logarithmic or power-law relationship [90]. For example, capacity
factors increase by 16-34% when moving from 50 to 100 metres above ground; and a further 8-15% when moving
from 100 to 150 metres, averaged across several sites in Europe [91]. We now discuss five key sources of
meteorological data in turn, which are summarized in Table 4.
Observations. Many wind speed observations are available from weather stations and masts, for example,
via the UK Hadley Center HadISD database [92] and the Tall Tower Database [93]. Station measurements can be
affected by relocation, device updates, measurement error, and changes in the local topography [94]. Using station
measurements for large-scale studies of wind potential thus requires dedicated quality control procedures of the
underlying data [92,93]. Measurements are also spatially and temporally irregularly sampled. For example, 51% of
the 222 >10 m masts in the Tall Tower Database are in Iran, and none are found in South America or northern
Africa [93]. There is scope to improve spatial coverage in future by including the growing number of deployed and
long-running wind farms, assuming wind park operators are willing or forced to share their data. Due to their limited
coverage and irregular sampling, observations can be of little use in large-scale wind power modelling efforts
despite their undisputed value at specific locations or in statistical downscaling of modelled or reanalysis data.
Global reanalyses. Most large-scale studies and databases for wind power potentials rely on reanalyses
(e.g., [87,95,96]). Reanalyses combine a numerical weather prediction model of the atmosphere with observations
using a technique called data assimilation (e.g., [97]). They provide meteorological data on a global regular grid,
with information considered representative for the entire grid cell. This differs from observational data which
provides point-based information. The choice of a reanalysis-based product depends on modelling context, and
which temporal and spatial scale needs representing. Well known reanalyses of the satellite era (1979 to today) are
ERA5 [98] and MERRA2 [99]; ERA5 has also recently been extended back to around 1950 [100]. Several studies
have been undertaken to assess the performance of reanalyses to capture wind speeds. Over flat terrain in Northern
Germany and the Netherlands, global reanalysis results are relatively well correlated to measured data [101–104].
However, for MERRA-2 and ERA-Interim it is reported that high ramp rates are underestimated while lower ones
are overestimated. Temporal variability in general is underrepresented in reanalysis [101], which is confirmed by
Cannon et al. [105] particularly for individual locations. Ramon et al. [106] find important discrepancies with regard
7to interannual variability and decadal trends in satellite-era reanalysis, yet report that ERA5 agrees reasonably well
with tall tower measurements, except in areas of complex terrain where the sub-grid orographic drag artificially
lowers the simulated wind speeds [107,108]. In applications that require longer time series, centennial reanalyses
like 20CRv3 [109] and CERA20C [110] are used to investigate long-term wind variability (e.g., [111]). However,
there are documented deficiencies of these datasets, most notably strong wind speed trends in CERA20C that are
likely spurious [112]. Another issue is that global reanalyses are relatively smooth and thus tend to exaggerate
spatial correlations between neighbouring regions [85].
Table 4: Overview of meteorological datasets’ coverage and resolution. Coverage and resolution information is approximate and based on
the given example datasets; other datasets exist which may sit outside the given ranges.
Coverage Resolution
Type of data Example Spatial Temporal Spatial Temporal
source datasets
Observations HadISD [92], Tall Global (irregular) Historical, 20-50 Site-specific 5min-1hr
Tower Database years (irregular)
[93]
Global reanalyses MERRA-2 [99], Global Historical, 40-70 30-60km 1-3 hrs
ERA5 [98], JRA- years
55 [113]
Long-term global 20CRv3 [109], Global Historical, 100- ca. 100km 3 hrs
reanalysis CERA20C [110] 150 years
Regional COSMO-REA2 Regional Historical, 7-22 2-6km 1hr
reanalyses [114], COSMO- years
REA6 [115]
Wind-focused NEWA [107], Regional Historical, 11-30 2.5-3 km 0.5-1 hr
reanalysis DOWA [116] years
Wind atlases NEWA [116], National to global Historical average 200-50m N/A
GWA [117]
Climate models CMIP5 Global or Historical and Ca. 10km - Hourly to
[118,119], regional future, X-Y years 300km monthly
CMIP6 [118],
EUROCORDEX
[119]
Regional reanalyses. While ERA5 provides hourly data with ~30 km horizontal grid spacing, higher resolutions
may be required to resolve wind patterns in complex terrain [120,121]. In fact, using global reanalyses can lead to
a severe underestimation of wind energy technical potential [122]. Regional reanalyses provide higher resolution.
COSMO-REA2, for example, has a horizontal resolution of 2 km, and can effectively resolve meteorological
phenomena from a scale of ~14 km [114]. This is sufficient to resolve some mountainous weather patterns [122],
while disagreement with observations remains large in particularly complex terrain [103,122]. Downscaling is
computationally expensive and sometimes leads to limited scope datasets; COSMO-REA2 only covers seven years
and nine European countries. Since regional reanalyses are provided over a confined area, they rely on boundary
data from a global reanalysis. As a consequence, potential large-scale issues in the global reanalysis can propagate
to the regional reanalysis.
Wind atlas datasets. In contrast to current reanalyses that are not designed with a specific focus on wind
energy, wind atlas projects like the New European Wind Atlas (NEWA) [107], Dutch Offshore Wind Atlas
(DOWA) [116], the Wind Atlas for South Africa (WASA) [123] and the Global Wind Atlas (GWA) [117] provide
tailored, long-term mean wind energy information at a high spatial resolution. NEWA is based on a dynamical
downscaling of ERA5 using the WRF model evaluated against mast measurements and exists as a mesoscale and
microscale product [107,124]. The spatial grid spacing of the mesoscale NEWA is 3 km at seven heights above
ground level and provides wind speed and power density averaged over 1989 to 2018. The NEWA microscale atlas
is based on a second linearized downscaling to 50 m spatial resolution [107]. The high-resolution details of the
8surface elevation and surface roughness are found to improve the long-term means when compared to observations
[107]. However, higher resolution does not automatically mean higher quality [102].
Climate models. While reanalyses and observations are only available in hindsight, climate model
projections can be used to investigate impacts of future climate change on wind power generation. Climate model
simulations are fundamentally different from reanalyses and observations giving rise to different sources of
uncertainty (e.g., [125]). Large ensembles of climate model simulations are available from the Climate Model
Intercomparison Project (CMIP; [126,127]) and downscaled projections are available from the Coordinated
Downscaling experiment (CORDEX) initiative [118,119]. These datasets have been used in different assessments
related to future wind energy potentials (e.g., [128–136]). Pryor et al. [137] recently reviewed literature on the
subject.
ii. Wind turbine technical characteristics
The next stage of the analysis for the technical potential involves wind turbines, which are discussed in this section.
The focus here is on horizontal axis wind turbines (HAWT) that adopt the lift principle, due to their higher
conversion efficiency, greater reliability and economies of scale allowing for cost effective multi-MW machines
[45,138].
HAWTs are not simply uniform and homogenous machines. Instead, the choice of generator and rotor are
designed for the specific conditions they will experience, and so different turbine types will have very different
performance characteristics. Wind speeds can be converted to power output using empirical power curves, statistical
approaches, or physical meta-models. Empirical power curves are typically provided by turbine manufacturers
[139], for example in [55,95,140,141], but these require appropriate smoothing to account for heterogeneity in wind
speeds experienced at different turbines within a farm and at short timescales [142]. Statistical approaches take
historical data for measured wind speed and power output, typically at a regional or national aggregation, to derive
a relationship between the two which automatically accounts for smoothing and other factors (e.g. [105]).
Hypothetical power curves can be derived using meta-models (e.g. [6,143]) based on turbine specifications such as
the specific power. This can help with future-focused studies, as power curves for next-generation turbines typically
only become available after they have been operational for some time.
Three key design factors which influence energy production are the turbine’s capacity, its hub height (which
influences the wind speeds experienced), and the ratio of generator capacity to blade length (which determines the
specific power and thus the general shape of the power curve). Figure 1 shows the evolution of these three
parameters over the past three decades for onshore wind turbines in Europe. Turbine capacity has increased 16-fold
since 1990, with a steady increase of 106 kW per year on average. The dominance of the 2 MW platform is visible
from 2005 through to 2013, but since then 3 and 3.5 MW turbines have become commonplace. Similarly, hub height
now averages 100 metres, 2.5 times greater than in 1990. This has grown by 3 metres per year, but has plateaued
since 2015.
In addition, the cut-in and cut-out wind speeds determine the feasible range of operation for a given turbine
and thereby also the lower and upper bounds of wind speeds for actual power generation. Other technical
characteristics affect the shape of a wind turbine’s power curve and thus its productivity, including storm control
(for safety), noise reduction settings (sometimes required in built-up areas), the assumed size of a wind farm, and
technical degradation over the turbine’s lifetime [144].
The specific power of a turbine is arguably the most important feature in determining a turbine’s output.
The blade length (rotor diameter) determines the swept area and thus how much wind energy the turbine is exposed
to. The generator capacity determines the maximum rate at which energy can be converted into electricity. Over the
past 30 years, the specific power of European onshore turbines has remained nearly constant, averaging 394 ± 11
W/m2. The IEC categorises turbines by three wind speed classes, defined by the annual average wind speed they
are suited for. For example, the Vestas V66/2000 (66m rotor diameter, 2000 kW generator) is a Class I turbine,
suitable for sites with annual average wind speeds above 10 ms-1. It has a specific power of 1.7 m2/kW and would
yield a capacity factor of 22.3% in central Scotland [91]. In comparison, the larger-bladed V80/2000 (Class II, 2.5
m2/kW 398 Wm-2) would yield 31.4%, and the V110/2000 (Class III, 4.8 m2/kW 210 Wm-2) would yield 47.9% in
9the same location. All are 2 MW turbines, but one produces twice as much energy as another. This simplified
comparison overlooks the constraints on turbine spacing, however, as discussed in section 3.iv below.
Figure 1: Evolution of Europe’s onshore wind turbines over the last three decades. Each panel shows the average specifications of new
turbines installed in each year using data from Refs. [145,146]. Shaded areas represent half of all new turbines installed, covering the 25th
to 75th percentiles.
iii. Extreme winds and their impacts on turbine design
As well as the general wind turbine characteristics discussed in the previous section, one specific and important
characteristic is the ability to manage extreme wind conditions. For wind-farm planning, the expected extreme wind
at hub height needs to be calculated to find suitable turbines that can harvest the most wind energy while also
reducing the risk of damage from harsh wind conditions. For this reason, the fifty-year extreme wind at hub height
is a design parameter specified in the IEC standard 61400-1 [139]. With climate change, and the resulting changes
in frequency of extreme weather events, this may become an even more important issue than in the past.
The earliest dataset of fifty-year wind was produced in line with general civil-engineering applications
[147]; each country used its own method, causing discontinuous values at national borders (e.g. [148]). Since then,
there have been major methodological developments. Statistical algorithms have been derived to best represent the
extreme wind samples from single or multiple types of extreme weather events (e.g. [149,150]). Pryor and
Barthelmie [151] used the global ERA 5 data and calculated the 50-year wind at a height of 100 m, with a spatial
resolution of about 30 km. Though a general issue is that the temporal and/or spatial resolution of numerical
modelling data is often too coarse, Larsén et al. [152] developed the spectral correction method (SCM). This method
uses wind variability that is generally missing in the modelled data over the relevant frequency range and uses
information from limited available measurements or from a spectral model through the spectral domain. This
method has been used to create an extreme wind atlas for South Africa [153], as well as for the whole globe [154].
Furthermore, tropical cyclone-affected areas have always been challenging for assessing design parameters.
One example are the Chinese coasts: with measurements from 205 towers during 2003 and 2010, the ratios of the
50-year wind to the annual mean wind were calculated and can exceed the reference value by 5-10 times of the
value given in the IEC61400-1 standard [16]. Using a hurricane conceptual model and best track data, Ott [155]
calculated the 50-year wind for the west North Pacific. Larsén et al. [154] calibrated the SCM using the best track
data and calculated the extreme wind for a tropical cyclone affected area in the northern hemisphere.
The estimation of extreme wind is still challenged by our understanding of flow across multiple scales,
particularly in the range of a few kilometres to meters, the so-called spectral gap region (e.g. [156,157]). This
limitation is reflected particularly in complex terrains and challenging severe conditions such as tropical cyclones
and thunderstorms. It remains a problem to obtain reliable samples to assess the extreme wind climate and thereafter
the distribution of these conditions when calculations cannot be achieved with high confidence. The implication for
10onshore wind resource assessments is that the technical potential is reduced, but as the extreme wind aspect is
generally not considered, this represents a limitation in existing studies.
iv. Wind turbine spacing and small areas
In addition to the technical wind turbine characteristics outlined in the previous sections, the wind turbine spacing
in a wind farm strongly influences the technical generation potential. Industry practice for wind park siting and
planning is to consider the extreme wind and other siting parameters such as turbulence intensity and load [139].
But this is generally overlooked in regional planning process and most of the studies reviewed here [5,158,159],
due to a general lack of data. Private companies rely on commercial and confidential in-house calculation methods
and data. The ongoing GASP (Global Atlas for Siting Parameters) project provides additional layers of publically
available data to GWA at a spatial resolution of 250 m, including extreme wind, turbulence and wind turbine class
over the globe [117,154].
Due to interference or wake effects, which reduce the output of wind turbines placed downwind of them,
the capacity density of wind turbines is technically constrained. The explicit calculation of the optimal layout of
wind parks is a combinatorial problem which is computationally hard to solve [160]. For this reason, the real world
problem is often simplified to make it computationally tractable – for example, by discretizing the solution space
of possible turbine locations [30] and applying evolutionary algorithms with heuristics [31] or particle swarm
optimization [32] to optimize wind farm location and layout.
Another simple heuristic assumes a capacity density, as in e.g. [161]. Here, the number of wind turbines is
simply constrained by an assumption on how much capacity, or how many turbines of a certain type, or how much
rotor area can be placed on a given amount of land. A second option is to explicitly place turbines, using a rotor
diameter distance heuristic [8,162]: by assuming that a certain distance between turbines has to be maintained, and
that this distance depends on the size of the rotor, the number of turbines that can be potentially placed on a given
stretch of land are determined by first placing a turbine and subsequently blocking land in the given minimum
distance for further placements. Typical distances are in the range of 4D-7D [8], or 5D-10D [162], where D is the
turbine rotor diameter and the larger offset is in the main wind direction, due to stronger wake effects. Nevertheless,
some approaches assume the same distance factor in all directions (e.g. [8]), while others assume different distance
factors, depending on the main wind direction (e.g. [6]). Wind roses which indicate the frequency of wind directions
can be calculated from reanalysis products, but are also provided e.g. by the Global Wind Atlas [117].
When assessing the large-scale potential of wind energy, the impact of the upwind extraction of wind energy
has to be taken into account for downwind wind parks due to wake effects. For example, Lundquist et al. [163] have
found that these effects can have economically significant impacts up to 50 km downwind. When very large wind
arrays are built, additional efficiency losses have to be expected, which can reach up to 70% for very large arrays
(i.e. in the range of 105 km2) when turbine spacing is small [164]. In very large wind penetration scenarios which
could be possible in the future, an overall reduction in wind speed should therefore be expected [137,164].
Relating to the employed turbine spacing, onshore wind resource assessments methodologies often must
deal with many small areas (i.e. areas around 0.3-0.6 km² or smaller) resulting from the stepwise exclusion of
unsuitable areas outlined in section 2. The application of turbine densities (in MW/km²) could be problematic [36]
for these areas, as this could lead to a potential that is lower than that of a single turbine. In the literature there are
basically two procedures for dealing with small areas. Firstly, the areas that are too small to build a single wind
turbine could be aggregated and added to the total potential (as in [33,165]). This would overlook the shape of the
areas as well as position with respect to one-another and therefore lead to an overestimation of the potential. On the
other hand, the areas could be completely excluded. However, theoretically there could be enough area to build a
single turbine, as only the area of the turbine tower base (around 0.1-0.2 km²) would be relevant for this. This
approach would therefore lead to an underestimation of the potential [36]. Both of these effects can lead to an
uncertainty of about +/-10% of the technical potential [36].
Overall, the approaches and assumptions employed to determine the technical potential for onshore wind
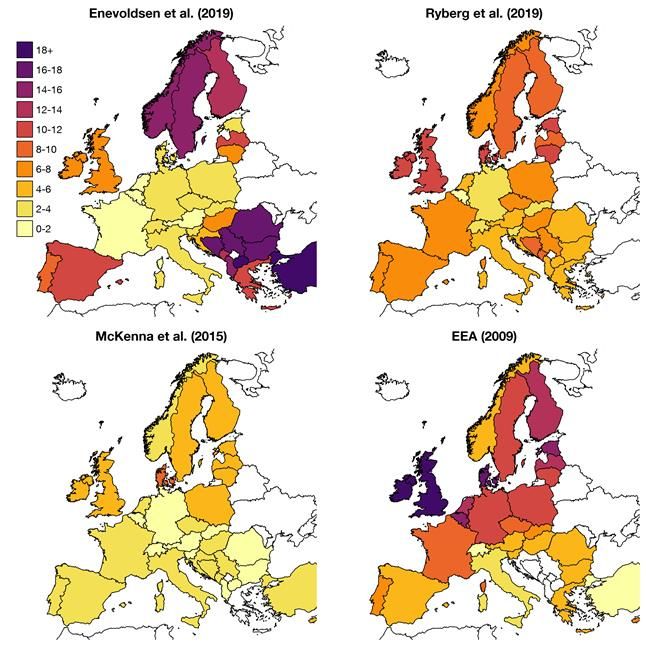
outlined in this section lead to wide range in results. Figure 2 below shows the estimated potential for onshore wind
in selected European countries, to our knowledge from the only studies with this broad scope and national
11disaggregation. The results between the four studies clearly show a large range, in some cases leading to national
potentials that diverge by over 100%. Further discussion of differences in European-level results can be found in
[166].
Figure 2: Specific potential for onshore wind in selected European countries in GWh/km2 of total land area [3–6]. To our knowledge,
these are the only studies to have assessed this potential at the national scale across Europe. The shown potentials are technical,
with the exception of Enevoldsen et al. [3], which refers to a so-called ‘socio-technical’ potential.
4. Economic potentials of onshore wind
Having discussed the geographical and technical constraints relating to onshore wind resource assessments, this
section addresses the economic dimension. It begins with a more elaborate definition of the economic potential and
economic assessment criteria in section 4.i. Section 4.ii then presents economic characteristics of current and future
HAWT technology, before section 4.iii discusses selected studies in terms of their (technical and in some cases)
economic potentials. Finally, section 4.iv analyses the system integration costs of onshore wind and its implication
for resource assessment methods.
12i. Defining economic potential and economic assessment criteria
In theory the economic potential is the fraction of the technical potential that currently can be economically realised.
In practice, the term is not well defined, which limits studies’ comparability and generalisability. A distinction
between two different perspectives is relevant in this context:
• The private economic or business perspective assesses the economics of a wind turbine or park in the
context of the prevailing market and energy-political framework conditions. This perspective assumes some
prevailing market design (e.g. energy only spot markets) with perfectly competitive markets, and therefore
does not consider any market-distorting effects of barriers or failures in the form of externalities, such as
the noise impact or nearby settlements.
• The public of welfare economic perspective assesses the economics of increasing the share of wind power
to some target, and hence looks at societal rather than the project-level economics. Externalities may also
be considered in the analysis.
Both perspectives may employ similar economic metrics, e.g. Net Present Value (NPV), internal rate of return, or
payback period. If the results are favourable (often in comparison to an alternative), the project or policy target is
seen as economically attractive or ‘profitable’. Although both perspectives assess the economic attractiveness of
wind power, they differ in terms of the economic criteria employed. The different foci are for example reflected by
the assumed discount rate for NPV calculations. Whereas the business perspective employs a private discount rate,
often in the range of 8-15%, the welfare perspective uses societal discount rates, which are typically in the range
3-5% [167]. Because the discount rate very strongly affects the economics of capital-intensive technologies like
wind power, the two perspectives generate very different results of the economic potential. Almost all studies
reviewed here adopt the business perspective. We return to this perspective issue in section 5.
Of course, the business perspective – essentially the profitability of projects – depends not only on costs,
but also on the revenue side, where the situation is changing from fixed-price to market premium schemes and
auctions, and increasingly towards putting wind power on the general electricity market [168,169].
Assessing the economic potential is highly complicated, not only because economic parameters may vary
widely across projects, but also because both costs and market conditions – and hence possible revenues – change
over time. The impact of cost reductions on potential assesments can be profound. For example, recent studies have
found that offshore wind at certain sites and in mature markets does not require subsidies [170], and because onshore
wind generally has lower costs [171–173] the same will very likely apply to onshore wind too.
Consequently, many studies economically assess the technical potential, by employing some of the metrics
outlined above in relation to discounted cash flow calculations. For example, a common approach is to relate the
levelized costs of energy (LCOE) to the possible revenues, for example the average market price or achievable tariff
[36]. These studies then find a potential generation that can be achieved at or below some particular cost. The LCOE
comprises the total discounted costs over the the lifetime divided by the discounted energy production over the
lifetime, and is a comprehensive metric to compare generation costs. But it ignores system integration and other
external costs and because project-specific data is often lacking, it usually relies on generic assumptions for the cost
of capital [174] (see next sections). Because of its intuitive simpicity, LCOE has become the dominant metric for
costs of renewable power [173,175]. It often employs the weighted average cost of capital (WACC) concept [176],
which accounts for the source and interest rates applied to the capital to finance the project.
ii. Economic characteristics of turbines
Onshore wind energy is a near-zero marginal cost generator, which means that (almost) all of the cost is attributed
to the construction of the asset, and 70-80% [177] of the costs are made up by the turbine itself. IRENA states the
total installed costs (i.e. turbine, foundation, grid connection, etc.) in 2019 at 1,473 $2019/kW [173], whereas the U.S.
Department of Energy sees turbine (only) costs of around 800 $2018/kW [178]. This is roughly comparable with the
“2018 Cost of Wind Energy Review” by NREL, which assumes 1011 $2018/kW for the entire wind turbine, with the
turbine rotor module accounting for 29%, the nacelle for 49%, and the tower for 22% of the cost respectively. The
difference between the wind turbine and the total installed cost of 1470 $2019/kW arises from grid connection cost
(32%), foundation (13%), construction and engineering (20%), engineering (8%) and financial cost (28%) [179].
13Most sources however only provide the cost for the turbines and total costs and overlook some specific turbine
characteristics, such as the drive train (i.e. gearbox or gearless), tower construction, tower height or rotor diameter.
Table 5 gives an overview ot HAWT economic characteristics according to selected studies.
Markets for wind turbines strongly depend on regional and national energy-political and economic
framework conditions, resulting in wind turbine prices being location-specific. Hence, modelling LCOEs can be
carried out using a bottom-up approach, where all components such as blades, towers and balance of plant are
costed, even going as far as indicating materials prices [180,181]. This is often carried out by academics and project
developers, for example based on NREL’s Wind Turbine Cost Model (LandBOSSE) [182]. This approach cannot
reliably reveal the exact costs, however, due to the dynamic nature of turbine markets, their location-dependence
and the reliance on privilieged, business-sensitive, and thus non-publicly available, information. This is addressed
by analysts, such as the Bloomberg NEF wind turbine price index, which averages prices over many turbine types
[183]. Hence, other approaches have evolved, which either cicrumvent the costing by using audited information to
estimate costs [184] or using auction results [170,185], with both methods yet to be applied to onshore wind. Audits
can be used to verify LCOE figures from the literature to match up “with the books” of publicly traded companies,
based on the real costs of a projects from an accounting point of view. Auctions on the hand can provide an
up-to-date proxy for LCOE in the near future, by estimating the underlying revenues of a particular project – and
under the assumption of low cost margins, this is an estimate of the near-future LCOE.
The WACC has a large influence on the LCOE of renewables [186–188], which is potentially larger than
the differences in CAPEX across countries. For onshore wind power in Europe, average WACCs vary strongly,
from 3% in Germany to 11.7% in Greece, whereas the data for offshore wind is sparse, but range from around 6%
in Germany and Belgium to over 12% in Great Britain [187]. Reducing the WACC from 7.5% to 5% reduces the
LCOE by around 20%, so different assumptions will have a astrong effect on LCOE [173]. Hence, support schemes
that lower project risk, such as feed-in tariffs have attracted low interest rate financing, enabling the relatively low
WACC to contribute to the cost reductions in these technologies, alongside reductions in capex and opex and an
increase in the capacity factor over time. On the other hand, if general interest rates increase again after the economic
crisis, wind power WACCS and hence LCOEs may increase again.
Table 5 Overview of HAWT economic characteristics from selected studies. The specific year of currencies is indicated, if known from the
source.
Total capex Turbine Operation and WACC Year (reported year, Region
per kW only per Maintenance if given, otherwise
kW (O&M) cost source year)
IRENA [173] $20191473 0.0060-0.0200 7.5% (real, 2019 Global
$2019/kWh OECD average
countries
and China)
10% (real,
rest of the
world)
US DoE [178] $20181470 $2018700- 29 $2018/kW/a (2010- 2018 United States
900 2017)
Gass et al. [159] €1700 €1400 €0.0018 /kW/a 7% 2013 Austria
European €1000 4% 7.8% 2005 Europe
Environment of capex per year1 (private,
Agency [5] (40.0 €/kW/a) presumed
real)
4%
(public)
European €720 4% 7.8% 2020 Europe
Environment of capex per year1 (private)
Agency [5] (28.8 €/kW/a) 4%
(public)
14You can also read