The Energy River: Realising Energy Potential from the River Mersey - Amani Becker, Andy Plater Judith Wolf - University of Liverpool
←
→
Page content transcription
If your browser does not render page correctly, please read the page content below
The Energy River:
Realising Energy Potential from the River Mersey

                                   June 2017

                         Amani Becker, Andy Plater
 Department of Geography and Planning, University of Liverpool, Liverpool L69 7ZT

                                  Judith Wolf
                 National Oceanography Centre, Liverpool L3 5DA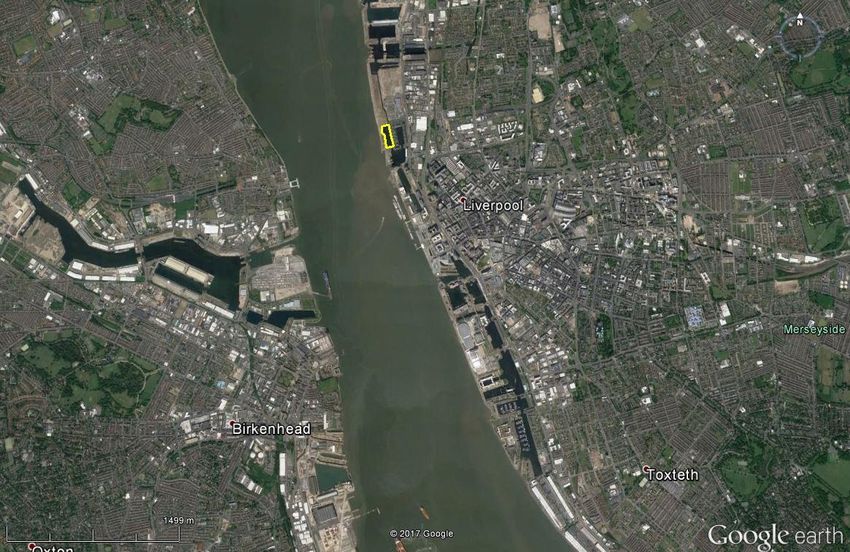
This page has been intentionally left blank

                    ii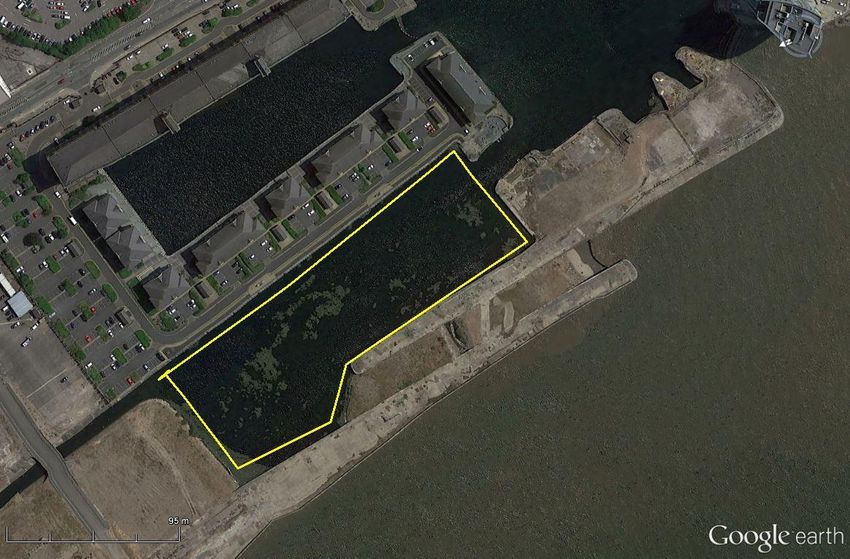
Acknowledgements
The work herein has been funded jointly by the University of Liverpool’s Knowledge Exchange and
Impact Voucher Scheme and Liverpool City Council.

The contribution of those involved in the project through Liverpool City Council, Christine
Darbyshire, and Liverpool City Region LEP, James Johnson and Mark Knowles, is gratefully
acknowledged.

The contribution of Michela de Dominicis of the National Oceanography Centre, Liverpool, for her
work producing a tidal array scenario for the Mersey Estuary is also acknowledged.

Thanks also to the following individuals approached during the timeframe of the project: John
Eldridge (Cammell Laird), Jack Hardisty (University of Hull), Neil Johnson (Liverpool City Council) and
Sue Kidd (University of Liverpool).

                                                   iii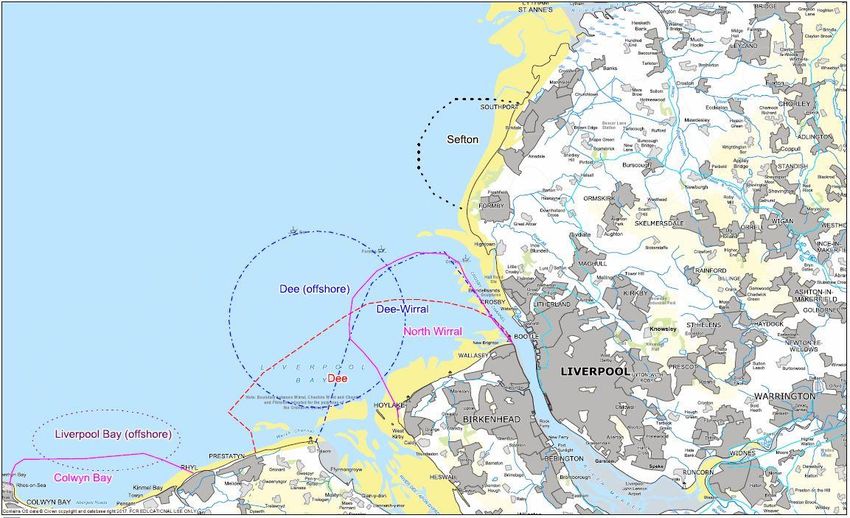
This page has been intentionally left blank

                    iv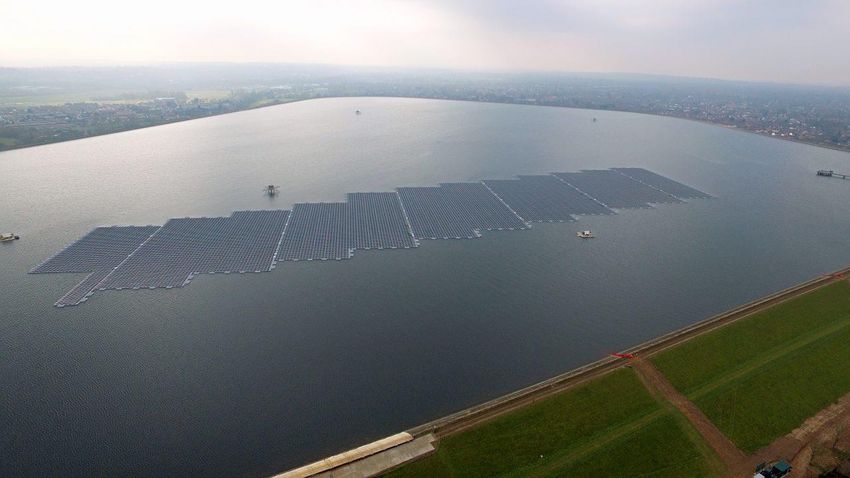
Executive summary

This report has been commissioned by Liverpool City Council (LCC) and joint-funded through the
University of Liverpool’s Knowledge Exchange and Impact Voucher Scheme to explore the potential
to obtain renewable energy from the River Mersey using established and emerging technologies.

The report presents an assessment of current academic literature and the latest industry reports to
identify suitable technologies for generation of renewable energy from the Mersey Estuary, its
surrounding docks and Liverpool Bay. It also contains a review of energy storage technologies that
enable cost-effective use of renewable energy. The review is supplemented with case studies where
technologies have been implemented elsewhere.

Consideration is also given to strategic planning and stakeholder involvement in taking forward
renewable energy projects. These matters are broadly described, with links to the work being carried
out in other UK estuaries where similar priorities are being taken forward.

Liverpool currently generates 26 GWh/yr of its annual energy (electricity and heat) from renewable
sources, about 0.5% of consumption. From 2005 to 2014 the city successfully reduced its per capita
CO2 emissions by 31.63%. However, this renewable electricity production comes from a small range
of technologies (solar photovoltaics (PV), onshore wind and sewage gas). The city must now find
ways to maintain its success in reducing CO2 emissions and increase its renewable energy
generation.

The large tidal range of the Mersey Estuary presents an ideal opportunity to generate energy. The
potential for tidal range energy has long been recognised and several studies have been carried out
to assess the feasibility of a tidal barrage. The main issues in generating electricity from a tidal
barrage are those of cost, navigation and the environment. Whilst the Mersey has the advantage of
a narrow channel in comparison to other UK estuaries, which would reduce construction costs,
locations for a tidal barrage are restricted due to access for commercial shipping and several areas
having environmental designations. Previous feasibility studies have identified a preferred barrage
location running between Rock Ferry and Dingle. A barrage on the Mersey could generate between
1.0 and 1.5 TWh electricity per year, representing up to two-thirds of Liverpool’s current electricity
requirement.

Other tidal energy technology options are tidal lagoons and tidal current turbines. Lagoons would
not be suited to the confines of the estuary, but have the potential to be sited within the wider
Liverpool Bay area and are predicted to generate similar amounts of electricity (between 0.4 and 4.9
TWh per year, dependent on size and location) to a barrage. It may be possible to locate tidal
current turbines within the estuary, but due to the shallow water and need for shipping access these
would need to be quite small and are only predicted to generate approximately 1 GWh per year
from an array of 130 turbines. Tidal current turbines have the advantage that they could be
deployed incrementally and costs are likely to reduce as the technology matures.

Other renewable energy options considered in the report include the deployment of additional wind
turbines and solar PV. Previous reports by ARUP and ASC Renewables Ltd. have identified areas in
Liverpool and Sefton, which could be suitable for deployment of additional wind turbines. There is
also the potential to co-locate wind turbines with tidal energy technology by placing them on top of

                                                   v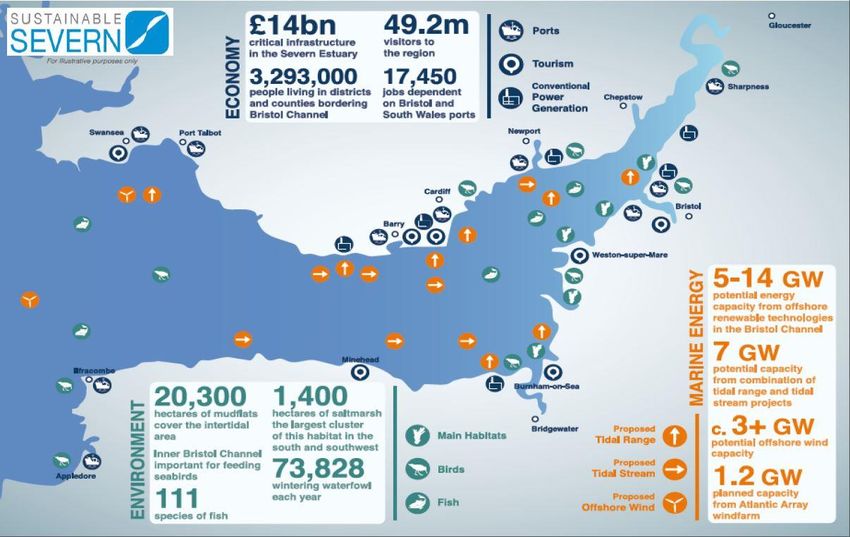
barrage or lagoon walls. The potential for additional solar PV generation proposes the use of an
established technology in a new setting, i.e. floating them on water. Floating solar PV has recently
been used on reservoirs in the UK and although it has not yet been used in saline water, quick easy
deployment makes them an attractive option.

Locating water source heat pumps (WSHPs) in Liverpool’s docks has the potential to provide heating
and hot water. A funding bid for a feasibility study has been submitted by LCC to the Department for
Business, Energy and Industrial Strategy (BEIS) Heat Network Development Unit (HNDU) to further
investigate the potential of this technology for Liverpool.

As the energy generation mix moves towards more renewable technologies there is the need to
consider energy storage, thus increasing flexibility, addressing intermittency of supply, and reducing
costs. Energy storage can be deployed at a range of scales, enabling increased demand-side
management in the home, bulk storage and frequency regulation - all of which will be required in
the future. Most of the world’s energy storage is currently provided by pumped hydro, which is the
only mature technology. However, energy storage is a quickly developing area with many
demonstration projects underway and technologies such as lithium-ion batteries and flywheels now
being deployed. Any new large infrastructure, such as a barrage, should have storage installed
alongside it to take advantage of the cost savings in shared grid infrastructure.

Governance and strategic planning are important in ensuring the legitimacy of any large-scale
project and in guaranteeing that the various uses of the estuary are properly considered. Any future
development must therefore be carried out with full regard for the environment and in consultation
with stakeholders. There are several existing groups associated with the river, such as Mersey
Maritime, the Healthy Rivers Trust, the Maritime Knowledge Hub and the Mersey River Task Force,
which form part of the wider stakeholder community for successfully achieving energy from the
Mersey.

In summary, whilst tidal range technology would provide the greatest amount of electricity from the
Mersey, it would also have the greatest upfront cost. It may be possible to deploy a range of tidal
technologies (barrage, lagoon and tidal stream turbines) within the estuary and out into Liverpool
Bay, but this must be explored fully with respect to their interactions and effects on current velocity
and the environment. There are other potential sources of energy, i.e. wind, solar and WSHPs, which
could be deployed alongside exploitation of tidal energy. Due to their scale, these technologies can
be deployed more quickly ahead of any larger scheme. The development of a strategic plan would
be a useful step towards understanding the balance between competing interests in Mersey Estuary.

                                                  vi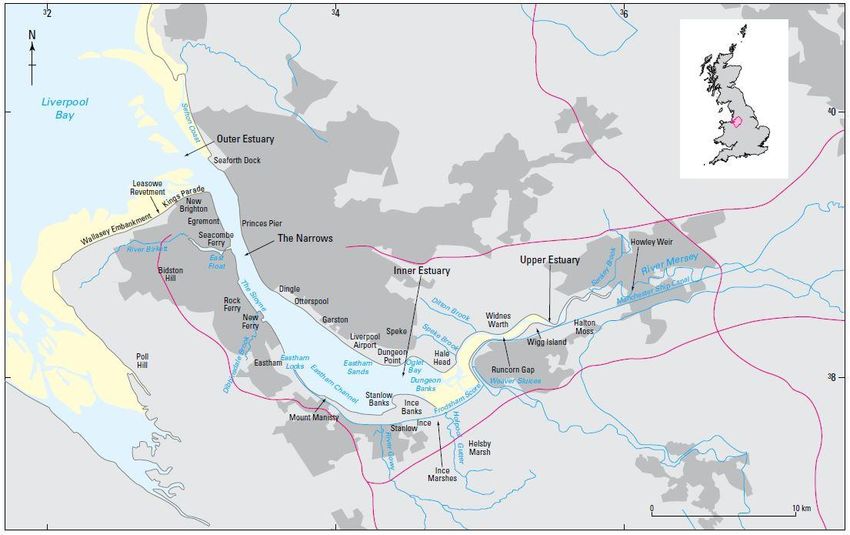
Contents
1.      Introduction ............................................................................................................................. 1

1.1     Renewable Energy in Liverpool City Region ............................................................................ 2

1.2     Current levels of energy consumption, emissions and generation ......................................... 3

1.2.1   Current energy consumption in Liverpool and Liverpool City Region .................................... 3

1.2.1   CO2 emissions .......................................................................................................................... 5

1.2.2   Renewable energy generation (electricity and heat) ............................................................. 6

1.3     The need for energy storage ................................................................................................... 8

1.4     The Mersey Estuary ................................................................................................................. 9

2.      Tidal Energy options .............................................................................................................. 12

2.1     Tidal Range ............................................................................................................................ 12

2.1.1   Tidal Barrage ......................................................................................................................... 13

2.1.2   Suitability of the Mersey for energy generation by tidal barrage ........................................ 18

2.1.3   Tidal Lagoon .......................................................................................................................... 23

2.1.4   Suitability of Tidal Lagoons ................................................................................................... 24

2.1.5   Tidal Reef .............................................................................................................................. 26

2.1.6   Dynamic Tidal Power ............................................................................................................ 27

2.2     Tidal stream ........................................................................................................................... 28

2.2.1   Suitability of tidal stream turbines for the Mersey ............................................................... 36

2.3     Combined tidal range and stream (i.e. Tidal fence) .............................................................. 37

2.4     Potential for tidal power in the Mersey ................................................................................ 37

3.      Other renewable electricity options...................................................................................... 38

3.1     Wave ...................................................................................................................................... 38

3.2     Wind ...................................................................................................................................... 40

3.2.1   More wind power for Liverpool? .......................................................................................... 43

3.3     Solar Photovoltaic (PV) .......................................................................................................... 43

3.3.1   Floating solar photovoltaics (PV) .......................................................................................... 44

3.3.2   Floating solar photovoltaics (PV) in Liverpool Docks ............................................................ 46

4.      Renewable heat option ......................................................................................................... 48

4.1     Water source heat pumps ..................................................................................................... 48

                                                                     vii
4.1.1   Heating from water source heat pumps ............................................................................... 50

4.1.2   Using surface water for cooling ............................................................................................ 51

4.1.3   Water Source Heat Pumps in Liverpool ................................................................................ 52

5.      Energy storage ....................................................................................................................... 52

5.1     Gravitational/ mechanical/thermomechanical ..................................................................... 55

5.1.1   Pumped Hydro ...................................................................................................................... 55

5.1.2   Ground Breaking Energy Storage (GBES) .............................................................................. 55

5.1.3   Advanced Rail Energy Storage (ARES) ................................................................................... 56

5.1.4   Compressed Air Energy Storage (CAES) ................................................................................ 56

5.1.5   Flywheel ................................................................................................................................ 57

5.1.6   Liquid Air Energy Storage (LAES) ........................................................................................... 58

5.2     Electrochemical (batteries) ................................................................................................... 58

5.2.1   Conventional batteries .......................................................................................................... 58

5.2.2   Flow batteries ....................................................................................................................... 60

5.3     Electrical ................................................................................................................................ 60

5.3.1   Supercapacitor ...................................................................................................................... 60

5.3.2   Superconducting magnetic energy storage (SMES) .............................................................. 60

5.4     Chemical ................................................................................................................................ 61

5.5     Thermal.................................................................................................................................. 61

5.5.1   Sensible Heat Storage ........................................................................................................... 61

5.5.2   Latent Heat Storage .............................................................................................................. 61

5.6     Summary ................................................................................................................................ 62

6.      Governance and strategic planning ....................................................................................... 64

6.1     Identifying stakeholders ........................................................................................................ 66

7.      Conclusions ............................................................................................................................ 66

                                                                     viii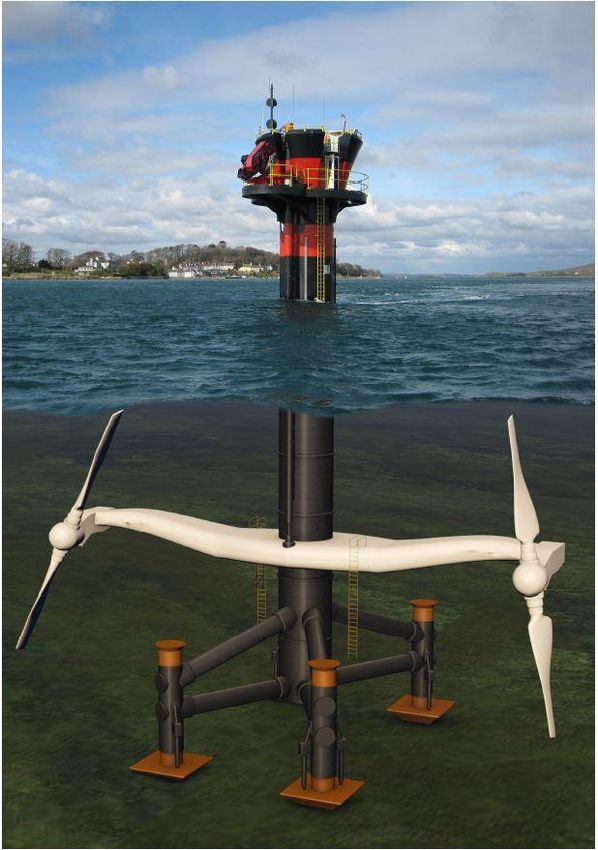
Figures
Figure 1.1. Liverpool City within Liverpool City Region (LCR) 2
Figure 1.2. Estimated current annual cost of gas and electricity use by sector in Liverpool and
the LCR 5
Figure 1.3. Trend in per capita CO2 emissions expressed as a percentage of 2005 emissions.
Baseline per capita emissions for 2005 shown in legend (Source: UK local authority and
regional carbon dioxide emissions national statistics: 2005-2014,
https://www.gov.uk/government/collections/uk-local-authority-and-regional-carbon-dioxide-
emissions-national-statistics) 6
Figure 1.4. Sources of renewable electricity and heat in Liverpool and Liverpool City Region
(LCR) in 2014 (sources: https://www.gov.uk/government/statistics/regional-renewable-statistics
and https://renewablelocator.green-alliance.org.uk/) 7
Figure 1.5. The installed generation capacity mix by 2030 under a range of scenarios
(Lehmann et al., 2016) 9
Figure 1.6. The Mersey estuary (Ridgway et al., 2012) 10
Figure 1.7. Depth colour-scaled image of estuary morphology, viewed from the north
(Aggidis and Benzon, 2013) 10
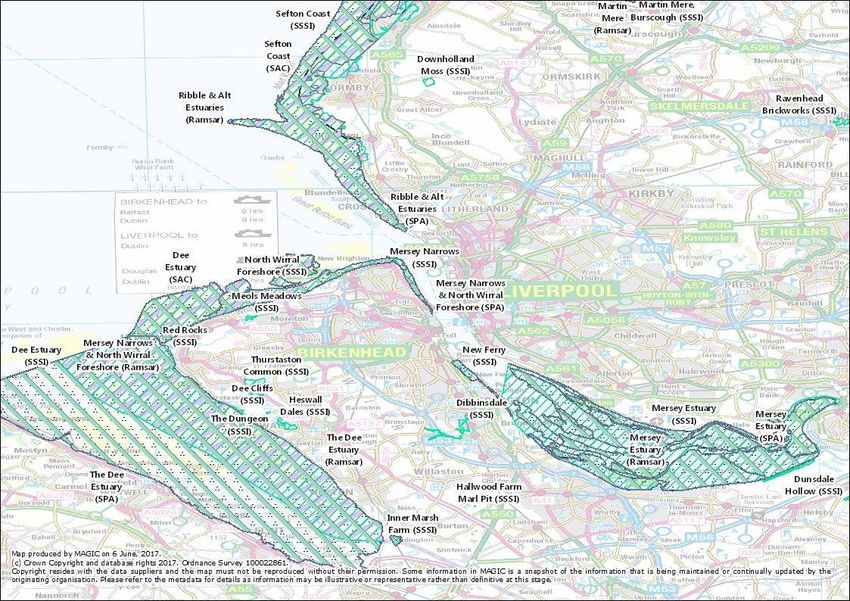
Figure 1.8. Environmental designations of the Mersey Estuary and Liverpool Bay 11
Figure 2.1. Locations with the potential to generate energy using tidal range (Hammons, 1993) 12
Figure 2.2. The modes of operation of a tidal barrage or lagoon and an illustration of a
turbine caisson. Dashed lines are basin water level and solid lines are sea water level.
HWST, high water spring tide: LWST, low water, spring tide. (Burrows et al., 2009a,
Yates et al., 2013) 14
Figure 2.3. La Rance tidal barrage at St. Malo, France (DOE Global Energy Storage
Database, 2016) 17
Figure 2.4. Lines for a Mersey Barrage proposed by the Marinetech North West (1983, 1985)
(Reilly and Jones, 1990) 19
Figure 2.5. Locations for Mersey Tidal Power project feasibility study (Mersey Tidal Power,
2010b) 20
Figure 2.6. Effect of different generating regimes on the intertidal area of the Mersey during
a typical (a) spring tide and (b) neap tide (Wolf et al., 2009) 22
Figure 2.7. Location of lagoons in Table 2.3. With an additional lagoon located on the
Sefton coast 25
Figure 2.8. A low-head tidal reef design (Atkins Ltd., 2008) 26
ix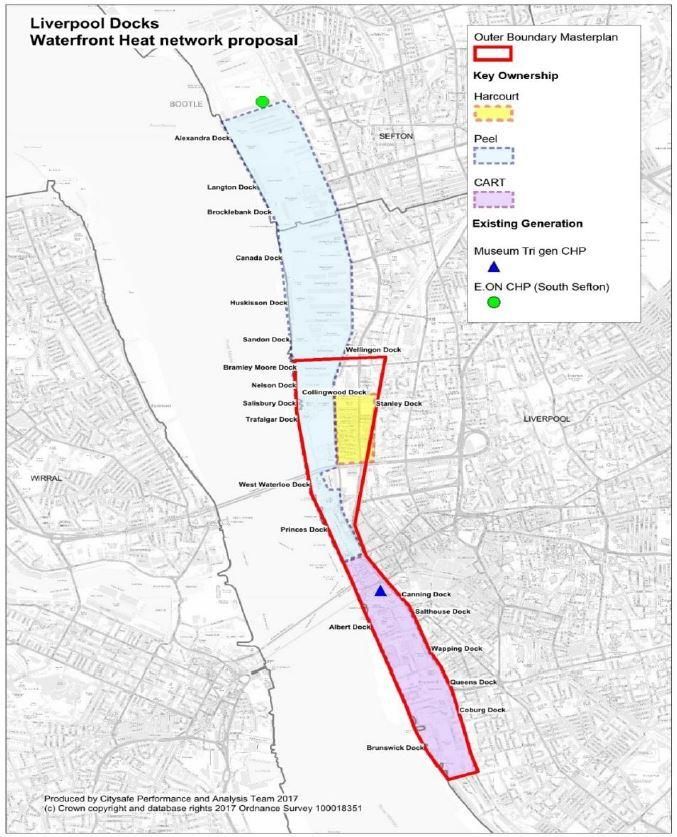
Figure 2.9. Illustration of dynamic tidal power (ARCADIS, 2014)                                   27

Figure 2.10. Tidal diffraction by Dynamic Tidal Power (Park, 2017)                                28

Figure 2.11. Some examples of tidal steam device designs (a) an open-centre turbine being
deployed (Openhydro, 2016), (b) a floating tidal energy platform (Bluewater, 2017), (c) a tidal
array (Tidal Energy Today, 2015), (d) EEL Energy undulating membrane (EEL Energy, 2015),
(e) a cross-flow turbine (Tidal Energy Research Group, 2016) and (f) a single foundation array
(Schottel Hydro, 2017)                                                                            30

Figure 2.12. Uldolmok power station and one of the triple helical turbines (Park, 2017)           31

Figure 2.13. Seagen S turbine (Keenan et al., 2011)                                               33

Figure 2.14. Neptune Proteus NP1000 (Hardisty, 2012)                                              34

Figure 2.15. Torcado turbines in the Eastern Scheldt (Torcado B.V., 2015a)                        35

Figure 2.16. Average power density (kWm-2), potential capacity factor (%) and water depth (m)
for the Mersey estuary and Liverpool Bay. Suitable locations for the siting of horizontal axis
tidal stream turbines are marked with triangles (De Dominicis, 2017, pers. comm., 2nd June)    36

Figure 3.1. Examples of oscillating water column (OWC), oscillating body convertor (OBC) and
overtopping convertor devices (Open EI, 2013)                                                     39

Figure 3.2. Growth in capacity and rotor diameter of wind turbines, 1985-2016 (IEA-ETSAP
and IRENA, 2016)                                                                                  41

Figure 3.3. Global cumulative installed capacity in offshore wind energy, 2016 (GWEC, 2017)       42

Figure 3.4. Floating solar plant at Queen Elizabeth II Reservoir, Surrey (Ciel & Terre, 2016)     45

Figure 3.5. Location of West Waterloo Dock, 53o24’50”N, 3o0’8”W. Maps from Google Maps            47

Figure 3.6. Average daily solar irradiance in Liverpool on a monthly and annual basis
(RenSMART, 2010)                                                                                  48

Figure 4.1. Location plan for WSHP feasibility study                                              52

Figure 5.1. Power output from a Mersey Barrage (ebb generation) over a spring-neap tidal
cycle (Burrows et al., 2009a)                                                                     53

Figure 5.2. Energy storage technology maturity curve (AECOM Australia Pty Ltd., 2015)             54

Figure 5.3. Electricity storage technologies comparison showing discharge time against power
capacity, typical efficiencies and potential uses (AECOM Australia Pty Ltd., 2015)                63

Figure 6.1. Strategic plan for the Severn Estuary (Sustainable Severn, 2017)                      65

                                                    x
Tables
Table 1.1. Energy consumption in (a) Liverpool and (b) LCR in 2014
(source: https://www.gov.uk/government/collections/total-final-energy-consumption-at-
sub-national-level) 4
Table 1.2. Energy generation in (a) Liverpool and (b) LCR in 2014 (sources:
https://www.gov.uk/government/statistics/regional-renewable-statistics and
https://renewablelocator.green-alliance.org.uk/) 7
Table 2.1. Potential annual energy output from tidal barrages in the UK 13
Table 2.2. Comparison of configuration and predicted energy outputs of previous Mersey
barrage studies 21
Table 2.3. Comparison of configuration and predicted energy outputs of previous lagoon
studies, locations shown in Figure 2.7. 25
Table 6.1. Typology and roles of stakeholders with illustrative examples
(Newton and Elliott, 2016) 66
xiThis page has been intentionally left blank
xii1. Introduction
Secure, affordable energy is a prerequisite to the functioning of any city and is vital to economic
growth. Energy powers the transport system, provides heating and cooling to buildings, enables
production of goods and services and is essential to modern technology. Energy is fundamental to
the city’s infrastructure, from the supply of water and provision of healthcare to waste disposal and
communications systems. Cities already account for nearly two-thirds of global energy use and the
world’s urban population is growing, with urban energy use increasing more quickly that the
population (IRENA, 2016).
Liverpool is a city located on the River Mersey in the Northwest UK with a population of around
480,000, it forms part of the Liverpool City Region (LCR) - one of England’s recently devolved
combined authorities. LCR has a population of over 1.5 million and is regarded as one of the major
drivers of the Northern Powerhouse concept.
The UK Climate Change Act (2008) set a target to reduce greenhouse gas emissions by 80% by 2050
from a 1990 baseline. In line with the act, LCC committed to a reduction in carbon emissions of 35%
(from 1990 baseline) by 2024 (LCC, 2009). LCR also committed to a 20% reduction in carbon
emissions by 2020 as part of the EU Covenant of Mayors (2017). All these targets have, to an extent,
been superseded by the tougher ambitions of the Paris Agreement, negotiated by 195 countries at
the 21st Conference of the Parties of the United Nations Framework Convention on Climate Change
(UNFCCC) in 2015 and effective from 4th November 2016 (UNFCCC, 2017). The Paris Agreement is
the world’s first comprehensive climate agreement and further embeds decarbonisation into
national energy policy. It was agreed that global average temperature increases should be kept
below 2 oC and if possible to 1.5 oC, this will require emissions to reach zero by the second half of
this century. It will be achieved by countries setting national determined contributions (NDCs), which
will be progressively increased, and through a global stocktake every five years to assess progress.
The need to decarbonise the energy system has already driven changes in the energy supply market,
with traditional energy sources being replaced by a divergent mix of technologies. The electricity
generation sector is on trajectory to hit the UK 2020 renewable targets, but heating and transport
still need to make considerable progress (National Grid, 2016). The demand for electricity is
currently increasing due to the decarbonisation of the transport and heating sectors (Lehmann et al.,
2016).
The River Mersey has the potential, as a source of renewable energy, to address the continued and
growing need for electricity whilst meeting agreed emissions targets. This report will explore the
options for generating energy from the River Mersey by reviewing the current status of a range of
technologies and assessing their potential for deployment in and around the Mersey. In light of the
intermittent nature of renewable energy generation, energy storage is recognised as an important
concept which may allow more efficient use of energy and impart savings with the potential to
reduce energy prices (Lehmann et al., 2016), therefore energy storage will also be discussed. A
detailed assessment of the estimated investment and costs of energy for potentially viable
technologies is beyond the scope of this report.
The report will provide: (i) a review of renewable energy generation technologies potentially suitable
for estuarine and coastal locations, (ii) a range of suggestions for renewable energy installations in
1and around the Mersey, (iii) a discussion on the need for energy storage and review of storage
technologies, and (iv) a discussion on the need for strategic planning and good governance for a
sustainable estuary.
1.1 Renewable Energy in Liverpool
Liverpool City, the area of responsibility of LCC, lies on the north shore of the Mersey. Liverpool is
one of the six council areas within LCR. It sits alongside Sefton, Knowsley and St. Helens on the north
of the estuary, Wirral to the south, and Halton on both the north and south banks of the eastern end
of the estuary (Fig 1.1). In addition to surrounding a large part of the Mersey Estuary, the larger LCR
has coastline on Liverpool Bay and the Dee Estuary. The LCR boundary encompasses offshore
windfarms in Liverpool Bay, which are in important source of renewable energy.
Whilst this report has been commissioned by LCC, its focus on the River Mersey and the potential to
use it as a source of energy may also have implications and present opportunities for the other
council areas in the LCR, particularly Wirral and Halton, which also border the Mersey estuary, and
Sefton which has a large stretch of coastline from the mouth of the estuary to the north of Liverpool
Bay.
Figure 1.1. Liverpool City within Liverpool City Region (LCR)
Liverpool and the LCR have an ongoing commitment to develop a low carbon economy with
sustainable economic growth decoupled from the consumption of fossil fuels. The LCR Sustainable
Energy Action Plan (SEAP) (LCR, 2012) outlined the region’s plans to achieve this goal by
2decentralising energy generation and supply through the use of low carbon and renewable fuels and
by utilising local supply chains, knowledge and skills. This work is ongoing, with the recent Carbon
Baseline Management Report (Upton, 2016) providing an overview of progress in support of an
update of the SEAP.
The River Mersey has been essential to the existence of Liverpool, responsible for its industrial and
urban development (Ridgway et al., 2012). For the future, it could provide the city and the wider
region with a renewable energy resource in support of low carbon goals. Indeed, the LCR Devolution
Agreement (HM Treasury, 2015) recognised that:
“A next step in the river's recent evolution could be to harness its huge tidal range to produce power
for the City Region's businesses and citizens.”,
and included a government commitment to support:
“Liverpool City Region by providing guidance to support Liverpool City Region’s development of a cost
effective tidal power scheme proposal for the River Mersey or Liverpool Bay that could generate low
carbon energy for businesses and consumers”
The Devolution Agreement (HM Treasury, 2015) also acknowledged that the River Mersey “has
undergone the greatest clean-up of any river in Europe over the last thirty years” and committed to
“the cleanest river standard by 2030”. This emphasizes the requirement for any energy extraction
from the river to be carried out sustainably and with full regard for the environment.
1.2 Current levels of energy consumption, emissions and generation
1.2.1 Current energy consumption in Liverpool and Liverpool City Region (LCR)
The City of Liverpool consumes 1.9 TWh electricity and 3.8 TWh gas every year, whilst for the LCR
these figures are 6.2 TWh and 13.8 TWh, respectively (2014 figures, Table 1.1).
The total cost to Liverpool of gas and electricity use by industrial, commercial and domestic sectors
is estimated at £340 million. The figure for LCR is £1150 million (Fig. 1.2). This estimate is based on
the domestic and industrial and commercial gas and electricity consumption in 2014 (Table 1.1) at
the average cost of gas and electricity to the domestic and non-domestic sectors in 20161.
1
Data on gas and electricity prices sourced from BEIS available from:
https://www.gov.uk/government/uploads/system/uploads/attachment_data/file/622615/QEP_Q117_tables_
annex.pdf and https://www.gov.uk/government/statistical-data-sets/gas-and-electricity-prices-in-the-non-
domestic-sector. Prices for non-domestic consumers include the climate change levy. Prices for domestic
consumers do not include standing charges.
3Table 1.1. Energy consumption in (a) Liverpool and (b) LCR in 2014 (source:
https://www.gov.uk/government/collections/total-final-energy-consumption-at-sub-national-level)
(a)
Industrial and Transport
Fuel Type Domestic Total
Commercial (road and rail)
(GWh) (GWh) (GWh) (GWh)
Coal 0.5 7.3 - 7.8
Manufactured solid fuels 0.8 9.7 - 10.5
Petroleum products 130.0 9.3 2,022.5 2,161.8
Gas 1,529.0 2,222.3 - 3,751.3
Electicity 1,201.5 731.1 - 1,932.6
Bioenergy and wastes - - - -
All fuels 2,861.8 2,979.7 2,022.5 7,864.0
(b)
Industrial and Transport
Fuel Type Domestic Total
Commercial (road and rail)
(GWh) (GWh) (GWh) (GWh)
Coal 36.7 56.9 - 93.6
Manufactured solid fuels 31.4 73.1 - 104.5
Petroleum products 1,394.2 59.5 7,851.5 9,305.2
Gas 5,978.0 7,841.4 - 13,819.4
Electicity 3,785.6 2,426.2 - 6,211.8
Bioenergy and wastes - - - 33.1
All fuels 11,225.9 10,457.1 7,851.5 29,567.6
4Figure 1.2. Estimated current annual cost of gas and electricity use by sector in Liverpool and the
Liverpool City Region (LCR) (see text for calculation details)
1.2.1 CO2 emissions
Emissions associated with energy use in 2014 in Liverpool were 2.06 Mt CO2, equating to
approximately 4.4 t CO2 per capita (BEIS, 2016), whilst in the LCR they totalled 8.09 Mt CO2, or 5.3 t
CO2 per capita. Although the per capita figures are higher for the LCR than Liverpool, over the last 10
years they have been reducing at a similar rate (Fig. 1.3). All the councils within the LCR have
reduced per capita emissions of CO2 since 2005. Sefton saw the smallest reduction, with CO2
emissions 2014 only 12.54% less than in 2005; this may in part be due to Sefton having the lowest
per capita emissions in the LCR at the 2005 baseline. Halton has seen the greatest reduction in CO2
emissions which were 40.20% less in 2014 than 2005, this compares to a national emissions
reduction of 27.83%. The difference in the trajectory of Sefton’s per capita emissions compared to
the rest of the LCR (Fig. 1.3) could be because trends at local authority level tend to show greater
variation than at a regional level, with changes at a single industrial site having a big impact on
emissions trends (DECC, 2016).
5Figure 1.3. Trend in per capita CO2 emissions expressed as a percentage of 2005 emissions. Baseline
per capita emissions for 2005 shown in legend (Source: UK local authority and regional carbon
dioxide emissions national statistics: 2005-2014, https://www.gov.uk/government/collections/uk-
local-authority-and-regional-carbon-dioxide-emissions-national-statistics)
1.2.2 Renewable energy generation (electricity and heat)
Liverpool generates 19.2 GWh of electricity and 6.8 GWh of heat per year from renewable sources,
just 0.46% of what is used in the city. The LCR as a whole does slightly better at 432.7 GWh
electricity and 416.7 GWh heat per year from renewable generation, 6.97 % of its electricity and
3.02% of heat are from renewable sources (Table 1.2). A substantial proportion of this is generated
by the offshore windfarm at Burbo Bank and the INEOS energy from waste (EfW) plant in Halton.
The current mix of electricity generation in Liverpool is limited to sewage gas, solar PV and onshore
wind, whilst heat is generated through biomass, heat pumps and solar. LCR electricity generation is
more diverse and heat generation is dominated by EfW, as previously stated (Fig. 1.4).
6Table 1.2. Energy generation in (a) Liverpool and (b) LCR in 2014 (sources:
https://www.gov.uk/government/statistics/regional-renewable-statistics and
https://renewablelocator.green-alliance.org.uk/)
(a) Electricity Heat Total
MWh 19,237 6,807 26,356
Percentage of consumption (%) 1.00 0.18 (a) 0.46
(b) Electricity Heat Total
MWh 432,677 416,664 891,290
Percentage of consumption (%) 6.97 3.02 (a) 4.24
(a) Gas consumption met from renewable heat
Liverpool Liverpool City Region
Figure 1.4. Sources of renewable electricity and heat in Liverpool and Liverpool City Region (LCR) in
2014 (sources: https://www.gov.uk/government/statistics/regional-renewable-statistics and
https://renewablelocator.green-alliance.org.uk/)
7At around 480,000 residents, Liverpool represents 0.73%2 of the UK population and contributes
£10.9bn1, equivalent to 0.66%1, to UK Gross Value Added (GVA). The city uses 0.67%3 of the
electricity and 0.77%2 of the gas used in the UK and emits 0.51%4 of the CO2. It currently generates
just 0.03%5 of the UK’s renewable electricity.
The LCR has over 1.5 million residents, which represents 2.34%1 of the UK population, and
contributes £29.4bn1, equivalent to 1.78%1, to UK GVA. The region uses 2.10%2 of the electricity and
2.78%2 of the gas used in the UK and emits 2.00%3 of the CO2. It generates just 0.67%4 of the UK’s
renewable electricity.
1.3 The need for energy storage
A recent report for the Carbon Trust (Lehmann et al., 2016) set out the requirement for increased
energy storage, which is driven by changes in the way that energy is being generated, transported
and consumed in the UK. These trends are: the large-scale deployment of wind power; a shift to
distributed generation; the closure of large conventional generating plant; and changes in demand
profiles.
In order to meet renewable generation and CO2 emission targets, energy generation by large-scale
wind power is increasing. If all onshore and offshore projects (in planning, consented and under
construction) were to go ahead the nationally installed capacity of wind power would see a three-
fold increase to 44.6 GW (Lehmann et al., 2016). In the UK, installed solar PV saw a five-fold increase
from 2011 to 2014 and the installed coal-fired capacity has decreased by 9 GW since 2011 (Lehmann
et al., 2016). Additionally, in order to meet emissions targets, heat and transport are likely to be
electrified, thus increasing electricity demand.
The impacts of these trends are: issues of balancing supply and demand; problems in maintaining
the capacity margin (required to insure peak demands are met); a greater need for flexible
generation; a reduction in the efficiency of conventional plant (due to more start-ups because of the
need to balance renewable generation); and impacts on the local distribution networks, which were
not designed to cope with distributed generation. The final point is particularly pertinent in that a
recent report (Jackson et al., 2016) attested that, within the Liverpool area and across the LCR,
electricity network capacity is likely to constrain economic growth. It also noted that issues of
2
calculated using 2015 figures for population and GVA available from https://liverpool.gov.uk/council/key-
statistics-and-data/data/
3
calculated using 2014 data on sub-national energy consumption in the UK available from
https://www.gov.uk/government/collections/total-final-energy-consumption-at-sub-national-level
4
calculated using 2014 data for CO2 emissions available from https://www.gov.uk/government/collections/uk-
local-authority-and-regional-carbon-dioxide-emissions-national-statistics
5
calculated using 2015 renewable electricity statistics available from
https://www.gov.uk/government/statistics/regional-renewable-statistics
8security of supply and system resilience could impact business confidence, and highlighted the issue
that the ability to generate electricity is also likely to be constrained by grid capacity.
The Carbon Trust report (Lehmann et al., 2016) concluded that, under the National Grid’s “Gone
Green” scenario (Fig. 1.5) annual savings of up to £2.4 billion could be achieved by 2030 and under a
“Market-driven Approach” scenario (Fig. 1.5) savings of £7 billion could be achieved through a
combination of storage deployment, improved utilisation of existing generation assets and reduced
investment in new generation assets. The majority of savings (~ 90%) are achieved through
avoidance of fuel costs, i.e. by better utilisation of renewable assets, less energy is wasted, and there
is less requirement for back-up generation by gas plant, which saves money by reducing the need for
carbon capture and storage (CCS). Additional savings are due to the avoidance/delay of investment
in the distribution network, which is made possible by storage.
Figure 1.5. The nationally installed generation capacity mix by 2030 under a range of scenarios
(Lehmann et al., 2016)
1.4 The Mersey Estuary
The Mersey catchment covers some 5000 km2 of Merseyside, Greater Manchester, Cheshire,
Derbyshire and Lancashire (Ridgway et al., 2012) with the river running from the confluence of the
rivers Goyt and Tame at Stockport to the Irish Sea at Liverpool Bay. The area seaward of Perch Rock
is dominated by estuarine processes and may therefore also be considered as the outer estuary
(Sefton Council, 2013). The estuary can be divided into four main sections: Upper, Inner, Narrows
and Outer (Fig. 1.6).
9The Mersey Estuary has an unusual “banana” shaped profile which reflects the influence of the
bedrock geology and Pleistocene deposits (Ridgway et al., 2012). The depth of the estuary reduces
dramatically where it widens upstream of the narrows (Fig. 1.7).
Figure 1.6. The Mersey estuary (Ridgway et al., 2012)
Figure 1.7. Depth colour-scaled image of estuary morphology, viewed from the north (Aggidis and
Benzon, 2013)
10The Mersey occupies a highly urbanised and industrialised drainage basin and was once regarded as
one of the most polluted estuaries in Europe. This was addressed by the Mersey Basin Campaign
(MBC) which ran from 1985 to 2010 and transformed the Mersey by improving the water quality and
regenerating the waterside. The estuary, in common with most other UK estuaries, has several
environmental designations (Fig. 1.8)
Although it must be recognised that the River Mersey is influenced by its entire catchment and that
developments in the estuary are likely to have upstream effects, for the purposes of this report, the
area of interest encompasses the length of the Mersey Estuary from Liverpool Bay, as far inland as
Widnes and Runcorn, i.e. the Outer and Inner Estuaries and the Narrows.
Figure 1.8. Environmental designations of the Mersey Estuary and Liverpool Bay
112. Tidal Energy options
Unlike other sources of renewable energy, tides are an extremely reliable and predictable power
source. Tidal power can be harnessed in two ways, through tidal range (in which potential energy
from the difference in head height is harnessed as water passes through turbines) or tidal stream
(which relies on the kinetic energy of the tidal current).
2.1 Tidal Range
Technologies that harness tidal range energy include barrages, lagoons and tidal reefs. Good
resources exist where large water masses flow into bays or estuaries in macrotidal (defined as tidal
ranges of 4 m or more) areas. Worldwide, locations with the greatest tidal ranges are in Canada, the
UK, Korea, China, etc. (Fig. 2.1). It is estimated that approximately 500 to 1000 TWh per year could
be generated from tidal range resources worldwide (Baker, 1991). The resource in the UK is
estimated at 50 TWh annually (Hammons, 1993), mainly on the west coast where tidal range is high,
with potential outputs from some of the major estuaries shown in Table 2.1. Tidal range energy
potential is proportional to the tidal range squared, multiplied by the area of the water mass
involved (Burrows et al., 2009b).
Figure 2.1. Locations with the potential to generate energy using tidal range (Hammons, 1993)
12Table 2.1. Potential annual energy output from tidal barrages in the UK
Location Resource (TWh/y)
Severn 17(a)
Mersey 1.4(a), 1.38(b)
Duddon 0.212(a)
Wyre 0.131(a)
Conwy 0.06(a)
Dee 1.10(b)
Solway Firth 13.10(b)
Morecambe Bay 6.62(b)
Ribble 0.53(b)
(a)
(Sustainable Development Commission, 2007), (b) (Burrows et al., 2009a)
2.1.1 Tidal Barrage
Tidal barrages operate in a similar way to traditional large-scale hydroelectric power in that they use
a dam to create a difference in head between the two bodies of water on either side of a dam wall.
As water flows either in or out of the estuary at flood and ebb tide, the dam blocks the flow creating
a head difference. When the desired difference in head is reached, the water is released through the
turbines in the dam wall generating electricity. In contrast to hydroelectric dams, tidal barrages can
be bi-directional, making them capable of producing power four times a day, with a head difference
created twice over each tidal cycle (as the tide comes in and as it goes out), which occurs twice a day
where tides are semi-diurnal (as in Liverpool).
Although the technology to harness energy from tidal range has long been understood, there are
currently very few tidal barrages in operation worldwide although there are several proposals to
develop more, for example in South Korea and the UK.
There are several generation options for power generation with a tidal barrage, these include: one
way generation at ebb tide; one way generation at flood tide; two-way generation (on flood and ebb
tides); the incorporation of additional pumping; and double-basin barrages.
13Figure 2.2. The modes of operation of a tidal barrage or lagoon and an illustration of a turbine
caisson. Dashed lines are basin water level and solid lines are sea water level. HWST, high water
spring tide: LWST, low water, spring tide. (Burrows et al., 2009a, Yates et al., 2013)
In ebb generation, the estuary basin fills with water through the sluice gates over the flood tide. At
high tide the sluices are closed, trapping the water behind the barrage (at this point additional water
may be pumped into the basin, further increasing the difference in head). When the tide has ebbed
sufficiently on the seaward side of the barrage to create a hydrostatic head the water is allowed to
flow through the turbines, generating electricity. This continues until the hydrostatic head has
dropped to the lowest level at which the turbines can operate.
In flood generation, the sluice gates are kept closed as the tide rises until a sufficient hydrostatic
head develops. The turbines are then opened and electricity generated as the basin fills. This is
usually less efficient than either ebb or two-way generation as the basin is never either fully emptied
or filled (Fig. 2.2) (Waters and Aggidis, 2016).
In two-way or dual mode generation, both the flood and ebb tide are used. The sluice gates are
closed until near the end of the flood cycle. The turbines are opened to allow generation until the
difference in head becomes too small for generation to continue the sluice gates are opened so that
the basin fills to the high tide level. At high tide the gates are closed until the tide has ebbed
sufficiently for the difference in head to allow generation. At this point the turbines are opened for
ebb generation.
14In two-way generation, the difference in head height before generation begins is reduced (Fig. 2.2)
and the turbines operate less efficiently in flood mode (Waters and Aggidis, 2016), therefore there
may be less electricity generated from two-way generation than from ebb only. However, two-way
generation reduces the period of non-generation, giving a more consistent supply of electricity,
although there are still periods when generation must stop because of reduced difference in head.
To incorporate additional pumping, the turbines used are powered to operate in reverse, moving
water through the barrage and increasing the difference in head. Although this uses some energy, it
can significantly increase generation (Waters and Aggidis, 2016).
Double-basin generation is achieved through the adaptation of the barrage design to create a main
and secondary basin. The main basin is operated as for ebb generation with water pumped and
stored in the second basin. This allows generation to be staggered or delayed for peak periods in the
same way as traditional pumped hydro (See section 5.1.1).
In addition to options in generating strategies, there are various different turbine types. The current
options are either bulb or Straflo turbines, created in 1913 and 1919 respectively. Straflo turbines
have lower construction costs, but do not have as high peak efficiency as bulb turbines, and only
operate in ebb generating mode. Future tidal range turbines may include a modified bulb turbine
(designed to improve the low efficiencies when operating in reverse); Archimedes screw (currently
used in freshwater hydroelectric schemes); Gyro (currently used for tidal stream generation); and a
counter rotating device (Waters and Aggidis, 2016).
Despite the proven technology of barrage construction, operation and maintenance and the fact
that tidal range power plants have the potential to produce more electricity than any other form of
renewable energy (Waters and Aggidis, 2016) very few have been constructed. This is thought to be
due to high capital costs with little short-term financial gain and the potential negative
environmental impacts (O'Rourke et al., 2010).
The environmental implications of a tidal barrage are difficult to predict partly because, although
there are examples in operation, there have been no measurements of impact. At La Rance (Fig. 2.3)
there was no assessment of environmental conditions prior to construction (Waters and Aggidis,
2016) and at Lake Sihwa the power generation was initiated in an attempt to remedy environmental
degradation (Lee et al., 2014). There are some indications from La Rance that there were impacts to
the environment due to modification of the tidal regime causing changes in water depth, intertidal
area, salinity and sediment which have resulted in, for example, the loss of sand-eels and other
marine fauna during the three year construction phase (British Hydro, 2009; Waters and Aggidis,
2016). However, by 1976 (10 years after completion) the estuary was considered to be richly diverse
as a new biological equilibrium was reached (British Hydro, 2009).
There are likely to be physical changes to the estuary channel and basin due to impoundment of the
water by a barrage. Modification of flows may cause scouring around the structure and silting of the
basin behind the barrage (Wolf et al., 2009). Where there is scouring there may be increased
sediment suspension and a decrease in water quality (Burrows et al., 2009a). Where there is siltation
(settling in the lower-energy environment), levels of suspended particles in the water are likely to
decrease, due to causing greater penetration of light into the water column (Hooper and Austen,
2013). There may be an increase in contamination due to reduced flushing and a decrease in salinity
15upstream of the barrage (Kadiri et al., 2012). If there is a build-up in nitrate concentration, primary
production may increase and eutrophication could occur (Kadiri et al., 2012; Hooper and Austen,
2013).
Physical effects are dependent on the design of the barrage and its operation, and will be specific to
the estuary. Some effects could be mitigated against through increased dredging and rigorous
discharge controls.
The main environmental impact cited in objections to tidal barrages is the loss of intertidal area and
the loss of their associated habitats, mudflats and saltmarshes (Burrows et al., 2009a). These areas
are important to bird life, providing essential feeding habitat and are often national and
internationally protected. Other impacts may be the impediment of migratory fish, although fish
passes could be constructed, and the potential for injury to fish and marine mammals through
collision with the barrage and its turbines (Wolf et al., 2009; Roche et al., 2016). Changes to the
estuary may mean that areas that were previously useful nursery habitat are no longer suitable. On
the other hand, any increase in primary production could be beneficial to filter feeders (Wolf et al.,
2009). Importantly, the operation of a tidal barrage in generating energy reduces carbon emissions
across the energy mix and thus has environment benefits at both local and global scales.
A major potential impact of tidal barrages is to channel navigation (Mersey Tidal Power, 2011b). This
would need to be addressed at the design stage with consideration of the position of a barrage and
inclusion of locks, however the greatest disruption would probably occur (albeit temporarily) during
the construction phase.
A recent review of tidal range technologies (Waters and Aggidis, 2016) concludes that, due to
technological advances, the time of objections to tidal range technology on environmental and cost
grounds is coming to an end.
Although tidal range is a highly predictable renewable resource, giving this form of generation an
advantage over other renewable resources, it does not produce a constant source of energy. There
is a large variation in the electricity generated due to the spring-neap cycle of the tide. The
maximum power output during neap tide is about 48% of that on a spring tide, with the total energy
output for the neap tide being roughly 26% of that for the spring tide (Burrows et al., 2009).
Similarly, due to the phase of the tides, they do not occur at the same time every day. Half the
generating potential is likely to occur when demand is very low (e.g. in the very early morning).
Maximum electricity demand occurs in the evening, with a peak when people come home from work
at about 6:30pm. Additionally, although highly predictable, generation is intermittent, with two (or
four) peaks a day coinciding with the ebb (and flood) tide. It has been proposed that this might be
overcome through conjunctive operation of multiple barrages (Burrows et al., 2009a). It was found
that if eight barrages around the UK operated for the maximum time per day, electricity could be
generated for about 20 hours with two peak generating periods. If barrages were operated only to
achieve maximum power output, the generating window is reduced.
16La Rance Case Study
The world’s first tidal barrage, at La Rance in France (Fig. 2.3), was completed in 1966 (Charlier,
2007). A 720 m barrage across the river Rance enclosed 22 km2 surface area of water. It uses a
combination of two-way generation through 24 10 MW bulb turbines and pumped storage which
enhances the power generated on the ebb tide to produce a net output of approximately 480 GWh
annually (O'Rourke et al., 2010). This barrage has now been operating successfully for over 50 years.
Figure 2.3. La Rance tidal barrage at St. Malo, France (DOE Global Energy Storage Database, 2016)
Lake Sihwa Case Study
The most recently built and largest tidal barrage is at Lake Sihwa, South Korea. It started operation in
2012, generating an estimated 550 GWh annually from 10 bulb turbines operating in the flood
direction only (Waters and Aggidis, 2016, Borthwick, 2016). The barrage was initially constructed as
a dam to convert an intertidal area into a freshwater lake, this was completed in 1994. However, the
project failed due to water quality deterioration (Lee et al., 2014) and the decision was made to
reintroduce seawater circulation to the lake in an attempt to improve water quality. The dam was
converted to a tidal barrage through the installation of turbines, enabling electricity generation in
addition to water exchange (Waters and Aggidis, 2016). Because the turbines were installed post-
construction, primarily for water exchange, the barrage only generates electricity on the flood tide,
which means it is less efficient for energy generation than it would be if it operated on both the
flood and ebb tides.
17Other Schemes
Other barrages have been constructed in Annapolis, Canada (1984); Jiangxia, China (1985); and
Kislaya Guba, Russia (1968). In addition to power generation, the La Rance, Annapolis and Lake
Sihwa barrages all also double up as transport links.
Tidal barrages were first proposed as an energy generating option for the UK in the 1970s (Lawn,
2009), however, despite repeated proposals for a range of sites, none have yet passed the feasibility
stage. An ambitious project currently being put forward for North West England proposes the
construction of six barrages across the Dee, Mersey, Ribble and Duddon Estuaries, Morecambe Bay
and the Solway Firth. In addition to tidal energy, the project proposes to improve transport links
across the North West region by creating dual carriageway road links on top of the barrages (NWE2,
2015). A more modest scheme in Lancashire proposed a barrage over the Wyre Estuary from
Fleetwood to Knott End. This has a predicted annual energy output of 287 GWh at an estimated
construction cost of £400 million (NEW, 2017).
2.1.2 Suitability of the Mersey for energy generation by tidal barrage
With a maximum tidal range of 8.9 m, a current speed of up to 2 ms-1, its narrow mouth and close
proximity to population centres, the Mersey has often been identified as highly suitable for tidal
range generation (Hammons, 1993; Mersey Tidal Power, 2011c). Indeed, the potential for tidal range
energy generation from the Mersey has been under discussion for over 35 years, with a range of
proposals and feasibility studies having been carried out over that time.
The first proposal for a barrage was made by the Merseyside County Council in 1981, with studies
undertaken by Marinetech North West published in 1983 and 1985 (Hammond and Wood, 1990).
These studies prompted the formation of the Mersey Barrage Company, a consortium of
construction companies and local interests, to promote the scheme. Three possible locations (Fig.
2.4) were considered in the 1983 study (Reilly and Jones, 1990), New Brighton to Langton Lock (Line
1); Seacombe Promenade to Trafalgar Dock (Line 2); and Rock Ferry to what was Herculaneum Dock
(now filled in, Line 3). The line from Seacombe to Trafalgar Dock was immediately abandoned, whilst
the most downstream option, Line 1, was moved 800 m upstream (Line 1A) to a location identified
as more suitable with consideration to shipping. Although Line 1A was considered the better choice
geologically and would require a shorter dam to be constructed, providing cheaper electricity, Line 3
was selected as the most economic overall as Line 1A required a larger ship lock to allow tankers to
access Tranmere Oil Terminal (Sustainable Development Commission, 2007).
18Figure 2.4. Lines for a Mersey Barrage proposed by the Marinetech North West (1983, 1985) (Reilly
and Jones, 1990)
A further study, termed a “pre-feasibility study” was commissioned by Peel in partnership with the
North West Development Agency (NWDA) in 2006. This was followed up with a three-stage
feasibility study which ran from 2009 to 2011 under the banner of Mersey Tidal Power (MTP) project
(Mersey Tidal Power, 2011c).
The MTP report identified three broad locations (Bands A, B and C, see Fig. 2.5) and a range of
potential technologies, described as an impounding barrage; a very low head barrage; a tidal fence;
and a Spectral Marine Energy Converter (SMEC), which led to a shortlist of five location/technology
options. It was found that the current velocity was too low for a tidal fence and that the SMEC
required further development. The B and C locations were discounted due to navigation issues, with
the location being required for manoeuvring in and out of the docks and the channel at this point
being too narrow for accommodation of both the lock and tidal power plant. The shortlist was
further reduced to three possible schemes, an impounding barrage at Band A, or a very low head
barrage at either Band A or B (Mersey Tidal Power, 2010b). The final selected scheme was aligned
between New Ferry and Dingle, a similar location to that identified as optimal in the 1983 study
(Mersey Tidal Power, 2011a).
19Figure 2.5. Locations for Mersey Tidal Power project feasibility study (Mersey Tidal Power, 2010b)
The amount of power it is possible to produce from any barrage scheme is dependent on a range of
factors including the location of the barrage; the type, size and number of turbines installed;
whether energy is generated on the ebb tide only, or both ebb and flood; and whether additional
pumping (to increase the difference in head) is used. These output calculations can only be made
once design decisions have been made. However, although there are very few tidal barrages
worldwide, they are an established and well-understood technology, it is therefore expected that
calculations made for previous reports and feasibility studies should provide a reasonable guide as
to what could be achieved. These figures are presented in Table 2.2, below.
A recent study (Aggidis and Benzon, 2013) undertook to review the predicted energy outputs of the
studies described in Table 2.2 using new double regulated turbine technology from Andritz Hydro
(Aggidis and Feather, 2012) and improved bathymetric data (Fig. 1.6). Results showed that, for
operating modes of ebb generation with and without additional pumping, these turbines increased
predicted annual energy output by around 20 %.
Whilst the Mersey estuary is a strong candidate for a future tidal barrage there are various issues
which must be addressed. These include environmental, navigational and cost issues, which may
prove a barrier to construction (O'Rourke et al., 2010). A barrage would cause disruption to the
natural tidal cycle within the estuary with a decrease in exposed intertidal mudflat area. Mudflats
are an important zone for primary production within the estuarine system and represent an
important feeding habitat, particularly for migratory birds (Wolf et al., 2009). This is recognised in
the environmental designations with which large areas of the estuary and Liverpool Bay have been
awarded (Fig. 1.7). Effects to the intertidal zone could be reduced by implementation of dual (ebb
20You can also read