CAMBODIA AGRICULTURE, NATURAL RESOURCES, AND RURAL DEVELOPMENT SECTOR ASSESSMENT, STRATEGY, AND ROAD MAP - JULY 2021
←
→
Page content transcription
If your browser does not render page correctly, please read the page content below
CAMBODIA AGRICULTURE,
NATURAL RESOURCES,
AND RURAL DEVELOPMENT
SECTOR ASSESSMENT,
STRATEGY, AND ROAD MAP
JULY 2021

ASIAN DEVELOPMENT BANK
CAMBODIA AGRICULTURE,
NATURAL RESOURCES,
AND RURAL DEVELOPMENT
SECTOR ASSESSMENT,
STRATEGY, AND ROAD MAP
JULY 2021

ASIAN DEVELOPMENT BANK
Creative Commons Attribution 3.0 IGO license (CC BY 3.0 IGO)

© 2021 Asian Development Bank
6 ADB Avenue, Mandaluyong City, 1550 Metro Manila, Philippines
Tel +63 2 8632 4444; Fax +63 2 8636 2444
www.adb.org

Some rights reserved. Published in 2021.

ISBN 978-92-9262-951-9 (print); 978-92-9262-952-6 (electronic); 978-92-9262-953-3 (ebook)
Publication Stock No. TCS210256-2
DOI: http://dx.doi.org/10.22617/TCS210256-2

The views expressed in this publication are those of the authors and do not necessarily reflect the views and policies
of the Asian Development Bank (ADB) or its Board of Governors or the governments they represent.

ADB does not guarantee the accuracy of the data included in this publication and accepts no responsibility for any
consequence of their use. The mention of specific companies or products of manufacturers does not imply that they
are endorsed or recommended by ADB in preference to others of a similar nature that are not mentioned.

By making any designation of or reference to a particular territory or geographic area, or by using the term “country”
in this document, ADB does not intend to make any judgments as to the legal or other status of any territory or area.

This work is available under the Creative Commons Attribution 3.0 IGO license (CC BY 3.0 IGO)
https://creativecommons.org/licenses/by/3.0/igo/. By using the content of this publication, you agree to be bound
by the terms of this license. For attribution, translations, adaptations, and permissions, please read the provisions
and terms of use at https://www.adb.org/terms-use#openaccess.

This CC license does not apply to non-ADB copyright materials in this publication. If the material is attributed
to another source, please contact the copyright owner or publisher of that source for permission to reproduce it.
ADB cannot be held liable for any claims that arise as a result of your use of the material.

Please contact pubsmarketing@adb.org if you have questions or comments with respect to content, or if you wish
to obtain copyright permission for your intended use that does not fall within these terms, or for permission to use
the ADB logo.

Corrigenda to ADB publications may be found at http://www.adb.org/publications/corrigenda.

Notes:
In this publication, “$” refers to United States dollars.
ADB recognizes “China” as the People’s Republic of China, “Laos” as the Lao People's Democratic Republic,
“South Korea” as the Republic of Korea, and “Vietnam” as Viet Nam.

On the cover: Enhancing sustainable agricultural productivity and strengthening agricultural value chains are among
the key areas of support by ADB in Cambodia's agriculture sector (photo by ADB).
Cover design by Josef Ilumin.

    Printed on recycled paper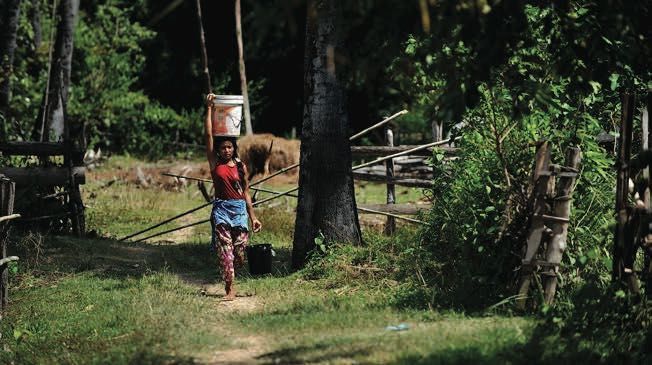
Contents

Tables and Figures                                                                      iv

Abbreviationsv

Executive Summary                                                                       vi

I.	Context and Strategic Issues in the Sector Assessment                                1
   Country Context and Overview of the Agriculture, Natural Resources, and               1
    Rural Development Sector
   Agriculture—Subsector Assessment, Constraints, and Development Needs                  7
   Natural Resources—Subsector Assessment, Constraints, and Development Needs           26
   Crosscutting Issues                                                                  32

II. Sector Strategy                                                                     38
   Government Strategy, Policy, and Plans	                                              38
   ADB Sector Support and Experience                                                    40
   Other Development Partner Support                                                    41
   ADB’s Sector Forward Strategy and Program, 2020–2023                                 43
   Crosscutting Themes                                                                  45
   Linkages between ADB Sector Strategy and the Government                              46
   Risks and Assumptions                                                                47
   Investment and Technical Assistance Programs                                         48

III. Sector Road Map and Results Framework                                              49

Appendixes
   1. SWOT and Problem Tree Analyses of Cambodia’s Agriculture, Natural Resources,      53
      and Rural Development Sector
   2. Projects by ADB and Other Major Development Partners in Cambodia's Agriculture,   58
      Natural Resources, and Rural Development Sector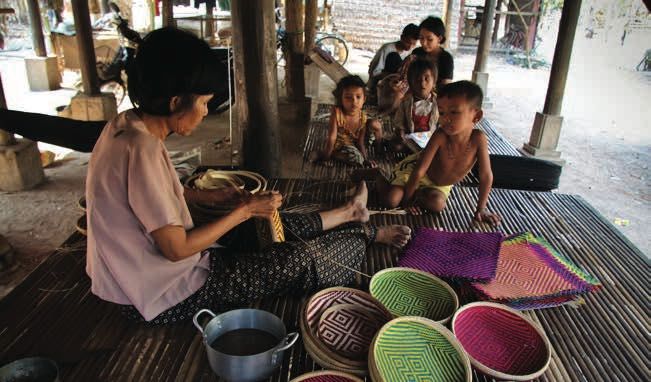
Tables and Figures

Tables
1      Agriculture, Natural Resources, and Rural Development Sector—Pipeline Projects,    48
       2021–2023
2	Agriculture, Natural Resources, and Rural Development Sector—Road Map and              49
   Results Framework, 2019–2023
A1     Agriculture, Natural Resources, and Rural Development Sector—SWOT Analysis         53
A2.1	Agriculture, Natural Resources, and Rural Development Sector—Success Rating         58
      of Completed Projects, 2008 Onward
A2.2	Agriculture, Natural Resources, and Rural Development Sector—Success Rating         60
      of Completed Technical Assistance Projects, 2008 Onward
A2.3	Agriculture, Natural Resources, and Rural Development Sector—Assistance of ADB      62
      and Other Major Development Partners

Figures
1      Growth in Gross Domestic Product (Total vs. Agriculture), 2000–2020                 2
2      Total Gross Domestic Product and Share of Agriculture Value Added, 2000–2019        3
3      Value of Agricultural Exports, 2010–2018                                            4
4      Rice Paddy Yield, 2000–2019                                                         8
5      Rice Exports, 2010–2019                                                             9
6      Usage of Main Agricultural Machinery, 2004–2015                                    17
7      Employment and Value Added in Agriculture, 2000–2019                               18
8      Value Added per Worker in Agriculture, Forestry, and Fishing, 2000–2019            18
9      Total Forest Land Area, 2000–2018                                                  30
10     Proportion of Forest to Total Land Area, 2000–2018                                 30
A1     Agriculture, Natural Resources, and Rural Development Sector—Problem Tree          56
Abbreviations

ADB        Asian Development Bank
ANRRD      agriculture, natural resources, and rural development
COVID-19   coronavirus disease
DRR        disaster risk reduction
FAO        Food and Agriculture Organization of the United Nations
FiA        Fisheries Administration (MAFF, Cambodia)
FWUC       farmer water user community
GDP        gross domestic product
GMS        Greater Mekong Subregion
ICT        information and communication technology
IFAD       International Fund for Agricultural Development
MAFF       Ministry of Agriculture, Forestry and Fisheries
MFI        microfinance institution
MOWRAM     Ministry of Water Resources and Meteorology
NGO        nongovernment organization
O&M        operation and maintenance
PRC        People’s Republic of China
SMEs       small and medium-sized enterprises
SNAP-DRR   Strategic National Action Plan for Disaster Risk Reduction

Weights and Measures
ha         hectare
kg         kilogram
km         kilometer
mcm        million cubic meter
Executive Summary

The sector assessment, strategy, and road map describe the performance and development constraints of
Cambodia’s agriculture, natural resources, and rural development (ANRRD) sector in light of the coronavirus
disease (COVID-19) pandemic and the current strategic investment priorities of the Government of Cambodia
and the Asian Development Bank (ADB).

Sector Overview and Assessment

Cambodia became a lower middle-income economy in 2015, after sustaining an average annual gross domestic
product (GDP) growth rate of 7.6% from 1994 to 2015. In 2016–2019, total GDP grew by 7.1% annually and
contracted by 3.1% in 2020 due to the negative impact of the COVID-19 pandemic. Garment exports, agriculture,
tourism, and more recently construction and real estate have been the drivers of economic growth since 2000.

The share of agriculture value-added to the total GDP averaged around 30% during 2000−2014 and was
estimated at 22.1% in 2019. Within the sector, crop production has the largest output contribution to total
national GDP at 13.0%, followed by fisheries (5.5%), livestock (2.6%), and forestry (1.6%). However, the growth
of agriculture value-added has been limited (0.85% annually, on average) since 2013 due to the long-term low
labor productivity stemming from the preponderance of unprocessed rice production and the downturn in
international commodity prices since 2014, as well as adverse weather conditions in 2015 and 2016.

Impact of the COVID-19 pandemic. For the global food trade, COVID-19 has impacted both supply and demand
sides, depending on the severity of the spread of the disease. During the pandemic, the Cambodian government
has allowed the transport of goods nationwide, including agricultural inputs and products. As a result, prices have
remained fairly stable for most key food commodities over the first 10 months of 2020, except for an initial spike
in prices at the end of March 2020 and the beginning of April 2020. The impact of the pandemic is considered on
the demand side, with many households suffering loss of livelihoods and income as a result of the pandemic, which
in turn has restricted their ability to afford sufficient and nutritious foods. In response, the government launched a
cash transfer program in June 2020 to provide support to vulnerable households, reaching around 696,000 poor
households by October 2020.

Agriculture

Limited postharvest handling and processing. Only about 10% of Cambodia’s total agricultural outputs are
processed within the country, whereas processed agricultural exports represent only 8% of total official exports
by value. Other than rice milling (with its expanded capacity) and basic processing of rubber and pepper, the
agro-processing sector is largely underdeveloped. Cambodia needs private investment in postharvest handling
and processing if it is to capture economic opportunities arising from value addition to its agricultural products.
Executive Summary   vii

Key constraints to increased agro-processing in Cambodia include the reliability and cost of electricity, informal
payments for permits and documentation, lack of skills and information, difficulties in obtaining development
capital, and access to technology and machinery.

Access to agricultural inputs and machinery. Modernizing agriculture and increasing labor productivity for farm
production require quality agricultural inputs and mechanization. Cambodia has limited availability of improved
seed varieties. Although the annual supply of quality rice seeds has been increasing, the supply was only 20% of
the annual demand in 2019. Vegetable seeds are imported except for those produced at government research
stations. The Government of Cambodia has not yet ratified a seed policy with seed quality standards under the
2008 Seed Law. Moreover, it has yet to make the seed law operational by establishing the essential policies and
enforcement mechanisms. Cambodia’s fertilizer use per hectare of cropland increased from 10.0 kilograms in 2005
to 33.0 kilograms in 2018. Pesticide use has increased, especially during dry-season rice cultivation and in the
vegetable sector. Pesticides are also imported; however, most pesticides are allegedly either poorly regulated
or unregulated. Proper use of regulated pesticides is important for farmers’ safety, food safety, and ecosystem
health. Cambodian agriculture has seen a gradual mechanization and replacement of labor with machinery such
as power tillers and water pumps. Further mechanization is expected to increase labor productivity and earnings
from farming to match income opportunities outside farming.

Access to markets, transport, and logistics. Farmers are predominantly price takers. Most sell their crops to
traders just after harvest. Varieties are mixed and only small volumes of pure varieties are found, which hinder
value recognition and addition. For further value addition in agriculture, access to international markets is
increasingly important. Efficient transport and logistic infrastructure and services are necessary to strengthen
agri-food value chains. Roads are the major means of domestic transport in Cambodia. Cambodia’s domestic
transport costs have been reduced, but they remain higher than neighboring countries such as Thailand and
Viet Nam. Road improvements and increased competition among local transport services are needed to reduce
transport costs. Similarly, Cambodia’s physical market infrastructure is outdated, congested, unsanitary, and
requires significant improvement. There is also no reliable cold chain system in place to ensure the proper
handling and safe storage and distribution of perishable agricultural and food products.

Access to information and communication technology. The government has recently undertaken several policy
interventions toward digital development, including its Information and Communication Technology (ICT)
Masterplan 2020 and the draft Cambodia e-Government Master Plan, 2017–2022. However, the country still
ranks low on digital adoption and technological readiness. ICT can play an important role in linking agriculture
value chain stakeholders such as farmers, agribusiness operators, consumers, and government agencies.
The digitization of information will facilitate the formation of value chain platforms through which value chain
stakeholders can exchange information, services, and products.

Access to finance. Despite the increased access to finance in rural areas, credit to agriculture and agribusinesses
together accounted for only 9.4% of formal finance in Cambodia in 2018, and access to finance is still the major
bottleneck for Cambodian farmers and agribusinesses. High collateral requirements, high interest short-term
loans, lack of credit history, and low financial literacy are among the reasons for their poor financial access.
Furthermore, there is some indication that, due to the COVID-19 pandemic, access to credit and finance has
been restricted. Addressing constrained access to finance will be critical to spur post-pandemic recovery.

Extension services and cooperatives. Although about 70% of all villages are covered by some type of public or
private extension services, they remain generic and tend to be supply-driven. The government is in the process
of reorienting its extension services to be demand-driven, decentralized to enhance outreach, and varied to
support agriculture diversification. While improving the government extension services, engagement of private
viii   Executive Summary

       service providers is important, as is close coordination with extension services through donor-funded projects.
       The government promotes farmer cooperatives to take advantage of economies of scale in production and
       marketing arrangements. There were around 1,200 registered cooperatives in 2019; however, their capacity varies.
       Further strengthening of farmer cooperatives and different forms of farmer groups is required for sustainable
       farming sector development in the country.

       Natural Resources

       Water resources. Cambodia experiences seasonal water scarcity resulting primarily from lack of stored water
       and limited access to water and not from the volume of water. In agriculture, increasing national water use
       productivity entails better water harvesting and storage capacity on farms, and improved water use efficiency
       (e.g., through the use of drip irrigation systems). However, the country’s relatively flat topography offers limited
       potential for water harvesting and storage facilities to improve water availability. Currently, only 22% of the
       country’s 4.5 million hectares of arable land (including 3.2 million hectares of cultivated rice area) are covered
       by 2,480 irrigation schemes. However, most are not fully functioning due to poor operation and maintenance,
       thereby constraining agricultural productivity. A consensus among development partners is that there is a need
       for a shift in focus from investment in irrigation infrastructure to a more modern and wider water resources
       management strategy geared toward increased agricultural productivity while sustaining key ecological processes.

       Forests and biodiversity. A variety of forest types covers almost half the country’s land area. Cambodia’s forests
       and its coastal and riverine ecosystems provide habitats for diverse species of plants and wildlife, including
       around 6,500 native flora and fauna species, some of which are endangered. The country’s forests serve as
       ecological buffers to natural disasters and protect watersheds, act as carbon sinks, reduce soil erosion thereby
       averting fertility loss, and prevent flooding. Cambodia’s forest cover has undergone a continuous and dramatic
       decline from 60% of total land area in 2006 to nearly 50% in 2018. Much of the remaining 9.0 million hectares of
       forest cover have been degraded as a result of selective logging, unregulated fuelwood extraction, indiscriminate
       awarding of economic land concessions, and other unsustainable uses of forest resources for national
       development priorities. Toward Cambodia’s Sustainable Development Goal target of 50% of national area under
       forest cover, the government has adopted a conservation corridor approach, which needs to be supported with
       adequate investment.

       Crosscutting Issues

       Food security, safety, and nutrition. In recent years, the food security situation in Cambodia has improved
       considerably due to the growth of real income and increases in the production volume of rice and other crops.
       However, the COVID-19 pandemic threatens to reverse this trend through losses of income opportunities due
       to the economic downturn. Malnutrition remains prevalent among the poorest and most vulnerable sectors
       (i.e., the landless, female-headed households, the disabled, ethnic minorities, and those living in the most remote
       and marginalized areas). Food safety is also a concern with the pending passage of the Food Safety Law, a lack of
       policy and technical standards on food safety control and management, inadequate coordination of concerned
       government agencies, and poor enforcement of food safety regulations.

       Climate change and disaster risk management. According to several risk indexes, Cambodia is rated highly
       vulnerable to the impacts of climate change (an increase in precipitation, temperatures, and intensity and
       frequency of climate hazards). Without adaptation to these climate effects, Cambodia is projected to lose 10% of
       GDP by 2050. The agriculture sector is particularly vulnerable to climate-related disasters. Floods and droughts
Executive Summary    ix

can seriously hamper agricultural productivity and damage crops extensively. Pests and diseases such as avian
influenza and swine flu can reduce food production and bring economic losses to farmers. Institutionalizing
disaster risk reduction is crucial to strengthening Cambodia’s technical capacity for disaster risk management,
assessment, and monitoring.

Sector Strategy

Key areas of support. ADB’s ANRRD strategy and program are in line with the Cambodian government’s sector
strategic development plans and objectives, and prioritize three key areas of support: (i) enhancing agricultural
productivity, including improving land use and water resources management through a whole-of-system
approach, improving irrigation efficiency and sustainability, investing in pre- and postharvest facilities and
technologies, and making on-farm practices more efficient and sustainable; (ii) strengthening agricultural
value chains, including promoting commercialization and market connectivity, increasing farm income through
crop diversification as well as value addition and mechanization, strengthening agricultural cooperatives
and developing agribusiness networks, and encouraging private sector engagement; and (iii) strengthening
natural resources management and disaster resilience, and mainstreaming climate change. These three
areas complement each other to support the ANRRD sector's transformation toward a more productive,
value-additive, and resource-efficient sector.

Crosscutting themes, risks, and assumptions. ADB’s strategy and program will incorporate the following
crosscutting themes: (i) governance and capacity building, (ii) cross-sector synergies, (iii) regional cooperation
and integration, and (iv) gender development. The strategy is based on the assumption of continued expansion
of subregional and regional trade opportunities, notwithstanding the not-so-optimistic world commodity outlook
and the possible reorientation of Cambodia’s export strategy to high-growth markets. Likewise, the strategy
faces risks from (i) weak institutional and legislation commitment to reforms in relation to government policies
and plans; (ii) uncertainties and knowledge gaps with respect to some untested technologies and practices
(e.g., climate-smart agriculture); (iii) unclear operational provisions of some elements of government policy
(e.g., approval and management of public–private partnership arrangements); (iv) prevailing conditions when
finance is made available to the ANRRD small and medium-sized enterprises; (v) government’s absorptive
capacity; and (vi) impacts of the COVID-19 pandemic on the economy and the ANRRD sector, specifically on
food security and value chains.
I.	Context and Strategic Issues
    in the Sector Assessment

This sector assessment, strategy, and road map report describes the current strategic investment priorities of the
Government of Cambodia and the Asian Development Bank (ADB) in Cambodia’s agriculture, natural resources,
and rural development (ANRRD) sector.

Rice field in Cambodia. Rice continues to be Cambodia’s major crop, principal food, and most important export commodity
(photo by Asian Development Bank).

Country Context and Overview of the Agriculture,
Natural Resources, and Rural Development Sector
Recent Macroeconomic Trends

High economic growth for 2 decades. Cambodia sustained an average annual growth rate of 7.6% from 1994 to
2015 and became a lower-middle-income economy in 2015.1 Real national income more than tripled over these
2 decades. In 2019, gross domestic product (GDP) per capita was reported at $1,696.2 This high economic growth
has been driven by garment exports, agriculture, tourism, and, more recently, construction and real estate. Figure
1 depicts the yearly growth rate of total GDP and agriculture, forestry, and fishing value-added growth. Total GDP
in 2016–2019 grew at 7.1% per annum, on average. However, the economy contracted by 3.1% in 2020 because of

1
    ADB. 2019. Key Indicators for Asia and the Pacific 2019. Manila. In 1994–2015, Cambodia placed sixth among the world’s fastest-growing
    economies.
2
    Government of Cambodia, Ministry of Planning, National Institute of Statistics. 2020. National Accounts Statistics 2020. Phnom Penh.
2 Cambodia Agriculture, Natural Resources, and Rural Development Sector Assessment, Strategy, and Road Map
Figure 1: Growth in Gross Domestic Product (Total vs. Agriculture), 2000–2020
20
(annual % growth)
15
10
5
0
-5
00 001 002 003 004 005 006 007 008 009 010 2011 2012 2013 2014 2015 2016 2017 2018 2019 020
20 2 2 2 2 2 2 2 2 2 2 2
Total GDP GDP agriculture, forestry, and fishing
GDP = gross domestic product.
Sources: Asian Development Bank. 2021. Asian Development Outlook 2021: Financing a Green and Inclusive Recovery.
Manila; and World Bank national accounts data, and Organisation for Economic Co-operation and Development National
Accounts data files (accessed 7 June 2021).
the negative impact of the coronavirus disease (COVID-19) pandemic.3 It is forecast to rebound, with projected
growth of 4.0% in 2021 and 5.5% in 2022, as the economic recovery in major trading partners spurs demand
for Cambodia’s exports (footnote 3). The relatively high economic growth prior to the pandemic was built on
the country’s openness to trade and capital flows and the stable exchange rate policy against the United States
dollar. Additional drivers included preferential access to key export markets, the receipt of large amounts of
official development assistance, and even larger foreign direct investment inflows.4 Agriculture production grew
marginally by 0.5% in 2020 but is expected to increase by 1.3% in 2021 and 1.2% in 2022, bolstered by improved
crop production after the flood damage in October 2020, sustained growth in aquaculture, and higher agriculture
exports to the People’s Republic of China (PRC) from a new bilateral free trade agreement (footnote 3). The
country had a relatively low inflation rate, at 1.9% in 2019, which increased to 2.9% in 2020 and 3.1% projected
in 2021 as a result of rising food and fuel prices (footnote 3).
Agriculture in the Economy
High share of agriculture in gross domestic product and employment. In the 1990s, the value-added share
of agriculture in the total GDP fell from 35.7% in 2000 to 22.1% in 2019 (Figure 2).5 Cambodia’s GDP share
of agriculture is the highest among the lower-middle-income countries.6 In terms of the agriculture sector’s
3
ADB. 2021. Asian Development Outlook 2021: Financing a Green and Inclusive Recovery. Manila. For additional macroeconomic indicators,
refer to ADB’s dataset on Key Indicators for Cambodia.
4
Foreign direct investment (FDI) net inflows in 2019 were 13.2% of GDP (at $3,561 million, almost the highest in the world in proportion to
GDP). The share of FDI inflows to the agriculture sector has been shrinking from 13.6% of total net inflows in 2015 to 5.8% in 2019. Net
official development assistance receipts are in decline, from 12.2% of GDP in 1996 to 5.0% in 2014, and less thereafter.
5
ADB. 2020. Key Indicators for Asia and the Pacific 2020. Manila. Estimates of GDP share vary according to whether constant or current
prices are used. The estimate of the Ministry of Agriculture, Forestry and Fisheries (MAFF) is 26.3% from its 2016–2017 Annual Report
and 24.9% from its 2017–2018 Annual Report.
6
The average share for lower-middle-income countries, including Bangladesh, the Philippines, and Viet Nam, is 18.0%.Context and Strategic Issues in the Sector Assessment 3
Figure 2: Total Gross Domestic Product and Share of Agriculture Value Added, 2000–2019
300 40
35
250
30
200
% of GDP
25
$ billion
150 20
15
100
10
50
5
0 0
1 1
00 0 02 03 04 05 06 07 08 09 10 01 012 2013 014 015 016 2017 018 019
20 20 20 20 20 20 20 20 20 20 20 2 2 2 2 2 2 2
GDP ($ billion) Agriculture, forestry, and fishing (value added, % of GDP)
GDP = gross domestic product.
Source: World Bank national accounts data, and Organisation for Economic and Co-operation and Development National
Accounts data files (accessed 7 June 2021).
output contribution to total national GDP, crop production still leads (13.0%), followed by fisheries (5.5%),
livestock (2.6%), and forestry (1.6%).7 Agriculture sector growth has been limited annually to 0.85%, on average,
since 2013. This was caused by the long-term low labor productivity stemming from the preponderance of
unprocessed rice production and the downturn in international commodity prices since 2014, as well as adverse
weather (rain and drought) conditions in 2015 and 2016.8 The proportion of the rural population is 76.2% of
the national population, which is higher than the average of lower-middle-income countries (at around 60%).9
In 2019, it was estimated that 2.99 million people were engaged in the agriculture sector (equivalent to 32.3%
of the total labor force).10
Impact of the COVID-19 pandemic. The annual GDP growth rate is expected to decline dramatically to –3.1%
in 2020. For the global food trade, the pandemic has impacted both supply and demand sides, depending
largely on the severity of the spread of the disease. Several Southeast Asian countries temporarily imposed
border controls, which disrupted the flow and prices of commodities, particularly in the second quarter of 2020.
Cambodia imposed a ban on rice exports in April 2020 but lifted it in May 2020. Due to the short duration of
the ban and the good harvest in 2020, Cambodia is expected to export 1.5 million tons of rice, 5.4% above the
2019 level.11 During the pandemic, the government has allowed the transport of goods nationwide, including
agricultural inputs and products. As a result, prices remained fairly stable for most key food commodities over the
7
Government of Cambodia, MAFF. 2019. Annual Report, 2018–2019. Phnom Penh.
8
World Food Programme, United Nations Children’s Fund (UNICEF), and Food and Agriculture Organization of the United Nations
(FAO). 2016. Household Resilience in Cambodia: A Review of Livelihoods, Food Security and Health. Part 1: 2015/2016 El Niño Situation
Analysis. Phnom Penh.
9
International Labour Organization (ILO). ILOSTAT Database. Population by rural/urban areas. UN estimate and projections. July 2019.
10
ILO. ILOSTAT Database. Employment by sex and economic activity. ILO modeled estimates. November 2019.
11
FAO. Global Information and Early Warning System (GIEWS). Country Briefs: Cambodia (accessed 5 January 2021).4 Cambodia Agriculture, Natural Resources, and Rural Development Sector Assessment, Strategy, and Road Map
first 10 months of 2020, except for an initial spike in prices at the end of March and the beginning of April.12 The
impact of the pandemic is considered on the demand side, with many households suffering the loss of livelihoods
and income, which in turn has restricted their ability to afford sufficient and nutritious foods. In response, the
government launched a cash transfer program in June 2020 to provide support to vulnerable households,
reaching 696,000 poor households by October 2020 (footnote 12).
Limited value-added of agro-processing. An increase in value addition to agriculture is crucial to increasing
rural employment in the economy. However, national GDP figures for 2019 suggest that the combined total
manufacturing value of agricultural-based products is only 3.4% of GDP.13 This is due to the low level of
private sector investment. Large-scale investments in agriculture and agro-industry were less than 10% of all
investments, with investment in food processing being less than 2% of all investments.14
The majority of the country’s agriculture exports are still in raw form and heavily dependent on crops. Figure 3
shows that the total value of agricultural exports has more than tripled since 2010. The main export products are
rice and rubber, with an increasing share of cassava. From 2010 to 2018, the biggest reduction of export value was
seen in maize.
Figure 3: Value of Agricultural Exports, 2010–2018
($ million)
600
500
400
300
200
100
0
2010 2011 2012 2013 2014 2015 2016 2017 2018
Crop Meat Other
Source: Food and Agriculture Organization of the United Nations. FAOSTAT Database (accessed 4 November 2020).
12
Vulnerability Analysis and Mapping Unit, Cambodia Country Office, World Food Programme. 2020. Focus: Effect of the COVID-19
Outbreak on Food Prices. PowerPoint presentation prepared for the World Food Programme on Cambodia’s Food Price Update.
September/October 2020.
13
This comprises food, beverages, and tobacco products; wood, paper, and publishing goods; rubber products; and nonmetallic
manufacturing commodities (see footnote 7).
14
Government of Cambodia, MAFF. 2015. Action Plan for the Implementation of the Cambodia Industrial Development Policy, 2015–2025.
Phnom Penh.Context and Strategic Issues in the Sector Assessment 5
Poverty Reduction
Improved, yet precarious poverty situation. Because of its rapid and sustained economic development,
Cambodia has emerged among the global frontrunners in poverty reduction. The country’s poverty incidence
(i.e., headcount under the national poverty line) significantly declined to 9.5% in 2019 (from 47.8% in 2007).15
This was accomplished mainly by economic growth driven by increased labor input and employment generation.
With its growing working-age population, Cambodia is now enjoying a demographic dividend and has successfully
been creating jobs in labor-intensive activities for women and youth.16 Cambodia’s accomplishments in poverty
reduction, however, remain highly precarious since many households lifted out of poverty remain close to the
poverty line. A study conducted in 2012 revealed that a minor negative shock equivalent to $0.30 per day would
trigger a 40% increase in the national poverty rate, which translates to about six million poor people. Nearly 90%
of the poor reside in rural areas, and there are sharp regional disparities. The COVID-19 pandemic threatens to
undermine Cambodia’s progress in poverty reduction. Vulnerable groups such as women and migrant workers
are especially at risk. The crisis will lead to an estimated loss of 570,000 jobs and threatens to push an additional
1.1 million people into moderate poverty and 205,000 people into extreme poverty.17
Rural–Urban Disparity
Closing, yet significant rural–urban disparity. Rural areas generally lag urban areas in access to basic public
goods and services. For example, 2015 data show that access to improved sanitation facilities is still considerably
lower in rural areas (30.5%) versus urban areas (88.1%). The national average was 59.2% in 2017. Similarly,
in 2015, access to improved water supply was lower in rural areas (69.1%) versus urban areas (100%).18
Moreover, rural incomes are lower than urban incomes. In 2016, the estimated average monthly household
income was KR2.91 million ($717) in Phnom Penh, KR2.46 million ($607) in other urban areas, and KR1.52 million
($374) in rural areas.19 Rural incomes, therefore, are only about 50%–60% of all urban areas. However, the gap
appears to be closing in comparison with 2012 levels of 40%–55%, and this is being accounted for by increases
in transfers (i.e., remittances) and by the decline in self-employed agricultural income. In general, Cambodia
has seen a steady increase in overseas remittances. Personal remittances increased from 5.0% of GDP in 2010
to 5.6% in 2019.20 However, because of the COVID-19 pandemic, the country is at risk of losing more than 15%
($420 million) in remittances in 2020.21
15
ADB. 2020. Basic Statistics 2020. Manila.
16
The United Nations Population Fund defines a demographic dividend as “the economic growth potential that can result from shifts in a
population’s age structure, mainly when the share of the working-age population (15 to 64 years old) is larger than the nonworking-age
share of the population (14-years-old and younger, and 65-years-old and older).”
17
ADB. 2020. Report and Recommendation of the President to the Board of Directors: Proposed Countercyclical Support Facility Loan to the
Kingdom of Cambodia for the COVID-19 Active Response and Expenditure Support Program. Manila.
18
World Health Organization (WHO) / UNICEF Joint Monitoring Program for Water Supply, Sanitation and Hygiene. The Ministry of Rural
Development targets 100% coverage in each area (i.e., rural and urban) by 2025.
19
Government of Cambodia, Ministry of Planning, National Institute of Statistics. 2017. Cambodia Socio-Economic Survey 2016. Phnom Penh.
20
World Bank. World Development Indicators (accessed November 2020).
21
A. K. Takenaka, J. Villafuerte, R. Gaspar, and B. Narayanan. 2020. COVID-19 Impact on International Migration, Remittances, and
Recipient Households in Developing Asia. ADB Briefs. No. 148. Manila: ADB.6 Cambodia Agriculture, Natural Resources, and Rural Development Sector Assessment, Strategy, and Road Map
Land Availability and Farm Sizes
Decreasing average landholdings and widening inequality in land distribution. Land titles of more than
1 million hectares (ha) of state land were provided to poor people as a measure to formalize existing land
entitlements.22 However, the average landholding size of a rural household is still only 1.3 ha. This size may be
sufficient to produce a market surplus for a family of five, but not big enough to propel households into the
middle class or provide them with long-term economic security. This trend of decreasing landholding size will
likely persist as families continue to divide the farm and parcel out plots to children. Within this overall trend
is a polarization of land sizes, with large farms becoming larger and small ones becoming smaller, resulting in
increasingly unequal land distribution. Since 2014, agricultural land ownership has not changed much, with
23% of rural households not owning any land and another 15% owning less than 0.5 ha and depending mainly
on agricultural wage labor.23
This changing distribution pattern of farm sizes has major implications for farm incomes. Extensive crop
budgeting and modeling done by the World Bank in 2015 found that returns to land are largely proportional to
farm size, with exceptions of maize and dry-season rice production.24 Hence, the larger the farm size, the larger
the returns to family labor and farm income.25 Returns to land significantly vary across crops. Among different
crops, returns to land are significantly higher for vegetable cultivation ($1,394 per ha) and cassava production
($506 per ha) than for the production of other crops.
Labor Availability and Migration
Decreasing share of farm income for the rural population. Between 2003 and 2013, agricultural wage rates
rose by a factor of four and converged with rates in other sectors.26 Since then, many households have diversified
from agriculture into more profitable nonfarm activities (often part-time or informal), and the share of wages
and transfers (including remittances from growing levels of unskilled labor migration) has risen relative to
self-employment in agricultural activities (e.g., cropping, livestock, or fisheries).27 These nonagricultural sources of
income have cushioned the impact of declining agriculture growth post-2012 and are likely to continue to remain
important. With Cambodia’s relatively small size and good road transport services, it is possible to both operate a
farm and undertake some work in urban areas or neighboring countries, especially on a seasonal basis. As of 2018,
an estimated 1,000,000 Cambodian migrants were registered in Thailand, and this figure does not include the
substantial number of undocumented migrants.28 These labor outflows in agriculture were expected to continue in
the foreseeable future, and then the global pandemic happened. As a result, the economy lost around 400,000 jobs
in the first half of 2020, with around 100,000 workers returning to the country. This backflow of mostly rural labor
poses an additional challenge to the agriculture sector in terms of how to sustainably absorb the returning migrants.
22
This includes 360,000 ha taken back from Economic Land Concessions as they were improperly awarded to agribusiness firms.
23
World Bank. 2017. Cambodia: Sustaining Strong Growth for the Benefit of All. Systematic Country Diagnostic. Washington, DC.
24
P. Eliste and S. Zorya. 2015. Cambodian Agriculture in Transition: Opportunities and Risks. Washington, DC: World Bank.
25
Farm sizes have the greatest impact on returns to a day of labor for dry-season rice production, with returns increasing from $6.15 per day
for small farms to $8.27 per day for medium-sized farms and soaring to $22.83 per day for large farms. For wet-season rice production,
the returns to labor can increase from $2.86 per day for small farms to $12.67 per day for large farms.
26
This was a period when major primary output prices rose and had a cascading effect on sector incomes. Many farmers with surplus land
brought it into cultivation and (to a lesser extent) invested in some improved technology, and higher consumer food prices were offset for
many (but not all) poor and landless by higher rural wage rates. It may be noted that the greatest period of Cambodia’s national poverty
reduction was in the commodity price boom from 2007 to 2012.
27
By 2014, agricultural income from crop or livestock sales accounted for only 25% of total rural incomes and one-third of the income of
the poorest 40% of the population, with the rest coming from wages, household businesses, and remittances.
28
Government of Cambodia, Ministry of Planning. 2019. General Population Census of the Kingdom of Cambodia 2019. Phnom Penh.Context and Strategic Issues in the Sector Assessment 7
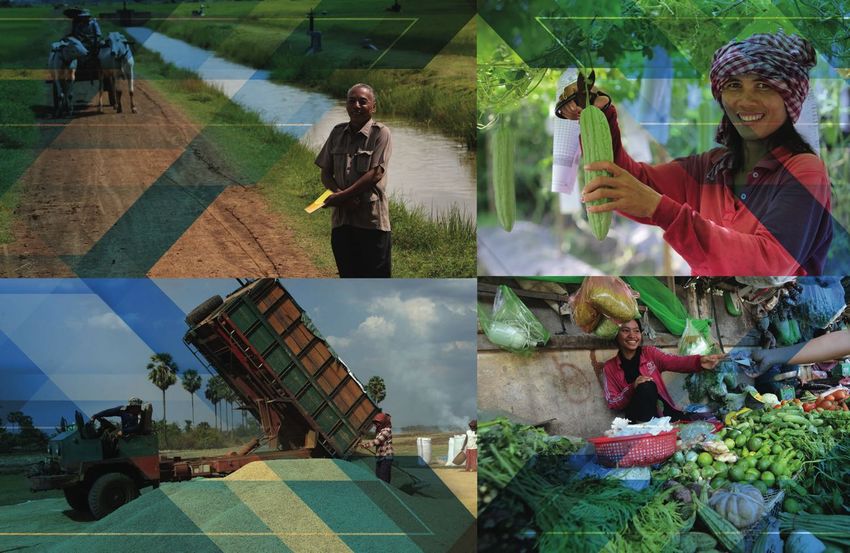
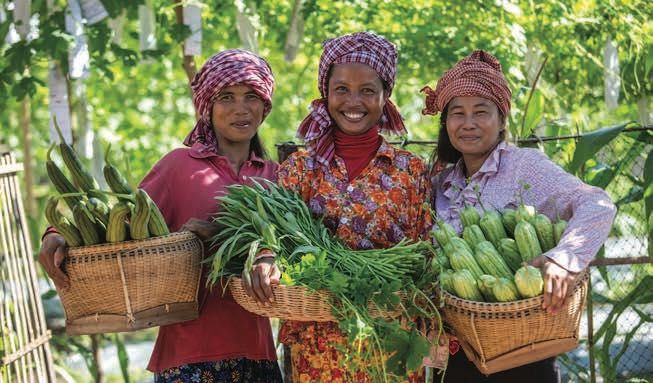
Weaving cottage industry. To augment farm income, women in villages engage in cottage goods production such as weaving
(photo by Asian Development Bank).
Agriculture—Subsector Assessment, Constraints,
and Development Needs
Crop Subsector
Continued dominance of rice production. The country’s 4.5 million ha of cultivated land remain largely
dominated by rice (70%), followed by subsidiary and industrial crops (20%),29 rubber plantations (7%), and
permanent crops (4%).30 The cultivated area of rice increased from 3.2 million ha in 2017 to 3.3 million ha
in 2018, comprising 2.7 million ha of wet-season rice and 0.6 million ha of dry-season rice. The increased
cultivated area of rice resulted in an increase in rice production by around 10.5 million tons in 2017 to 10.9 million
tons in 2018 (footnote 7).
Potential rice yield increases with irrigation. Prevailing low wet-season rice yield is the main reason the
profitability of Cambodian farming has remained modest; the average yield increase was only 2.6% between
2010 and 2018. Cambodia’s wet-season rice yield is about 30% less than that of Thailand’s Central Plains region,
where varieties other than jasmine and glutinous rice predominate at yields of around 3.8 tons per ha. However,
there is scope to close the rice yield gap. Findings show that changing from rainfed to irrigated cultivation in
Cambodia could result in annual production increases of up to 40%. For example, the Cambodia Agricultural
29
Industrial crops include sugar cane and tobacco. Subsidiary crops include nonrice cereal and grain crops, root, tuber, and legume crops.
30
Permanent or perennial crops include banana, cashew, coconut, coffee, durian, oil palm, pepper, mangoes, orange, and other fruits.8 Cambodia Agriculture, Natural Resources, and Rural Development Sector Assessment, Strategy, and Road Map
Figure 4: Rice Paddy Yield, 2000–2019
(kg/ha)
7,000
6,000
5,000
4,000
3,000
2,000
1,000
0
1 1
00 00 002 003 004 005 006 007 008 009 010 201 012 2013 014 2015 016 2017 018 019
20 2 2 2 2 2 2 2 2 2 2 2 2 2 2 2
Cambodia Thailand Viet Nam
ha = hectare, kg = kilogram.
Source: Food and Agriculture Organization of the United Nations. FAOSTAT Database (accessed 7 June 2021).
Value Chain Program demonstrated on 20 rehabilitated irrigation schemes a total cropping area increase of
42% and an annual output increase from 3.6 tons per ha to 4.8 tons per ha.31 These yields are comparable to the
better arable regions of the Central Plains of Thailand, where farmers achieve 5.7 tons per ha in the dry season,
and the Mekong Delta of Viet Nam, where the average yield at a provincial level ranges from 6 to 7 tons per ha
(footnote 24). Official yield data from the Food and Agriculture Organization of the United Nations (FAO) show
that, on average, Cambodia and Thailand have been achieving similar yields per hectare in recent years, while
Viet Nam is still outperforming both countries (Figure 4). As rice farmers are primarily subsistence producers,
often with less than 1 ha, they will rely heavily on increased rice yields to generate a marketable surplus.
Increasing rice exports and substantial paddy exports. According to official statistics, total agricultural export
volumes are estimated to have risen from 136,853 tons in 2010 to 4,233,532 tons in 2018 (footnote 7). Rice
exports increased from 105,259 tons in 2010 to 635,000 tons in 2017 and slightly decreased to 626,255 tons in
2018. These were comprised of aromatic rice (78.8%), long-grain white rice (16.9%), and long-grain steamed rice
(4.3%), and were exported to 61 countries by 87 rice-exporting companies. However, most agricultural exports,
including rice, remain informal and unrecorded. Although there are no recent data available, informal rice export
volumes were estimated at 1.7 million tons of paddy to Viet Nam, and 250,000 tons of paddy and 450,000 of
milled rice to Thailand in 2013 (footnote 24).
31
Cambodia Agricultural Value Chain Program (CAVAC) Phase I (2010–2015), funded by the Government of Australia.Context and Strategic Issues in the Sector Assessment 9
Figure 5: Rice Exports, 2010–2019
($ million, rice milled equivalent)
7,000
6,000
5,000
4,000
3,000
2,000
1,000
0
2010 2011 2012 2013 2014 2015 2016 2017 2018 2019
Cambodia Thailand Viet Nam
Source: Food and Agriculture Organization of the United Nations. FAOSTAT Database (accessed 7 June 2021).
Official data published by the Ministry of Agriculture, Forestry and Fisheries (MAFF) and FAO disclose the
value of rice exports expressed in milled rice equivalent (Figure 5). However, no breakdown between paddy rice
and milled rice exports can be found on a yearly basis. Records show that a large portion of paddy rice is being
exported as Cambodia has limited facilities to mill their total harvested rice.
Rubber exports with minimum value-added. Despite the major price falls in recent years, the total planted
area of rubber has continued to increase from 329,771 ha in 2013 to 436,682 ha in 2018. Rubber production has
grown by an annual average of 22.0% (2010–2018) to reach 220,100 tons in 2018; however, production declined
by 20.6% to 174,700 tons in 2019. Rubber exports increased from 190,000 tons in 2017 to 217,500 tons in 2018.
Rubber is exported in the form of dry sheets or blocks only (i.e., with the absolute minimum amount of processing
consistent with producing a saleable commodity).
Increasing subsidiary crop production. Other crops present a mixed picture. Some previously cultivated cash
crops (e.g., soybean, peanuts, sesame, sugar cane, jute, tobacco) have seen area and production declines of
almost half compared to 2012. However, subsidiary annual crops (e.g., maize, cassava, sweet potatoes, vegetables,
and mung bean) saw cultivated area increases from 727,740 ha in 2017 to 1,006,542 ha in 2018. Crop yields of
cassava are notably high by regional standards, and maize yields are generally comparable to regional competitors.
The total production of these crops was 15,847,801 tons, which increased in volume by about 0.29% between
2017 and 2018.
Increasing perennial crop production. Perennial crop area (including cashew nut, mango, banana, coconut,
orange, jackfruit, durian, and black pepper) expanded from 953,597 ha in 2014 to 1,091,000 ha in 2018. Similarly,
perennial crop production increased from over 14.7 million tons in 2014 to 16.6 million tons in 2018, up 10.5%
over the past 5 years.10 Cambodia Agriculture, Natural Resources, and Rural Development Sector Assessment, Strategy, and Road Map
Livestock and Poultry Subsector
Significant increase in livestock production. Livestock production has risen by about 50.0% since 2012 and
grew by just over 3.0% in the period 2016–2017. Livestock production now constitutes 2.6% of GDP. The
total cattle population of 2.9 million is appropriate for 2018 as is the population of buffalo (500,000) in 2018.
However, the total pig population has decreased from 2.4 million in 2013 to 1.8 million in 2018, with roughly
equal contributions from smallholders and commercial enterprises.
Poor feed and breed quality constraining cattle production. Cattle production is still smallholder-based, with
families typically having one to three animals each. The usual route to domestic markets is via small traders or
collectors buying at the farm gate (weight and meat composition are estimated by sight, not by actual weighing)
for on-selling to local wholesalers, who then arrange trucking to slaughterhouses in provincial towns. Large
numbers of live animals are also sold at the borders, especially the border with Viet Nam. Cow productivity is
constrained by poor feed quality (usually local grasses). Normally, cattle graze freely in rice fields from February
to May and are kept at home and fed rice straw, cut grass, and rice bran mixed with water or banana stems during
the planting season. Other production constraints include relatively poor performing or low-weight breeds,
poor sanitation, proximity to humans and other livestock species, absence of dietary supplements, low rates of
vaccination, and poor village-level biosecurity with uncontrolled grazing practices.
Pig production facing similar constraints as cattle. Families typically have one to five animals. Feed is comprised
mainly of kitchen scraps, leftover meat, fish, and bones mixed with rice bran and vegetables. This poor feed
regimen means swine generally take 7–9 months from birth to grow to marketable size, and they retain a high fat
content at sale. Poor vaccination and disease management practices mean that porcine reproductive respiratory
syndrome (or “blue ear” ), foot-and-mouth disease, and classical swine fever outbreaks are endemic.
Expanding smallholder and commercial poultry industry. The smallholder poultry population has risen from
21.5 million birds in 2013 to 37.2 million in 2018 (footnote 7). Over the same period, commercial numbers have
fluctuated slightly (roughly 7 million birds), but the commercial flock is still double what it was in 2013. In 2016,
the MAFF estimated a 21% increase in the number of commercial farms over the previous year, from 2,539 farms
to 2,856 during 2014–2015. Poultry production is high in the south and southeast provinces bordering Viet Nam,
in the provinces surrounding Tonle Sap Lake, and in the northwest provinces bordering Thailand. Poultry
densities directly correspond to human population densities. Industrial chicken production is concentrated in
the provinces of Kandal, Kampong Speu, and Siem Reap. Traditional scavenging chicken and duck systems are
constrained by disease outbreaks, and transmission risk is greatly magnified through the large live bird markets in
urban areas.
Increasing demand for meat but inadequate domestic production. The MAFF’s Department of Animal
Health and Production estimates meat demand will increase to 300,000 tons annually by 2030. This projection
also suggests that only a relatively small proportion (perhaps 20%) of this national demand is presently met
through formal domestic supply chains (i.e., from a slaughterhouse onwards). Unsurprisingly, recorded imports
of livestock are rising rapidly. Between 2015 and 2016, live poultry imports went up 156%. Growing domestic
real incomes and changes in food consumption patterns, as well as demand from neighboring countries and the
PRC, will continue to encourage livestock expansion. At present, there are small, improved breeding programs for
cattle and pigs. The MAFF data also show there are currently 13 factories producing and selling animal feed made
from maize, cassava, broken rice and bran, trash fish, animal bones, and other ingredients. This is replacing feed
imports and using domestic raw materials, which were formerly exported to Thailand and Viet Nam.Context and Strategic Issues in the Sector Assessment 11
Animal diseases as threat to livestock industry expansion. One major constraint to future livestock industry
expansion will be the increased occurrence of animal diseases, especially in light of the COVID-19 pandemic.
Outbreaks of foot-and-mouth disease still occur regularly (there were 100 in 2016), while bird flu has been
largely under control in recent years. Recent outbreaks of African swine fever (ASF) are also a major challenge.
Cambodia has begun implementing measures on a bilateral and a Greater Mekong Subregion-wide basis to
improve sanitary and phytosanitary standards to contain transboundary animal diseases; improving surveillance
of veterinary drugs, antibiotics, and feed; maintaining the safety of animal food products; and improving border
release procedures.32
Fishery Subsector
Fish as an essential source of protein for Cambodians. Fish still provide over 80% of the protein in the national
diet, and per capita annual consumption exceeds 63 kilograms (kg) annually.33 Cambodia’s wetlands cover about
30% of the country and support one of the world’s biggest, most diverse, and intensive freshwater fisheries.
Most harvested fish are from the Tonle Sap and are migratory species. At least 20 species are important for both
domestic consumption as well as exports.34
Capture fisheries reaching their sustainable limits. Fisheries production has increased by nearly 20% since
2013, but the majority of fisheries output still comes from capture fisheries. Volumes of inland capture fisheries
have remained roughly static with 527,795 tons of catch recorded in 2017 and marine capture with just over
121,025 tons. It is widely estimated that national fish catches are only just sustainable, with additional fish
catches starting to deplete fish stocks.35 Various studies on the impacts of Mekong mainstream dams suggest
that up to 70% of capture fisheries in Cambodia are under threat and that millions of livelihoods may be affected
in the future.36
Increasing aquaculture production. Aquaculture production is estimated at 207,443 tons annually in 2017,
which is equivalent to 24% of all fisheries production. Production has increased by about 30,000 tons a year in
the last 2 years.37 Inland freshwater aquaculture systems include cage culture, low-input pond systems relying
on wild feed supplemented with on-farm products, higher input ponds (typically in peri-urban areas, often
on a commercial basis), and rice–fish systems,38 as well as community fish ponds (e.g., at schools, pagodas).
At present, the net incomes from smallholder cage culture are not sufficient to support significant investment,
and poor-quality fingerling inputs and the high cost of imported feed are a major hindrance to increased fish
farm production.
32
These measures include ADB’s support in the form of its trade facilitation project in the GMS. ADB. 2012. Report and Recommendation of
the President to the Board of Directors: Proposed Loans, Grant, and Technical Assistance to the Kingdom of Cambodia and Lao People’s Democratic
Republic for the Trade Facilitation—Improved Sanitary and Phytosanitary Handling in Greater Mekong Subregion Trade Project. Manila.
33
Per capita annual consumption can vary considerably by region and various estimates are shown in FAO, 2011 (footnote 34).
34
FAO. 2011. Fishery Value Chain Analysis in Cambodia. Rome.
35
A. Brooks, M. Philips, and C. Barlow. 2012. Fish Supply and Demand in the Lower Mekong with Special Reference to Cambodia. Final Report for
Project FIS/2010/031. Canberra: Australian Centre for International Agricultural Research.
36
Mekong River Commission. 2011. Assessment of Basin-Wide Development Scenarios. Main Report. Basin Development Plan Programme
(Phase 2). Phnom Penh and Vientiane; Supreme National Economic Council. 2007. The Report of Land and Human Development in
Cambodia. Phnom Penh; B. Chan et al. 2020. Temporal Dynamics of Fish Assemblages as a Reflection of Policy Shift from Fishing
Concession to Co-Management in One of the World’s Largest Tropical Flood Pulse Fisheries. Water. 12 (11). 2974; and P. B. Ngor et al.
2018. Evidence of Indiscriminate Fishing Effects in One of the World’s Largest Inland Fisheries. Scientific Reports. 8. pp. 1–12.
37
Footnote 8. Besides fish production, aquaculture includes crocodile farming, fish seed production, and hatcheries.
38
Fish raising in rice fields is increasing but not well documented or reported. S. Freed et al. 2020. Rice Field Fisheries: Wild Aquatic Species
Diversity, Food Provision Services and Contribution to Inland Fisheries. Fisheries Research. 229. 105615.12 Cambodia Agriculture, Natural Resources, and Rural Development Sector Assessment, Strategy, and Road Map
Cambodia’s inland capture fisheries. The inland capture fisheries in Cambodia are among the largest in the world (photo by
Asian Development Bank).
Promotion of community fisheries development. With the cancellation of all previous commercially licensed
fishing lots, policy emphasis has now been on community fisheries development.39 There are presently 475 inland
community fisheries and 41 marine community fisheries. This community-based model is suitable for high-value
fisher exports but lacks an appropriate value chain structure and organization. Community fishing areas are
demarcated with poles, some staffed with rangers, and all have patrol arrangements. There are also 644 fisheries
conservation areas nationwide, many congruent with the previously demarcated community fishing areas, and
864 community refuge ponds in 2017.40 Other conservation activities include planting marine grasses, replanting
flooded forests and mangroves, preparing broodstock pools, releasing fingerlings, and conservation of numerous
endangered species.
Significant potential for fish exports and value addition. Cambodia exports fresh and processed fish
(in smoked and frozen forms) to Hong Kong, China; Malaysia; the Republic of Korea; Singapore; Thailand;
and Viet Nam. However, the largest volumes by far are informal or unrecorded flows of fresh or dried fish trucked
to Thailand, especially from the Tonle Sap region. There is enormous potential to add value to the national
fish catch by processing fish at or near the source. This can range from making sauces, fillets, and packaged
or convenience meals. At present, there are few freezing plants in the country. There are no industrial-scale
commercial exporters transporting frozen fish products in reefer containers from Sihanoukville or shipping
fresh fish from Phnom Penh. Cambodia could tap the competitive European Union and North American
markets for high-value species production, but the absence of poor standards makes the markets unattainable
for now. As part of the MAFF’s Fisheries Administration (FiA) Strategic Planning Framework for Fisheries,
39
This follows the provisions under Subdecree No. 25 on the Establishment of Community Fisheries, published in 2007.
40
Only a few community refuge ponds are active to date.You can also read