2020 CORPORATE CITIZENSHIP REPORT - TOC - Texas Instruments
←
→
Page content transcription
If your browser does not render page correctly, please read the page content below
TOC

      2020 CORPORATE
      CITIZENSHIP REPORT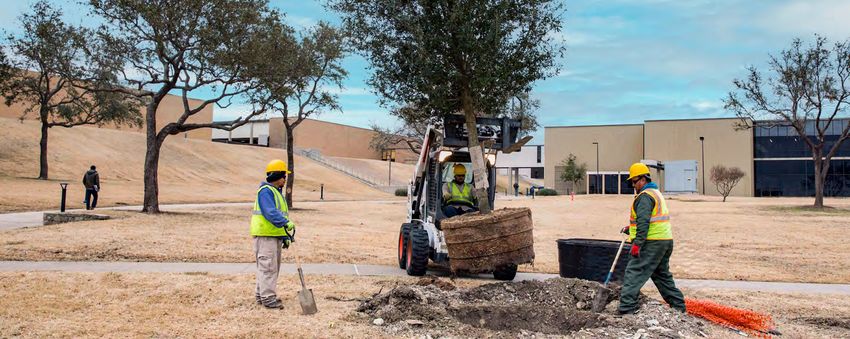
TOC

      Table of contents
      CEO letter                                Responsible business practices             Giving and volunteering
                                                 Ambitions, values and code of conduct      Giving
      TI at a glance                             Governance                                 Volunteering
                                                 Supply-chain responsibility
                                                 Conflict minerals
      Our commitment and report overview                                                   Appendices
                                                 Labor and human rights at TI
                                                 Risk management and business continuity    Task Force on Climate-Related Financial Disclosures
                                                 Information protection                     Sustainability Accounting Standards Board
      Sustainability and environmental impact
                                                 Public policy                              Global Reporting Initiative
       Air emissions                                                                        Assurance statement
       Greenhouse gas emissions
       Energy use                               Workplace
       Water and wastewater management           Diversity and inclusion
       Materials and chemical management         Recruitment and global rotations
       Product quality and reliability           Retention
                                                 Development
                                                 Compensation
                                                 Work-life balance and resources
                                                 Safety and health

                                                                                                                                                  1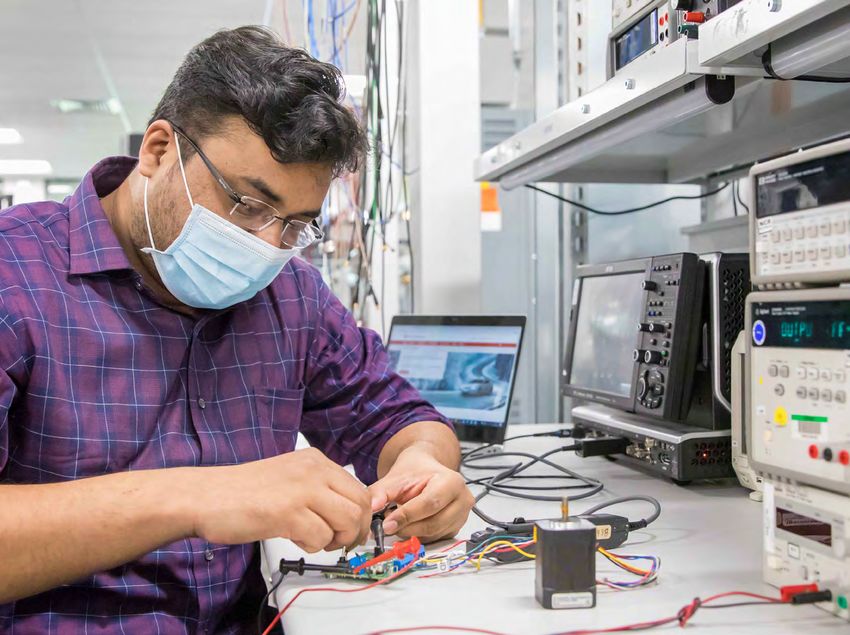
TOC
                                                                                                                                                                                    2020 CORPORATE CITIZENSHIP REPORT - TEXAS INSTRUMENTS

                                                         CEO letter                                                        Here are a few highlights from 2020 that mark the progress and continuous improvements in our corporate
                                                                                                                           citizenship, social, environmental and sustainability priorities. We:

                                                                                                                            • Supported our employees personally and professionally during the COVID-19 pandemic, according to
                                                         Our founders had the foresight to know that building
                                                                                                                              the unique needs of each location, by offering benefits such as four weeks of additional paid time off
                                                         a great company requires a special culture to thrive
                                                                                                                              for those who had related personal situations they needed to address, extended leave benefits for any
                                                         for the long term. For years, we’ve run our business
                                                                                                                              employee who tested positive for the virus, and additional resources for employees’ mental well-being.
                                                         and invested in our people and communities with
                                                         three overarching ambitions in mind. First, we will act            • Donated (in partnership with the TI Foundation, TI employees and retirees) nearly $50 million to
                                                         like owners who will own the company for decades.                    support needs in our communities, including more than $16 million to education and more than
                                                         Second, we will adapt and succeed in a world that’s                  $10 million to COVID-19 relief efforts.
                                                         ever-changing. And third, we will be a company that
                                                         we’re personally proud to be a part of and would                   • Reduced our greenhouse gas (GHG) emissions 22.4% from 2015 to 2020 (exceeding our 15%
                                                         want as our neighbor. When we’re successful in                       reduction goal) and set a new, five-year GHG emissions reduction goal.
                                                         achieving these ambitions, our employees, customers,
                                                                                                                            • Reduced our water usage 4.4% versus the previous year, exceeding our water conservation goal
  Rich Templeton,                                        communities and shareholders all benefit.
                                                                                                                              of 2.6%.
  Chairman, President and CEO
                                                       We take pride in our commitment to being a good                      • Reused or recycled nearly 90% of our waste and surplus materials.
                                                       corporate citizen – including environmental, social
      and governance (ESG) and sustainability priorities – which impact our communities and the world in                    • Received a 100% rating from the Human Rights Campaign Corporate Equality Index for the fifth year
      two ways:                                                                                                               in a row.

       • Our ambitions guide how we run our business and are foundational to ensuring that we operate in a                  • Received recognition for the 16th year in a row by from the National Association of Female Executives
         sustainable, socially thoughtful and environmentally responsible manner. Central to these ambitions                  for efforts to advance women.
         is a belief that in order for all stakeholders to benefit, the company must grow stronger over the                The progress that we share in our 2020 Corporate Citizenship Report underscores our unwavering
         long term.                                                                                                        commitment to being a good corporate citizen. With our ambitions guiding our decision-making and our
       • Semiconductors are and will continue to play a critical role in creating a better world and helping               products helping create a better world, we are confident that our collective efforts will be impactful and
         reduce environmental impacts. Semiconductors reduce energy consumption by making electric                         long-lasting.
         motors smarter, electrifying vehicles for a cleaner environment, and preserving natural resources by
         sensing water and gas leaks. For decades, we have operated with a passion to create a better world
         by making electronics more affordable through semiconductors. Our passion is alive today and is
         central to the growing list of the ways in which semiconductors help create a better world.

      During 2020, a year impacted by COVID-19, with our ambitions as our guide, we focused on the safety
      and well-being of our employees, supporting the needs of our customers and caring for our communities
      by responding to the impact of the pandemic. Our ambitions serve us well in all environments but did so              Rich Templeton
      most notably during the uncertainty that many companies experienced last year.
                                                                                                                           Chairman, President and CEO

      TABLE OF CONTENTS   CEO LETTER   TI AT A GLANCE   OUR COMMITMENT   SUSTAINABILITY   RESPONSIBLE BUSINESS PRACTICES   WORKPLACE    GIVING AND VOLUNTEERING   APPENDICES                                                            2
TOC
2020 CORPORATE CITIZENSHIP REPORT - TEXAS INSTRUMENTS
TI at a glance Major worldwide locations 1
TI headquarters Manufacturing sites
Dallas, Texas Dallas, Texas Sherman, Texas
• Founded in 1930.
Aguascalientes, Mexico South Portland, Maine
• Headquartered in Dallas, Texas. Design sites Aizuwakamatsu, Japan
• Publicly traded (Nasdaq: TXN). Dallas, Texas Baguio, Philippines
Bangalore, India Chengdu, China
• Richard K. Templeton is chairman, president and CEO.
Santa Clara, California Freising, Germany
• About 30,000 employees: Shangai, China Kuala Lumpur, Malaysia
- 12,000 in the Americas. Shenzhen, China Melaka, Malaysia
Sugar Land, Texas Miho, Japan
- 16,000 in Asia-Pacific.
Taipei, Taiwan New Taipei City, Taiwan
- 2,000 in Europe. Tokyo, Japan Pampanga, Philippines
• 14 manufacturing sites worldwide, producing tens of billions of chips each year. Tucson, Arizona Richardson, Texas
• ~ 80,000 products for over 100,000 customers.
• Industrial and automotive, the markets with the best opportunities for our products, made up
57% of our 2020 revenue.
Key
$
14.46 markets
billion
$10.9 $2.6 $1.0 Industrial: 37%
Automotive: 20%
Analog Embedded Other Personal electronics: 27%
(in billions of dollars) Communication equipment: 8%
Capital expenditures: $649 million Enterprise systems: 6%
R&D: $1.5 billion Other: 2%
Automotive and industrial comprised
57% of TI's revenue in 2019
1
TI defines major locations (significant operations) as all manufacturing facilities and design and sales offices 50,000 square feet or larger or those with employee populations greater than 100 as of Dec. 31, 2020.
TABLE OF CONTENTS CEO LETTER TI AT A GLANCE OUR COMMITMENT SUSTAINABILITY RESPONSIBLE BUSINESS PRACTICES WORKPLACE GIVING AND VOLUNTEERING APPENDICES 3
TOC
                                                                                                                                                                                                                             2020 CORPORATE CITIZENSHIP REPORT - TEXAS INSTRUMENTS

      Our commitment and
      report overview
      Texas Instruments (TI) has a long-standing commitment to being a good corporate citizen, including
      a focus on environmental, social and governance (ESG) and sustainability priorities. As with previous
      years, our 2020 Corporate Citizenship Report provides insight into how we think about – and how we
      perform – in various ESG areas relevant to our business.

      The foundation of our approach to corporate citizenship is a belief that for all stakeholders to
      benefit, the company must grow stronger over the long term. Our ambitions guide how we run our
      business and are foundational to ensure that we operate in a socially thoughtful and environmentally
      responsible manner. They state that:

       • We will act like owners who will own the company for decades.
       • We will adapt and succeed in an ever-changing world.
       • We will be a company that we’re personally proud to be a part of and would want as
         our neighbor.

      When we’re successful in achieving these ambitions, our employees, customers, communities and
      shareholders benefit.

      For many years, TI has been disclosing ESG strategies, programs and performance using the
      reporting frameworks developed by the Global Reporting Initiative (GRI)2 and the CDP3. In 2020, TI
      also adopted the Task Force on Climate-Related Financial Disclosures (TCFD)4 and the Sustainability
      Accounting Standards Board (SASB)5 reporting frameworks.

      We solicit input from internal and external stakeholders throughout the year through regular
      engagement. We also examine third-party sustainability assessments and benchmark disclosure
                                                                                                                           2
                                                                                                                             The GRI is an independent, international organization that helps businesses take responsibility for their impacts by providing them with a global common language to communicate those impacts.
      trends and best practices. We then compare these inputs to our company priorities to determine                       3
                                                                                                                             The CDP is a nonprofit that runs the global disclosure system for investors, companies, cities, states and regions to manage their environmental impacts.
      what topics and disclosures to include in our annual Corporate Citizenship Report.                                   4
                                                                                                                             The Financial Stability Board established the TCFD to develop recommendations for more effective climate-related disclosures that could promote more informed investment, credit and insurance
                                                                                                                           underwriting decisions.
                                                                                                                           5
                                                                                                                             The SASB is an independent nonprofit organization that sets standards to guide the disclosure of sustainability information by companies to their investors.

      TABLE OF CONTENTS   CEO LETTER   TI AT A GLANCE   OUR COMMITMENT   SUSTAINABILITY   RESPONSIBLE BUSINESS PRACTICES   WORKPLACE             GIVING AND VOLUNTEERING                     APPENDICES                                                                                                                4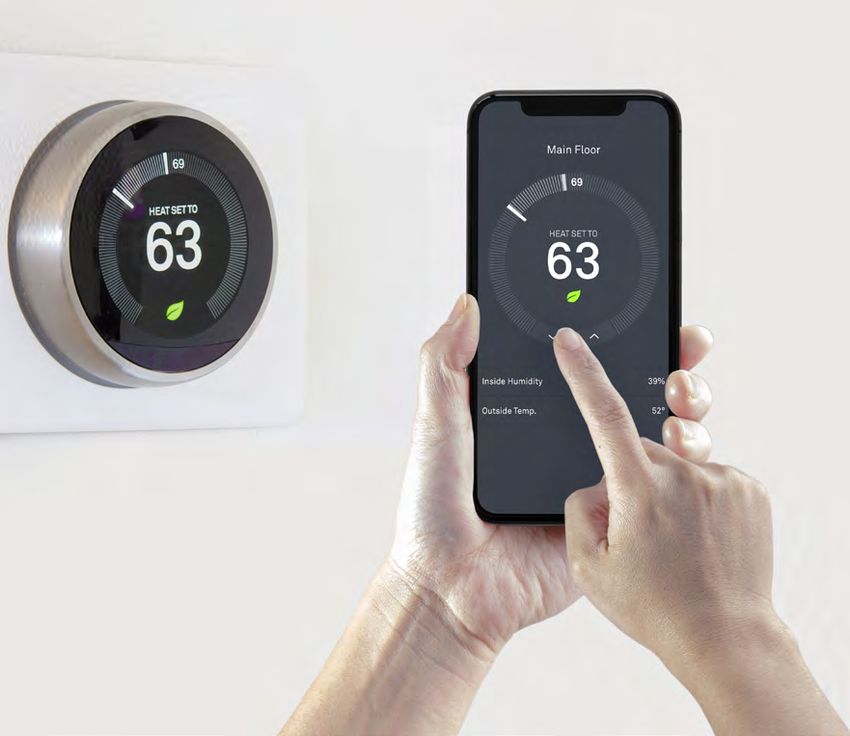
TOC

      Sustainability and
      environmental impact

                             5
TOC
                                                                                                                                                                                                             2020 CORPORATE CITIZENSHIP REPORT - TEXAS INSTRUMENTS

      Sustainability and
      environmental impact
      We produce about 40 billion semiconductor chips annually across approximately 80,000 different
      products and deliver them to more than 100,000 customers around the world every year. For
      decades we have invested in building a lasting stewardship program that conserves natural
      resources, reduces consumption and mitigates environmental impacts of our operations.

      To continuously improve our environment, safety and health (ESH) performance, we set goals to
      make our manufacturing processes water- and energy-efficient, and we reuse and recycle materials                     We provide our ESH team with extensive training and tools to implement industry best practices, drive
      across all operations. Each year, we invest in controls – from personal protective equipment, to                     continuous improvement and comply with regulatory requirements. To guide these efforts, we require
      emissions abatement, to water treatment technologies – to protect TIers, community and the                           employees and supplemental contractors6 at all manufacturing and assembly/test sites to adhere to our
      environment from harm.                                                                                               ESH Policy and Principles. TI suppliers must adhere to TI’s Supplier Code of Conduct, which uses the
                                                                                                                           Responsible Business Alliance’s (RBA) Code of Conduct as its foundation, and includes environmental
      Our ESH management system meets certification requirements set by the International Organization                     standards specifically applicable to TI’s suppliers. TI’s Living our values – TI’s ambitions, values and code
      for Standardization (ISO) 14001 (environmental management system criteria) and ISO 45001                             of conduct also includes sections on protecting human health and the environment.
      (occupational health and safety management system criteria). TI’s management system contains
      programs, policies, controls, processes and measurement tools based on industry best practices and                   For more information about TI’s ESH governance, training, policies and grievance mechanisms, see
      international standards.                                                                                             the ESH Management Approach section of the GRI Index.

      In 2020, TI was recognized again for sustainable business practices by:

      • Barron’s 100 Most Sustainable Companies.
      • Dow Jones Sustainability Index, North America.
      • Fortune’s World’s Most Admired Companies.
      • Newsweek’s America’s Most Responsible Companies.
      • Wall Street Journal’s Top 100 Sustainably Managed Companies.

                                                                                                                           6
                                                                                                                               Supplemental contractors receive daily work instruction from TI managers.

      TABLE OF CONTENTS   CEO LETTER   TI AT A GLANCE   OUR COMMITMENT   SUSTAINABILITY   RESPONSIBLE BUSINESS PRACTICES   WORKPLACE               GIVING AND VOLUNTEERING                      APPENDICES                                                     6
TOC
2020 CORPORATE CITIZENSHIP REPORT - TEXAS INSTRUMENTS
Environmental actions
Strategy Goal Progress
Greenhouse gas TI actions to reduce emissions: 2020 goal: Reduce absolute scope 1 and 2 GHG By year-end 2020, we reduced GHG emissions by 22.4%,
emissions 15% from a 2015 baseline by the end of exceeding our goal.
(GHG) emissions • Use alternative gases and chemicals. 2020.
• Install emissions abatement devices.
Since 2005, we have reduced per-chip GHG intensity by 69%.
• Purchase renewable energy sources. 2025 goal: Reduce absolute scope 1 and 2 GHG
• Optimize product shipping and distribution. emissions by 25% from a 2015 baseline by the end
of 2025.
• Avoid unnecessary business travel and subsidize employee commuting at certain sites.
Energy TI actions to reduce energy consumption: 2020 goal: Reduce energy intensity levels per By year-end 2020, we reduced energy intensity levels per chip
chip at U.S. manufacturing sites 25% from a 2010 by 40.6% from our 2010 baseline.
• Design and operate buildings and fabrication sites to optimize efficiency. baseline, with a stretch goal of 50%, to achieve the
• Upgrade and refurbish tools and equipment. U.S. Department of Energy’s Better Buildings, Better
Plants program goal by the end of 2020. From 2016 to 2020, we conserved 1.3 million British thermal
• Secure reliable and renewable energy sources. units (MMBtu) of energy – the equivalent of powering more than
• Use sensors and other automated controls. 35,000 homes for a year.
2025 goal: Reduce energy intensity worldwide 50%
• Implement routine energy conservation projects.
from a 2015 baseline goal by the end of 2025.
Water TI actions to reuse, reclaim and reduce water consumption: 2020 goal: Reduce water use worldwide by 2.6%. By year-end 2020, we reduced water use by 4.4%, exceeding
our goal.
• Install water recirculation units on thermal processing equipment to reduce the use of city water.
Over the last five years, we conserved nearly 1.4 billion gallons
• Control water alkalinity (pH) in cooling towers to prevent calcium buildup and scaling, saving of water – enough to fill more than 2,100 Olympic-sized
money and consuming less water required to flush mineral-concentrated water. swimming pools.
• Implement tool optimization and water-purification plant projects that conserve water.
Since 2005, we have reduced per-chip water intensity by 58%.
• Maximize the amount of condensate and microfiltration water directed to cooling towers.
• Reuse water with high salt or mineral content (produced as a byproduct of our ultra-pure water
system) for toilet flushing.
• Reuse water in our central utility plant cooling towers to reduce the amount of water we need from
natural sources.
Waste and TI applies a three-step approach to waste and materials management: examine what we need, reuse what 2021 goal: Divert 90% of materials that we generate By year-end 2020, we diverted 89.9% of waste from landfills
we can and recycle what is allowed. from landfills. through reuse and recycling.
materials
management Since 2005, we have reduced waste per chip by 65%.
Air emissions TI uses various controls to maintain air quality and keep emissions within permitted and regulatory limits. TI voluntarily sets site-specific chemical-reduction In 2020, TI had maintained compliance with worldwide air
goals to keep air emissions below permitted limits. emission limits.
TABLE OF CONTENTS CEO LETTER TI AT A GLANCE OUR COMMITMENT SUSTAINABILITY RESPONSIBLE BUSINESS PRACTICES WORKPLACE GIVING AND VOLUNTEERING APPENDICES 7TOC
2020 CORPORATE CITIZENSHIP REPORT - TEXAS INSTRUMENTS
Air emissions
2010-2020: Per-chip* efficiency improvements
TI manufacturing processes create certain air pollutants that are abated or treated using thermal
oxidizers, catalysts and scrubbers before being emitted into the atmosphere. GHG
ENERGY WATER EMISSIONS WASTE
Our air pollution control systems allow us to comply with permit and regulatory limits that serve
to maintain air quality in the regions in which our air emissions occur. In the U.S., TI complies with
federal and state regulatory and permit limits and reporting requirements. For more information about
how TI manages air emissions, see the ESH Management Approach and Emissions Management
0%
Approach sections of the GRI Index.
-10%
-20%
Air emissions7 -32%
-30%
120 -42%
105.12 Nitrogen oxide
-40%
-46%
95.87 94.52 96.64 97.12
100 92.77 Volatile organic
87.66
81.04 79.72 82.37 compounds
80 -50% -58%
Metric tons
60 -60%
40
TI has been working for years to drive efficiencies in its fabrication processes and equipment
20 to reduce material consumption; water, chemical and energy use; and associated air and
greenhouse gas (GHG) emissions. When comparing our per-chip data from 2010 to 2020,
0
2016 2017 2018 2019 2020 TI has reduced its manufacturing-related impacts and resource consumption.
Making chips more efficiently
Greenhouse gas emissions Why is this important?
Being a manufacturer of billions of chips a year, it is
manufacturing and technology competitive advantage
of lower cost and greater control of our supply chain.
An important additional benefit of 300mm
critical that we do so efficiently and with a commitment
to continued improvement. One way we measure our manufacturing is lower emissions and energy
TI voluntarily sets greenhouse gas (GHG) emission and energy reduction goals to reduce success is on a per-chip basis in four key areas of consumption versus older generation factories.
sustainability: energy, water, greenhouse gas emissions Since 2011, when our Richardson 300mm wafer
environmental impacts and improve efficiencies.
and waste. fabrication site came online, we’ve recognized
In addition, TI is expanding our 300mm advanced efficiencies that will continue to positively impact our
analog manufacturing facilities to strengthen our environmental footprint.
* Normalized, or per-chip efficiency data, is a way to develop a baseline and track changes in energy, water, GHG and material consumption based on
7
TI does not include nitrous oxide (N2O) in its air emissions calculations because the company accounts for N2O in its GHG emissions data. the number of chips manufactured each year.
TABLE OF CONTENTS CEO LETTER TI AT A GLANCE OUR COMMITMENT SUSTAINABILITY RESPONSIBLE BUSINESS PRACTICES WORKPLACE GIVING AND VOLUNTEERING APPENDICES 8TOC
2020 CORPORATE CITIZENSHIP REPORT - TEXAS INSTRUMENTS
Types of GHG emissions and reduction strategies
GHG emissions reduction goal
For years, TI has taken steps to reduce GHG emissions in the company’s operations, shipping and
distribution and through our supply chain. We measure and report scope 1 and 2 emissions and are 2015-2020: TI set a five-year goal in 2015 to reduce absolute scope 1 and 2 GHG
evaluating the measurement of scope 3 emissions. emissions by 15% by the end of 2020. By year-end, we reduced emissions by 22.4%,
exceeding our goal.
Scope 1
TI directly emits GHG emissions from fabrication, assembly, test, and large design and sales 2015-2025: TI is working towards a new goal to reduce absolute scope 1 and 2 GHG
locations. We mitigate these emissions by: emissions by 25% between 2015 and 2025.
• Installing efficient manufacturing technologies. The 2015-2025 goal will use 2015 as the baseline and include all manufacturing sites as well as nonmanufacturing sites greater
than or equal to 50,000 square feet.
• Eliminating nonessential fluorinated gases and using alternative gases.
• Installing thermal point-of-use abatement devices that treat the exhaust of gases used in
semiconductor manufacturing.
Scope 2
Aligning with the semiconductor industry on emission targets
TI indirectly emits GHG emissions from electricity and heat purchased for manufacturing or other
operations. We reduce scope 2 emissions by: TI is participating in a working group of industry peers to broaden emissions guidance and align on
reduction goals in accordance with science-based targets.
• Increasing the energy efficiency of our manufacturing systems, buildings and tools. In 2020, we
installed more than $400,000 in LED lighting; recovered waste heat to reduce process heating Currently, guidance from the World Semiconductor Council focuses only on scope 1 emissions
loads at our Maine fabrication site; and installed electronically commutated heating, ventilation reductions that include fluorinated gases used in today’s semiconductor manufacturing. In broadening
and air-conditioning system motors. emissions guidance, the peer working group seeks to:
• Pursuing and securing renewable energy around the world.
• Understand the process and details for adopting science-based targets.
Scope 3 • Develop a unique sector-based approach for the semiconductor industry.
TI’s supply chain, employee travel and commuting, and product distribution network generate scope • Set milestones to ensure forward progress.
3 GHG emissions. We lessen these impacts by: • Determine how the use of baseline years and previous or ongoing reduction strategies should
be considered.
• Encouraging suppliers to optimize their production and operational efficiencies.
Once the group develops and introduces new guidance, we plan to reevaluate TI’s current and/or
• Shipping items in bulk and from regional distribution centers to reduce number of shipments
and transportation-related emissions. future goals.
• Limiting business travel and providing videoconferencing capabilities. Like other companies in
2020, we significantly reduced employee travel and commuting emissions given work-from-
home safety requirements. For more information about TI’s GHG emissions reduction strategies, see TI’s CDP Climate
Change response.
• Providing on-site electric vehicle charging stations, shuttles, and biking infrastructure.
• Subsidizing mass transit and carpooling at select sites.
TABLE OF CONTENTS CEO LETTER TI AT A GLANCE OUR COMMITMENT SUSTAINABILITY RESPONSIBLE BUSINESS PRACTICES WORKPLACE GIVING AND VOLUNTEERING APPENDICES 9TOC
2020 CORPORATE CITIZENSHIP REPORT - TEXAS INSTRUMENTS
Monitoring potential risks In 2021, TI engaged with Apex Companies, LLC (Apex) to conduct an independent verification of
the greenhouse gas (GHG) emissions for 2020. As a result, several adjustments have been made to
TI faces potential risks and opportunities associated with environmental issues. To learn about our
our internal data calculation methodologies. Emissions data from 2015 to 2019 were also revised
environmental-related risks and opportunities, governance, management strategies, emissions, see
to be consistent with changes identified for 2020. The data within this report reflects our scope 1
TI’s CDP Climate Change response, the ESH Management Approach and Emissions Management
and scope 2 market-based emissions as verified by Apex. For more information, see our Verification
Approach sections of the GRI Index, and our TCFD Index.
Opinion Declaration from Apex.
Measuring GHG emissions reductions
Scope 1 GHG emissions by type
Increased wafer sizes (which yield more chips per wafer), the efficiency of semiconductor
manufacturing machinery and the reduction of chemicals have helped TI reduce normalized8 per (metric tons of CO2 equivalent) 2016 2017 2018 2019 2020
chip GHG emissions by 69.3% since 2005, despite a significant increase in production. Changes
in normalized GHG emissions per chip do occur because of variations in chip production, Carbon dioxide (CO2 ) 77,541 76,574 79,622 78,731 75,190
improvements from manufacturing equipment upgrades and energy-efficiency improvements. In Methane (CH4 ) 43 44 46 46 44
2020, TI’s normalized GHG emissions dropped 15.4% over 2019.
Nitrous oxide (N2O) 20,742 20,872 24,438 23,440 28,452
Hydrofluorocarbons (HFCs) 36,369 42,059 39,982 36,552 37,532
Perfluorocarbons (PFCs) 806,196 850,379 830,018 669,757 622,526
Total GHG emissions GHG emission per chip
(normalized to 2005 = 1 baseline)10 Sulfur hexafluoride (SF6 ) 55,177 64,537 71,240 62,084 64,061
2.5 2.39 2.48 0.6
1.30 1.32 2.24 Total Nitrogen trifluoride (NF3) 92,100 108,869 113,839 94,853 110,701
.51
1.09 2.03 Indirect 0.5
2.0 1.07 1.92
.44
0.98 Direct 0.4 .36 .36
1.5 Scope 2 GHG emissions by type
2005 = 1
MMTCO2e
.31
0.3
1.0 1.09 1.16 1.16
0.97 0.94 0.2
(metric tons of CO2 equivalent) 2016 2017 2018 2019 2020
0.5
0.1 Carbon dioxide (CO2 ) 1,295,628 1,318,254 1,083,128 1,065,885 976,610
0.0
2016 2017 2018 2019 2020
0.0
2016 2017 2018 2019 2020
Nitrous oxide (N2O) 2,487 2,595 1,679 1,673 1,386
TI unit production increased 34% from 2016 to 2020. Methane (CH4 ) 362 375 271 269 241
8
Normalized data is a way to develop a baseline and track changes in a metric year over year.
9
The 2018 increase in methane and nitrous oxide was caused by updated emission factors and the inclusion this data from TI’s international sites.
10
We measure GHG emissions intensity to assess the overall GHG efficiency of our manufacturing processes. GHG emissions refer to the total GHGs emitted, which depends on the amount of production. GHG emissions intensity attempts to normalize usage by looking at GHG emissions per unit of output (by dividing our total GHG emissions by our total production). This same definition applies to
water and waste intensity per chip data.
TABLE OF CONTENTS CEO LETTER TI AT A GLANCE OUR COMMITMENT SUSTAINABILITY RESPONSIBLE BUSINESS PRACTICES WORKPLACE GIVING AND VOLUNTEERING APPENDICES 10TOC
2020 CORPORATE CITIZENSHIP REPORT - TEXAS INSTRUMENTS
Energy use
TI’s global operations, design, manufacturing, assembly and test sites focus on lowering energy
consumption and associated GHG emissions by setting annual reduction goals and implementing
Renewable energy
efficiency projects. We focus most of this effort on our manufacturing operations because it accounts TI secures reliable energy supplies, which include renewable resources where available,
for about 90% of our total energy use. Some ways we save energy include: cost-effective and that align with our business needs and objectives. For example, we recently
secured long-term contracts for 65 megawatts of wind and solar power from new-build projects in
• Securing reliable, affordable and renewable energy sources. Texas starting in 2023.
• Building and retrofitting buildings and wafer fabrication plants to optimize efficiency and use
more efficient equipment.
Total energy (million-MMBtu) use Energy use per chip Renewable electricity as a percent of
(normalized to 2005 = 1 baseline) total electricity
12 0.5 2.0 20
0.45 Percentage
10.07 9.92 18.14% of electric
9.73 9.82 9.85
10
0.4 0.38 0.39
Million-MMBtu
0.35 0.34 1.5 15.47%
14.52% 1.52
Million-MMBtu
8 15
Million-MMBtu
Percentage
0.3 1.32
6 2005 = 1 1.0
1.22
0.2 0.70
4 10
0.5
0.1 8.39%
2
0 0.0 0.0 5
2016 2017 2018 2019 2020 2016 2017 2018 2019 2020 2017 2018 2019 2020
TI unit production increased 34% from 2016 to 2020.
Energy (million-MMBtu) savings Energy cost savings
0.35 10 Optimizing efficiency to conserve energy and reduce costs
0.32
0.29 $8.30
0.30
8
We implement more than 200 energy efficiency projects each year to reduce GHG emissions and
0.25 0.25
0.25
0.22
$6.80 $6.90 energy costs. Over the last five years, TI conserved 1.3 million MMBtu of energy – the equivalent of
Million-MMBtu
powering more than 35,000 homes for a year.
Millions $
6
0.20 $5.20
$4.42
0.15 4
0.10
In addition, TI saved $31.6 million in energy costs over this same period.
2
0.05
0 0
2016 2017 2018 2019 2020 2016 2017 2018 2019 2020
TABLE OF CONTENTS CEO LETTER TI AT A GLANCE OUR COMMITMENT SUSTAINABILITY RESPONSIBLE BUSINESS PRACTICES WORKPLACE GIVING AND VOLUNTEERING APPENDICES 11TOC
2020 CORPORATE CITIZENSHIP REPORT - TEXAS INSTRUMENTS
Energy use per chip
TI set a goal in 2010 to reduce normalized primary11 energy per pattern at U.S. manufacturing sites
by 25% by 2020, with a stretch goal of a 50% reduction. This aligned to the U.S. Department of
Energy’s (DOE) Better Buildings, Better Plants program goal for U.S. companies to voluntarily reduce
energy intensity over a decade. By the end of 2020, we reduced energy intensity by 40.6%.
We measure energy use per chip output, or intensity, to assess the overall energy efficiency of our
manufacturing processes. TI is making progress towards a new goal to reduce energy use per chip
by 50% from worldwide manufacturing sites between 2015 and 2025.
For more information about how TI manages energy use, see the ESH Management Approach and
Energy sections of the GRI Index.
TI microcontrollers give consumers more
control over energy consumption
Smart thermostat usage has increased as
consumers become more conscious of
their energy consumption and spending.
These thermostats offer a number of
advantages compared to traditional
systems, including remote access,
air-quality monitoring and occupancy
detection, ultimately reducing energy
consumption by up to 40%.
11
Primary energy is the energy content found in natural sources, such as coal or other organic material, that has not been subject to any conversion or transformation process. TI based its DOE goal on 80% production capacity and adjusted calculations for the startup and closure of its facilities.
TABLE OF CONTENTS CEO LETTER TI AT A GLANCE OUR COMMITMENT SUSTAINABILITY RESPONSIBLE BUSINESS PRACTICES WORKPLACE GIVING AND VOLUNTEERING APPENDICES 12TOC
2020 CORPORATE CITIZENSHIP REPORT - TEXAS INSTRUMENTS
Energy use by type
(MMBtu) 2016 2017 2018 2019 2020
Energy use total 9,729,088 9,819,449 10,065,223 9,918,412 9,852,837
Indirect energy use total 8,299,969 8,395,568 8,583,221 8,451,209 8,447,890
Electricity 8,245,749 8,340,181 8,531,280 8,403,250 8,399,402
District heating 54,220 55,387 51,941 47,959 48,488
Direct energy use total 1,429,119 1,423,881 1,482,002 1,467,202 1,404,947
Natural gas 1,245,657 1,243,928 1,298,548 1,285,129 1,240,015
Fuel oil (No. 6) 72,243 19,221 12,795 12,435 14,864
Diesel 46,842 40,000 44,655 33,158 25,169
Propane 61,790 118,064 123,407 133,858 122,124
Gasoline 2,586 2,667 2,596 2,622 2,776
TI wireless battery management systems improve driving range and reliability in
electric vehicles
Electric vehicles (EVs) are packed with as many battery cells as possible because the
more cells, the greater the charge capacity, which means longer distances traveled
before needing a recharge. The typical EV has nearly 100 cells that are connected to
a monitor in a series by a large amount of heavy-duty copper wire. The weight of all
of that wire affects an EV’s driving range, reliability and price.
To address the challenge, TI’s wireless battery-management systems enable the
production of EVs that are lighter, go farther on a single charge, and meet the highest
functional safety standards to improve reliability. Consumers can drive EVs more
affordably over longer distances without compromising dependability.
TABLE OF CONTENTS CEO LETTER TI AT A GLANCE OUR COMMITMENT SUSTAINABILITY RESPONSIBLE BUSINESS PRACTICES WORKPLACE GIVING AND VOLUNTEERING APPENDICES 13TOC
2020 CORPORATE CITIZENSHIP REPORT - TEXAS INSTRUMENTS
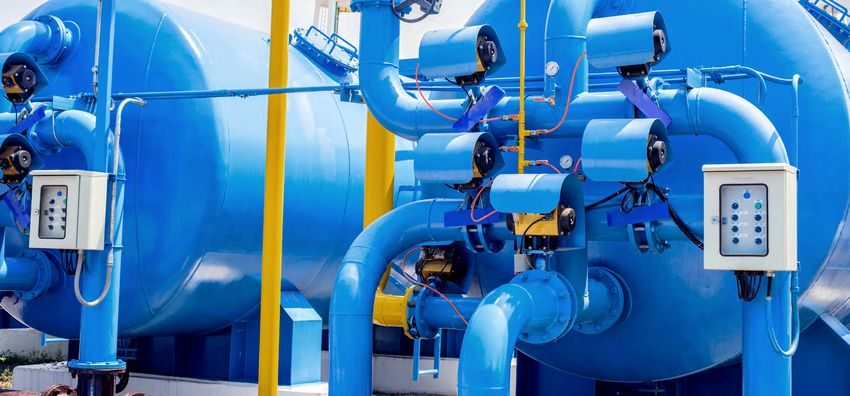
Water and wastewater management Water conservation
In 2020, we reduced water consumption 4.4% year over year, exceeding our 2.6% goal.
Water is an essential part of manufacturing semiconductors and TI is committed to using it
responsibly and efficiently. Conserving process and potable water, and treating and recycling
wastewater enables us to reduce costs, protect water quality and promote long-term availability.
We maintain and optimize our wastewater treatment systems to comply with regulations and Specific actions we take to conserve water globally include:
permit limits.
• Installing water recirculation units on thermal processing equipment to reduce the use of
city water.
Water sources • Controlling water alkalinity in cooling towers to prevent calcium buildup and scaling, saving
Our water sources include surface water from local municipal supplies and groundwater. Our water money and consuming less water to flush mineral-concentrated water.
footprint comprises three types of water: • Implementing tool optimization and water-purification plant projects that conserve water.
• Maximizing the amount of condensate and microfiltration water directed to cooling towers.
• Nonmanufacturing – used in restrooms, irrigation, drinking fountains and cafeterias.
• Reusing water with high salt or mineral content (produced as a byproduct of our ultra-pure
• Manufacturing – used to rinse wafers after chemical processing or for other
water system) for toilet flushing.
fabrication processes.
• Reusing water in our central utility plant cooling towers.
• Manufacturing support – used in exhaust abatement and cooling systems.
• Purifying and recycling higher-quality production water back to the inputs of our ultra-pure
water plants.
Water availability
We monitor future water availability for all sites, particularly those in North America and Asia. We Most of the wastewater TI generates is treated on-site to meet local, state or country-level
also work with country, regional and local agencies, suppliers, and local water utility management wastewater discharge requirements. We collect any wastewater sludge containing solvents,
and operations teams to discuss emerging risks and possible mitigation plans. For example, at concentrated metals or acid solutions and dispose of them off-site per regulatory requirements.
our Texas sites, we engage with the Texas Water Development Board and participate in its water In some cases, we send these compounds to reclamation facilities for reuse by other industries.
use survey activities. This engagement enables us to help shape the community’s water supply in
the future and prepare our operations for future water availability issues or changes to our water To learn more about our water and effluent management strategies, see TI’s CDP Water Security
management strategy. response and the ESH Management Approach and Water and Wastewater Management Approach
sections of the GRI Index.
Water conservation
TI’s water conservation and protection strategies include investing in reduction, recycling and reuse
projects while restricting, reducing and monitoring chemicals that can affect water quality. As a
requirement of our ESH management system, each of our sites annually evaluates water risks such
as availability, quality and groundwater impacts.
TABLE OF CONTENTS CEO LETTER TI AT A GLANCE OUR COMMITMENT SUSTAINABILITY RESPONSIBLE BUSINESS PRACTICES WORKPLACE GIVING AND VOLUNTEERING APPENDICES 14TOC
2020 CORPORATE CITIZENSHIP REPORT - TEXAS INSTRUMENTS
Wastewater management Total water (gallon) use Water use per chip
(normalized to 2005 = 1 baseline)
0.6
Our ESH water management standard establishes minimum requirements for water, wastewater, and 8.00
.53
6.75 6.66 6.84 6.76
stormwater quality and management at all TI sites. All TI wastewater treatment plants meet regulatory 7.00
6.37 0.5
.44 .45
requirements. Regulations require restricting or removing substances such as metals, toxic organic 6.00 .42 .42
Billion gallons
0.4
compounds, nitrates and sulfides from wastewater before discharge.
2005 = 1
5.00
4.00 0.3
3.00
TI also has internal standards, programs and procedures to ensure that stormwater runoff at all sites 0.2
complies with local, state and national discharge requirements. We conduct required water sampling 2.00
0.1
to make sure that we are operating within our permit limits. We take additional precautions at sites 1.00
in Malaysia, the Philippines and Japan because treated wastewater discharges directly into a water 0
2016 2017 2018 2019 2020
0.0
2016 2017 2018 2019 2020
body in these countries instead of a municipal treatment facility. TI unit production increased 34% from 2016 to 2020.
Water (gallon) savings Water cost savings
Conservation and savings 600 577.01 3.5 $3.30
To save water, TI implements conservation projects and reuses water in its operations. For example, 500 3.0
we reuse water from manufacturing processes in cooling towers, scrubbers and irrigation systems to
Million gallons
2.5
400
reduce or eliminate the amount of city water these systems need to operate.
Millions $
2.0 $1.80
300
$1.71
248.81 1.5
211.97 206.92 $1.30
TI completed new conservation projects in 2020 that helped us exceed our water savings goal. While 200
1.0 $0.80
overall water use increased 6.34% over 2019 as production increased to support business growth, 120.67
100
our normalized water use per chip dropped to 0.42, down .03 from our 2019 rate, reinforcing our 0.5
efficient water practices. We also reused 27%, or 1.85 billion gallons, of all water consumed in 2020. 0
2016 2017 2018 2019 2020
0.0
2016 2017 2018 2019 2020
Water consumption12 by type
Optimizing effeciency to conserve water and reduce costs
TI implements water-efficiency projects each year that reduce water consumption. Since 2016, (billion gallons) 2016 2017 2018 2019 2020
we conserved nearly 1.4 billion gallons – enough to fill more than 2,100 Olympic-sized swimming TOTAL 6.75 6.66 6.84 6.37 6.76
pools.
Municipal 4.275 4.207 4.360 4.294 4.531
In addition, TI saved $8.9 million in water utility costs over this period. Well 0.356 0.395 0.401 0.372 0.372
Rain13 0.022 0.023 0.035 – –
Reused 2.092 2.032 2.042 1.690 1.856
12
To calculate water use, we compile municipal billing data and our production metrics. We also measure effluent rates and volumes and analyze industrial wastewater and stormwater samples using standard methodologies set by the U.S. Environmental Protection Agency.
13
We elected not to report rainwater collection in 2019 and 2020 because it was not directly measured. We estimated previously reported values based on regional rainfall data and capture area.
TABLE OF CONTENTS CEO LETTER TI AT A GLANCE OUR COMMITMENT SUSTAINABILITY RESPONSIBLE BUSINESS PRACTICES WORKPLACE GIVING AND VOLUNTEERING APPENDICES 15TOC
2020 CORPORATE CITIZENSHIP REPORT - TEXAS INSTRUMENTS
Water use Water use reduction Wastewater discharges total and by type
12.0% Total
2018 2019 2020 12
Result
5
Surface
10.0% 4.08 4.16
10 3.96 3.95 3.89
Change in water storage (megaliters)15 0 0 0 Goal14 4 Municipal
0.33 0.30
0.32 0.28 0.29
Billion gallons
8
Water withdrawal (total megaliters) 18,155 17,664 18,560 3
Percentage
Surface16 132 0 0 6 5.4%
5.0%
Ground16 1,517 1,409 1,408 4.5% 4.4% 2
4.0%
4 3.64 3.67 3.75 3.60 3.86
Sea 0 0 0
2.2% 2.6% 2.6%
1
Produced 0 0 0 2
Third party 16,506 16,255 17,152
0 0
2016 2017 2018 2019 2020 2016 2017 2018 2019 2020
Fresh (≤1,000 mg/L total dissolved solids) 17
18,155 17,664 18,560
Other (≤1,000 mg/L total dissolved solids) 17 0 0 0 14
We revised our 2016-2019 water reduction goals to show year-over-year improvement instead of improvement compared to a 2013 baseline.
15
There is a small amount of water storage (relative to overall usage) in facilities systems, but the year-over-year change is not significant.
Water withdrawal in water-stressed regions 16
This does not include once-through cooling water, which is pumped from on-site wells at our Freising, Germany, site and used only for heat rejection. This water returns to the original aquifer.
17
TI does not monitor total dissolved solids continuously at all sites.
(total megaliters) 3,352 2,674 2,692 18
TI calculates consumption as water withdrawn minus water discharged.
Surface16 0 0 0
Ground16 40 44 35
Sea 0 0 0
Produced 0 0 0
Third party 3,312 2,630 2,658
Fresh (≤1,000 mg/L total dissolved solids)17 3,352 2,674 2,692
Other (≤1,000 mg/L total dissolved solids)17 0 0 0
Water discharge (total megaliters) 15,410 14,711 15,735
Surface16 1,235 1,098 1,124
Ground16 0 0 0
Sea 0 0 0
Third party 14,175 13,613 14,611
Fresh (≤1,000 mg/L total dissolved solids)17 Unknown Unknown Unknown
Other (≤1,000 mg/L total dissolved solids)17 Unknown Unknown Unknown
Water discharge (water-stressed areas,
2,860 2,278 2,310
megaliters)
Fresh (≤1,000 mg/L total dissolved solids)17 Unknown Unknown Unknown
Other (≤1,000 mg/L total dissolved solids)17 Unknown Unknown Unknown
Water consumption (total megaliters)18 2,745 2,953 2,825
Water consumption (water-stressed areas)18 491 396 382
TABLE OF CONTENTS CEO LETTER TI AT A GLANCE OUR COMMITMENT SUSTAINABILITY RESPONSIBLE BUSINESS PRACTICES WORKPLACE GIVING AND VOLUNTEERING APPENDICES 16TOC
2020 CORPORATE CITIZENSHIP REPORT - TEXAS INSTRUMENTS
Material and chemical management
TI believes in responsibly managing the use and disposal of materials and chemicals. We make every
effort to purchase only what is necessary to run our business, and recycle, reuse or sell scrap and
waste materials. This practice helps protect the environment and reduce the amount of material we
send to landfills.
We also educate employees about the importance of doing their part to reduce waste. Depending
on the site, ESH personnel may spearhead recycling drives, promote the composting of food scraps
or encourage other waste-management practices. While our programs and infrastructure vary by
location, our commitment to reducing waste remains the same.
Managing chemicals and gas use
Manufacturing world-class semiconductors involves using hazardous and nonhazardous
chemicals and gases, which is why TI’s product-management systems have stringent controls
in place. We continually: We apply a three-step approach to material and chemical management:
• Identify and use the safest, lowest-risk materials in operations to protect TIers, site Step 1: Examine what we need.
communities and consumers. Where possible, we use high-pressure water instead of Most of the materials we need are for fabricating semiconductors. When purchasing materials and
chemicals in certain cleanup applications or replace chemicals with environmentally chemicals, we consider the resulting waste, and whether an opportunity exists to reuse existing materials,
benign substitutes.
purchase recycled materials or use environmentally friendly items instead.
• Screen all incoming materials and chemicals before incorporating them into semiconductor
manufacturing processes to comply with regulatory and customer requirements. We also
incorporate any chemical restrictions and standards into supplier contracts. Step 2: Reuse what we can.
We reuse materials and chemicals by:
• Assess potential ESH impacts of materials as new scientific information becomes available and
new regulations go into effect. • Recovering metals from solids, liquids, scrap wafers and other materials.
• Follow strict standards and protocols for responsibly purchasing, transporting, tracking and • Repurposing and reselling used process chemicals, chemical containers and older
disposing of chemicals safely. manufacturing equipment.
• Provide specific procedures and training for the use, labeling, storage and disposal • Reusing wafer carriers and food service tableware.
of chemicals or hazardous substances, including the proper use of personal
protective equipment.
Step 3: Recycle what is allowed.
• Use ventilation controls, abatement systems, leak detectors and appropriate Our recyclable material and chemicals come primarily from our offices and manufacturing sites. These are
treatment technologies.
managed and regulated differently depending on local requirements.
TABLE OF CONTENTS CEO LETTER TI AT A GLANCE OUR COMMITMENT SUSTAINABILITY RESPONSIBLE BUSINESS PRACTICES WORKPLACE GIVING AND VOLUNTEERING APPENDICES 17TOC
2020 CORPORATE CITIZENSHIP REPORT - TEXAS INSTRUMENTS
If concerns about a chemical or other material arise during our screening process, we elevate the
matter to our Chemical and Material Review Board, comprising internal subject-matter experts. In
Material use
the rare event that a chemical or material is necessary for manufacturing but still raises concerns, our TI reused or recycled nearly 90% of the 42,220 metric tons of waste and surplus materials generated
manufacturing leaders review the situation and, if necessary, seek a safer alternative or implement in 2020. We did this by selling surplus chemicals; recycling certain wastes for use in energy recovery;
more stringent use controls. and recycling scrap wood, paper, glass, metals and organic materials. We properly dispose of waste
and materials that we cannot recycle or reuse per applicable federal, state and local laws.
Phasing out substances of concern
One challenge facing the electronics industry is reducing or eliminating the use of compounds that Total materials generated Waste use per chip
(normalized to 2005 = 1 baseline)
are essential but potentially harmful. These include: .49
50 0.5
.46
• Brominated and chlorinated flame retardants – while these compounds pose no risk in TI 42.22
40 36.72 37.19 37.27 0.4
products as sold, their improper or unsafe disposal is of concern. Over the last two decades,
Thousand metric tons
.34 .35
32.12 .31
we’ve proactively removed these chemicals from 99% of our products.
2005 = 1
30 0.3
• Perfluorinated substances (PFOSs) and perfluorooctanoic acid (PFOA) – these oil and water 20 0.2
repellants cause potential health effects. TI stopped using PFOSs in 2015 and plans to
eliminate PFOAs from fabrication processes in 2021. TI and other chipmakers are working with 10 0.1
the Semiconductor Industry Association to devise acceptable alternatives to these chemicals.
0 0.0
2016 2017 2018 2019 2020 2016 2017 2018 2019 2020
TI unit production increased 34% from 2016 to 2020.
Transparency on product substances
Documents and tools are available to our customers that outlines the measures we take to ensure
For more information about how TI manages materials, see the ESH Management Approach and
that TI parts comply with global material restrictions and regulations, including:
Materials sections of the GRI Index.
• Controlled Chemical and Materials Specifications.
• List of TI-Restricted Chemicals and Materials.
• TI’s Approach to Environmental and Product Stewardship.
• A search tool to find material content, download restricted chemical test reports, or locate
product RoHS, REACH and green status.
• Quality, Reliability and Packaging Data.
• Lead-Free Conversions.
• Low Halogen (Green) Statement.
• Environmental FAQs.
TABLE OF CONTENTS CEO LETTER TI AT A GLANCE OUR COMMITMENT SUSTAINABILITY RESPONSIBLE BUSINESS PRACTICES WORKPLACE GIVING AND VOLUNTEERING APPENDICES 18TOC
2020 CORPORATE CITIZENSHIP REPORT - TEXAS INSTRUMENTS
Waste by type Nonhazardous waste Hazardous waste
35 12 11.20 30 28.40
31.70 Hazardous 11.03 Recycled Recycled
30
Nonhazardous 10 9.53 9.56 Disposed 25 23.87 Disposed
26.73 9.08 22.31
Thousand metric tons
Thousand metric tons
Thousand metric tons
24.42 25.31 21.83
25
8 20
20.68 17.99
20
6 15
15
11.45 12.30 11.88
10.35 10.52 4 10
10
2.69
2 5 3.00 3.31
5 1.09 0.85 0.81 0.96 2.69 2.59 2.87
0 0 0
2016 2017 2018 2019 2020 2016 2017 2018 2019 2020 2016 2017 2018 2019 2020
Giving used materials and precious metals a new life
TI’s manufacturing operations generate large amounts of scrap and salvage
materials, from silicon, to integrated circuits, to manufacturing and testing
equipment, to furniture and computers. To breathe new life into these items,
we make every effort to reuse them internally, resell them for reclamation on
the open market, or donate them to universities and nonprofits. Across the
company, we reused or recycled nearly 90% of the materials and chemicals
generated in 2020. Our Taiwan site recycles 100% of all waste, and three
other sites recycle 100% of their nonindustrial waste.
TI sells scrap and salvage materials to entities that can recycle, reclaim
or resell them. In 2020, our U.S. sites sold about 540 metric tons of
these materials.
TABLE OF CONTENTS CEO LETTER TI AT A GLANCE OUR COMMITMENT SUSTAINABILITY RESPONSIBLE BUSINESS PRACTICES WORKPLACE GIVING AND VOLUNTEERING APPENDICES 19TOC
2020 CORPORATE CITIZENSHIP REPORT - TEXAS INSTRUMENTS
Product quality and reliability
Committment to quality and support
Optimizing the quality and reliability of our technologies extends their longevity and helps reduce We measure customer return performance, which assesses our performance on both resolution cycle
environmental impacts. Our analog and embedded semiconductors enable our customers to create time and return parts per billion. Both measures are essential to maintaining high levels of customer
electronics that are smaller, more efficient, more reliable and more affordable. Our objective is to service and product quality and reliability.
provide products that solve our customers’ problems, delivering them on time with zero defects.
To drive continuous improvement, we assess, categorize and aggregate the reason for each return
Our TI-owned and regionally diverse manufacturing footprint includes 10 wafer fabrication plants, to identify systemic improvement opportunities. More than 85% of TI products have not had a single
seven assembly and test sites, and multiple bump and probe facilities across 14 sites worldwide. We customer return in three years.
manufacture about 80% of our wafers internally. In addition to our internal capacity, we have strong
partnerships with external foundries and subcontractor partners to offer supply continuity.
Our manufacturing strategy aims to deliver capacity ahead of demand, strategically investing in
TI’s Quality System Manual describes the company’s quality-management processes and systems,
300-mm analog wafer fabrication plant capacity for long-term growth and having the ability to
while its quality policy and procedures provide the framework to quickly identify and resolve quality
source more than 75% of products from multiple sites for supply continuity. Additionally, we pair
issues. We incorporate industry requirements and standards, along with customer specifications and
our disciplined approach to order fulfillment and inventory management with resilient business
feedback, to mitigate risks and drive improvement throughout a product’s life cycle.
continuity processes.
We also measure several key performance indicators of product and service quality to make
Quality and reliability continuous improvements. We developed internal quality standards to comply with numerous
industry standards and quality specifications, including ISO 9001, ISO 14001, ISO 45001,
Quality permeates every corner of TI. We focus attention on excellence throughout the product
International Standard for Automotive Quality Management Systems 16949 and the Underwriters
lifecycle: in product development, manufacturing and assembly, product testing, and customer
Laboratories rating.
support.
TI builds quality and reliability into each step of the product development journey. This helps Product longevity
us build reliable technologies that meet the stringent qualification standards for industrial (Joint
We are committed to product longevity and continuity of supply for our customers, with life-cycle
Electron Device Engineering Council) and automotive (Automotive Electronics Council Q100)
management policies and inventory and manufacturing strategies that allow us to sell and support
products. We use specialized materials and controls to build high-quality products, test silicon and
products for a decade or more. We routinely evaluate customer quality data, develop quality
package technologies and continuously monitor wafer-level reliability. By the time we start product
improvement plans and conduct quarterly internal quality audits to ensure that our products are
qualification, our goal is to have high data-backed confidence that the product is fully reliable and will
long-lasting.
meet customers’ long-term quality needs.
TABLE OF CONTENTS CEO LETTER TI AT A GLANCE OUR COMMITMENT SUSTAINABILITY RESPONSIBLE BUSINESS PRACTICES WORKPLACE GIVING AND VOLUNTEERING APPENDICES 20TOC
2020 CORPORATE CITIZENSHIP REPORT - TEXAS INSTRUMENTS
Packing and shipping
We pack and ship products efficiently to assure timely distribution to customers, comply with
international shipping regulations and emissions. For example, we:
• Pack large quantities of products into each shipment to eliminate multiple deliveries. We also
increase packing density to move actual weights closer to charged dimensional weights.
• Use air pillows in packaging that are recyclable, reusable and contain recycled content.
• Eliminate heavy and expensive custom-cut foam, nonrecyclable foam, and foam and
cardboard waste.
• Require that suppliers ship all new 300-mm wafers in reusable containers. When empty, we
return these containers to the supplier for reuse or we use them internally. In 2020 alone, we
reused about 28,000 of these containers, generating about $800,000 in supplier rebates.
• Reuse packing materials that protect products during shipment (such as bubble pack and
foam), shipping materials (such as boxes, crates and pallets), cases that ship precious metal
reclaimable items to vendors, and plastic reels used in product distribution.
Additionally, TI participates in the European Union (EU) Waste Electrical and Electronic Equipment
(WEEE) and EU Packaging and Packaging Waste recycling programs for evaluation modules
imported into that region.
We place our distribution centers in regions close to customers to accelerate delivery times, improve
efficiency and facilitate product deliveries in the event of a disaster. We work with our customers
to understand their delivery needs and ship in bulk when possible. This practice enables us to
ship mutually agreed-upon low-priority freight when space becomes available on more affordable
shipping options.
In 2020, TI improved the sustainability of shipments from its factories to its assembly/test sites
by shipping one wafer pack of 25 wafers instead of two wafer packs of 13 wafers. This helped us
reduce plastic packing material by 50%.
TABLE OF CONTENTS CEO LETTER TI AT A GLANCE OUR COMMITMENT SUSTAINABILITY RESPONSIBLE BUSINESS PRACTICES WORKPLACE GIVING AND VOLUNTEERING APPENDICES 21TOC
Responsible business
practices
22TOC
2020 CORPORATE CITIZENSHIP REPORT - TEXAS INSTRUMENTS
Responsible business Our values and code of conduct
practices
Our values define who we are and how TIers should behave, which includes being trustworthy,
inclusive, innovative, competitive and results-oriented. Each TI employee is also expected to
understand our code of conduct, which further translates our ambitions and values into the
standards we must uphold, and provides clarity about the behaviors we will not tolerate.
Trustworthy
Our ambitions, values and code We start by being trustworthy. We act with integrity and do the right thing, every time. We operate in
a socially responsible way. Being trustworthy is foundational for us as a company and as individuals.
of conduct Inclusive
We thrive by being inclusive. We create an environment that unlocks everyone’s potential, where we
A document called Living our values – TI’s ambitions, values and code of conduct outlines standards
treat one another with respect, value our differences, and are encouraged to put our thoughts and
for professional conduct at TI. Every TIer plays a critical role in living our values and upholding these
ideas on the table.
principles, which we reinforce through leader involvement, employee engagement and training.
Innovative
Our ambitions We win by being innovative. We imagine new technologies that produce compelling products,
For decades, we have operated with a passion to create a better world by making electronics more open new markets and improve our competitiveness. We are curious, persistent and determined to
affordable through semiconductors. For many years, we’ve run our business with three ambitions in overcome barriers.
mind:
Competitive
• We will act like owners who will own the company for decades.
• We will adapt and succeed in a world that is ever-changing. We embrace a competitive world. We hate to lose, so we continuously challenge ourselves to
perform at our best. We invest in the best opportunities for sustainable growth. To stay competitive,
• We will be a company that we’re personally proud to be a part of and would want as we attract, develop and retain the best people.
our neighbor.
Results-oriented
When we’re successful in achieving these ambitions, our employees, customers, communities and
shareholders all win. We are results-oriented and hold ourselves accountable. Our customers have choices, and we act
with urgency and deliver on our commitments. We improve our performance every day to help our
customers succeed.
TABLE OF CONTENTS CEO LETTER TI AT A GLANCE OUR COMMITMENT SUSTAINABILITY RESPONSIBLE BUSINESS PRACTICES WORKPLACE GIVING AND VOLUNTEERING APPENDICES 23You can also read