2018 Sustainability - Better Buildings ...
←
→
Page content transcription
If your browser does not render page correctly, please read the page content below

2018
Sustainability
Report
Contents
                                   Page
                                   04–35                      36–43                                44–75
                                   SECTION 1                  SECTION 2                            SECTION 3
                                   Executive Summary and      Delivering Positive Social Impacts   Reducing our Carbon Emissions
                                   Key Messages

                                   76–83                      84–103                               104–113
                                   SECTION 4                  SECTION 5                            SECTION 6
                                   Reducing our Water Use     Managing Resource Use                Managing Health and Safety

                                   114–121                    122–135                              136–150
                                   SECTION 7                  SECTION 8                            SECTION 9
                                   Upskilling and Inspiring   Corporate Data                       Reporting Approach and
                                   our People                                                      Data Management

Cover picture: detail of roof at
Victoria Quarter, Leeds.

This page: Restaurant terrace at
Terrasses du Port, Marseille.
Section 1

            Chief                       2018 has been another busy

            Executive
                                        year for Hammerson and
                                        our focus on excellence has

            Statement
                                        continued to deliver strong
                                        sustainability outcomes.

                                        O      ur sustainability achievements in 2018 have been significant
                                               across each of our three key operating countries. Having

Section 1
                                        recognised early the significance sustainability would have for our
                                        business, Positive Places has become one of the most successfully
                                        embedded sustainability strategies within our sector, a view
                                        supported by discussions with key stakeholders during our 2018
                                        materiality review. Our approach has enabled us to deliver a
                                        consistently strong performance against our sustainability targets
                                        and I am pleased to be able to share similarly successful outcomes

Executive
                                        for 2018. A further 19% improvement in the carbon intensity of the
                                        business, one of our five corporate KPIs, shows the progress we are
                                        making in decoupling business output from rising carbon emissions.

                                        Positive Places includes both our environmental and social impacts;
                                        and I was delighted to start the year with an event in the House of
                                        Commons to celebrate the positive social impacts that our retail

Summary
                                        portfolio brings to our local communities. It was enormously
                                        encouraging to be able to share this positive message with so many
                                        and to hear first hand how local people are benefiting from our
                                        employment and skills brokerages and community partnerships.

and Key
                                        More on our external engagement on pages 36–43

                                        Our environmental focus remains clearly on minimising demand
                                        for grid energy, reducing both cost and carbon emissions whilst
                                        also mitigating our energy supply risk. This strategy has generated
                                        some 11% reduction in absolute carbon emissions in 2018, bringing

Messages    19
                                        the total reduction across our portfolios to 22% since 2015 even

                      %
                                        though the portfolio has grown. Our investment in renewables is
                                        contributing to this reduction whilst producing income for the
                                        business. This consistent approach has enabled us to achieve our
                                        short term carbon emissions reduction targets ahead of schedule.

                                        Our targets to be Net Positive for carbon emissions, water,
                                        resource use and socio-economic impacts by 2030, remain as
                                        challenging as we expected. Our current projections anticipate a
            improvement in the carbon   requirement for approximately 12,000 tonnes of carbon offset in
            intensity of the business   2020 and we are developing a number of initiatives to deliver this.

4                                                                                       S TAT E ME N TS       5
Section 1
Our strategy has generated
11 %
reduction in absolute carbon
Our work with retailers on improving the energy efficiency of
store fit out has already generated significant savings and we see
the reduction of these scope 3 emissions as a priority for offsetting
our remaining scope 1 and 2 emissions over the next two years.
Making a commitment to find ways to offset our remaining
Delivering our Net Positive targets
I am hugely encouraged by the way all my colleagues have been
inspired to step up to the Net Positive targets the business has set,
and the progress we have made as a result.We need to do more and,
as the more straight forward savings are made, achieving further
reductions will become more challenging. We are also working
As we look back on 2018 it may turn out to have been something of
a watershed year for sustainability. The 2015 Paris Accord seems to
have energised many business leaders to address climate change,
even with limited political leadership on policy. This lack of political
clarity makes it even more important for business to step up and
emissions in 2018 across the environmental impacts in this way is bold but this is the scale of
within a more capital constrained operating environment as we help shape our sector’s response to this increasingly pressing issue,
anticipate heading into an increasingly challenging phase for the and drive initiatives that we are confident will work.
retail portfolios, bringing the response needed to tackle climate change, as made clear by the
economy. This certainly won’t change our commitment to our Seen in this context our decision to set challenging Net Positive
recent reduction of the global warming target agreed within the 2015
total reduction to Paris Accord from 2°C to 1.5 °C. Businesses will be expected to be at
Positive Places strategy or our Net Positive targets, particularly targets for the business in 2017 was clearly the right one.
as the financial benefits from our key projects are clear – both
22
the forefront of this challenge.
%
for us and our tenants. However I will continue challenging
each business area to find low cost and new ways of reducing The lack of political clarity regarding climate change
Responding to climate risk our impacts and work with the Positive Places team, to make policy makes it even more important for business to
the business case for any initiatives as strong as possible as they
Climate change remains our overriding sustainability concern and step up and help shape our sector’s response to this
compete with all other business streams for capital allocations.
energy demand is our direct link with it. Our climate risk exposure
The same challenge goes out to our major suppliers – we expect increasingly pressing issue, and drive initiatives that
to extreme weather events was confirmed as limited by the portfolio
their expertise to support the delivery of these targets. we are confident will work.
climate risk analysis completed this year. We are responding to
the risks identified by building resilience into new assets and into
since 2015 asset management plans. We are also developing our understanding Our discussions with stakeholders for our materiality review
of how our existing buildings perform under climate stress. For this year revealed a sharp increase in focus on sustainability
example, our artificial intelligence project with tech start-up Grid Our headline financial savings from environmental governance and reporting as investors, in particular, want to
Edge at Bullring in Birmingham is using machine learning to link initiatives can be seen on pages 18 understand how different companies compare. This report is
building thermal performance data to forecast weather conditions designed to provide exactly that level of transparency. I am sure
“I am hugely encouraged by and footfall to enable us to optimise building operation. In interesting times
Delivering one of the most ambitious sustainability programmes
you will find it interesting and useful and as always, if you have any
suggestions or questions, we welcome your feedback.
the way all my colleagues
What does the future hold?
in the sector is certainly not easy. We have not been able to deploy
Looking forward, Positive Places is at the heart of our City as much PV as we wanted to in 2018 for a variety of reasons
have been inspired to step Quarters strategy, announced in July. The development of our
land holdings around our assets is a unique opportunity to
including challenges with local network operators and tenants.
The extreme cold at the beginning of the year and extreme heat
up to the Net Positive reinforce the link between those assets and the community they
serve, by providing new facilities, public realm, infrastructure and
in the summer impacted our energy demand, particularly in our
most northerly assets. Plus, the split incentive issue remains,
Our Positive Places website provides further
information on our performance and initiatives:
targets that the business opportunities that speak to the needs of future generations.
As we reach a potential technological watershed affecting where and
where investments that we make deliver direct business benefits
to our retailers through reduced service charge. But these are
sustainability.hammerson.com
has set and the progress we how we work, travel and spend our leisure time, our Hammerson
assets will be positioned to respond and to do so in a fundamentally
all issues we are experienced in addressing and will continue
to overcome. The UK’s changing political landscape presents
David Atkins
Chief Executive
have made as a result.” positive way. The knowledge our teams have already developed in
delivering sustainable projects will underpin our City Quarters
challenges for all areas of the business as uncertainty impedes
decision-making and slows activity. For sustainability,
strategy and the delivery of long term value for the business. however, the agenda is effectively a global one so we remain
clear in our purpose.
6 S U S TA I N A B I L I T Y RE PORT 2018 S TAT E ME N TS 7
Section 1
Group W ith just two years to go before we reach the first of our three
17
Net Positive target milestones, our attention has been
heavily focused on reducing our carbon emissions and identifying
%
Head of
opportunities to reduce scope 3 emissions. We are making steady
progress and I am hugely encouraged by the collaboration and
innovation that setting such ambitious targets has drawn from reduction in energy demand
Sustainability
colleagues, suppliers and the wider stakeholder group. since 2015
Statement
Our 2018 materiality review
£790k
Our Positive Places strategy is designed specifically to address our
most material issues, as the sustainability agenda is constantly
evolving this year we carried out a materiality review with
stakeholders to ensure we remain focused on the right areas. This
Our Positive Places sustainability in energy cost savings to the
was enormously useful and the insight we gained has influenced this
strategy has continued to make report and will continue to be reflected in our over-arching strategy. business and our retailers in 2018
strong progress in 2018, reducing
our environmental impacts and
extending our positive social
impacts across our assets. Find out more about our materiality review on The science behind our targets is sound – we have calculated our Since the operation of our French assets has been brought
pages 24–25 environmental and socio-economic footprints using data from the in-house, mirroring our approach in the UK, the management
business and from our tenants and visitors, so we know what our teams have achieved significant improvements in
A key change we noted over the four years since our last review
significant impacts are, including those from our tenanted space environmental performance. Improvements in building
was the significant increase in importance attributed to climate
and our visitors. Whilst this report is focused most specifically on management systems, investment in LED lighting and greater
change risk. We have a comprehensive strategy embedded across
our 2018 performance and short term targets, our performance vigilance of performance have enabled the French portfolio to
the business supporting a consistent and managed approach to
against our Net Positive targets is also provided. Our targets to achieve an impressive 27% reduction in energy demand since
the monitoring of our exposure to climate risk alongside other
2020 are designed to support the delivery of our target to be Net 2015, 15% in 2018 alone.
corporate risks, as recommended by the Financial Stability Board’s
Positive for scope 1 and 2 emissions by that date.
Task Force on Climate Related Financial Disclosures (TCFD). We reported last year that we expected our development at Les 3
Fontaines Cergy to bring opportunities for carbon and materials
Addressing scope 3 emissions savings and this has been the case. Working closely with our
contractor, Bouygues, we have achieved a significant reduction in
Through our work with retailers we are beginning to be able to
virgin materials and a saving of over 274 tonnes in embodied carbon
influence carbon reductions in the let space within our assets.
Key findings of our climate risk study and our approach emissions through the specification of recycled content within the
to managing our sustainability risks are provided on This is a key focus area for the business as it presents a significant
concrete and steel used for the build.
pages 26–27 opportunity to reduce overall emissions from our portfolios whilst
also saving our retailers money. Our work with retailers at Elliott’s As public expectations of businesses to take clear responsibility
Field Retail Park, Rugby, has enabled them to reduce the energy for their environmental and social impacts increases we
Our latest materiality review confirmed that our key environmental
demand in their stores on that site by up to 30% compared with are pleased to see Hammerson’s foresight in developing a
target area remains reducing energy demand across the operational
their other stores. This has potential benefits that go way beyond comprehensive sustainability strategy place us at the forefront of
portfolio. This is still the major driver of our carbon emissions and
our portfolio but is exactly the sort of outcome that is needed to our sector. It is clear from our conversations with investors and
an impact over which we either have control, within common areas,
bring about meaningful change. other stakeholders that sustainability is no longer optional but
or can influence through our relationships with retailers. I am
an imperative within a responsible, forward thinking business
very pleased to be able to report that we have made a further 6%
Tackling waste strategy. As we face an uncertain business outlook, increasing
reduction in energy demand across the landlord controlled areas
climate change is one of the few certainties on the horizon. Our
in 2018 bringing our total efficiency gains to 17% since 2015. This Waste management remains a key focus area for us as
full Sustainability Report contains extensive data on our 2018
has delivered £790k in savings to the business and our tenants management costs rise and the organic waste streams from our
performance and is designed to be as transparent and useful as
in 2018. We have provided a brief overview of the findings of our assets increase. Many of our assets are achieving impressive
possible. I hope you find the report interesting and if you have any
materiality review on page 24–25 with a summary report available recycling rates leading to rising income from waste being returned
comments, questions or feedback please do let us know.
on the Positive Places website. to our tenants through service charge. Organic waste has been
a focus this year with great results from the Biowhale at Cabot
Responding to international goals Circus in Bristol and Westquay in Southampton and our new Louise Ellison
coffee waste recycling scheme at Victoria, Leeds. Group Head of Sustainability
Our Positive Places strategy and targets align with the four
United Nations Sustainable Development Goals identified as We confirmed through our supply chain that our recycling does
most relevant to our business. They exceed the current carbon not go beyond Europe so the only impacts we have experienced Our sustainability reporting also includes our Annual Report and
efficiency trajectory required for achieving 1.5°C scenario and from the policy changes in international recycling have been accounts and reflects the compliance requirements of GRI and the EPRA
Sustainability Best Practice Reporting Standards.
respond to the risk management expectations of the TCFD cost increases. We are expecting costs to rise further once the
reporting requirements. UK leaves the EU due to labour shortages.
8 S U S TA I N A B I L I T Y REPORT 2018 S TAT E ME N TS 9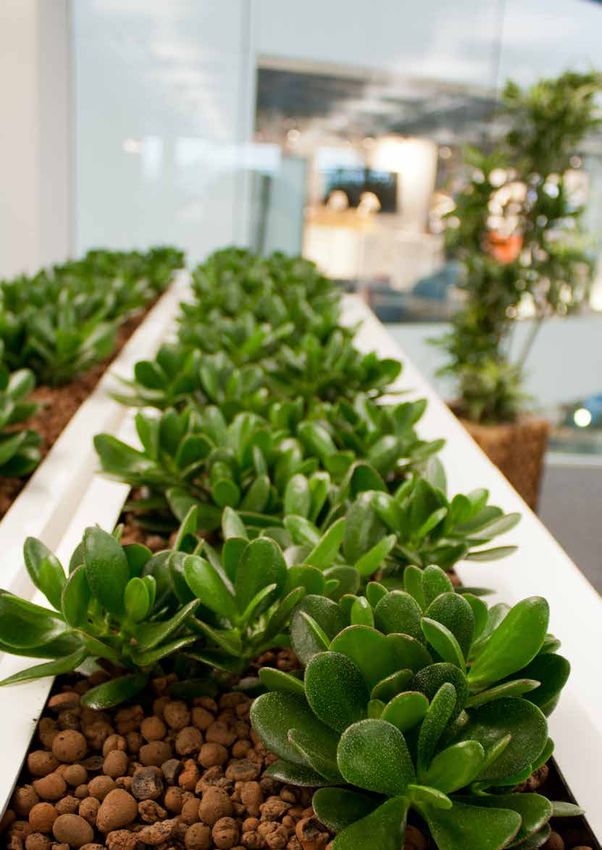
Section 1

     About Hammerson
     We own, operate, curate and develop winning
     European destinations. Bringing together the
     very best retail, leisure and entertainment
     brands, we seek to deliver value for all
     our stakeholders, creating a positive and
     sustainable impact for generations to come.

Our 2018 portfolio includes investments in:

21 13 20
prime shopping                                   convenient retail   premium outlets
centres in the UK,                               parks in the UK     across Europe
Ireland and France

                                                                                       UK shopping centres   France shopping centres   Ireland shopping centres

A full list of properties is included in our sustainability
reporting shown on pages 142–145
                                                                                       UK retail parks       Premium outlets

10      S U S TA I N A B I L I T Y REPORT 2018                                                                                            A BO UT H A MME RS O N   11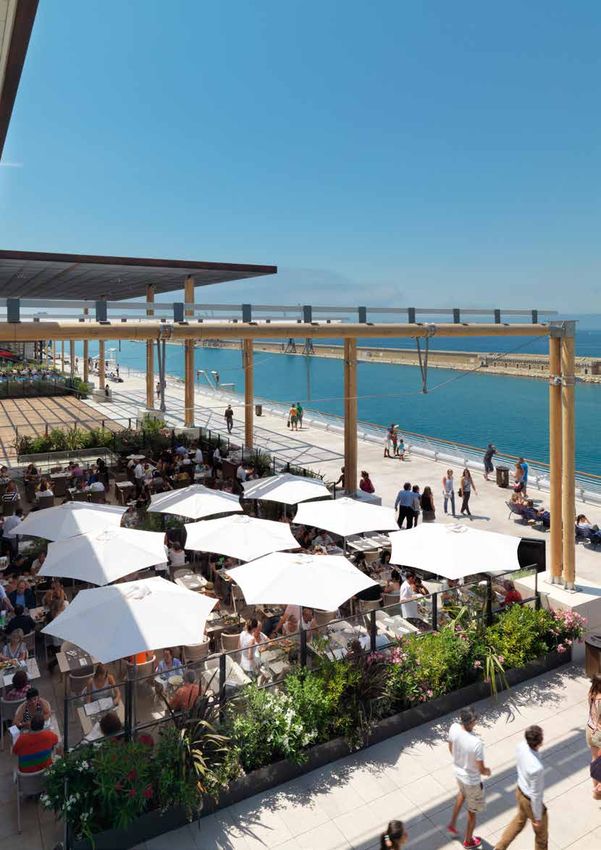
Section 1

A resilient model
for long term value
Our purpose
We create vibrant, continually evolving spaces, in and around thriving cities,
where people and brands want to be. We seek to deliver value for all
our stakeholders and to create a positive and sustainable impact for
generations to come.

          What we have                                               What we do                                                                                            Who we deliver for

 High-quality property                                                                                                                           Shareholders
 in the right places                                                                                                                             We have a broad range of institutional investors and private
 We own and operate high-quality, flagship                                                                                                       shareholders. We actively engage with them throughout the year and
 destinations and premium outlets. Our City                                                                                                      undertake regular communication to ensure they understand the
 Quarters concept will enable us to leverage                                                                                                     performance of the business.
 our existing land bank around these
 flagship assets, supporting their continued
 growth and success.
                                                                                                                                                 Brands
                                                                                           Product                     Positive
                                                                                           experience                  places                    Our business strategy and future success is aligned with that of all of
                                                                                           framework                                             the brands which fill our destinations – retailers, food and beverage and
 A dynamic and                                                                                                         We create                 leisure tenants, as well as direct to consumer brands.
 diverse team                                                                              We create desirable         destinations
                                                                                           spaces where people         that deliver net
 We go to great lengths to attract, develop                                                and brands want to be,      positive impacts
 and retain the best people. By the end of                                                 by developing iconic        economically, socially
 2018 Hammerson directly employed 533                                                                                  and environmentally       Consumers
                                                                                           destinations which
 people across the UK, France and Ireland.                                                 at their core have the      through the Group’s       We create vibrant destinations that meet the needs of the wide range
                                                              Our strategy                 very best brands and        Positive Places
                                                                                                                                                 of consumers that engage with them. In a modern omnichannel
                                                                                           experiences. We put the     strategy.
                                                                                                                                                 environment, we need to provide more than just a place to shop.
                                                                                           customer at the heart
                                                                                           of everything we do,        Our target is to be net
                                                                                           delivering a journey that   positive for carbon,
 Insight led                                                                               is truly frictionless and   resource use, water
                                                  Capital       Optimised    Operational   supported.                  and socio economic        Partners
 We use property and consumer trends                                                                                   impacts by 2030.
                                                 efficiency     portfolio     excellence
 to shape our strategy and inform our                                                                                                            We work with a wide range of partners including joint venture partners,
                                                                                           The four key pillars of
 decisions around capital allocation, project                                                                                                    suppliers and capital partners over the long term, making our business
                                                                                           our framework are:
 priorities and resource deployment. Our                                                                                                         stronger and delivering a competitive edge.
 dedicated Insight team monitors the latest                                                • Iconic destinations
 consumer habits and retail trends to better
 understand and respond to markets.                                                        • Retail specialism
                                                                                           • Experience led                                      Communities
                                                                                           • Customer first                                      Our assets rely on a strong, positive connection with thriving local
 Effective capital
                                                                                                                                                 communities. This is where we draw our customers from, and
 management
                                                                                                                                                 over 80% of the employees in our flagship destinations.
 Effective capital management ensures
 balance sheet resilience. We monitor
 against internal guidelines to maintain
 the Group's robust financial position. Our                                                                                                      Our people
 preferred source of debt is Group-level,
 unsecured funding and we have a platform                                                                                                        Talented, motivated colleagues are critical to the success of the business.
 of successful joint venture partners.                                                                                                           We have built a winning team to support our delivery of the best
                                                                                                                                                 destinations.

12      S U S TA I N A B I L I T Y REPORT 2018                                                                                                                                 CR EATIN G LO N G- T E RM S TA K E H O L D E R VA LUE   13
Section 1
At a Glance – Our key Water demand for Positive social impacts
landlord services
Numbers for 2018 Landlord water demand has decreased in 2018, with our intensity
Retaining strong, positive relationships with the communities
surrounding our assets is central to our business model. We work
metric of M3/visitor dropping by 33% across our like-for-like hard to ensure the whole community benefits from our presence
portfolios. Our Irish water intensity is considerably higher than in the area through our contribution to local social capital as well
Scope 1 & 2 Carbon Emissions (mtCO2e) the UK because we are currently unable to split landlord from as the economy. Over the course of 2018 we worked with more
Table 1.1 tenant consumption. This issue will be resolved in 2019 with the than 450 organisations bringing opportunities, connections,
2015 2016 2017 2018 % Change YOY % Change vs. 2015 installation of new submetering. facilities and more, to thousands of local people
UK 26,638 23,922 19,089 16,111 -16% -40% We are working closely with our suppliers to identify potential •O
ver 100 previously unemployed people employed at our assets
France 7,065 5,514 5,243 4,541 -13% -36% areas for savings, and with regional water companies to carry out through jobs brokerages and skills training
water audits to identify leaks. We are confident that these projects,
Ireland n/a 2,355 5,374 5,714 6% n/a combined with our investment in metering will enable closer •5
50+ entrepreneurs given business skills training
Group 33,703 31,790 29,707 26,366 -11% -22% management of water usage bringing additional reductions in 2019.
• 1 600 young people provided with confidence-building training
EPRA LFL Portfolio 28,563 23,562 -18% Water Demand – Building Water Intensity – EPRA like-for-like portfolio
and enterprise opportunities
Chart 1.3
Water Consumption •£
1.7m of support provided to local charities
EPRA like-for-like Portfolio and organisations
£1.7m
Carbon emissions Energy demand 4.0
3.5
Our consistent focus on good management of energy at our Reducing grid energy demand is a key focus for our
3.0
key assets continues to drive carbon emissions down. These sustainability strategy. Investment in technology and a
reductions come in spite of the addition of four shopping clear focus on continuous improvement in management 2.5
centre assets since 2015. Our EPRA like-for-like portfolio has achieved an 11% saving across the EPRA like-for-like
m3
2.0
has achieved a year-on-year carbon emissions reduction of portfolio in 2018.
18%. Whilst this has been supported by grid factors in the 1.5 in direct contributions to charities
UK,Emissions
Carbon the French grid factor
– Carbon has worsened
Emissions and in Ireland
– EPRA like-for-like has
portfolio Extreme weather events presented challenges with an through cash and in kind support
1.0
not changed. average of 131 additional cooling degree days per asset
during the summer highs. In the first half of 2018, each asset 0.5
Chart 1.1 experienced on average 155 additional heating degree days 0.0
compared to 2017 however this was balanced out in Q4 by 2017 2018
Carbon Emissions
the mild winter. The net weather effect on our assets was UK Shopping Centres Waste Management – Total Waste & Recycled – EPRA like-for-like portfolio
EPRA like-for-like Portfolio Chart 1.4
higher electricity demand due to increased summer cooling France Shopping Centres
loads.Demand
Energy We are pleased that
– Energy in spite of this,
Consumption we are
– EPRA continuing
like-for-like portfolio Ireland Shopping Centres Waste Management
30,000 to drive our energy consumption down year-on-year. EPRA like-for-like Portfolio
25,000
Chart 1.2
20,000 30,000
mtonnesCO2e
Energy Consumption
15,000 25,000
23,246 18,807 EPRA like-for-like Portfolio
10,000 20,000
120,000
Tonnes
5,000 15,000
Waste management
5,317 4,755
0 100,000 10,000
20,943
2017 2018 17,198
80,000 In 2018 we continued our focus on recycling and diversion from 5,000
88,722
Scope 1 landfill, achieving a recycling rate of 75% and diverting 99.8% of
MWh
60,000 0
Scope 2 79,923 waste from landfill across all three geographies.
UK
France
Ireland
UK
France
Ireland
40,000
We have had good success with food waste disposal on site,
20,000
reducing carbon emissions through anaerobic digestion and 2017 2018
0 reduced transportation. We have continued to focus on reuse
2017 2018 as well as recycling, in particular for plastics. Through our Waste recycled or reused
relationship with Mainnetti we sent an estimated 92,000 plastic Waste to energy/landfill
Gas coat hangers for reuse or re-purposing in the last two years.
Electricity
14 S U S TA I N A B I L I T Y REPORT 2018 P E RF O RMA N C E H E A D L I N E S 15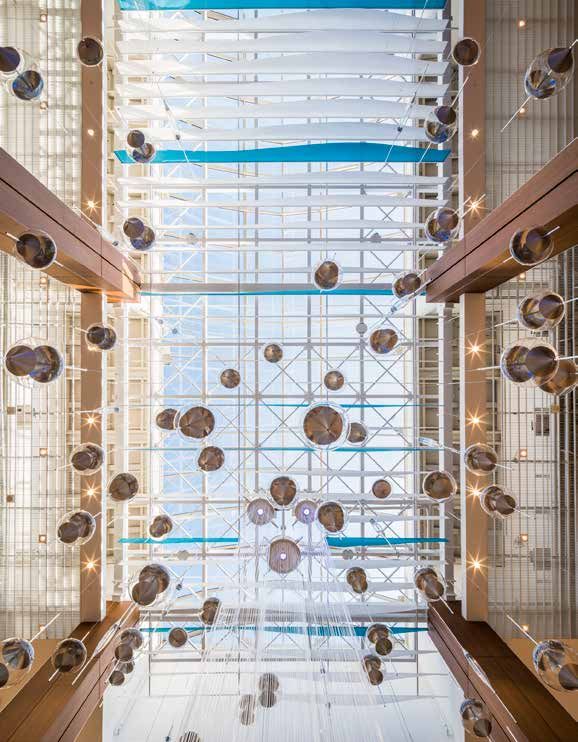
Section 1

Progress Against Targets
                                                                                                                                                                                                                                           Table 1.2

     Target                                            Annual performance                          Progress in 2018                     Commentary

                                                        2016        2017    2018     2019   2020

              Reduce carbon intensity of                                                                                                Further reductions in grid energy demand coupled with grid decarbonisation in the UK have helped
                                                                                                   A further 19% year-on-year
              the business by 20% against               -9%          -3%     -19%                                                       significantly reduce carbon intensity of the business in spite of a challenging financial year. This is
                                                                                                   improvement in carbon intensity.
              2015 baseline                                                                                                             evidence of our growing success in decoupling business growth from growth in carbon emissions.

                                                                                                                                        Absolute operational carbon emissions have fallen by 34% since 2015 across the like-for-like assets. We are
              Reduce absolute operational carbon                                                                                        targeting a further 25% reduction in our scope 1 and 2 emissions by 2020, allowing for predicted grid factor
                                                                                                   Achieved our 2020 absolute
              emissions by 18% by 2020 against a                                                                                        improvements. This equates to annual reductions of approximately 11% per annum against our 2015 baseline,
                                                        -14%         -9%     -11%                  carbon emissions reduction
              2015 baseline for the like-for-like UK                                                                                    significantly ahead of sector requirements for achieving a less than 2°C climate change scenario. This will be
                                                                                                   two years early.                     combined with offset projects to achieve our Net Positive scope 1 and 2 carbon emissions target by 2020.
              and France shopping centre portfolio
                                                                                                                                        Our long term target remains to be Net Positive, for scope 1,2 and 3 carbon emissions by 2030.

              Reduce operational energy use                                                                                             Energy demand for our 2015 like-for-like portfolio is 7% lower than it was in 2015. Our targets
              15% by 2018 across the like-for-like                                                 Achieved -6% energy demand           for 2019 and 2020 are further reductions of 6% and 4% taking us to a total 27% against 2015.
                                                        -3%          -8%     -6%                                                        Our focus remains on effective on-site management and investment in technologies. Our 2018
              shopping centre and retail parks                                                     for the 2015 like-for-like assets.
              portfolio against a 2015 baseline                                                                                         investment in smart metering is expected to drive further efficiency gains in 2019 and beyond.

                                                                                                   Recycling rates are high for the
              Achieve 85% waste recycling                                                          sector and continue to improve.      Performance varies across geographies and is affected by local infrastructure. Our French
              for the like-for-like shopping            70%          73%     75%                   7 assets achieved in excess of       assets are showing improved performance but our Irish assets fallen back a little this year.
              centre portfolio                                                                     85% recycling rate for 2018.

              Reduce landlord water intensity                                                      Landlord water intensity has
                                                                                                                                        Reducing water demand is challenging. Better metering is expected to bring efficiencies
              litres/visitor by 10% by 2020                                                        worsened marginally in 2018
                                                        10%          -14%    1%                                                         in 2019 and we are working with regional water companies to carry out water audits to
              against a 2015 baseline for like-                                                    but is still significantly ahead
                                                                                                                                        identify saving opportunities.
              for-like shopping centre portfolio                                                   of the 2015 baseline.

              Build 2 MWh renewable capacity
                                                                                                                                        We now have 1.4MWp of installed PV and have a further 1.7MWp planned for 2019.
              into our existing assets and new         130kWp      1.1MWp   1.4MWp                 Additional 300kWp installed.
                                                                                                                                        We have therefore extended the target to 3MWp by 2020.
              developments by 2020

16       S U S TA I N A B I L I T Y REPORT 2018                                                                                                                                                          PRO G RE S S AGA I N S T TA RG E TS             17
Section 1
Key Environmental
Financial Metrics
Our consistent focus on environmental efficiency continues to reap
financial rewards for the business and for our retailers.
Enviromental Financial Metrics Table 1.3
Energy (Hammerson Group) Unit 2018 Energy costs are a key focus within this Minimum Energy
strategy but the management of waste and Efficiency Standards
Cost of energy £000 12,463 water are also important. Over the course Table 1.4
of 2018 we have seen energy demand We have continued to remove F and G MEES Risk in England and Wales (Cert-Tot)
continue to fall, our water efficiency rated EPCs from the portfolio. As the table Energy Performance Certificates 2017 2018
Estimated energy savings MWh 792 shows, there is limited MEES risk across
improve and a significant improvement
in our waste recycling and reuse figures, our portfolios. What there is, is being EPCs across retail portfolio 1,272 1,291
Energy Efficiency investment £000 2,625 particularly in the UK. systematically managed out.
Number new EPCs registered 110 128
As the water market in the UK is changing Our corporate target is for all retail units
Number EPCs for England and Wales assets 1,061 1,073
Estimated energy savings GRI 302-4 MWh 1,440 we have switched suppliers and are to achieve a D rating. This is beyond
expecting to see improvements in data compliance but more cost effective for our Number F & G rated in England and Wales assets 142 94
management. Water management retailers through energy savings.
infrastructure has traditionally been
Carbon costs
under-invested and this is beginning to
change. As part of our automatic metering
CRC Energy Efficiency Scheme £000 211 project we have upgraded water metering
at our assets and are now able to better
Climate Change Levy £000 234 understand consumption. This has already Case Study
enabled us to identify opportunities for
reducing consumption.
Water 2018 In our 2017 report we anticipated a Financial Returns
challenging environment for waste
Cost of water for
Landlord services
£000 2,093 management. This has been seen in a on LED Installation
reduction in income from waste as the
Investment in water value of recyclables has fallen. However,
£000 30 it has not impacted our overall waste
management improvements
L
management costs. Increased recycling
Estimated water cost ED installation continues across (3 car parks, service yard, walkways and
£000 70 rates achieved this year have compensated
savings (increases) our portfolio. We have already seen canopy lighting), costing £40,000, was
to some extent for this loss in income.
Recycling in France remains lower than significant savings, and these have continued completed in October 2017. The lighting has
the UK and Ireland is still challenging. in 2018. seen total annual electricity fall from 168MWh
Waste 2018 in 2017 to 69 MWh in 2018, a reduction of 59%.
We have a new waste management In October 2018 installation of LED lamps
Operational costs from supplier in France and have started to started on each of the seven levels of At Ravenhead Retail Park a £90,000
£000 3,911 see some improvement in performance.
waste management multi storey car park at Cabot Circus. We investment in lighting upgrades to 225
However, the French waste management forecast that the LEDs will reduce energy lamps in external areas was completed in
Savings from averted
£000 2,104 infrastructure remains limited, relative to consumption of the car park by over 60%, a December 2017. The upgrade has reduced
landfill tax
the UK, as a result of significantly lower saving of 896 MWh/year and 315 tonnes of total annual consumption from 289 MWh
Income from sale of landfill tax rates.
£000 321 carbon. The project completed in early 2019 in 2017 to 86 MWh in 2018, a total saving
waste for recycling
and delivers a payback period estimated at of 70%. These savings accrue directly to
5.8 years. the tenants so are forward-funded through
service charge.
Telford Forge Retail Park has seen similarly
significant benefits from LED. A lighting
upgrade of 166 lamps in external areas
18 S U S TA I N A B I L I T Y REPORT 2018 S ECT I O N 1 19Section 1
The Journey Resource use Water
Towards
By 2030 we will be Net Positive for: Net Positive for resource use means waste avoided, recycled or Net Positive for water means water replenished by
re-used exceeds materials used that are neither recycled or reused external projects exceeds water consumed from
or are sent to landfill. mains supply.
Our 2020 Net Positive targets focus on resource use within our Achieving Net Positive for water is potentially our
Net Positive
Carbon Water Resource Socio-economic operational portfolio which is dominated by waste from the hardest target. The water market is less developed
Use impacts shopping centres. We already achieve consistently high recycling than the energy and waste markets and carries less
rates across the portfolio which is supporting our delivery of this value, making investment more difficult to justify. We
target. A number of initiatives have helped improve our recycling are working with regional water companies to carry
including our work with OWL using their Biowhale, Helistrat on out water audits within our assets to identify and
data management and with Paprec, our waste provider in France. reduce leaks. We have completed one at Cabot Circus
Our Net Positive targets are divided into three We have also looked at ways to reduce waste, such as promoting and are targeting further audits across the portfolio.
phases, the first of which completes in 2020. drinking water fountains, and to reuse waste, for example through
Once we have completed audits and started rectifying
a coffee grounds reuse scheme in Leeds.
leaks at our assets we will explore how to support
We perceive there to be a clear opportunity to reduce further the water companies in auditing third party assets
Taking a phased approach materials entering the waste stream by identifying re-use within our local communities. Many organisations,
opportunities. Our relationship with Mainetti has enabled over particularly third sector organisations and small
Net Positive Water Real
90,000 plastic clothes hangers from our centres to enter the businesses, struggle to apply sufficient resource to
2016–2020 2021–2025 2026–2030 reuse stream over the last two years. We also have relationships address high water demand. This programme would
Phase one Phase two Phase three with a number of local charities who are offered surplus store be considered a form of offset for our water targets.
refurbishment items and materials. We are exploring how we might
Landlord controlled Landlord controlled and Landlord controlled and
work more closely with our retailers to support their materials
impacts development impacts development and on-site
recycling programmes, particularly the fashion retailers. Waste Chart 1.7
tenant impacts
has become a very public issue during 2018 and we expect this to Net Positive Water
continue to be the case. Major fashion retailers are particularly
vulnerable within this area and, as one of our major tenant groups, 350,000
Carbon wePositive
Net are looking to Use
Resource work more closely with them to understand 300,000
how we can support them in responding to demands for more
Net Positive for carbon means carbon emissions avoided exceed For example, green electricity contracts are not considered 250,000
responsible use of resources.
emissions generated. For 2020 the target includes our Scope 1 and eligible. However, establishing a power purchase agreement that
200,000
2 emissions. We are currently expecting to achieve 43% of this enables new renewable supply to come into the market would be
m3
Chart 1.6
target through energy efficiencies across the portfolio, supported considered an offset. Scope 3 carbon emissions reductions, for 150,000
Net Positive Resource Use
by improvements in grid carbon factors. The remaining 57% of our example through reductions we support our tenants in achieving 100,000
2020 target will come from offsets. These are reductions in carbon as we have at Elliott’s Field in Rugby, are considered as offset for 30,000
50,000
emissions from areas outside our phase one target boundary. Careful our 2020 and 2025 Net Positive targets. 25,000
rules for understanding what can and what can not be counted as part 0
Net Positive – Carbon Emissions The chart below shows our current trajectory towards our 2020 2015 2016 2017 2018
of our targets have been established by JLL Upstream. 20,000
Tonnes
Net Positive carbon target including the contribution that will be
15,000 Landlord Operational Consumption
made by projects we are already working on.
Chart 1.5 10,000
Net Positive Carbon 5,000
0
35,000 2015 2016 2017 2018
30,000 Landlord Operational waste
25,000 2015 Recycled waste
The basis of reporting for our Net Resource use
2016
20,000 Net Positive targets is set out
mtonnesCO2e
2017
on page 140
15,000 2018
30,559 25,404 27,543 17,843
10,000 2019
13,836 12,260 2020
5,000
0
2015 2016 2017 2018 2019 2020
20 S U S TA I N A B I L I T Y REPORT 2018 K EY ENV IRO NM EN TA L F I N A N C I A L ME T RI C S 21Section 1
Highlight
Projects
Reducing embodied carbon Energy performance contract
at our Les 3 Fontaines, Cergy at Les Terrasses du Port, Marseille
development outside Paris Following an audit led by Dalkia in 2016, energy savings targets
Through our revisions to the specification of concrete and an energy savings action plan has been set out in a contract
for the extension at Les 3 Fontaines, Cergy, embodied between Dalkia and the team at Les Terasses du Port. Dalkia
carbon emissions will be reduced by an estimated takes charge of Hammerson’s gas and electrical bills in an energy
274 tonnes in 2018. This has reduced our overall performance contract. The agreement guarantees Hammerson
energy and associated financial savings. Already, two major
Energy saving in collaboration
Net Positive carbon emissions in 2018. A embodied
carbon saving only contributes to Net Positive in the changes have occurred: with our retailers
year of construction. • Optimisation of systems’ performance (mainly HVAC) for a In 2018 we developed a food and beverage (F&B) retailer
total of 1039 MWh saved vs 2015 on electricity and 1152 MWh specific energy efficiency toolkit and worked with a group of
saved vs 2015 on natural gas forward thinking F&B operators to identify energy saving
opportunities in their spaces. Initial results are indicating
• Adaptation of the operating systems (mainly lighting) to the energy savings of between 5% and 25% for those stores
opening hours and occupation of the centre giving a total of
Proactive energy management
taking part. We are looking to roll this programme out across
247 MWh saved on electricity at Bullring, Birmingham our estate in 2019 and engage retailers in saving energy and
In late 2016, we started working with Grid Edge, money in an easy, practical way. In the current climate of
an entrepreneurial start up from Aston University, pressure on retail this programme is offering a real added
on a project at Bullring in Birmingham. The benefit to our tenants.
software combines footfall, temperature and energy
consumption data to enable proactive energy
management through artificial intelligence (AI) and
machine learning. Initial results show energy savings
for participating stores of up to
The AI system also allows us to see the impact on
25%
comfort, carbon, cost of dispatching HVAC assets
to release flexibility to the grid, and quantifies the
financial benefit of doing so.
In a really exciting development Grid Edge are using
Estimated total embodied predictive learning algorithms to model and predict
photo1of
carbon saving (6) the building’s future energy profile so energy assets
can be controlled optimally in real time.
274
Hammerson will be continuing to work with Grid
2438
Edge to explore further ways we can manage our
buildings more effectively using the technology.
MWh
energy saved vs. 2015
tonnes In 2019, we will focus on our weather station and air quality
management with the installation of variable frequency drives
on all air handling units. This is expected to bring an estimated Energy saving technologies for F&B operators
in 2018 gain of 615 MWh in 2019 vs 2018 on electricity and 281 MWh
in natural gas by 2021 vs 2018. These are significant savings at
an asset with a current energy demand of approximately 9,000
MWh per annum.
22 S U S TA I N A B I L I T Y REPORT 2018 H I G H L I G H T P RO JE C TS 23Section 1
Shaping our Strategy
Understanding our material issues
In 2018 we carried out a review of our material sustainability chain and our local communities as well as our operations.
issues. For this process we spoke to shareholders, joint venture
Each factor was scored on the basis of its current importance for
partners, non-executive directors and our retailers. We explored
the shareholders and how they expected it to change over the next
what was changing in their sustainability priorities and
five years. These scores were combined with the views of the other
concerns and the implications they felt this had for our sector
stakeholders and an internal score reflecting the significance of
and particularly for the business. The discussion distinguished
the issue to company strategy and the ability of the business to
between immediately relevant issues and the direction of travel
influence of control the issue. This analysis produced our priority
anticipated for each issue over the five years to the end of 2022.
order of material issues. Most issues were identified in our 2014
The discussion encompassed both asset management and
Matrix 1 materiality study but the priority order of issues has changed.
development and the factors included those affecting our supply
New to our top 15
Chart 1.8 Sustainability 10 Governance & reporting New issues that have emerged with at least medium significance This insight, taken in conjunction with our City Quarters
Risk Matrix include carbon pricing, accessibility and demographic change business strategy, has prompted us to review our community
Energy security and sustainable product. This last issue refers to the extent to engagement focus areas in 2019. The growing focus on social
9
Waste which our business product – i.e. the assets that we develop and impact investing particularly from the investment and pension
Key manage – can be defined as sustainable. This suggests a much fund community, and expectation that companies are using
High
clearer expectation that sustainability forms an integral part of their power and influence to foster positive social outcomes
8 Community engagement
the operating procedures for our existing centres and any new presents potential opportunity for Hammerson given our track
Climate change
developments. The expectation for developments is further record in this area.
Sustainable Product
Up underlined by the increased importance of buildings labels.
7 Material use Carbon Pricing
from 2014
Economic Development
Technology Carbon pricing and climate change
Significance to stakeholders
6 Biodiversity Placemaking Building labels The emergence of carbon pricing as an issue relates directly
Governance and reporting to the increased emphasis on climate change. The increasing
Medium
One of the biggest changes we found was the increased frequency with which businesses are being affected by
Same priority 5
extreme weather events, combined with the Paris Climate
importance placed on governance and reporting. Corporate
as 2014 agreement and the more recent IPCC Report, have increased
Accessibility Health & Safety governance as something that drives transparency and has been
an important factor for our investor stakeholders for some time. awareness of transition risk; the risks that flow from policy
4
The real shift noticed here was the expectation of transparency interventions that are likely to be required to mitigate climate
and reporting of environmental factors, particularly relating change. Policy interventions focusing on carbon emissions
3 to climate change, and of social factors too. This has shifted reduction either indirectly through energy pricing or directly
New through carbon pricing are expected. Our continued focus
from being a relatively low priority for our stakeholders when
to our top 15 on carbon emissions reduction through energy efficiency is a
we carried out this work in 2014, to being the highest ranked in
2 2018. There is clearly a much higher expectation of consistent, direct response to this issue.
Low
transparent corporate reporting on a number of issues and
sustainability is very much one of them.
1
UN goals
0 The UN Sustainable Development Goals UNSDGs
0 1 2 3 4 5 6 7 8 9 10 Community engagement were raised by a number of our stakeholders and have
Low Medium High
Community engagement remains a priority for us and for our clearly gained traction with major corporates and
Significance to Hammerson business strategy stakeholders too. We have seen increases in the importance placed investors as a helpful strategic sustainability framework
for businesses. We identified the UNSDGs that are
Understanding our matrix on local economic development and place-making.
most relevant to the business two years ago and these
Issues are assessed for materiality on two axes – significance to Combining these results with an assessment of the risk each issue continue to be supported by our Positive Places strategy
We have focused our approach to community engagement on
business strategy and stakeholder groups. Their overall material presents to the business, the extent of our influence or control and actions.
the four key areas of employment and skills, enterprise, young
significance for the business is then determined by the scale of risk over it and our strategic business priorities enables us to place
people, and health and wellbeing. We then use these themes to
they present, the relevance to current business strategy and the these risks into a priority order, as shown in the matrix above. Our
tackle relevant issues at a local level. However, our conversations
extent to which we can influence or control them. top 15 sustainability issues are plotted. Those considered material
with stakeholders are suggesting that issues such as community
sustainability issues to the business are those which are within the
We presented a list of 22 issues to investors and 18 of them received a cohesion, in particularly in light of expected future migration, the
top quartile of the matrix.
score showing them to be significant in the view of the respondents. scaling back of public services and rising numbers of refugees are
increasingly important areas of focus.
24 S U S TA I N A B I L I T Y REPORT 2018 S H A P I N G O UR S T RAT E GY 25Section 1
Viewpoint
I
Managing risk
Climate Change nvestors expect businesses to have a systematic and robust process for
Management of any potential risks flowing from sustainability are medium risk area of the map. We consider each of the risk areas understanding our exposure to climate risk, and a strategy in place to
high on the corporate agenda. as being effectively managed but the business is alert to their
and Climate manage it.
The risk heat map set out below includes the eight sustainability
importance. The approach to risk management set out here Change Policy Climate change presents a risk for all businesses and particularly those with
mirrors the corporate risk strategy as set out in our Annual Report
risks we consider to be most significant for the business. The map infrastructure assets such as ours. Our long-term, consistent approach to
and Accounts. Sustainability risks are communicated through the
is based on the probability of the identified risk occurring and the sustainability has equipped us to be ahead of the curve in responding. In 2017, ahead
business via our Corporate Responsibility Governance structure.
severity of the impact if it does occur. The analysis demonstrates of the recommendations of the Task Force for Climate Related Financial Disclosures
that the eight key sustainability risks are contained within the (TCFD), we commissioned a climate risk analysis of our managed portfolio.
Assessing against 2030 and 2050 climate scenarios we are confident that our
assets are low risk for climate change. Where there is risk this relates to extreme
weather, in particular heat and rainfall. We have strong flood risk management
in place and are looking at opportunities to mitigate overheating including solar
shading and dynamic building management strategies. Understanding these
More detail on our sustainability risk and our
risks early allows mitigation measures to be included in our asset management
management approach is set out in table 8.1,
p. 124–125
plans in a timely and cost effective way.
As we turn our attention to delivering future projects and in particular for our
City Quarters, design teams are clearly briefed to evaluate climate scenarios
Chart 1.9 Risk Heat Map to ensure our assets are resilient. This includes specification and selection of
flexible materials as well as optimising energy strategy and thermal performance.
Further details for our Positive Places development strategy is set out on page 98.
6 Our investments in premium outlets, both VIA and Value Retail, present different
High
Failure to address sustainability within our climate change risks to our directly managed portfolio as they are largely open air
1
development programme centres in a wide range of different geographies. We are working closely with the
VIA and Value Retail asset management and operational teams and our investment
5 1 2 “Assessing against 2030 and
Non-compliance with UK, Irish, French and EU partner APG to ensure a proactive approach is being taken to understanding how
2
Environmental regulation and legislation 2050 climate scenarios we are these venues may be affected by climate change and what strategies need to be
4 confident that our assets are implemented to mitigate these risks. BREEAM in Use certification was achieved
4 5 6 7 3
Rising energy cost including regulatory low risk for climate change.” across the VIA portfolio in 2018 and the findings are being used to inform the
8 / fiscal charges sustainability and climate change strategy for these assets.
Medium
Impact
4 Poor performance in investor-focused Timon Drakesmith
3 3
industry benchmarks Chief Financial Officer, Hammerson
5 Impact of climate change on our portfolios
2
6 Failure to achieve corporate development targets
7 Employees insufficiently equipped with the
1 knowledge and tools to achieve corporate
sustainability goals
Low
0 8 Lack of engagement of JV partners on
0 1 2 3 4 5 sustainability matters
Low Medium High
Probabability
Cabot Circus, Bristol
120,000
100,00026 S U S TA I N A B I L I T Y REPORT 2018 S H A P I N G O UR S T RAT E GY 27
80,000Key Stakeholder Groups and Section 1
Engaging our
Engagement Activity
Table 1.5
Stakeholders Stakeholder
group
Examples of
engagement activity
Project/
corporate level
Frequency
of engagement
Issues raised/ discussed Responses
Engagement with our five key stakeholder groups underpins engagement activity
our Positive Places strategy. The materiality review carried
Communities Work experience and apprenticeships Corporate and Projects Ongoing Opportunities for young people Working with our supply chain and centre teams
out in 2018 gave us the opportunity to focus specifically on
Local residents, to ensure apprenticeships are offered in a range
engaging with our investors and to understand how their people working of areas in our assets
thinking on sustainability has changed over the last four at or visiting
years. This exercise was extremely useful and is informing our assets and Employment and skills brokerage Projects Ongoing Linking local people with Linking with the Department of Work and
updates to our strategy. local community centre based employment Pensions, local training providers and retailers
organisations
We routinely engage with our retailer customers through our opportunities training to form a one stop shop for centre based
retailer forum and through the Hospitality Forum. We have opportunities. Over 100 local people placed
been delighted by the support of some of our key customers in during 2018
providing data as we continue to monitor scope 3 emissions.
Positions held on key local boards/bodies Corporate Ongoing Homelessness and Meeting with the local Business Improvement
We have an extensive community engagement programme inner-city challenges District (BID) and local organisations to
that has developed long standing strong community understand how we can help deliver outcomes
relationships over a number of years. We focus on local for vulnerable local people
community groups and organisations to make sure our
outcomes are clearly relevant to the local community. Our
key focus areas remain employment and skills, enterprise, We continue to establish relationships with locally specific stakeholders around skills and employment, as well as developing
young people and health and wellbeing. However, in light stronger relationships and running wider programmes with national partners who we have achieved successes with already.
of the findings of our materiality review we are looking at Our asset teams hold multiple roles at a local level that help to influence the local agenda. These local relationships are critical
how we reflect concerns regarding long term community to our ability to deliver relevant, practical outcomes for our communities.
cohesion as part of our programme of work.
Customers Retailer forum and one to one meetings Two meetings Data sharing, environmental Simplified tenant fit out guides, data sharing,
Homelessness has risen up the agenda locally in the past Businesses a year lease clauses, energy efficiency updated lease clauses and more efficient
12 months and we are working with existing local networks operating projects and fit out tenant fit out
and providers to establish where our efforts will be best from our
targeted to help tackle this problem. We are keen to look assets Hospitality forum Three meetings Energy and waste management, Food & Beverage energy saving guide
at the causes of this type of issue as well as resolving the a year environmental regulation, developed and adopted by operators at two
immediate challenges it presents. operational performance assets with clear energy savings generated
IMAGE
benchmarking
Table 1.4 right and overleaf sets out our five key stakeholder
groups and the type of engagement work that we have Positive Growth Awards Ongoing Energy, water, waste and Increased on-site retailer team awareness
undertaken during 2018 with each group. environmental hazard management. of key issues
We rely extensively on our supply chain for services ranging Asset specific briefings and tenant meetings Ongoing Environmental and community Support for centre based activities
from the design and construction of new assets through to initiatives and projects
the provision of Christmas decorations. We take a very active
approach to engaging with them and have a range of policies
and processes in place both to support and monitor. Our retailer forum enables us to bring together key retailers and Hospitality Forum enables us to focus on bringing together F&B
providers. These forums are becoming increasingly important as a means of developing a collaborative approach to tackling key
Our Supplier Survey is an initial engagement opportunity sustainability issues.
where we raise awareness of our sustainability requirements
and alert suppliers to the obligations set out within our
Code of Conduct in relation to labour standards and other Suppliers Supply chain survey Corporate At initial tender Code of Conduct, treatment of Regular engagement with suppliers raises
legislation. The survey was updated in 2017 and is actively Our tier 1 supply of contracts over workers, CSR, environmental awareness of the significance of sustainability
used by the business. chain includes £100,000 policies, Health and Safety, as an issues they need to be addressing in their
businesses training and skills work with us and other clients
Achieving our Net Positive targets requires our supply chain providing services
to work closely with us to realise key business opportunities. to our operational Work experience and apprenticeships Corporate As required Apprenticeship and work Our suppliers now offer apprenticeships at
We have worked with our key asset and property assets, design and experience opportunities for each of our assets and work experience is
management suppliers and with our development design build services to
our development
IMAGE local young people offered within our centre management teams
teams in 2018 to ensure standards that support the delivery
of Net Positive are included in our project management programmes
and business In 2018, we updated our supplier survey and worked on improving internal awareness of the survey. This has resulted in a broader
processes and our design team thinking. By establishing key
and consultancy selection of our suppliers undertaking the survey. As part of our Net Positive work we have also implement a new red flag and
standards in the approach of our suppliers from the outset we
services for escalation system to engage with suppliers scoring poorly in the survey on key sustainability issues.
find innovations are more likely to emerge.
our corporate
functions
28 S U S TA I N A B I L I T Y REPORT 2018 EN GAG I N G O UR S TA K E H O L D E RS 29You can also read