Climate Change and U.S.-Mexico Border Communities
←
→
Page content transcription
If your browser does not render page correctly, please read the page content below
Chapter 16

      Climate Change and U.S.-Mexico Border
      Communities

      Coordinating Lead Author
        Margaret Wilder (University of Arizona)

      lead authors
        Gregg Garfin (University of Arizona), Paul Ganster (Institute for Regional Studies of
        the Californias, San Diego State University), Hallie Eakin (Arizona State University),
        Patricia Romero-Lankao (NCAR), Francisco Lara-Valencia (Arizona State University),
        Alfonso A. Cortez-Lara (Colegio de la Frontera Norte), Stephen Mumme (Colorado
        State University), Carolina Neri (National Autonomous University of Mexico),
        Francisco Muñoz-Arriola (Scripps Institution of Oceanography)

      review editor
        Robert G. Varady (University of Arizona)

      Executive Summary
      This chapter examines climate-related vulnerability in the western portion of the U.S.-
      Mexico border region from the Pacific coast of California–Baja California to El Paso–
      Ciudad Juárez, focusing primarily on border counties in the United States and munici-
      palities in Mexico. Beginning with a brief overview of projected climate changes for the
      region, the chapter analyzes the demographic, socioeconomic, institutional, and other
      drivers of climate-related vulnerability, and the potential impacts of climate change
      across multiple sectors (e.g., water, agriculture and ranching, and biodiverse ecosys-
      tems). The border region has higher poverty, water insecurity, substandard housing,

      Chapter citation: Wilder, M., G. Garfin, P. Ganster, H. Eakin, P. Romero-Lankao, F. Lara-Valencia,
      A. A. Cortez-Lara, S. Mumme, C. Neri, and F. Muñoz-Arriola. 2013. “Climate Change and U.S.-
      Mexico Border Communities.” In Assessment of Climate Change in the Southwest United States: A Re-
      port Prepared for the National Climate Assessment, edited by G. Garfin, A. Jardine, R. Merideth, M.
      Black, and S. LeRoy, 340–384. A report by the Southwest Climate Alliance. Washington, DC: Island
      Press.
340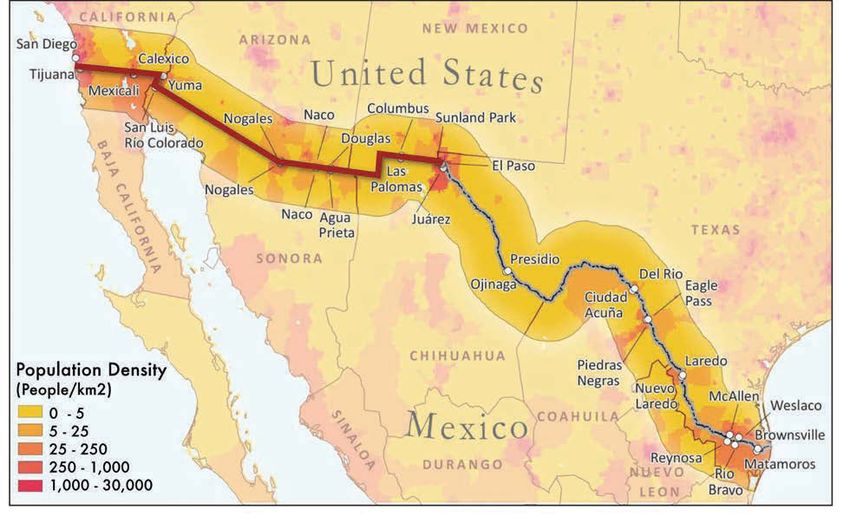
Climate Change and U.S.-Mexico Border Communities       341

and lack of urban planning relative to the rest of the United States, and multiple socio-
economic asymmetries exist between the U.S. and Mexico sides of the border. These
asymmetries create challenges for governance, planning, effective communication of
climate-related risks, and design of adaptation strategies. Although they represent an
important part of the picture, a comprehensive assessment of regional adaptation strate-
gies was not within the scope of the chapter.
   The chapter highlights the following key findings relating to climate change and so-
cioeconomic and cultural diversity, water, wetlands ecosystems, and institutions and
governance.

  • Climate change exposes the populations in the border region to uneven impacts,
    due to their cultural and institutional diversity and uneven economic develop-
    ment. (high confidence)
  • Climate change exposes sensitive wetland ecosystems, which are hotspots of
    border region biodiversity, to impacts such as reduced precipitation and extend-
    ed drought. (high confidence)
  • Projected climate changes will put additional pressure on severely stressed wa-
    ter systems and may exacerbate existing vulnerabilities relating to water sup-
    ply and water quality. Cascading effects of additional stress on water systems
    include: challenges to energy infrastructure, agriculture, food security, and tra-
    ditional farming and ranching cultures prevalent in the border region. (medium-
    high confidence)
  • Building adaptive capacity to climate change generally benefits from efforts to
    cooperate and collaborate to resolve trans-border environmental problems, yet
    asymmetries in information collection, the definition and scope of problems, and
    language create challenges to effective cooperation and collaboration. (medium-
    high confidence)
  • Institutional asymmetries, including distinctions in governance approaches—
    centralized (Mexico) versus decentralized (United States)—and institutional
    fragmentation and complexity, make the task of collaboration daunting, and re-
    duce the potential adaptive capacity in the region. (medium-high confidence)

16.1 Introduction
While the U.S.-Mexico border has been called a “third country” and has been identified
as a distinct region (Anzaldúa 1987), the challenges it faces are due in large measure
to its high degree of integration into global processes of economic and environmental
change. The border region is characterized by a so-called “double exposure” (Leichenko
and O’Brien 2008)—meaning that environmental change in the region is driven by accel-
erated processes of global economic integration (such as foreign-owned industries and
international migration) coupled with intensive climate change. It is critical to under-
stand the drivers of climate-related vulnerability and capacities for adaptation in the re-
gion in the context of the region’s distinct history and contemporary challenges, shared
climate regime, transboundary watersheds and airsheds, and interdependent economies
and cultures.
342   assessment of climate change in the southwest united states

                This chapter defines the border region and how observed climate trends since 1961
            and projected climate change conditions have affected or are likely to affect the region.
            Next, the chapter provides a framework to understand climate-related vulnerability,
            adaptive capacity, and adaptation, and examines the major drivers (forces) that lead to
            vulnerability and the evidence of sectoral impacts of climate change resulting in vulner-
            ability in the border region.
                There are three important caveats as to the scope and analysis of this study. First, con-
            sistent with the risk-based vulnerability framework suggested by the National Climate
            Assessment, this discussion assesses the sensitivity, exposure, and capacity for response
            for a given population or sector. The evidence for this analysis is based on qualitative
            and (to a lesser extent) quantitative studies in specific contexts within the border region.
            With regard to the climatology, vulnerability, consequences, and impacts, there are no
            comprehensive studies that encompass the western portion of the U.S.-Mexico border.
            The highlighted vulnerabilities presented in the executive summary are those that are
            sustained by strong evidence from multiple contexts within the region. In most cases (es-
            pecially drawing on qualitative studies), while the evidence of a vulnerability, impact,
            or consequence may be strong, it is often not sufficiently calibrated to assess degrees
            of exposure or sensitivity (of populations or sectors) to a climate risk. Thus, to a large
            extent, there is an imperfect fit between the kind of evidence available and the require-
            ment to assess precisely the relative exposure and sensitivity. Second, for the purposes
            of this report, this chapter analyzes and highlights those areas of vulnerability (e.g., ur-
            ban, agriculture, socioeconomic) judged to be of paramount importance and for which
            there is robust evidence, while excluding other important regional vulnerabilities (such
            as health and livelihoods). Third, this chapter focuses on assessing key vulnerabilities. It
            is not within the scope of this chapter to fully represent the adaptation activities—ongo-
            ing or planned—that may aid in reducing these vulnerabilities, but some are discussed
            here. (See also Chapter 18 for a general overview of solutions and choices for respond-
            ing to climate change in ways that reduce risks and support sustainable development.)
            Throughout this chapter, four callout boxes present evidence of successful trans-border
            cooperation or collaboration. Collaboration is a significant component for strengthening
            the region’s adaptive capacity and for building resilience.

            16.2 Definition of the Border Region
            The analysis here focuses on the U.S.-Mexico border—delimited for the purposes of this
            chapter to the western portion of the border from San Diego-Tijuana on the Pacific coast
            to the Paso del Norte areai of the Rio Grande—which has been identified as a distinct re-
            gion that serves as the interface between Mexico and the western United States (Ganster
            and Lorey 2008) (Figure 16.1). The western portion of the border region corresponds to
            the definition used in the National Climate Assessment (NCA) for the Southwest region,
            which includes among the U.S. border states only California, Arizona, and New Mexico
            (and excludes Texas, which is part of the NCA’s Middle West region). Nevertheless, this
            analysis incorporates the Paso del Norte corridor due to its key importance in the New
            Mexico portion of the border region.
Climate Change and U.S.-Mexico Border Communities      343

Figure 16.1 Western portion of the U.S.-Mexico border region. S
                                                               ource: EPA (2011).

   Most of the border’s population is concentrated along the international boundary
in fourteen city pairs (eight of them in the western portion)ii that constitute binational
urban systems. Rural population is scarce except for the irrigated areas of the Colorado
River and the Imperial-Mexicali valleys.
   The border region can be defined in a number of ways (Ganster and Lorey 2008;
Varady and Ward 2009). These include the six Mexican and four U.S. border states, the
region of shared culture and language bisected by the border, the watersheds and sub-
basins along the boundary, the 62-mile zone (100 kilometers) on each side of interna-
tional line as defined by the La Paz Agreement between Mexico and the United States,
or by the administrative boundaries of the U.S. counties and the Mexican municipalities
(municipos) that abut the international boundary. This chapter covers three U.S. states
(California, Arizona, and New Mexico), the El Paso corridor, and three Mexican states
(Baja California, Sonora, and Chihuahua). For present purposes, the latter category—
border counties and municipios—is most important in terms of societal vulnerability to
climate change, given the border population concentration in major urban areas. While
the focus is on the region that includes the counties and municipalities along the border,
data from these local administrative units are supplemented with state-level data.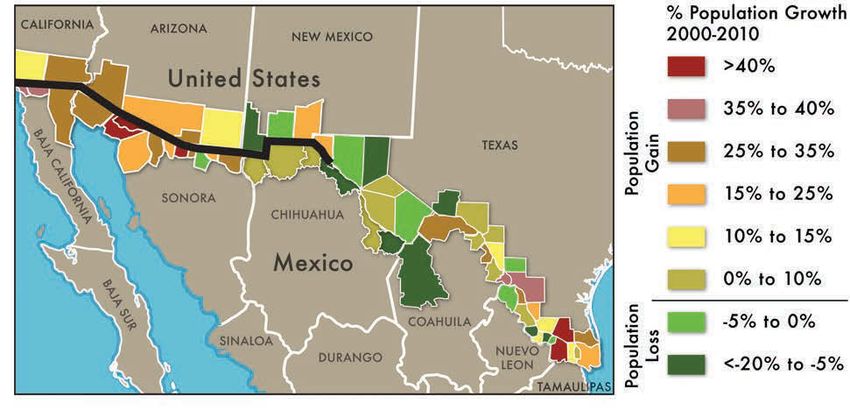
344       assessment of climate change in the southwest united states

                   16.3 Border Region Climate Variability, Climate Change,
                   and Impacts
                   The border region considered here is characterized by high aridity and high tempera-
                   tures. Typically, about half of the eastern part of the region’s precipitation falls in the
                   summer months, associated with the North American monsoon, while the majority of
                   annual precipitation in the Californias falls between November and March. The region
                   is subject to both significant inter-annual and multi-decadal variability in precipitation.iii
                   This variability, associated with ENSO, has driven droughts and floods and challenged
                   hydrological planning in the region.iv Further challenging this understanding is a pau-
                   city of data, particularly on the high-altitude mountainous regions in northern Mexico.
                   Differences in the availability of high-quality and continuous meteorological and hy-
                   drological records spanning long periods of time, and relatively poor data sharing com-
                   plicate understanding of the border region’s climate. The scarcity of such data makes it
                   difficult to verify climate model projections at fine spatial scales.
                       Also, reconciling differences in projected changes in temperature, based on global cli-
                   mate model (GCM) studies conducted separately by U.S. and Mexican scientists (Table
                   16.1),v is complicated by the fact that (1) they use different sets of models from the IPCC
                   Fourth Assessment archive; (2) they use different methods of downscaling output from
                   coarse spatial scale models to finer regional spatial scales;vi (3) in some cases they do not
                   use the same greenhouse gas (GHG) emissions scenarios; (4) they average future projec-
                   tions for different spans of years; and (5) they use different spans of years for providing
                   a measure of average historical climate. High quality data are essential for statistically
                   downscaling GCM output. Thus, issues with meteorological observations add to several
                   other sources of uncertainty (see discussion in Chapters 2 and 19).

 Table 16.1 Summary of projected changes in selected climate parameters

Projected Change     Direction of Change    Border Subregion Affected                                Confidence

Average annual       Increasing             Throughout the border region; lowest magnitude of        High
temperature                                 increase is near the coast; greatest is Arizona-Sonora
                                            border or New Mexico-Chihuahua border

Average summer       Increasing             Throughout the border region; greatest increases in      High
temperature                                 the Sonoran Desert border region

Average winter       Increasing             Throughout the border region; greatest increases in      High
temperature                                 the Sonoran Desert border region

Average annual       Increasing             Throughout the border region; greatest increases         Medium-High
maximum                                     in the eastern Chihuahuan Desert; only estimated
temperature                                 south of the border

Average annual       Increasing             Throughout the border region; greatest increases         Medium-High
minimum                                     in the Sonoran Desert; only estimated south of the
temperature                                 border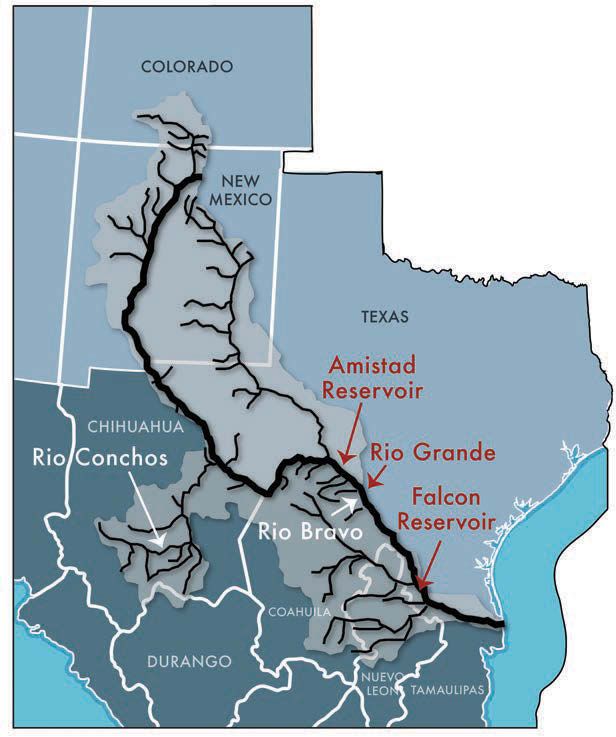
Climate Change and U.S.-Mexico Border Communities                      345

  Table 16.1 Summary of projected changes in selected climate parameters (Continued)

 Projected Change        Direction of Change    Border Subregion Affected                             Confidence

 Length of freeze-free   Increasing             Throughout the border region; only estimated          Medium-High
 season                                         north of the border

 Annual number of        Increasing             Throughout the border region; greatest increases      Medium-High
 days with maximum                              in the central Sonoran Desert border and in north-
 temperatures > 100°F                           west Chihuahua

 Heat wave duration      Increasing             Throughout the border region                          High

 Cooling degree days     Increasing             Throughout the border region                          High

 Cold episodes           Decreasing             Throughout the border region                          Medium-High

 Annual                  Decreasing             Greatest decreases along the coast and parts of the   Medium-High
 precipitation                                  Arizona-Sonora border

 Winter                  Decreasing             Greatest and most consistent decreases (over time)    Medium-Low
 precipitation                                  are projected for the Arizona-Sonora border, into
                                                the western Chihuahuan Desert

 Spring                  Decreasing             Occurs along the length of the border, from CA        Medium-High
 precipitation                                  coast to NM-TX border (based on studies that
                                                only examine the U.S. side of the border)

 Summer                  Decreasing             Mid-century decreases are greatest for the            Medium-Low
 precipitation                                  Sonoran Desert border region

 Drought                 Increasing             Throughout the border region; increasing mark-        High
                                                edly during the second half of the twenty-first
                                                century

 Colorado River          Decreasing             Measured at Lees Ferry, AZ                            High
 streamflows

 Note: See Chapters 2 and 19 for a discussion of how confidence levels are assessed.

Temperature
Overall, climate models show trends of increasing temperatures for the border region;
this result is robust throughout the course of the twenty-first century, regardless of
which combinations of models, downscaling method, and emissions scenario were used
(Tables 16.1 and 16.2 and IPCC 2007b).vii For the border region, average annual tempera-
tures are projected to increase on the order of 2°F to 6°F (1°C to 3.5°C) during the mid-
century time frame (around 2041−2070, according to the high-emissions scenario), with
the greatest increases inland (see Chapter 6, Figure 6.1 and Magaña, Zermeño, and Neri
2012). The magnitude of temperature increases is greatest during the summer, as high
346 assessment of climate change in the southwest united states
as 6°F to 7°F (3°C -4°C) during the mid-century, with areas of especially high increases
concentrated in the western Sonoran Desert (Montero and Pérez-López 2010) and the
northern Chihuahuan Desert (see Chapter 6, Figures 6.1 and 6.8).viii
Associated with the maximum and minimum temperature projections are an array
of projections for derived parameters and temperature extremes (Table 16.1). Some key
derived and extreme temperature projections include large projected increases in cool-
ing degree days in Southern California and Arizona (up to 100 degree days, using a 65°F
(18°C) baseline; see Chapter 6), large increases in the annual number of days with maxi-
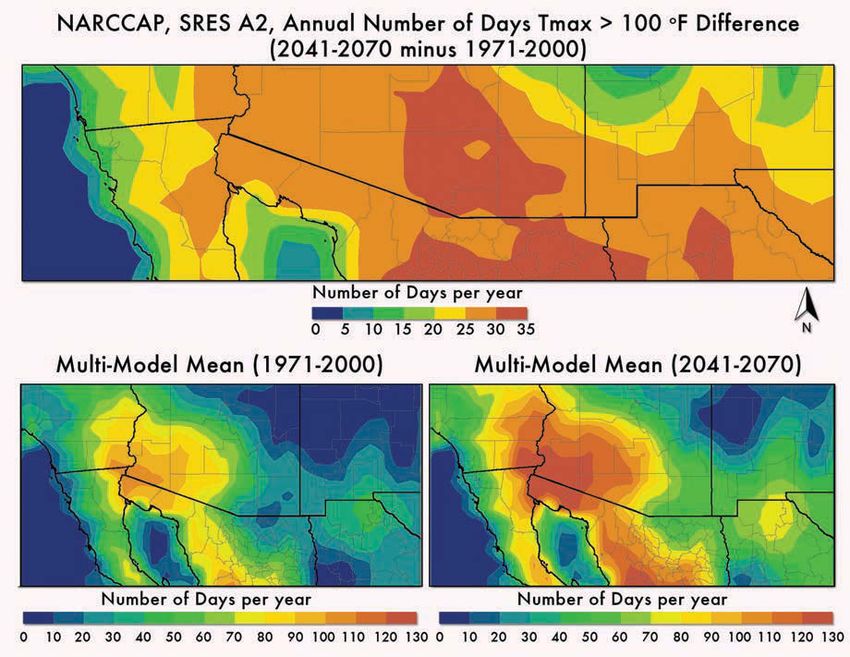
mum temperatures greater than 100°F (38°C), including increases of more than 30 to 35
days in the central Arizona and northwest Chihuahua border regions (see Chapter 6 and
Figure 16.2), increased heat wave magnitude (but with more humidity, therefore having
a larger impact on nighttime minimum temperatures; see Chapter 7),ix and diminishedx
frequency of cold episodes (see Chapter 7).
Figure 16.2 Change in the number of days with a maximum temperature greater than
100°F (38°C). The top map shows the change between the NARCCAP (Mearns et al. 2009) multi-
model average for 1971–2000 (lower left) and the average for 2041–2070 (lower right). Map generated
by Laura Stevens.
Climate Change and U.S.-Mexico Border Communities     347

  Table 16.2 Projected mean annual temperature increases (in °F) in
             comparison to 1971–2000 along the U.S.-Mexico border,
             from the California coast to the New Mexico-Texas border

                               Higher Emissions (SRES A2)      Lower Emissions (SRES
           Period                Projected Temperature        B1) Projected Temperature

          2021–2050                         2–3°                        2–3°
          2041–2070                         4–5°                        3–4°
          2070–2099                         7–8°                        4–5°

 Note: Based on studies that only examine the U.S. side of the border
 Source: Kunkel (2011).

  Table 16.3 Mean temperatures for 1961–1990 (in °F) and projected
             changes under the high-emissions scenario for 2061–2090,
             averaged for the Mexican border states

                                  1961–1990                              2061–2090
 State                Winter       Summer          Annual    Winter     Summer       Annual

 Baja California      56.2°          83°             69.3°     +5.2°        +5°           +5.2°

 Sonora               54.6°          82°             68.2°     +5.9°       +6.5°          +6.4°

 Chihuahua            48.1°         76.8°            62.8°      +5°        +4.9°          +5.1°

 Source: Montero and Pérez-López (2010).

Precipitation
Future precipitation in the border region, as projected by climate models, is dominated
by a continued high degree of annual precipitation variability, indicating that the re-
gion will remain susceptible to anomalously wet spells and also remain vulnerable to
drought (see Chapters 6 and 7). Precipitation projections have generally low to medium-
low confidence, due to variability over shorter periods and the lack of firm consensus
among GCM simulations. Nevertheless, spring precipitation is projected to decrease in
all but one of sixteen models, exacerbating dryness in the border region’s driest season
and probably aggravating the dryness that initiates the summer period. Areas that are
already prone to little precipitation are expected to see longer runs of days with little or
no precipitation.
348   assessment of climate change in the southwest united states

                There is greater confidence in projections of decreased annual precipitation as one
            moves south. Statistically downscaled studies by Mexican scientists (under the high-
            emissions scenario) confidently project border region annual precipitation decreases of
            more than 20% by mid-century, with the largest seasonal decreases projected for winter
            in the Arizona-Sonora border region (Montero and Pérez-López 2010; Magaña, Zerme-
            ño, and Neri 2012).xi

            Drought
            Seager and colleagues (2007) project (under high-emissions SRES A1b) increased
            drought for a region that encompasses the border region.xii Their projections have been
            confirmed in subsequent studies (e.g., Seager et al., 2009), and independently by Maga-
            ña, Zermeño, and Neri (2012).xiii Cayan and others (2010) describe a tendency for in-
            tensified dryness in hydrological measures in the Southwest from downscaled climate
            model projections. In the first half of the twenty-first century, Magaña, Zermeño, and
            Neri’s (2012) drought projections exhibit high interannual and multidecadal variability,
            characteristic of the region.xiv Dominguez, Cañon, and Valdes (2010) note that La Niña
            episodes, which are associated with drought in the border region, may become warmer
            and drier in the future.
                We find that the results of these studies, in conjunction with the temperature and
            precipitation projections of Montero and Pérez-López (2010) and projections for the
            U.S. side of the border (summarized in Chapter 6), provide a compelling case for an
            increased likelihood of drought, with ramifications for northern Mexico water supplies
            (Magaña, Zermeño, and Neri 2012) and probably for groundwater recharge (e.g., Serrat-
            Capdevila et al. 2007; Earman and Dettinger 2011; Scott et al. 2012).xv Moreover, these
            assessments are consistent with projections of streamflow for trans-border rivers, such
            as the Colorado River and Rio Grande (known as the Río Bravo in Mexico, and hereafter
            Rio Grande), which show decreasing streamflow, lower flow extremes during drought,
            and potential water resource deficits greater than those previously observed (see Chap-
            ters 6 and 7; Hurd and Coonrod 2007; Reclamation 2011).

            16.4 Understanding Vulnerability, Risk, and Adaptive Capacity
            in the Border Region
            Definitions and concepts
            Vulnerability to climate variability and climate change is the experience (by an indi-
            vidual, household, ecosystem, community, state, country, or other entity) of negative
            outcomes due to climate stresses and shocks (Leichenko and O’Brien 2008). Experts
            have approached vulnerability in two distinct but related ways. One approach centers
            on the underlying political and socioeconomic structures, institutions, and conditions
            that affect vulnerability, including asymmetries in power and resource distribution (e.g.,
            Adger 2006; Eakin and Luers 2006; Lahsen et al. 2010; Ribot 2010; Sánchez-Rodriguez
            and Mumme 2010). Vulnerability may be reduced through poverty alleviation and de-
            velopment strategies in developing countries with persistent inequalities (Seto, Sánchez-
            Rodriguez, and Fragkias 2010). A second approach centers on developing systematic
Climate Change and U.S.-Mexico Border Communities 349
measures of climate-related risk in a system, calibrated by exposure and sensitivity (of
actors at multiple scales, including households and neighborhoods to cities, states or
countries) and the coping (or adaptive) capacity to deal with it (Yohe and Tol 2002; NRC
2010; Moss 2011). Adaptive capacity is the ability (of a household, community, or other
unit of organization) to reduce its vulnerability to climate-related risks through coping
strategies such as application of social, technical, or financial resources (Yohe and Tol
2002; NRC 2010). Consistent with the NCA framework, the analysis presented here uses
the second, risk-based approach, but draws on both types of approaches to provide evi-
dence for its conclusions.
This analysis uses the IPCC definition that “vulnerability is a function of character,
magnitude and rate of climate change to which a system is exposed, as well as the sys-
tem’s sensitivity and adaptive capacity” (IPCC 2007a, 6). Risk embodies the likelihood of
harm plus the consequences; thus the consequences of a harm occurring are embedded
within the concept of vulnerability. Vulnerability to a climate-related risk is mediated by
sensitivity (for example, by the degree of dependence on resources and activities that are
impacted by climate change and non-climate parameters), by exposure (for example, the
probability of experiencing change in non-climatic and climatic factors), and by capac-
ity to cope or to adapt (for example, the demographic, socioeconomic, institutional and
technological characteristics that enable response to stress). In general, where resources
for coping are relatively abundant, vulnerability is relatively low; but where resources
for coping effectively are lacking, vulnerability is typically high. This definition char-
acterizes vulnerability both in terms of stressors and the stressed. Stressors here are re-
garded as the interactions of economic and cultural globalization, demographic change,
and climate change. The vulnerability of the stressed border region includes both the
specific attributes of the place and population that transform those stressors into specific
risks that threaten the quality of life and the capacities to effectively cope with such
stressors. Capacity can be considered a function of assets—financial, material, natural,
human, political and social—as well as knowledge, perception of risk, and willingness
to act (Grothman and Patt 2005; Moser and Sattherwaite 2010).
The primary determinants and outcomes of vulnerability can vary across scales
(from local to international). Vulnerability is ultimately a nested phenomenon in which
the impacts and adaptive actions taken at one scale can have ramifications for the whole
system (Adger et al. 2009; Eakin and Wehbe 2009). Institutions (the rules, norms and
regulations that govern the distribution of resources and their management) are instru-
mental in mediating risks. Effective cross-scalar governance is thus a critical element of
addressing vulnerability (Adger, Arnell and Tompkins 2005), particularly in the border
region where trans-border collaboration at multiple governance scales is critical. Trans-
border collaboration among formal government agencies and informal governance
stakeholders may help reduce regional vulnerability through a shared understanding
of the priority vulnerabilities, shared data, and cooperative means of reducing these
vulnerabilities (Wilder et al. 2010).xvi While non-collaboration has led to less than op-
timal outcomes in the past (see Box 16.1 for a case study on collaboration and non-col-
laboration), collaboration may help to reduce regional climate-related vulnerability and
to promote appropriate adaptive strategies for the border region (see Box 16.2 for an
example on the Colorado River Joint Cooperative Process in the Colorado River delta).350 assessment of climate change in the southwest united states
Collaboration takes place at multiple scales in the border region, ranging from formal
intergovernmental collaborative agreements (such as the U.S.-Mexico Transboundary
Aquifer Assessment Program) to informal networks of local water managers working
with the climate research community to develop regional adaptive strategies (such as
the Climate Assessment for the Southwest Program in Arizona and New Mexico).
Box 16.1
Case Study 1: Why Is Trans-border Collaboration Important?
Transboundary cooperation to address the im- seepage flows from the earthen-lined canals
pacts of climate variability and climate change is for over sixty years, and concrete-lining of
essential to promoting the best outcomes and to the AAC stopped groundwater recharge and
building regional adaptive capacity on both sides therefore reduced groundwater availability.
of the border. Despite formal agreements between
Despite these examples of non-collaboration,
the United States and Mexico to cooperate to re-
the trend toward transboundary collaboration has
solve key transboundary environmental problems
been strong over the last twenty-five years and ex-
(e.g., La Paz Agreement; Minute 306), there are
amples of successful collaboration to reduce envi-
recent important examples where lack of coop-
ronmental vulnerability abound:
eration has led to suboptimal (e.g., win-lose rather
than win-win) outcomes: • Emergency Response. The Border Area Fire
Council (BAFC) provides collaborative emer-
• In 2002, Mexico invoked its privilege to de-
gency fire services on both sides of the Cali-
clare conditions of “extraordinary drought”
fornia-Baja California border. The BAFC was
on the Rio Grande and withheld delivery of
formed during the 1996 fire season to facilitate
irrigation water to Texas farmers, causing mil-
cross-border assistance for wildfire suppres-
lions of dollars in losses.
sion (GNEB 2008). Operating under a mutual
• When the United States extended the security assistance agreement that is updated periodi-
fence at the border between Nogales, Arizona, cally, BAFC has improved communications
and Nogales, Sonora, it was done without ref- across the border, held many joint training ex-
erence to local hydrological conditions and ercises, implemented fire safety campaigns on
without input from officials on the Mexico both sides of the border, coordinated devel-
side. Floodwaters in 2008 became impounded opment and maintenance of fire breaks along
behind the fence on the Nogales, Sonora side the border, and jointly conducted prescribed
of the border, causing millions of pesos worth burns along the border. BAFC operates in a
of damage in Sonora. number of natural protected areas in the re-
• The lining of the All-American Canal (AAC) gion and has improved awareness and pro-
was completed in 2008, under formal protest tection of biodiversity. It includes more than
and after legal challenges by Mexican and thirty federal, state, and local organizations
U.S. groups. The change resulted in increased representing fire protection, law enforcement,
water for households in San Diego County elected officials, the health sector, natural re-
and decreased water for farmers in Baja Cali- source managers, and others from both sides
fornia. Farmers in the irrigation district of of the border. Examples of BAFC’s efforts in-
Mexicali had used groundwater recharged by clude assistance in the fall of 2007 when sixtyClimate Change and U.S.-Mexico Border Communities 351
Box 16.1 (Continued)
Baja California firefighters crossed the border • Trans-border Data Sharing. The U.S.-Mexico
to help with the San Diego County firestorm. Transboundary Aquifer Assessment Program
Previously in June 2006, ten engines and (TAAP), authorized by U.S. federal law and
crews from the California Department of For- supported institutionally and financially by
estry and Fire Protection had crossed into Baja both the U.S. and Mexico, is a successful bi-
California to support Mexican fire authorities national program focused on the assessment
for six days with a fire that burned 5,200 acres. of shared aquifers. Although the United States
• Scientist-Stakeholder Research. The Climate did not appropriate funds for TAAP in fiscal
Assessment for the Southwest (CLIMAS) year 2011/2012, during this period the Mexi-
at the University of Arizona is a NOAA Re- can government began funding assessment
gional Integrated Science Assessment pro- activities on its side of the border. TAAP is im-
gram, focused on Arizona and New Mexico. plemented by the U.S. Geological Survey and
The program brings together scientists and the state water resources research institutes of
researchers from many disciplines in the nat- Arizona, New Mexico, and Texas, with collab-
ural and social sciences with citizen groups oration from Mexican federal, state, and local
and decision makers to develop a better fit counterparts, as well as IBWC and CILA. Two
between climate science products (such as central aims of TAAP include the scientific as-
forecasts and projections) and the resource sessment of shared groundwater resources;
managers (such as water or forest managers) and development of dual adaptive-manage-
and decision makers who use the data. Since ment strategies through expanded binational
2005, CLIMAS has actively worked with part- information flows and data exchange (Wilder
ners at the Colegio de Sonora, Universidad et al. 2010; Megdal and Scott 2011). Mutually
de Sonora, and other Mexican institutions of defined priorities for Arizona’s and Sonora’s
higher learning to build regional adaptive ca- common Santa Cruz and San Pedro aquifers,
pacity in the border region via the bilingual for example, are meeting human and eco-
Border Climate Summary, workshops with system water requirements in the context of
stakeholders and researchers, webinars, and growth and climate change (Scott et al. 2012).
fieldwork focused on identifying common TAAP is a model of successful trans-border
understandings of regional vulnerability and cooperation in data sharing and assessment
appropriate adaptive strategies. Other fund- that supports water-management decision-
ing partners who have collaborated in these making in both countries and enhances the
projects include the Inter-American Institute adaptive capacity of the region in the face of
for Global Change Research and NOAA’s Sec- climate change.
toral Applications Research Program.
Key drivers of border vulnerability
Growth trends, urban development patterns, socioeconomic factors, and institutions
and governance mechanisms can be drivers of border region vulnerability.
Context-shaping vulnerability. Today, rapid growth and uneven economic
development are two major contributors to climate-related vulnerability. Institutional352 assessment of climate change in the southwest united states
asymmetry and governance fragmentation on both sides of the transboundary region
create challenges for reducing vulnerability and for trans-border cooperation. Multiple
characteristics define the border region, including high rates of poverty in a landscape
of uneven economic development; diverse ethnic identities; environmental, social, eco-
nomic, and cultural interdependency; and rapid growth and urbanization relative to
both U.S. and Mexico averages.
Box 16.2
Case Study 2: Colorado River Joint Cooperative Process
Trans-border collaboration is playing a signifi- reduced, and agricultural return flows are likely
cant role in addressing environmental challenges to decrease as water moves from agriculture to
in the Colorado River delta. The Colorado River the cities (Zamora-Arroyo and Flessa 2009). The
Joint Cooperative Process (CRJCP) formed un- supply of municipal effluent is likely to increase,
der the auspices of the International Boundary however, although it may be captured for urban
and Waters Commission (IBWC) and its Mexi- use rather than for ecological flows. A new treaty
can counterpart (Comisión Internacional de Minute (Minute 319) adopted on November 20,
Límites y Agua, CILA) in 2008 to develop “bi- 2012 establishes a new commitment by the U.S.
national processes for meeting municipal, agri- and Mexico to cooperate around water and eco-
cultural, and environmental needs” in the delta logical needs in the region. The CRJCP is a col-
(Zamora-Arroyo and Flessa 2009). The CRJCP laborative model for other trans-border areas and
includes government agencies, NGOs, and wa- issues. Although it ultimately received formal
ter stakeholders from both countries. The CRJCP federal approval in both the United States and
has a difficult task ahead, given that excess flows Mexico, the CRJCP originated from an informal
from the United States are likely to be elimi- coalition of local stakeholders that led ultimately
nated in the near future, operational losses are to the formal collaborative process.
likely to decrease, groundwater supplies will be
History. Tribal peoples occupied the border region for many thousands of years be-
fore the arrival of Spanish, Mexicans, and then Americans to the area (see also Chap-
ter 17).xvii Today there are twenty-three Native nations on the U.S. side in the border
region, and about eight indigenous groups on the Mexican side (Starks, McCormack,
and Cornell 2011); some of these peoples (such as the Kumeyaay, the Cocopah/Cúcapa,
the Yaquis, and the Tohono O’odham) continue to have strong trans-border ties. They
manage diverse lands and water and economic resources in the border region. Span-
ish colonizers in the sixteenth century expropriated significant land and resources, and
mestizos, whose land use practices combined Indian and Hispanic traditions, settled in
the border and created many of the current border towns. English-speaking colonizers
of the United States introduced their beliefs of commercial capitalism and the frontier vi-
sion to land use and resource practices in the nineteenth century. The successive arrival
of farmers, workers, investors, migrants, and bureaucrats has continually transformedClimate Change and U.S.-Mexico Border Communities 353
the border over the last 100 years and created one of the most dynamic and diverse
sociocultural landscapes in the world. The diversity of the border region’s population—
including differences in languages used at home and access to technology—challenges
effective communication about climate-related risk.
Contemporary trends. Currently, most of the U.S.-Mexico border population is
concentrated in fourteen fast-growing, paired, adjacent cities with a common history,
strong interactions, and shared problems (CDWR 2009). Eight of these binational pairs
are on the western end of the border in the area included in this chapter (see Figure 16.3).
In 2002, there were approximately 1 million (legal) border crossings daily by residents
in the border’s twin cities to work, shop, attend classes, visit family, and participate in
other activities (GAO 2003); the number of crossings declined to half a million by 2010.
Mexican border towns are part of a very centralized national political system, suffer
from limited fiscal resources, and lack a tradition of urban planning. Across the border,
U.S. towns have had greater political autonomy, are part of a strong and stable national
economy, and have broadly applied land use planning and supplied basic infrastructure
and services to their residents. Thus, the “twin cities” along the U.S.-Mexico border are
places of encounter but also of intense political, social, and physical contrasts.
The per capita income within the U.S. border counties is only about 85% of the U.S.
per capita income. If wealthy San Diego County is excluded, the GDP per capita of the
border region is only about 64% of the national level (2007 data). In 2006, if the twenty-
four U.S. counties along the border were aggregated as the fifty-first state, they would
rank 40th in per capita income, 5th in unemployment, 2nd in tuberculosis, 7th in adult
diabetes, 50th in insurance coverage for children and adults, and 50th in high school
completion—all characteristic of regions of poverty (Soden 2006; and www.bordercoun-
ties.org). In the 2010 U.S. Census, Arizona and New Mexico were tied for the fourth-
highest poverty level in the United States.
Demographic drivers. The binational border region from San Diego-Tijuana to
Paso del Norte is demographically dynamic, growing much faster than the average of
either nation (Figure 16.4).
Since 1970, the U.S. side of the border region has attracted huge flows of domestic mi-
grants—mostly non-Hispanics, seeking a Southwestern “sunbelt” lifestyle (and climate),
retirement, or job opportunities—and international immigrants—mostly from Mexico
and Central America, seeking jobs and economic opportunities. Between 1983 and 2005,
the population almost doubled (from 6.9 million people to over 13 million). Since the
economic recession began in 2007−2008, however, growth rates have declined in border
states, except Texas (Cave 2009; Frey 2011).xviii Growth rates have also declined in many
border counties. For example, growth slowed in the counties bordering Sonora, from a
rate of 5.3% between 2000 and 2005 to 1.6% between 2007 and 2008 (Mwaniki-Lyman,
Pavlakovich-Kochi, and Christopherson, n.d.).
Population projections for the region (reported in USEPA’s 2006 State of the Border
Region) estimate that the region’s population will grow to between 16 million and 25
million people by 2030, an increase of 46% (based on the medium scenario analyzed).
Declining growth rates since the onset of recession in 2008 may represent slower than
projected regional growth.354 assessment of climate change in the southwest united states
Figure 16.3 Population density in U.S.-Mexico border region. P
opulation density shading refers
to the areas on either side of the border, and not the borderline. Reproduced from EPA (2011).
Figure 16.4 Population growth in the western portion of the U.S.-Mexico border region
(2000–2010). Adapted from Good Neighbor Environmental Board 14th Report (GNEB 2011). Source:
U.S. Census Bureau and Instituto Nacional de Estadistica y Geografia (INEGI).Climate Change and U.S.-Mexico Border Communities 355
Ninety percent of the border population resides in cities and the remaining 10% live
in smaller tribal and indigenous communities or in rural areas. Over 40% of the region’s
population resides in California and Baja California, which are home to the major border
cities of San Diego, Tijuana, and Mexicali (EPA 2011). Most population growth in the
next few decades will occur in mid-size and large urban centers, intensifying border
urbanization and metropolization (Lara et al. 2012). Especially on the Mexican side, the
pace of urban growth will be highest in the large border cities and municipalities: the
proportion of population living in urban Mexican centers with more than 500,000 people
is predicted to rise to 58.1% in 2030, from about 44.6% in 2005 (CONAPO 2007). Already,
cities like Ciudad Juárez, Chihuahua, and El Paso, Texas, are practically “fused” or con-
tinuous across the border and are merging with adjacent cities and towns forming trans-
border metropolitan corridors.
This analysis indicates that in the future, exposure to climatic stress will not only
increase with population growth, particularly in urban areas, but sensitivity may also
increase through water-food-energy dependent growth trajectories that will be sensitive
to climatic disturbance. Sustainable growth will be critical for adaptation.
Socioeconomic drivers
Multiple studies have identified the border as a region of high social vulnerability due to
intersecting processes of rapid growth, domestic and international migration, economic
intensification and globalization, and intensive climate change (Liverman and Merideth
2002; Austin et al. 2004; Varady and Morehouse, 2004; Hurd et al. 2006; Ray et al. 2007;
Collins 2010; Jepson 2012; Wilder et al. 2010; Wilder et al. 2012). Climate impacts are not
uniformly distributed across populations and space but instead affect specific vulner-
able populations and places (Romero-Lankao et al. 2012).
Ethnicity is a significant factor in sensitivity and exposure to climate-related risk
(Verchick 2008; Morello-Frosch et al. 2009). Hispanics are the largest ethnic group in
the border region and in 2008 were 42.2% of the population of the U.S. border coun-
ties in the study area; if San Diego with its large non-Hispanic population is excluded,
then the U.S. border region is 55.7% Hispanic.ixx In California, for example, Latino and
African-American communities were found to be more vulnerable to heat exposure and
heat stress than the state population as a whole (Morello-Frosch et al. 2009). Research in
the South and in the Southwest United States documents a higher climate vulnerability
among Latino and African-American populations due to relatively low incomes, sub-
standard housing, structure of employment (e,g, outdoor laborers in landscaping and
construction), lack of affordability of utility costs, and lack of transportation (Vásquez-
León, West, and Finan 2003; Verchick 2008; Morello-Frosch et al. 2009). Minority com-
munities have a greater exposure to the urban heat island effect and suffer more health
problems due to poorer air quality and concentration of industrial uses in the areas
where they live (Harlan et al. 2008; Ruddell et al. 2010).
The diverse cultural meanings and practices associated with resource allocation and
management traditions (Sayre 2002; Sheridan 2010) are also likely to affect adaptation.
For example, the water resources in the Rio Grande Valley, which bisects New Mexico,
are challenged by multiple sector claims and increasing demand associated with popu-
lation growth. These water resources must also serve the traditions and economic needs356 assessment of climate change in the southwest united states
of Native American tribes and pueblos, and flow through traditional acequias—canals—
the lifeblood of four-hundred-year-old Hispanic communities (Hurd and Coonrod 2007;
Perramond 2012).
In general, climate change research has paid limited attention to socioeconomic vul-
nerability and adaptation in human communities. This analysis indicates that in the fu-
ture an increasingly diverse population will be exposed to climatic stress (e.g., floods,
storms, hurricanes [in coastal areas], heat waves, and drought) with implications for
the languages and technologies used to communicate about climate risks and hazards
that affect the region (Vásquez-León, West, and Finan 2003; Morello-Frosch et al. 2009;
Wilder et al. 2012). In addition, development initiatives (such as infrastructure, sewerage
networks, and improved housing) to address uneven development are critical to future
adaptation.
Urbanization, infrastructure, and economy
Regional impacts associated with the climate changes described in Table 16.1 increase
the stresses on urban infrastructure (such as energy for cooling) and water (to meet both
consumptive and nonconsumptive demands for energy generation), exacerbate air pol-
lution, create public health challenges associated with heat waves, and cause increased
demand for urban green spaces. These concepts are explored further in Chapter 13.
Urban vulnerability is structured not only by demographic change, but rather occurs
in multiple sectors, including the built environment and urban economy (Romero-Lankao
and Qin 2011), especially with the increasing urbanization of poverty (Sánchez-Rodri-
guez 2008). Three processes of urban change at the city level have relevance for under-
standing and managing risks from climate variability and climate change generally and
in the border region. First, cities have expanded into areas that are prone to droughts,
heat waves, wildfires, and floods (Collins, Grineski, and Romo Aguilar 2009; Moser and
Sattherwaite 2010; Seto, Sánchez-Rodriguez, and Fragkias 2010). Second, large sections
of the urban population along the U.S.-Mexico border live in unplanned communities
in “informal” housing, lacking the health and safety standards needed to respond to
hazards, and with no insurance (Collins, Grineski, and Romo Aguilar 2009; Wilder et
al. 2012). Third, characteristics of the built environment (such as the heat island effect,
high levels of atmospheric pollutants, impervious surfaces, and inadequate drainage
systems) can amplify the impacts of high temperatures, storms and other hazards asso-
ciated with climate change (Wilbanks et al. 2007; Romero-Lankao and Qin 2011). While
the urban infrastructure of many urban areas on the U.S. side of the border needs major
upgrades to prepare for likely climate change impacts (Field et al. 2007), many Mexican
cities have the additional burden of overcoming development deficits. Among these def-
icits are inadequate all-weather roads, lack of paved roads, poor water treatment (lack of
water treatment plants or treatment plants with insufficient capacity for drinking water
and sewage); decaying water infrastructure, and institutional constraints such as lack
of financing from taxes, uncoordinated planning, and competition among agencies for
agendas and resources.
Even at the neighborhood scale, certain characteristics of the built environment can
amplify risks. For instance, studies showed variations in vegetation and land-use pat-
terns across Phoenix produce an uneven temperature distribution that was correlatedClimate Change and U.S.-Mexico Border Communities 357
with neighborhood socioeconomic characteristics. In other words, affluent areas were
less densely settled, had lower mean temperatures, and thus had lower vulnerability
to heat stress, while low-income areas had more rental housing, greater prevalence of
multi-generational families sharing a household, and a higher prevalence of non-Eng-
lish language speakers (Harlan et al. 2008). These findings point to the need for climate
hazards and risks to be communicated to the public in a way that respects the diversity
of media, technology, and languages in used in the region. In the long run, these prob-
lems could be reduced through improved urban development and investment in mar-
ginalized areas.
Infrastructure. Dense urban areas in the border region contain substantial popu-
lations who are vulnerable to natural disasters linked to climate change because they
live in substandard housing in floodplains or on steep slopes or in housing located in
areas on the urban periphery that are susceptible to wildfires (GNEB 2008). Tijuana and
Nogales, two border cities experiencing rapid population growth, have received an in-
flux of immigrants seeking employment in the maquiladora industry. Many settle in
informal (unplanned) colonias (border-region residential communities that are econom-
ically distressed and usually underserved by infrastructure) with unsuitable topogra-
phy, characterized by steep slopes and canyons. With few measures to control erosion,
extreme rain events and the prevalent topography lead to runoff and floods during ex-
treme conditions (Cavazos and Rivas 2004; Lara and Díaz-Montemayor 2010).
Border cities are also underserved by water and wastewater infrastructure as well
as other urban infrastructure such as paved streets and lighting (Lemos et al. 2002; Jep-
son 2012). In 2007, for example, the Border Environment Cooperation Commission es-
timated that there was nearly $1 billion in unmet investment in water and wastewater
infrastructure in the border region (BECC 2007). An estimated 98,600 households in the
United States and Mexico border region lacked safe drinking water, and an estimat-
ed 690,700 homes lacked adequate wastewater collection and treatment services (EPA
2011). Thus, on both sides of the border, large numbers of residents do not have safe
potable water piped into their homes and lack proper sewage collection and treatment
services (GNEB 2008).
Informal colonias from Tijuana to Nogales to Juárez often are off-the-grid for water,
sanitation, and electricity and rely on purchased water from trucks at relatively higher
cost than municipal tap water (Cavazos and Rivas 2004; Collins 2010; Wilder et al. 2012).
Water-scarce states like Sonora have water rationing in major cities—including the capi-
tal, Hermosillo, and its largest border city, Nogales—based on a system known in Span-
ish as tandeo. Basic infrastructure is limited in the informal colonias, and construction on
unsafe hillsides in floodplains leads to increased risk to human residents from severe
flooding when it rains. Flooding of unpaved roads may disrupt water-truck deliveries
for households not on the municipal grid.
Economy. The border is a region of dynamic growth in both industry and employ-
ment. The region is of critical value to the global economy and both countries’ national
economies due to its production of agriculture and manufactured goods. Its economic
significance therefore enhances its exposure to climatic stress. Its integration into the
global economy means that climate stresses have potential impacts beyond local borders358 assessment of climate change in the southwest united states
because of the potential of disrupted trade. The economy of the border is highly inte-
grated through manufactured and agricultural trade, export-oriented production and
labor, and markets that include cross-border manufacturing clusters in aerospace, elec-
tronics, medical devices, automotive products, and other sectors.
Mexico’s maquiladora industry experienced declines due to the 2001−2002 reces-
sion and the period that followed. Maquiladoras are duty-free, foreign-owned assembly
plants responsible for nearly half of Mexico’s exports in 2006 (GAO 2003; Robertson
2009). At their peak in 2000, they employed over 1 million people, of which 78% (839,200)
were from the five major border cities of Tijuana, Mexicali, and Juárez (and Matamoros
and Reynosa in the eastern border region) (GAO 2003).xx After 2006, Mexico no longer
tracked maquiladora exports separately from its other exports.xxi
Cities on the U.S. side of the border have benefited from the substantial flow of trade
created by maquiladoras, with more than 500,000 jobs added to the U.S. border region
between 1990 and 2006, in services, retail trade, finance, and transportation. While ma-
quiladoras drive higher employment in Mexican border cities, Cañas et al. (2011) found
that Texas border cities experienced the highest maquiladora-related employment in-
creases, with El Paso providing the third-most maquiladora-related jobs of all border
cities (after McAllen and Reynosa). By comparison, California and Arizona border cit-
ies experienced a smaller benefit. Asian production inputs have displaced U.S. suppli-
ers, whose share dropped from 90% in 2000 to 50% in 2006, notably affecting Tijuana
maquiladoras and San Diego suppliers. Maquila employment declined as a result of
the 2001−2002 recession and global low-wage competition from southeast Asia. By 2006,
maquiladoras employed over 750,000 people in border cities (Cañas and Gilmer 2009).
Other forms of integration are trade and capital flows.xxii
This analysis indicates that urban areas in the border region are vulnerable based on
exposure to climate stressors. Urban infrastructure is sensitive to flooding (and related
erosion) and drought, and urban-based economic activities of both regional and global
consequence may be sensitive to impacts caused by climate stressors (such as water scar-
city or water shortage). Urban areas could be set on a more sustainable development
path through urban and economic development strategies such as extending water and
sanitation networks and improving their efficiency; improving flood and erosion con-
trol; promoting water conservation at the household (e.g., rainwater harvesting) and
municipal (e.g., expanded water treatment and reuse) levels; improving substandard or
inappropriately-sited housing; and extending urban green spaces in low-income areas.
Institutional and governance drivers
Institutional asymmetry and fragmentation—meaning differences in governance frame-
works and lack of cohesion and coordination among multiple government agencies and
actors on the two sides of the border—create potential vulnerabilities in managing trans-
border environmental resources. Water management is used here as a lens into insti-
tutions and environmental governance in the region. Governance refers to “the set of
regulatory processes, mechanisms, and organizations through which political actors in-
fluence environmental actions and outcomes” (Lemos and Agrawal 2006, 298). The term
encompasses both government and non-government actors, including communities,
businesses, and non-governmental organizations. On the U.S. side of the border, waterClimate Change and U.S.-Mexico Border Communities 359
governance is decentralized; on the Mexican side, despite decentralization initiatives
codified into national and state laws since 1992, it remains highly centralized (Pineda
Pablos 2006; Mumme 2008; Scott and Banister 2008; Wilder 2010; Varady, Salmón Cas-
tillo, and Eden forthcoming). U.S. border cities and counties are embedded in systems
of water rights and water administration dominated by the four border states—Texas,
New Mexico, Arizona, and California—subject to applicable international treaties, inter-
state river compacts, an assortment of federal laws affecting water development, water
quality, and ecological values, and contracts with federal agencies with water-related
jurisdictions. Water providers range widely in size, from small local utilities up to giant
municipal water providers like the Metropolitan Water District of Southern California
and the San Diego Water Authority. Farther east, agencies include El Paso Water Utili-
ties and local municipal water authorities. In irrigation, management ranges from the
sprawling Imperial and Coachella irrigation districts, which have Colorado River water
entitlements that dwarf those of Nevada and Utah combined, to lesser ones like New
Mexico’s Mimbres Valley Irrigation Company and Arizona’s Upper San Pedro Water
District. On the Mexican side of the border, states and municipios as well as irriga-
tion districts are governed by Mexico’s National Water Law through the National Water
Commission (CONAGUA). The western Mexican border states (Baja California, Sonora,
and Chihuahua) each have a state-level water agency that partners with CONAGUA
and local water utilities (organismos operadores), while irrigation districts remain under
the direct oversight of CONAGUA or, in the case of large irrigation districts, are admin-
istered by an irrigation district authority with CONAGUA oversight. At the internation-
al level, the allocation and management of riparian surface water is governed by several
treaties and their amendments and extensions.xxiii
The inherent differences between these decentralized and centralized systems of
water governance complicate binational cooperation and water planning at the border.
Political and administrative decisions on managing scarcities and climatic variation are
often achieved more readily in Mexico than in the United States owing to centralized
planning in that country.xxiv Institutional fragmentation and complexity mark water re-
source management on the U.S. side, in particular (Mumme 2000; Milman and Scott
2010; Wilder et al. 2012). The treaties and international institutions for coordinating wa-
ter also have limitations for the management of climate variability. The International
Boundary and Water Commission (IBWC) has a limited mandate for coordinating bina-
tional activities in times of prolonged drought and lacks basin-wide advisory bodies to
assist it as it deals with national, state, and local authorities (Mumme 1986). The IBWC
also lacks clear jurisdiction for managing groundwater extraction of groundwater in the
border zone (Scott, Dall’erba, and Díaz-Caravantes 2010).
These recognized policy challenges provide a strong rationale for the development
of binational watershed partnerships and less formal arrangements aimed at supporting
the ecological health of watersheds and water conservation in the border region. Part-
nerships like the Tijuana Watershed Task Force, the Upper San Pedro River Partnership,
and the Santa Cruz River Aquifer Assessment all point in the direction of sustainable
initiatives that need be supported and strengthened. Recent IBWC-based efforts have
extended the treaty regimes on the Rio Grande and the Colorado River to better address
conservation and long-term water supply planning. Programs include an innovativeYou can also read