Encouraging Bicycling and Walking - The State Legislative Role - Ncsl
←
→
Page content transcription
If your browser does not render page correctly, please read the page content below
Encouraging Bicycling and Walking
The State Legislative Role
Encouraging Bicycling and Walking
      The State Legislative Role

                            By
                      Douglas Shinkle
                           and
                       Anne Teigen

                     William T. Pound
                     Executive Director

                   7700 East First Place
                  Denver, Colorado 80230
                     (303) 364-7700

          444 North Capitol Street, N.W., Suite 515
                 Washington, D.C. 20001
                     (202) 624-5400

                        www.ncsl.org

                      November 2008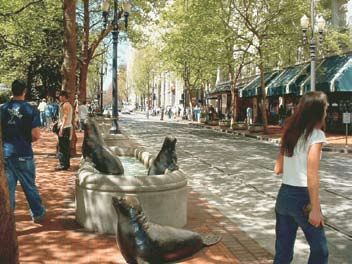
The National Conference of State Legislatures is the bipartisan organization that serves the legislators and staffs of the states,
commonwealths and territories.

NCSL provides research, technical assistance and opportunities for policymakers to exchange ideas on the most pressing
state issues and is an effective and respected advocate for the interests of the states in the American federal system. Its
objectives are:

•   To improve the quality and effectiveness of state legislatures.
•   To promote policy innovation and communication among state legislatures.
•   To ensure state legislatures a strong, cohesive voice in the federal system.

The Conference operates from offices in Denver, Colorado, and Washington, D.C.

                           The League of American Bicyclists promotes bicycling for fun, fitness and transportation and
                           works through advocacy and education for a bicycle-friendly America. The League represents
                           the interests of the nation’s 57 million cyclists.
                           With a current membership of 300,000 affiliated
                           cyclists, including 25,000 individuals and 700
                           affiliated organizations, the League works to bring
                           better bicycling to your community. Learn more
about the League at www.bikeleague.org.

Bikes Belong is the U.S. bicycling organization dedicated to putting more people on bicycles more often. Bikes Belong
Coalition works to maximize federal bike funding for bicycling, awards grants to support innovative bike facility and
advocacy projects, promotes bicycling and its benefits, and sponsors key national initiatives such as the National Bike
Summit, the Safe Routes to School National Partnership, and the Bicycle Friendly Community program. The affiliated
Bikes Belong Foundation focuses on improving bicycle safety and enhancing children’s bike programs.

                                                 Printed on recycled paper.
                                   © 2008 by the National Conference of State Legislatures.
                                                     All rights reserved.

                                                   ISBN 978-1-58024-529-6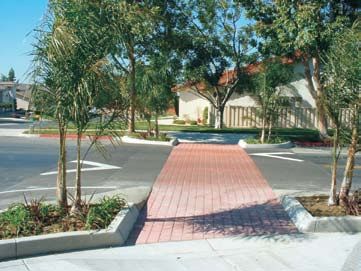
Encouraging Bicycling and Walking: The State Legislative Role                                                                                                               iii

Contents
Preface and Acknowledgments.....................................................................................................................................v

About the Authors.......................................................................................................................................................vi

Executive Summary....................................................................................................................................................vii

1. Introduction........................................................................................................................................................... 1
   Transportation Benefits.......................................................................................................................................... 2
   Economic Benefits................................................................................................................................................. 2
   Public Health Benefits........................................................................................................................................... 5
   Energy and Environmental Health Benefits........................................................................................................... 7

2. Setting the Scene: The Current State of Bicycling and Walking in the United States............................................. 8
   Current State of Bicycling...................................................................................................................................... 8
   Current State of Walking..................................................................................................................................... 11
   Federal Involvement in Bicycling and Walking Policy.......................................................................................... 12

3. Funding............................................................................................................................................................... 13
   Motor Fuel Tax Revenue for Bicycle and Pedestrian Projects................................................................................ 13
   Dedicated Minimum........................................................................................................................................... 14
   User Fees.............................................................................................................................................................. 15
   State Grant Programs........................................................................................................................................... 17
   Sidewalk Funding................................................................................................................................................ 21
   Incentives for Commuters, Employers and Landlords.......................................................................................... 21

4. Planning............................................................................................................................................................... 24
		Statewide Bicycle Plans........................................................................................................................................ 26
   Statewide Pedestrian Plans................................................................................................................................... 28
   Complete Streets.................................................................................................................................................. 29
   Connecting Bicyclists, Pedestrians and Public Transit........................................................................................... 32
   Rail-Trails............................................................................................................................................................ 36

5. A Visual Tour of a Bicycling- and Walking-Friendly Community......................................................................... 38

6. Safety................................................................................................................................................................... 45
   Safe Routes to School.......................................................................................................................................... 45
   Older Pedestrians................................................................................................................................................. 48
   Pedestrian Safety Enforcement............................................................................................................................. 50
   Bicycle Safety....................................................................................................................................................... 52

                                         National Conference of State Legislatures                                                                                          iii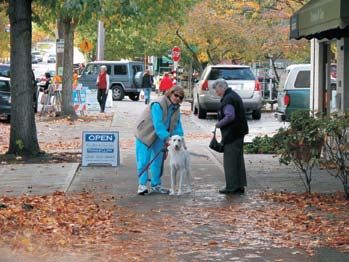
iv                                                                                        Encouraging Bicycling and Walking: The State Legislative Role

List of Tables and Figure
    Tables
    1. The Five Es for Safe Routes to School Programs........................................................................................... 48
    2. Bicycle Helmets............................................................................................................................................ 57

     Figure
     1. States that Issue “Share the Road” License Plates......................................................................................... 56

Appendices
  A. Notable State Funding Statutes for Bicycle and Pedestrian Facilities............................................................. 61
  B. Notable Bicycling and Walking Incentives State Legislation.......................................................................... 64
  C. Notable Bicycle Planning State Statutes........................................................................................................ 66
  D. Notable Complete Streets State Statutes....................................................................................................... 68
  E. States Where Bicycles Are Considered Vehicles............................................................................................. 69
  F. Driver’s Manual Contains Questions on Motorists’ Rights and Responsibilities to Cyclists . ........................ 70
  G. Driver’s License Test Contains Questions on Motorists’ Rights and Responsibilities to Cyclists.................... 71

Photo Credits............................................................................................................................................................ 72

Notes........................................................................................................................................................................ 73

                                                                               National Conference of State Legislatures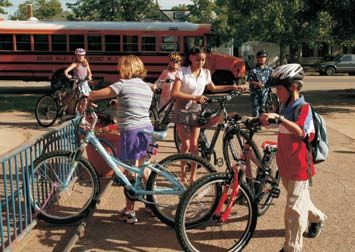
Preface and Acknowledgments

This report was prepared with primary financial support from the League of American Bicyclists
and the Bikes Belong Coalition and with generous support from the American Cancer Society,
the National Association of Realtors and the New Belgium Brewery. The National Conference
of State Legislatures (NCSL) identified the need for a document that captures and synthesizes
distinct state approaches to encourage bicycling and walking.

Numerous experts shared knowledge that strengthened the report. Thanks go to the following,
who contributed their knowledge and insights: Kelly Pack with the Rails-toTrails Conservancy,
Barbara McCann with the Complete Streets Coalition, Deb Hubsmith with the Safe Routes
to School National Partnership, Andrew Shipman with the Bikestation Coalition, Drew
Vankat with the International Mountain Bicycling Association, and Dan Grunig with Bicycle
Colorado.

David Levinger, president of the Mobility Education Foundation, provided invaluable
assistance with the walking portions of this report. His help with editing, acquiring images,
and providing valuable feedback is deeply appreciated.

Thanks also go to the state bicycle and pedestrian coordinators, who provided details about state
programs. Of particular assistance were Tom Huber, Joshua DeBruyn and Rachel Roper.

Special thanks go to staff of the Bikes Belong Coalition and the League of American Bicyclists
for sharing their knowledge and for their help throughout the project.

Finally, thanks go to NCSL staff who helped to prepare the report for publication: Leann
Stelzer, who edited and formatted the report and saw the project from start to finish; and
Melissa Savage, Kate Marks, Feray Baytok, and Shannon McNamara.

                                                                                                    v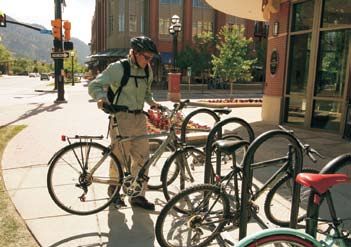
About the Authors
     Douglas Shinkle is a policy associate for the National Conference of State Legislatures. He
     specializes in research on healthy community design issues, including smart growth, bicycle and
     pedestrian issues, farm-to-school and farmers’ markets. Mr. Shinkle has written extensively on
     these topics, including briefs on complete streets and farm-to-school issues. He also maintains
     a database on state legislative activity on healthy community design issues. Mr. Shinkle has
     worked for numerous elected officials. He holds a bachelor’s degree in political science and
     history from Colorado State University.

     Anne Teigen is a policy associate in the Transportation Program at the National Conference of
     State Legislatures. She specializes in a wide variety of transportation topics, including traffic
     safety. Ms. Teigen has authored state legislative reports and presented information on teen
     driving, impaired and distracted driving, aggressive driving, bicycle safety, and motor vehicle
     registration and titling laws. In addition to researching and tracking transportation issues, Ms.
     Teigen also works for NCSL’s State-Tribal Institute. She holds a bachelor’s degree in sociology
     from Colorado State University and a J.D. from the University of Kansas, and was admitted
     to the Colorado bar.

vi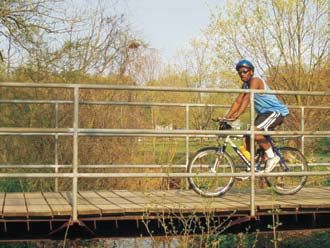
Executive Summary
Bicycling and walking historically have been important means of transportation and recreation
in the United States. Since World War II, however, the development of automobile-oriented
communities has led to a steady decline of bicycling and walking. These activities became lost
in the dustbin of history and limited to childhood play. During the past few years, however,
a renaissance has occurred with impressive increases in the number of people who bicycle and
walk for transportation and recreation. Record gas prices, a gridlocked transportation system,
increasing health maladies related to physical inactivity, and environmental concerns have led
to a reexamination of the transportation choices available in this country and to a subsequent
shift from driving to more walking and bicycling.

Today, people of all ages, income groups and fitness levels use walking and bicycling for
everyday travel, recreation, and getting to and from work. It is important to remember that
approximately one-third of the population is unable to drive—because of age, disability, choice
or license restrictions—so bicycling and walking are important transportation options. Public
transit, which is primarily reached on foot or by bicycle, also has experienced significantly
increased use during the past few years. Pedestrians and bicyclists suffer the effects—sometimes
fatal—of a transportation system that does not account for their needs. All road users—
including motorists, bicyclists and pedestrians—must act responsibly and follow the rules of
the road for their own and others’ safety. It lies with state governments, however, to play the
primary role in ensuring that roads are safe and accommodate all users.

Many people are bicycling and walking more because of the many benefits these transportation
choices provide. Walking and bicycling offer cheap, effective ways to reach a destination,
especially with the likelihood of higher gas prices. Furthermore, they provide a variety of
benefits to individuals and society. Both are clean forms of transport that emit no pollutants.
With disturbing increases in diseases and ailments related to lack of exercise, active commuting
also is an effective way to combat diseases related to inactivity, especially for those who have
time constraints. Communities where destinations are easy to reach by bike and foot create a
more balanced transportation system and more welcoming neighborhoods.

Research on government involvement in bicycling and walking has centered mainly on
congressional activity. With increased flexibility and innovation, however, states have played
a crucial role in developing and modeling successful strategies to encourage bicycling and
walking. This report provides information about and examples of how state legislatures can
and have proactively supported bicycling and walking, especially as transportation choices.

                                                                                                   vii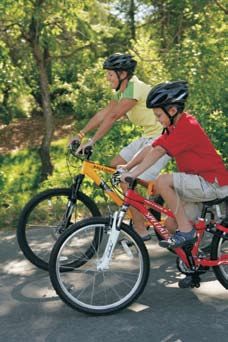
viii                                       Encouraging Bicycling and Walking: The State Legislative Role

       What’s Inside
       The report first provides an overview of recent trends in bicycling and walking and the related
       transportation, economic, public and environmental health benefits. A snapshot of the current
       state of bicycling and walking in the United States follows. Subsequent chapters examine state
       legislative activity in three key areas: funding, planning and safety.

       The funding section reviews state efforts to provide money for bicycling and walking
       infrastructure and programs, including some funding stream mechanisms. The planning
       section examines how states have integrated bicycling and walking into transportation plans and
       projects and discusses the importance of these options within state decision making. A visual
       tour of a bicycling- and walking-friendly community follows, with samples of infrastructure
       design elements that can increase bicycle and pedestrian safety and use. The final chapter
       discusses how states are increasing safety for pedestrians and bicyclists, including creating new
       laws; increasing penalties; targeting enforcement; and increasing responsibility for motorists,
       pedestrians and bicyclists.

                                   National Conference of State Legislatures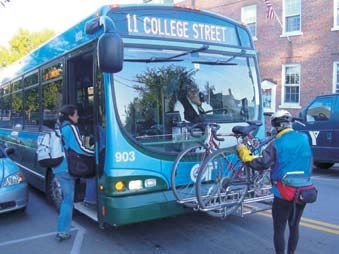
Encouraging Bicycling and Walking: The State Legislative Role                                        1

1. Introduction
During the last few years, cities nationwide have seen increased use of alternative transportation
such as mass transit, bicycling and walking. In a steady trickle and then a torrent, bike path,
sidewalk and bus use have risen, often in record numbers. High gas prices, thinning wallets and
rising obesity rates are among the factors causing people to consider alternative transportation.
This report provides policy options and discussion about how to increase walking and bicycling
as alternative transportation choices.

                                                              When the general public thinks
                                                              of riding a bike or walking, it
                                                              often is an afterthought or a
                                                              childhood endeavor that has no
                                                              relevance in a busy, 21st century
                                                              world. Several factors during the
                                                              last few years have encouraged
                                                              more bicycling and walking,
                                                              and today they are considered
                                                              increasingly viable methods
                                                              of transportation. People are
                                                              walking and bicycling to and
                                                              from work, shopping and other
                                                              appointments. In the face of
congestion, these alternative transportation choices can help address a host of challenges the
nation faces.

Public transit also is becoming increasingly important. Ridership skyrocketed in the last year,
and many walk or bike to and from transit stops. The important connection between public
transit, bicycling and walking is addressed throughout this report.

The introductory chapter discusses how bicycling and walking benefit state transportation,
economics, public health, energy and environmental health. It also offers a look at the current
state of U.S. bicycling and walking, including federal policies.

Chapter 2 addresses various funding mechanisms available to states as they attempt to improve
conditions for cyclists and pedestrians. Chapter 3 provides examples of how states can plan
more effectively for bikes and pedestrians and includes a visual tour of what a bicycling- and
walking-friendly community might look like. Chapter 4 discusses pedestrian and bicycle safety
issues, including various state laws and programs.

                              National Conference of State Legislatures                              1
2 Encouraging Bicycling and Walking: The State Legislative Role
Transportation Benefits
In 2003, the 85 largest U.S. metropolitan areas dealt with congestion that caused 3.7 billion
hours of travel delay, wasted 2.3 billion gallons of fuel, and resulted in total congestion costs
of $63 billion.1 Relieving congestion and moving people and goods efficiently in the coming
years will require a multi-faceted transportation system. Bicycling and walking can increase
the capacity of public transit systems and extend the reach of bus and rail lines. Some cities—
including Portland, Ore., Minneapolis, Minn., and Tucson, Ariz.—have proven that properly
accommodating bicyclists can increase the number of bicycle commuters and transit users,
thus reducing stress on the road system. Of note is the fact that approximately one-third of
Americans do not have consistent access to an automobile and must rely upon other means of
transit.2
Between 1990 and 2000, Oregon and Washington—both of which have programs designed
to encourage alternative forms of transportation, especially bicycling—were the only states to
see a decrease in the percent of people who drove alone to work, according to a U.S. Census
Bureau survey.3 Both also were ranked in the top five by the League of American Bicyclists
for their bicycle-friendly poli-
cies and practices. In all other
states, the average rate for
drive-alone commuting in-
creased during the decade by
3.4 percent.4
The length of most trips in
the United States is conducive
to bicycling and walking.
Twenty-five percent of all
trips are shorter than one
mile, and statistics show that
75 percent of these trips are
made by personal car. Of the
40 percent of trips that are less than two miles, nine out of 10 are made by car.5 Bicycling and
walking are viable and efficient options for these short trips.
Safety is an issue for some potential bicyclists and pedestrians. America’s traffic gridlock could
be significantly decreased by providing a safe environment for bicycling and walking. The
benefits of investing in bicycle facilities are estimated to be at least four to five times the cost,
making these investments more cost-effective than other transportation alternatives.6
Economic Benefits
The personal and overall economic benefits of bicycling and walking can be significant.
From an individual perspective, walking and bicycling, either in combination with public
transit or exclusively, are less costly than driving an automobile. Annual bicycle operation and
maintenance cost approximately $120, compared to $13,950 per year for a car that is driven
15,000 miles, according to calculations at commutesolutions.org. Traffic congestion is also a
significant drain on the economy. The Texas Transportation Institute found that congestion
cost the average urban peak-time driver $710 per year in 2005. The institute also found the
National Conference of State LegislaturesEncouraging Bicycling and Walking: The State Legislative Role 3
national cost of traffic congestion
to be at least $78 billion in 2007.
Bicycling is also a significant rev-
enue generator, contributing $133
billion annually to the nation’s
economy and supporting approxi-
mately 1.1 million jobs.7 An Au-
gust 2008 survey of bicycle retail-
ers nationwide showed increased
interest in bicycling, especially for
commuting to work or running
errands. Ninety-five percent of
bike shops reported that custom-
ers who made bicycle-related purchases cited higher gas prices; the same percentage reported
customers are turning to bikes for transportation.8 The survey also found that bike sales in-
creased for 73 percent of retailers, and bike repairs were up for 88 percent. The bike industry
is capitalizing on the renewed in-
terest in bicycling, especially as a
form of transport, by customizing
bikes to fit the needs of commut-
ers and errand-runners.
Studies show that homes located
near bicycling and walking trails
typically sell faster and at higher
prices, and realtors often highlight
the trails as an amenity. In a survey
of new homebuyers conducted
by the National Association
Homes for sale near trail in Vienna, Va.
of Realtors and the National
Association of Homebuilders,
walking and bicycling trails were cited as the second most important community amenity.9
Some realtors note that more prospective buyers inquire about homes near bike trails. In
Marion County, Ind., for example, homes near greenway
corridors sold for an average of 10 percent more.10
A few states have quantified the economic effects of bicycling.
Colorado found that bicycling generates more than $1 billion per
year for the state. Colorado is a hot spot for bicycle manufacturing,
which generated $763 million in revenue. Other sources such
as bicycle sales and tourism generated close to $400 million.
Wisconsin also found bicycling to be an important industry in
the state. Wisconsin estimated that 3,400 jobs were created and
more than $556 million flowed into the economy due to bicycle
manufacturing, distribution and retail industries.
National Conference of State Legislatures4 Encouraging Bicycling and Walking: The State Legislative Role
Bike Tourism
Many states gear marketing campaigns specifically
to bicycle tourists. States and communities
especially appreciate bicycle tourism because
it is a low-impact, clean industry. Not much is
required, other than ensuring safe and interesting
places to ride. Bicycle tourists appeal to cham-
bers of commerce because they often have more
disposable income and spend more time on vacation. According to the Outdoor
Industry Association, a cyclist’s median income is $62,500, compared to $46,000 for the
average American. Large group bicycle tours or multi-day rides often involve hundreds
or thousands of riders who need accommodations and food.
Several states have identified bicycle tourism as an important economic resource. The
Maine Department of Transportation commissioned a 2000 study on the economic
effect of bicycle tourism. Study results estimated the direct economic impact at $36.3
million. A regional-specific economic multiplier model, however, indicated additional
related spending of $30.5 million, for a total of $66.8 million. Findings from the study
indicated that improving on-road conditions and building more shared-use trails would
enhance bicycle tourism.11
States can help bolster bicycle tourism by designating, marketing and improving routes
that include noteworthy historical, scenic and cultural attractions. As a result of 2005
legislation, the Texas Department of Transportation was to develop bicycle tourism
trails in the state. The Bicycle Advisory Committee recommended that the department
designate a route from Austin to Houston as the first state bicycle tourism trail. Next
steps include developing signage and possible modest infrastructure improvements.
Mountain biking also can generate significant revenue. In tourist-reliant Colorado, the ski
industry uses existing infrastructure to transform slopes into mountain biking hotspots in
the summer off-season. Drawing nearly 700,000 summertime bicycle tourists, this new
industry has helped strengthen and diversify
the ski resorts’ overall business portfolio. A
1999 Colorado study concluded that, “Tourists
who engaged in bicycling during their vacation
at a Colorado resort spent between $141
million and $193 million.”12 Bike trails in the
Moab, Utah, area, a popular mountain biking
destination, produce an estimated $8.4 million
to $8.7 million annually.13
National Conference of State LegislaturesEncouraging Bicycling and Walking: The State Legislative Role 5
Public Health Benefits
Two-thirds of U.S. adults are overweight or obese, which increases the likelihood of serious
health issues such as hypertension, diabetes, stroke and some forms of cancer.14 Because health
care spending averages approximately 30 percent of a state budget, the rising costs associated
with physical inactivity can be particularly important to state legislators.15 Studies show that
physical activity performed as a part of daily activities—such as bike commuting or walking to
the market—can help improve fitness and reduce blood pressure as much as a trip to the gym.16
Bicycling and walking also can improve mental health; a 2007 study found that a 30-min-
ute bike commute positively
influenced men’s mental
health.17
The connection between
the walking- and bicycling-
friendliness of a neighbor-
hood and individual health
has been well researched
in recent years. A study
documented in the American
Journal of Preventive Medicine
found that, “A man of average
height and weight who lived
in the most walkable neighborhood in Salt Lake County would be expected to weigh an
average of 10 pounds less than a man living in the least walkable neighborhood. For women,
the difference would be six pounds.”18
Although some self-selection occurs among physically active citizens who would prefer to live
in more activity-accessible neighborhoods, studies show that those who move from low-density
areas to neighborhoods that have
more accommodations and desti-
nations for pedestrians are likely
to walk more.19 Not surprisingly,
people who walk or bike to work
are much less likely to be over-
weight or obese.20
Obesity rates among American
children are particularly startling.
This may well be the first genera-
tion of Americans to have a lower
life expectancy than their parents.
Two-thirds of adolescents do not
meet the U.S. Surgeon General’s
recommendation for 60 minutes
of moderate physical activity daily.21 As a result, the obesity rate for children has tripled and
more adolescents are being diagnosed for typically adult maladies such as type two diabetes
and high blood pressure.
National Conference of State Legislatures6 Encouraging Bicycling and Walking: The State Legislative Role
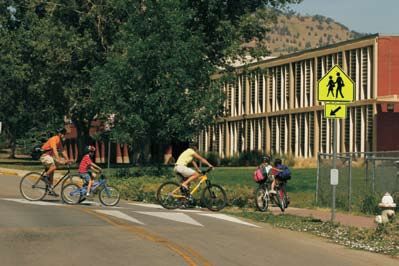
As with adults, research indicates a
strong correlation between availability
of sidewalks, parks and mixed-use
development and higher physical activity
levels for children.22 One Atlanta, Ga.,
study showed that children were twice
as likely to have taken a walking trip
in the past two days if they lived in a
neighborhood that had sidewalks and
destinations within one mile of home.23
It is especially important for American
children to participate in physical activity
in their formative years that will carry into adulthood. A 2008 study found that normal-
weight and overweight children who engaged in activities such as bicycling were much less
likely to become overweight adults.24 Having an infrastructure that provides opportunities for
physical play is clearly an important factor in raising healthy children.
The League of American Bicyclists’
Bicycle Friendly State Program
The League of American Bicyclists recently launched the Bicycle Friendly State Program
to work with states that want to improve their bicycling environment. Bicycling is an
activity that can help solve issues such as traffic congestion, air pollution and the obesity
epidemic. It also offers a unique opportunity for state agencies—transportation, public
health, recreation, tourism and planning—to work together on issues of mutual concern.
Through legislation, policies and programs states can promote bicycling as a healthy
and affordable means of recreation and transportation for everyone. A bicycle-friendly
state may wish to incorporate aspects of the “Five Es” to encourage better bicycling:
Engineering, Education, Encouragement, Enforcement and Evaluation.
The two-part Bicycle Friendly State Program ranks and awards states that actively support
bicycling.
1. All 50 states are ranked annually based on their levels of bike-friendliness.
2. Each state then has an opportunity to apply for the Bicycle Friendly State award rec-
ognition. A state’s efforts are further recognized and promoted within this program.
In addition the state receives feedback,
technical assistance, and encourage-
ment to improve its bicycling legisla-
tion, projects and programs.
For more information about the League’s
Bicycle Friendly State Program, visit www.
bikeleague.org or call (202) 822-1333.
National Conference of State LegislaturesEncouraging Bicycling and Walking: The State Legislative Role 7
Energy and Environmental Health Benefits
Many people rely on bicycling and walking for economic and health reasons; these benefits
are further highlighted by unstable gasoline prices and air pollution from vehicle emissions.
Traveling by bike or on foot can play a significant role in reducing U.S. energy consumption
and improving air quality.
Currently, “U.S. cars and light trucks consume about 44 percent of all the petroleum used
nationwide and 10 percent of that used worldwide, in the process generating about 22 percent
of total U.S. carbon dioxide emissions.”25 Shifting just a small percentage of trips to bicycling
or walking could significantly reduce fuel use, possibly curbing gasoline demand and prices.
A bicyclist who commutes eight miles round-trip four days per week, for example, could save
54 gallons of gas annually. If American bicycle and foot trips increased modestly to 13 percent
of trips less than three miles, annual U.S. gasoline consumption could decrease by 3.8 billion
gallons annually.26 This decrease could help to reduce imports of foreign fuel.
Bicycling and walking also can replace car
trips that tax the environment. Both these
non-polluting transit options are especially
useful for short trips. In fact, 60 percent
of automobile pollution occurs within
the first few minutes of operation, before
the catalytic converter begins to work
efficiently.27 Once again, a small increase to
13 percent of trips under three miles taken
by foot or bike could remove 9 million
tons of carbon dioxide from America’s air
each year.28
According to the U.S. Environmental
Protection Agency, motor vehicle emissions
represent 31 percent of total carbon dioxide,
81 percent of carbon monoxide, and 49 percent of nitrogen oxides released in the United
States.29 Air-conditioned vehicles account for about 25 percent of U.S. chlorofluorocarbon
(CFC) use, and CFCs are responsible for approximately 14 percent of the greenhouse effect.30
Bicycling and walking are environmentally friendly alternatives to driving.
Policymakers can consider the benefits of bicycling and walking when crafting policies
related to transportation, economic development, health, energy consumption, recreational
opportunities and overall budgets.
National Conference of State Legislatures8 Encouraging Bicycling and Walking: The State Legislative Role
2. Setting the Scene: The Current
State of Bicycling and Walking in the
United States
In America, 8.7 percent of trips are made by walking, and only 0.8 percent are completed
on bicycles, according to the most recent National Household Travel Survey. This is a small
amount of mode share as compared to other countries and historic patterns in the United
States. A mode share is defined as “the percentage share that a particular type of transportation
mode (i.e., car, bus, rail, plane, etc.) has in relation to other modes.” Between 1977 and 1995,
walking trips declined by 40 percent for both children and adults.31
Safe, connected facilities such as bike
paths and sidewalks in communities
encourage more people to walk and
bike. Funding for bicycling and
walking projects in many instances has
been insufficient, however. Between
1998 and 2001, the average annual
amount spent on pedestrian and bicycle
projects was 87 cents per person, while
the average annual amount spent for
roads and bridges was more than $50
per person.32
The Nationwide Personal Transportation Survey and National Household Travel Survey detected
an increase in the number and percentage of trips taken by bicycle and foot during the last 10
years, especially for non-work-related trips. Work-related trips reportedly declined somewhat,
but the counts for bicyclists and pedestrians are not always rigorous enough to capture all
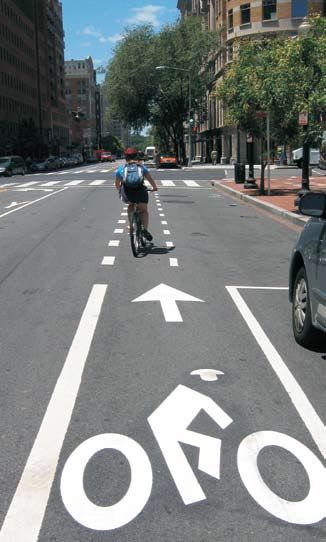
users. Some cities have made serious attempts to accommodate bicycles and pedestrians. New
York City, for example, has dedicated space in its crowded streets to encourage bicyclists. It
also sought to establish a more accurate count of how many people bicycle to work. Using a
trends analysis, the city found that commuter cycling increased by an impressive 77 percent
between 2000 and 2007.33 Other cities such as Portland, Ore., also report a dramatic increase
in the number of cyclists. Anecdotal evidence from 2008, when gas prices rose to record
levels, also is of interest. A record 35,000 riders—including at least 10,000 first-time bike
commuters—participated in Denver’s 2008 bike to work day. Many communities reported
similar increases.
Current State of Bicycling
Who bicycles in America today, where and for what reasons? According to the Outdoor
Industry Association, 86 million people in the United States ride bikes. Most—58 percent of
8 National Conference of State LegislaturesEncouraging Bicycling and Walking: The State Legislative Role 9
the general ridership—are male,34 and 78 percent of bicycle commuters are male.35 Female
riders are a good indicator that bicycle facilities are accommodating a wide variety of users.
Female riders tend to be more safety-conscious and their increased presence points to a system
considering users of all skill and comfort levels.36
• Nationwide, minorities and whites are about equally likely to travel to work by bike.37
• Younger people tend to ride more until they reach driving age.
• Most bicyclists ride for pleasure or exercise, but at least 43 percent make more utilitarian
trips, such as to visit a friend or run errands.38
Although recreational bicyclists tend to have higher
incomes, it is important to note that bicycling
crosses economic and racial divides. People who
have higher incomes may ride for pleasure and
transportation, but those who earn less may ride
or walk due to a lack of other transit options.39 It
is important for policymakers to consider who is
bicycling when they devise strategies to encourage
cycling. To encourage bicycling among a broad
cross-section that includes age, gender, geography
and income, various accommodations may be
necessary.
There is a big difference in the comfort level—and
thus the kind of accommodation to be considered—
of frequent, infrequent and potential riders when
choosing where to ride and whether to ride in
traffic.
Existing daily bicycle commuters and long-time recreational and competitive riders often are
used to riding on the road with motor vehicle traffic and will ride on almost any street or
highway. For them, surface quality and maintenance
issues are as important as whether there is a bike
lane on the street. In rural areas, a paved shoulder
(preferably four feet or more without rumble strips)
will serve them well.
Less frequent or casual riders express a clear
preference for riding on trails or city streets that
have some additional provision for cyclists, such as
a striped bike lane. A range of bikeway types exist,
from shared roadways with lower traffic volume and
speed limits to busy arterial roadways that have bike
lanes or physically separated facilities.
New and returning cyclists often will ride only on
low-volume neighborhood streets or on paths or
trails where there is no motor vehicle traffic. At least
initially, they are not comfortable riding in traffic.
National Conference of State Legislatures10 Encouraging Bicycling and Walking: The State Legislative Role
Experience nationwide shows that the “best” communities for bicyclists have a mix of on- and
off-street bikeways that are connected and serve the same key origins and destinations as the
roadway network. No one facility type is better or safer than another; they have different
applications and results. The visual tour of a bicycle-friendly community in Chapter 5
illustrates many of these facility types.
Policymakers who want to encourage bicycle use by promoting various policies and programs
will rightly be concerned with their effect on bicyclists’ safety and with collisions between
bicyclists and motor vehicles. The good news is that, in the experience of communities
worldwide, increased bicycle use does not necessarily increase bicycle crashes. In Portland,
Ore., for example, bicycle ridership has increased by 210 percent since 1991 with no increase
in the number of bicycle-motor vehicle collisions during that period.40
Bicycling is not without risk, however. In 2007, 698 bicyclists were killed while riding,
and 43,000 were injured, according to the National Highway Traffic Safety Administration.
Although bicycle crashes often are underreported, bicyclists are still overrepresented in the
number of injuries and deaths compared to the number who ride.
Crash studies have shown that a relatively small number of common mistakes contribute to a
large percentage of bicycle-motor vehicle collisions. Riding the wrong way—against the flow
of traffic—and riding on the sidewalk are two of the main causes of collisions.
• Motorists who are turning onto a street or driveway are not looking for bicyclists on
sidewalks, especially those coming against the flow of traffic.
• Because bicyclists usually travel much faster than pedestrians, they catch the turning
motorist by surprise.
• The closing speed of a motorist and a bicyclist coming head-on toward each other does not
leave enough reaction time and increases the impact of a collision.
Many are surprised to discover that being hit from behind by a passing motorist is not a
common crash type, although it frequently is cited as the greatest fear. Fewer than one in
10 fatal crashes occur this way. They tend to be in rural locations and involve higher motor
vehicle speed.
A 2008 National Highway Traffic Safety Administration survey contained numerous insights
into bicyclist behavior and habits. The survey found that one in 10 bicyclists felt their personal
safety was threatened on the most
recent day they rode.41 Riders in
suburban areas were most likely to feel
threatened and also to want improved
bicycle facilities in their community.
Eighty-eight percent noted that
motorists threatened them by driving
too close and fast. “Half of bicyclists
reported that bicycle paths (paths
away from the road on which bikes
can travel) are available in the areas
they rode, while 32 percent reported
that bicycle lanes (marked lanes on
a public road reserved for bikes to
National Conference of State LegislaturesEncouraging Bicycling and Walking: The State Legislative Role 11
travel) are available.” Approximately 75 percent of bicyclists typically ride on the road and use
bicycle lanes when available. The use of off-street bicycle paths or trails is approximately 13
percent, however, suggesting that most people do not have access to them.
The NHTSA survey also found that some cyclists (14 percent) ride on sidewalks and against
traffic, which often is against the law. They either may not be aware of the law, or there may
be no safe on-street bicycle lanes. Urban and suburban riders use bicycle lanes more frequently,
likely due to their availability in more developed communities. Only 48 percent of bicyclists
are satisfied with how their communities are designed for bicycling safely, according to the
survey. The good news is that a concerted effort to reduce bicycle crashes seems to have had
some effect; between 2002 and 2003, bicyclist injuries declined by 8.3 percent.
Current State of Walking
Who walks in America today, where, and for what purposes? Walking obviously differs
from bicycling in that almost everyone walks at some point during the day and it requires no
equipment. Some demographic data are not available for pedestrians because walking typically
is regarded as a universal activity. People do not self-identify as a “pedestrian” as many do as
a “bicyclist.” For this discussion, walking is classified as “[a]ny outdoor walking, jogging, or
running that lasts at least five minutes or more.”42
A National Highway Traffic Safety Administration survey showed that 72 percent of people
age 16 and older walked at least weekly during the summer months. Both males and females
said they made about 15 walking trips per month. Of note is that 20 percent of respondents
did not walk at all in the last month. Numbers were fairly consistent across age groups, with
slightly higher percentages for 16- to 20-year-olds and those over age 65. Most walking trips
started at a residence, and only 8 percent began at work or a transportation site. About half
the walking trips were for recreation or exercise, and running errands accounted for almost 40
percent. Just 5 percent stated they walked to work or school. The average walking trip was 1.3
miles, but half were less than one mile. Younger, older, high-frequency and low-income walkers
were least likely to have alternate forms of transportation.43
As with bicycling, safety is paramount to pedestrians who are exposed to the dangers of auto
traffic and often are disregarded in the transportation system. On the most recent day walking,
Older Americans: Bicycling and Walking
The United States faces the challenge of an aging population, many of whom are at
risk of losing options for mobility. These senior citizens need a new transportation
framework to help ensure they can make trips to the store or doctor when they no
longer can drive. Seniors are more likely to rely upon alternative transportation
such as walking or public transit. A recent survey conducted by AARP found that
40 percent of respondents were walking, bicycling or taking transit more often due
to higher gas prices, but 39 percent did not feel their neighborhood had adequate
sidewalks; dissatisfaction with crosswalk, transit and bicycle accommodations was
even higher. Mobility is a particular challenge for seniors in rural areas. Fewer
transportation options and greater dissatisfaction with a lack of sidewalks and other
factors seriously inhibit their mobility. The survey also found significant support
for complete streets policies among older Americans.44
National Conference of State Legislatures12 Encouraging Bicycling and Walking: The State Legislative Role
6 percent of pedestrians surveyed felt their safety was threatened while walking. Once again,
the crash statistics confirm their fear—4,654 pedestrians died in traffic crashes in 2007, and
about 70,000 were injured.45 Seventy percent of pedestrian deaths occurred in urban areas.
Pedestrians were most concerned about motorists—62 percent reported feeling threatened
by cars driving too close and too fast. Animals and crime also were significant concerns for
walkers. Of those surveyed, 28 percent felt unsafe due to uneven sidewalks or roadways, a
reminder of the importance of quality accommodations. Pedestrians make some personal
effort to be more visible to motorists—40 percent reported wearing light or reflective clothes.
Only 68 percent of pedestrians report-
ed that sidewalks or paths are available
where they walk. Seventy-three per-
cent are satisfied with walking facilities
in their neighborhood, but one-third
would like to see improvements to make
them more walking friendly. Sidewalks
were the most commonly requested
infrastructure improvement. As an ex-
ample of the need for proper accom-
modations, pedestrians who walked less
frequently were less likely to have access
to sidewalks and walking paths and de-
sired more of these amenities. As with
bicyclists, pedestrian injuries declined by 4.2 percent between 2002 and 2003.46 Since 1975,
pedestrian deaths have declined 51 percent, although this can be partially attributed to the
decreasing number of people walking.47
Federal Involvement in Bicycling and Walking Policy
During the past 20 years, the federal government has taken significant strides to put bicycling
and walking on more even terms with other transportation modes. In 1991, Congress passed
the Intermodal Surface Transportation Efficiency Act (ISTEA), which required all states to
have bicycle and pedestrian coordinators. Before 1991, federal funding was restrictive and
weak. States were not allowed to spend more than $4.5 million on a bicycle or pedestrian
project that was not part of a larger highway project. This rule was changed, however, and
federal spending for independent bicycle and pedestrian projects increased significantly, from
about $6 million in 1990 to $422 million in 2003.48 This does not account for transportation
projects such as highway construction, which may include bicycling and walking facilities.
In 2007, for example, all 50 states and the District of Columbia received $580 million total from
transportation enhancement funds, which provide half the federal funding for bicycle and pedes-
trian projects. The funds include 12 eligible activities; bike and pedestrian projects represent a
significant component of three of these activities, which account for 55 percent of transportation
enhancement spending. Although 10 percent of federal transportation funds are set aside for
each state for transportation enhancement, they often are the first target of spending cuts. State
planning certainty and consistency suffer because specified amounts may have to be returned.
National Conference of State LegislaturesEncouraging Bicycling and Walking: The State Legislative Role 13
3. Funding
Funding for most state bicycle and pedestrian projects comes from the federal government.
Federal funding for all transportation projects is established through transportation
reauthorization packages. With finite resources, many projects compete for funding both at the
federal and state levels, and long-term planning can be difficult due to uncertain funding levels
and shifting priorities. This uncertainty affects not only planning for bicycle and pedestrian
infrastructure projects, but also for education and safety activities. As with federal funding,
state pedestrian and bicycling projects compete for funding with major highway construction
projects.
Several states have created funding mechanisms or grant programs that specifically set aside
money for bicycle and pedestrian projects and programs. This chapter takes a closer look at
the origins of funding streams, where the money comes from, and the types of projects they
support.
Motor Fuel Tax Revenue for Bicycle and Pedestrian Projects
Many states do not allow motor fuel and vehicle registration taxes to be used for non-automobile
purposes, even when wording seems clear on allowable uses for gas tax revenues.
Colorado
The Colorado Constitution states,
“Proceeds from the imposition of
any excise tax on gasoline … shall,
except for costs of administration,
be used exclusively for the con-
struction, maintenance, and su-
pervision of the public highways of
this state.” In practice, however, it
is not quite that simple. Colorado
does allow motor fuel tax revenue
to be used for bicycle and pedestri-
an projects within the right-of-way
of an existing highway project.
Washington
Washington can spend gas tax revenues on bicycle and pedestrian projects when it can be
construed as increasing safety and is part of a comprehensive trail plan. The 2005 Washington
Legislature increased the state’s role in pedestrian and bicycle safety by adopting SB 6091,
National Conference of State Legislatures 1314 Encouraging Bicycling and Walking: The State Legislative Role
which created new grant programs to support pedestrian and bicycle safety projects such as Safe
Routes to School, transit, and bicycle and pedestrian paths. For the 2007-2009 biennium,
$11 million in state funds is available for this program, and $74 million was appropriated over
16 years starting in 2005.
This Washington initiative seeks to reduce the number of pedestrian and bicycle injuries and
fatalities in the state. The program focuses on engineering corrections, education programs
and enforcement strategies. Applicants are chosen based on a few criteria, including the current
conditions of the site and data on traffic levels and bicycle and pedestrian accidents. Officials
then determine if an engineering solution is sufficient, if it meets state design standards from
one of the approved bicycle/pedestrian manuals, and whether the locality has a long-term plan
and is ready to implement and maintain the improvements. Washington law also establishes
a minimum funding amount for bicycle and pedestrian projects from the fuel tax fund. A
municipality or county must expend at least 0.42 percent of the received funds from the motor
vehicle fund, and the state Department of Transportation must spend at least 0.30 percent (see
Appendix A).
Other states—California and Michigan, for example—dedicate a certain amount of gas tax
revenues for bike and pedestrian projects.
California
California statutory language specifically targets the functional needs of bicycle commuters
and establishes a bicycle transportation system. Funding for many California bike projects
is provided by the California Bicycle Transportation Account, which comes from the Motor
Vehicle Fuel License Tax and Highway Users Tax Account. Funding recently was increased to
$7.2 million per year; a 10 percent local match is required. Only cities and counties can apply,
but matching funds can come from any entity, including a nonprofit; these funds can exceed
the 10 percent matching requirement. To apply for Bicycle Transportation Account funds, a
city or county must adopt a Bicycle Transportation Plan (discussed in Chapter 4).
Michigan
Michigan law requires that a minimum amount of motor fuel and vehicle registration funds be
spent on non-motorized infrastructure. Michigan law states, “…of the funds allocated from
the Michigan transportation fund to the state trunk line fund and to the counties, cities, and
villages, a reasonable amount, but not less than one percent of those funds shall be expended
for construction or improvement of non-motorized transportation services and facilities.”
This 1 percent minimum can be spread over 10 years so that small communities can amass the
amount necessary to fund a project that it could not afford in a one-year period. In 2006, due
to deterioration of many sidewalks in the state, the law was amended to allow expenditures to
build sidewalks.
Dedicated Minimum
In addition to Michigan and Washington, a few states established a minimum amount for
bicycle funding as part of the transportation funding budget.
National Conference of State LegislaturesEncouraging Bicycling and Walking: The State Legislative Role 15
Oregon
Since 1971, Oregon’s “Bike
Bill” has required that the state,
a county or a city must spend
at least 1 percent of money
received from the state highway
fund on bike facilities and
sidewalks that are within a road’s
right-of-way. Exceptions to the
1 percent requirement exist for
very small communities or if
there are excessive cost or safety
reasons. The law is especially
strong because it requires
all state government entities
to spend the 1 percent minimum on bike infrastructure. Oregon’s legislation is the first to
establish a “complete streets” approach to planning and building roads to accommodate all
users, such as bicyclists, pedestrians, the handicapped and senior citizens (see Chapter 4).
Hawaii
Hawaii recently designated expenditure of a 2 percent minimum of eligible federal funds for
multi-use paths and bikeways. For fiscal year 2007, the state exceeded the minimum; 4.7
percent of eligible federal funds were spent on bicycle projects. Such minimums vary from state
to state. Hawaii requires only that the state meet the minimum, while Michigan and Oregon
require all localities involved in road-building to abide by the minimum.
User Fees
User fees—funds collected from the groups that most benefit from a public service—often
are a popular funding option. Few state-level examples of user fees are available that involve
bicyclists and pedestrians.
Wisconsin
Wisconsin’s State Trails Pass is required for bicyclists and other users of 584 miles of designated
state trails and paths. Pedestrians are exempt from the fee, which is set at $20 for an annual pass
and $4 for a day pass. Although some funds go to local entities that operate the trails, remaining
funds—usually about $1 million—are deposited in the general fund and not earmarked for
trails. Localities have the discretion to require a trail fee, based on factors such as availability
of other recreational activities and whether it is economically feasible for community members
to purchase the pass. A voluntary on-line survey of trail pass users in 2008 indicated that 68
percent of the 2,824 respondents said they bicycle some of the time on the state trail system;
10 percent of respondents used state trails to commute to work.
Texas
The Texas sporting goods tax—the only one in the nation—funds recreation-related programs.
It could serve as a model for bicycle-specific projects. The sporting goods sales tax, implemented
in 1994, is a dedicated source of revenue primarily for the Texas state parks system. The .05
percent tax is attached to “…any item of personal property designed and sold for use in a sport
or sporting activity, excluding apparel and footwear except that which is suitable only for use in
National Conference of State LegislaturesYou can also read