Stepping stones towards sustainable agriculture in China
←
→
Page content transcription
If your browser does not render page correctly, please read the page content below
Stepping stones
towards sustainable
agriculture in China
An overview of challenges, policies
and responses
Andreas Wilkes and Lanying Zhang

 Country Report                    Food and agriculture

                                   Keywords:
 March 2016                        China, agriculture, agricultural
                                   policies, sustainability, food systems
About the authors
Andreas Wilkes, Director, Values for development Ltd
(a.wilkes@valuesfd.com)
Lanying Zhang, Executive Deputy Dean, Institute of Rural
Reconstruction, Southwest University, Chongqing, China
(Lzhang2@hotmail.com)

Produced by IIED’s Natural Resources
Group
The aim of the Natural Resources Group is to build
partnerships, capacity and wise decision-making for fair and
sustainable use of natural resources. Our priority in pursuing
this purpose is on local control and management of natural
resources and other ecosystems.

Acknowledgements
The authors thank Seth Cook and Barbara Adolph of IIED
for comments on drafts of this report, and participants in
the workshop on Sustainable Agricultural Development and
Cooperation held in Beijing on 20th March 2015.

Published by IIED, March 2016
Wilkes, A and Zhang, L (2016) Stepping stones towards
sustainable agriculture in China: an overview of challenges,
policies and responses. IIED, London.
http://pubs.iied.org/14662IIED
ISBN: 978-1-78431-325-8

International Institute for Environment and Development
80-86 Gray’s Inn Road, London WC1X 8NH, UK
Tel: +44 (0)20 3463 7399
Fax: +44 (0)20 3514 9055
email: info@iied.org
www.iied.org
  @iied
  www.facebook.com/theIIED
Download more publications at www.iied.org/pubs
country report

In only a few decades, agriculture in China has
evolved from a diverse “agriculture without waste”
to one involving specialised, high-external input,
resource-intensive, commercially-oriented models.
This report charts this evolution, with a focus on
sustainability – economic, environmental and
social. It asks how China’s modern development
is affecting sustainability in farming and the rural
environment, and looks in detail at the influence
of policies and measures to transform agricultural
production systems in more sustainable ways.
The report concludes by considering some of the
challenges and opportunities that could shape
sustainable agriculture in China in the future.

Contents
Acronyms and abbreviations                           4   4 The policy framework for sustainable
                                                          agriculture                                       33
Summary5
                                                          4.1 Key elements of China’s national agricultural
                                                              policy34
1 Background and introduction                        6
                                                          4.2 Policies to address key sustainability
1.1 What do we mean by ‘sustainable agriculture’?   7
                                                              challenges38
1.2 An agriculture of forty centuries               7
                                                          4.3 Policy support for sustainable agriculture   43
1.3 Recent transformations                          8
                                                          5 Conclusions: the many stepping stones to
2 Diversity and change in China’s agriculture
                                                          agricultural sustainability                       49
today13
                                                          5.1 A unique approach to sustainable agriculture 50
2.1   Agricultural patterns in China’s regions      14
                                                          5.2 An increasingly supportive policy environment 50
2.2   Diversified farming systems                   18
                                                          5.3 Clearer, more secure and longer term land
2.3   A variety of farm enterprises                 19
                                                              tenure                                        51
2.4   Changing marketing systems                    21
                                                          5.4 Scaled up and increasingly integrated supply
3 Agricultural sustainability issues                23       chains52
                                                          5.5 Increasingly market-led development           52
3.1 Resource and environmental challenges           24
3.2 Socio-economic and institutional challenges     29

                                                                                                   www.iied.org 3
Stepping stones towards sustainable agriculture in China Acronyms and abbreviations CCP Chinese Communist Party CDFA China Food and Drug Administration CNY Chinese Yuan CSA Community Supported Agriculture DDT dichlorodiphenyltrichloroethane GDP gross domestic product GVAO gross value of agricultural output ha hectare HCH hexachlorocyclohexane kg kilograms kW kilowatt mWh megawatt hours N nitrogen NGO non-governmental organisation p.a. per annum (per year) R&D research and development STFR Soil Testing and Fertiliser Programme WUA water user association 4 www.iied.org
IIED COUNTRY REPORT

Summary
Farming in China has seen dramatic changes in the           These challenges to sustainability are well-recognised in
last few decades. The traditional, highly diverse,          China, and many government policies and programmes
integrated and resource-recycling approach which            are being implemented to address them. For example,
historically has provided food for almost a fifth of        the recently issued National Plan for Sustainable
mankind, and employment for more than 200 million           Development of Agriculture (2015–2030) will provide
farming households, is rapidly being replaced by            the overarching framework for government policies
specialised, high-external input, resource-intensive, and   in the years to come. Specific challenges are being
commercially-oriented models. This report explores          tackled through a variety of policies, For example,
what sustainable agriculture looks like in this context,    institutional mechanisms have been set up to avoid
and outlines the emerging policy and market-based           further net loss of arable land. Soil nutrient testing and
opportunities for its expansion.                            fertiliser formulation, water-saving irrigation technologies
                                                            and livestock waste treatment measures are all being
The report first sets the scene through an overview of
                                                            promoted to tackle pollution. The government is also
the historical evolution of Chinese agriculture, focusing
                                                            expanding specific forms of sustainable agriculture,
on the major changes since the economic reforms
                                                            including ecological and circular agriculture models,
of the 1980s. It describes the key drivers of growth
                                                            and organic agriculture.
at national and regional level, and the diversity of
cropping and livestock systems across the country. In       The report concludes by highlighting some key issues
describing recent reforms to rural land tenure systems,     that will affect the future course of efforts to pursue
the emergence of large-scale agricultural enterprises,      agricultural sustainability in the coming years. While
and the transformation of supply chains and marketing       the policy environment for sustainable agriculture has
systems, it provides important context for understanding    become increasingly supportive, the development and
both the institutional environment for smallholder          implementation of government policies and measures
production today, and the focus of government policies      can be strengthened by information feedbacks on the
in the sector.                                              effects of policy implementation and by giving greater
                                                            voice to farmers in decision-making processes and
All these changes, along with broader transformations
                                                            research and extension. Ongoing land tenure reforms,
such as large scale rural-urban migration, are driving
                                                            development of the rural social security system and
the environmental, social and institutional challenges
                                                            reforms to urban citizenship rights will have major
facing China’s agriculture sector today. Urban expansion
                                                            impacts on farmers’ livelihood options, the values they
has been a major driver of the loss of arable land, with
                                                            attach to land, and their investment decisions. Thus, the
the quality of remaining arable land also a concern.
                                                            outcomes for farmers of future changes in the agri-food
Low fertility and other factors are limiting the potential
                                                            sector will not only depend on specific agricultural
for yield increases to meet growing food demand.
                                                            policies. Within the agriculture sector, the diverse
Agriculture is the largest user of water, but water use
                                                            impacts of policies to promote large-scale production
efficiency is low, and climate change may increase
                                                            and supply-chain integration deserve greater attention.
the scarcity of water resources. Both land and water
                                                            China’s food system will continue to undergo rapid
are affected by pollution. Excessive and inappropriate
                                                            change. The opportunities for farmers and companies to
use of fertiliser and livestock waste are two leading
                                                            engage in, innovate and promote sustainable agricultural
causes of water pollution. Rural industry and mining
                                                            practices will depend on the collaborative relationships
have also led to heavy metal contamination of soils,
                                                            that they are able to build with each other and with
affecting food safety. Large-scale rural-urban migration
                                                            government agencies.
is having major impacts on agricultural labour supply,
affecting farming families’ ability to maintain sustainable
practices such as manuring, crop residue recycling and
the reuse of biogas residues. It is also driving efforts to
aggregate fragmented land holdings into larger-scale
agricultural operations.

                                                                                                         www.iied.org   5
Stepping stones towards sustainable agriculture in China Background and introduction Endowed with a diversity of ecosystems, geography has profoundly influenced the historical development of agriculture in China. This chapter identifies what ‘sustainable agriculture’ means in China’s diverse context, before reviewing the diversity of its farming systems in both time and space. It also examines the factors behind recent major productivity increases. 1 6 www.iied.org
IIED COUNTRY REPORT

China is a huge country encompassing a diversity of                                more on environmental aspects, some stressing the
agro-ecosystems and a range of agricultural production                             need to ensure food security, and others emphasising
systems managed by more than 200 million households.                               aspects of social justice or the need to provide
Together they provide agricultural products to meet                                economic opportunities for rural people. Identifying
the needs of almost one-fifth of mankind. Agriculture                              ‘sustainable agriculture’ is especially difficult in China’s
fulfils numerous key functions – the provision of                                  diverse context (see also Section 5.1). This report
food and fibre, as well as environmental services                                  takes a practical approach, looking at practices and
and employment for hundreds of millions of people.                                 policies to address the various shortcomings and
Traditional farming practices emphasised maintenance                               adverse impacts of the types of conventional agriculture
of soil fertility through recycling of on-farm resources                           that have become common throughout China. Thus,
and efficient resource use in a context of land scarcity.                          it considers sustainable agriculture as involving a
In recent decades, conventional forms of agriculture                               continuum of practices, from measures to address
that rely largely on high external inputs have become                              particular challenges within otherwise conventional
dominant. The result has been the inefficient use                                  systems to more holistic approaches or models that
of scarce resources (e.g. water, energy, nutrients)                                seek to balance long-term economic, environmental and
and the emission of pollutants into the environment.                               social objectives.
These challenges are now the focus of national
agricultural policy.
                                                                                   1.2 An agriculture of forty
                                                                                   centuries
This report charts the historical evolution of agriculture
in China from an ‘agriculture without waste’, with minimal
reliance on inputs imported from outside the farm,1 to
                                                                                   China’s 135 million hectares (ha) of arable land account
how it is practised today. Its focus is on sustainability
                                                                                   for just 14% of the country’s total land area, and less
– economic, environmental and social. It asks how
                                                                                   than 10% of global arable land.5 Endowed with a
China’s modern development is affecting sustainability
                                                                                   diverse variety of ecosystems, 66% of China’s land
in farming and the rural environment, and looks in detail
                                                                                   mass is mountainous or hilly, while the remaining 34%
at the influence of policies and measures to transform
                                                                                   comprises relatively low-lying plains. About half of the
agricultural production systems in more sustainable
                                                                                   total land area is arid or semi-arid.
ways. The report concludes by considering some of
the challenges and opportunities that could shape                                  China’s traditional farming practices have evolved over
sustainable agriculture in China in the future.                                    a history which stretches back at least 4,000 years
                                                                                   to when agriculture originated in the Yellow River and
The report is primarily based on the authors’ experience
                                                                                   Yangtze River basins. Prior to the 14th century, many
combined with a review of the academic literature and
                                                                                   technologies were developed, such as ploughing
policy documents, and supplemented by interviews with
                                                                                   and irrigation. However, the emergence of traditional
officials, farmers and non-governmental organisations
                                                                                   farming as it is now understood was largely a response
(NGOs). It also draws on a workshop held in Beijing in
                                                                                   to rapid population growth between the 14th and
March 2015 at which Chinese researchers and other
                                                                                   20th centuries. By the 1950s there were 8-10 times
stakeholders in sustainable agriculture shared and
                                                                                   more people (ca. 540 million people) than in the late
debated their experiences.2
                                                                                   14th century.6 To feed this growing population from

1.1 What do we mean by
                                                                                   the limited area of arable land, small-scale, labour-
                                                                                   intensive farming has been essential, as has the use of

‘sustainable agriculture’?                                                         labour and technological advances to maximise land
                                                                                   productivity for both subsistence and trade purposes.
                                                                                   Between the 14th and early-20th centuries, the yield
Treated holistically, sustainable agriculture should be
                                                                                   per unit area of the major grain crops almost doubled,
economically viable, environmentally sustainable and
                                                                                   due to the introduction of new crops and varieties,
socially just.3 Yet even this concept of sustainability
                                                                                   farm implements, irrigation, and changes in cropping
is contested.4 Different actors emphasise different
                                                                                   systems.7 One of the key features of intensive farming
aspects of ‘sustainable agriculture’, with some focusing

1
  King, F. 1911. Farmers of Forty Centuries, or Permanent Agriculture in China, Korea and Japan. Rodale Press, Emmaus, Pennsylvania.
2
  Cook, S. and Buckley, L. (eds) 2015. Multiple Pathways: Case Studies of Sustainable Agriculture in China . IIED, London.
3
  FAO. 2013. Sustainable Food and Agriculture: Vision, Principles and Approaches. FAO, Rome.
4
  Pretty, J. 1998. Supportive Policies and Practice for Scaling Up Sustainable Agriculture. In: Roling, N., and Wagemakers, M. (eds). Facilitating Sustainable
Agriculture: Participatory Learning and Adaptive Management in Times of Environmental Uncertainty. Cambridge University Press, Cambridge.
5
  People.cn, 24 January 2014. Ministry of Agriculture: China’s actual arable land area has not increased, but there is potential for increased grain yield. See
http://politics.people.com.cn/n/2014/0124/c70731-24221990.html (in Chinese); FAOSTAT Statistics Database http://faostat3.fao.org/.
6
  Perkins, D. 1969. Agricultural Development in China, 1368–1968. Aldine Publishing Company, Chicago.
7
  Perkins, D. 1969. Agricultural Development in China, 1368–1968. Aldine Publishing Company, Chicago.

                                                                                                                                                www.iied.org      7
Stepping stones towards sustainable agriculture in China
in this period was the rapid expansion of multiple farm.8 At that time, China’s traditional agriculture was
cropping (Table 1). Cropping systems based on three already among the most advanced and productive
harvests in two years or four harvests in three years agricultural systems in the world.
became common in the Yellow River basin. In the
Yangtze River basin, two harvests per year became the
dominant practice. Double cropping (i.e. two harvests
1.3 Recent transformations
per year) of rice spread from southern to central Prior to the Communist revolution in the late 1940s,
China, and triple cropping of rice was practised in the about one-third of farming families owned no land and
Pearl River and Min River areas (see Section 2.2). were instead tenants. Rent was paid in grain, and with
Complex and diversified farming practices prompted low profitability in the farming sector, indebtedness
tighter temporal and spatial arrangements in field was common. Living conditions in this war-ravaged
cultivation, and promoted the development of cultivation, country varied considerably across regions and
irrigation, fertilisation and pest control techniques. socio-economic strata.9 Transformation of the social
Many farming techniques were developed or improved relations and means of production in agriculture was
between the 14th and 20th centuries – such as wheat a key component of the Chinese Communist Party’s
transplantation, deep ploughing, use of crop residues as strategy for capital accumulation and industrialisation.
soil amendments, and manure application based on the The transformation of the countryside began in the
growth stage of seedlings – and continue to be used late 1940s and early 1950s with land reform and the
even today. expropriation of land from landlords and richer farmers.
During this period about 43% of the total arable land
Intensive farming coupled with soil fertility management
area was redistributed.10 Farmers were encouraged to
became the essence of China’s traditional agriculture.
form ‘mutual aid teams’, which were later followed by
Intensive use of organic fertilisers was key to soil
the formation of cooperatives of about 160 households
fertility management, including the use of human and
each.11 Alongside these changes in production
animal excreta as manure, the use of legumes as green
institutions, markets were replaced with a planned
manures, recycling of crop residues, composting, and
economy, and compulsory procurement quotas at
application of river mud. In his 1910 book Farmers
administratively-set prices were introduced for grain and
of Forty Centuries: Permanent Agriculture in China,
more than 200 other products. Private production and
Korea and Japan, the American agronomist F.H. King
marketing of vegetables and other ‘minor’ items were
introduced many ingenious examples of traditional
severely restricted.12 While early Communist Party and
Chinese agriculture to the world, and highlighted that
government plans had proposed a gradual transition to
the key to long-term maintenance of soil fertility was
more ‘advanced cooperative’ institutions, Mao Zedong
China’s adoption of ‘an agriculture without waste’, with
supported a more rapid transition, which in the late
minimal reliance on inputs imported from outside the
Table 1. Historical evolution of cropping intensity in China
Period Han Tang Song 19th 1920s-30s Late 20th
Dynasty Dynasty Dynasty century century
(206 BCE– (618–906 (960–1279
220 BCE) CE) CE)
Cropping 0.6 0.8 1.0 1.4 1.3 1.6
index
Note: The cropping index is the ratio of the total sown area to the total area of arable land, a measure of the number of times crops are planted in the same field
in a year. BCE: before the common era; CE: common era.
Source: Zhang, S and Xu Z (2009) Cropping system reform and its impact on the development of agricultural technology, Crops (1):1–3 [张世煌,徐志刚. 2009
年. 耕作制度改革及其对农业技术发展的影响. 作物杂志 (1): 1–3]
8
King, F. 1911. Farmers of Forty Centuries, or Permanent Agriculture in China, Korea and Japan. Rodale Press, Emmaus, Pennsylvania.
9
Martin, M. 1991. Rural living conditions in pre-liberation China: A survey of three recent studies. Journal of Peasant Studies 19(1) 122–137.
10
Perkins, D. 1969. Agricultural Development in China, 1368–1968. Aldine Publishing Company, Chicago.
11
For descriptions of the change in agricultural institutions in this period, see e.g. Selden, M. and Lippit, V. (eds). 1982. The Transition to Socialism in China .
Croom Helm, London.
12
Nolan, P. 1988. The Political Economy of Collective Farms. Polity Press, Cambridge.
8 www.iied.orgIIED COUNTRY REPORT
1950s led to the amalgamation of cooperatives into In the late 1970s, peasants and local officials
larger ‘rural people’s communes’, each with about 5,000 experimented with new institutional arrangements to
households.13 As is now well recognised, the communes encourage greater agricultural production. In the early
were unable to provide sufficient incentives to farmers to 1980s, these innovations were adopted nationwide
increase production, and the top-down planning system and became known as the Household Responsibility
led to the inefficient allocation of resources. These System, which is the basis for contemporary arable land
factors played a key role in the famine of 1959–1961 in tenure in China (Box 1).20 Agricultural product markets
which some 30 million people died.14 In some parts of were also gradually liberalised.
the country, per capita consumption of many foods in
Since the early 1980s, per capita food supply in rural
the 1970s was lower than in the 1950s.15
and urban areas has increased dramatically.21 Most
The transformation of the means of production was of this increase has been met by growth in domestic
another focus of Party and government efforts. In the production of the main crop and livestock products
1950s, the irrigated area doubled, and more than (Figures 1a and b). In part, this has been enabled by
5 million new wells were sunk in semi-arid areas major changes in the structure of crop production
of northern China.16 The famine of 1959–1961 in (Figure 1c). In addition, growing productivity has
particular saw a shift in government policy towards the been a key source of increased domestic supply.
promotion of ‘modern’ agricultural technology. In the Total sown area has increased by about 0.7% a year
first half of the 1960s there was a rapid expansion in since 1990, while output of the major agricultural
rural electrification, and the use of farm implements, crops has increased by more than 4% a year over
motors, power pumps and other machinery. Crop the same period.22 Average yields for grain (Table 2)
varietal improvements and chemical fertiliser were key grew by 2–3% every year between 1980 and 2010,
technologies promoted in this period. Between 1957 and the cropping index rose from about 1.3 in 1952
and 1966, China’s imports of chemical fertiliser more to about 1.6 in 1997.23 Livestock product supply has
than doubled, and domestic production of chemical also increased markedly, particularly for poultry, dairy
fertiliser increased by 7–8 times.17 Dwarf varieties products and pork, with output growing faster than
of rice and wheat introduced in the early 1960s had animal populations. Overall, since the 1980s, China
replaced most other varieties by the late 1970s.18 has maintained self-sufficiency in the supply of most
Despite the massive human, social and economic major food crops and livestock products at more than
costs and inefficiencies of the collective system, some 90%.24 However, there has been a significant increase
have argued that it enabled significant investment in in recent years in imports of maize and soybeans for use
rural industrialisation, which laid the basis for rapid as animal feed.
agricultural and industrial growth after the economic
reforms of the 1980s.19
13
On the politics of rural transformation, see Selden, M. 1982. Cooperation and conflict: Cooperative and collective formation in China’s countryside. In: Selden,
M. and Lippit, V. (eds). The Transition to Socialism in China . Croom Helm, London.
14
Lin, J. 1990. Collectivization and China’s agricultural crisis in 1959–1961. Journal of Political Economy 98(6) 1228–1252.
15
Nolan, P. 1988. The Political Economy of Collective Farms. Polity Press, Cambridge.
16
Perkins, D. 1969. Agricultural Development in China, 1368–1968. Aldine Publishing Company, Chicago.
17
Perkins, D. 1969. Agricultural Development in China, 1368–1968. Aldine Publishing Company, Chicago; Chao, K. 1975. The production and application of
chemical fertilisers in China. China Quarterly 64 712–729; Kueh, Y. 1984. Fertiliser supplies and foodgrain production in China, 1952–1982. Food Policy 9(3)
219–231.
18
Jin, S. et al. 2002. The creation and spread of technology and total factor productivity in China’s agriculture. American Journal of Agricultural Economics 84(4)
916–930.
19
Bramall, C. 1993. In Praise of Maoist Economic Planning: Living standards and economic development in Sichuan since 1931. Clarendon Press, Oxford.
20
Kelliher, D. 1992. Peasant Power in China: The Era of Rural Reform, 1979–1989. Yale University Press, New Haven; Nolan, P. 1988. The Political Economy of
Collective Farms. Polity Press, Cambridge.
21
For an overview of trends in urban and rural food consumption, see Cao, L. et al. 2013. Recent food consumption trends in China and trade implications
to 2020. Australasian Agribusiness Review 21 15–44. For overviews of food production, see Huang, J. and Rozelle, S. 2009. Agricultural Development and
Nutrition: the Policies behind China’s Success. World Food Programme, Rome; Fan, M. et al. (2011) Improving crop productivity and resource use efficiency to
ensure food security and environmental quality in China. Journal of Experimental Botany 63(1) 13.
22
National Bureau of Statistics National Data Database (http://data.stats.gov.cn); Ministry of Agriculture Cropping Management Section, China Cropping Sector
Information Website http://202.127.42.157/nongqing.aspx (in Chinese)
23
Duan, H. 2000 Key issues of cropping system in Southern China and its situational study. Tillage and Cultivation 6 1–4. [段红平, 2000年.中国南方耕作制度面
临的主要问题与研究现状.耕作与栽培. 2000(6) 1–4].
24
Norse, D., Lu, Y. and Huang, J. 2014. China’s food security: Is it a national, regional or global issue? In: Brown, K. (ed.). China and the EU in Context . Palgrave,
London.
www.iied.org 9Stepping stones towards sustainable agriculture in China
Box 1. Developments in land tenure systems since
the early 1980s
When the communes were disbanded in the late average 0.6 ha)28 comprised of numerous individual
1970s and early 1980s, their collective ownership small plots scattered around the village. The small size
and management of agricultural land was replaced of farming operations and land fragmentation have
by the Household Responsibility System. Under this often been seen as major constraints to economically
system the village collective still owns the farmland, efficient and competitive agricultural production.
but individual households receive contracts to cultivate They are also perceived to be significant obstacles
specific plots of land and pay agricultural taxes.25 This to the adoption of improved agricultural practices,
system enabled farmers to manage production on their such as resource cycling and reducing environmental
own initiative, but in the early years, farmers were still externalities.29
subject to production contracts, and markets were still
heavily regulated. The introduction of the Household Underlying these reforms is a land tenure system
Responsibility System, and subsequent changes to which distinguishes between ownership, contract and
procurement and marketing policies, were crucial in use rights. Land is owned by the village collective,30
encouraging farmers to increase their output.26 Initially, while farmers retain contract and use rights. Contract
contracts were for 15 years, but were extended to 30 rights initially included obligations to pay agricultural
years in the 1990s.27 taxes, but these were abolished in 2006. In the 1990s
– a period coinciding with large-scale rural-urban
In the 1980s, when contract rights were issued to migration – a market for agricultural land rental began
individual households, the location and size of the to develop. This involves a household transferring
land to which they were given use rights depended use rights over the land (e.g. to a cooperative or
on the quality of land plots and the number of agribusiness), while the household retains the contract
household members and/or able bodied labourers rights, which cannot be freely transferred. A legal
in each household. This, and subsequent division of framework for land use rights transfers began to be
assets between generations, led in many areas to the put in place from 2001 onwards.31 Recent years have
excessive fragmentation of land plots, with households seen explicit and strong government support for rural
having contract rights over very small areas (on land-use rights markets.
What drove these important productivity increases? and 2010, and today China has one of the largest public
Major drivers included reforms in land tenure and market agricultural R&D budgets of all developing countries.33
liberalisation in the early to mid-1980s. Since then, Innovation in crop varieties has been identified as a
technological change – particularly the development significant driver of productivity increase.34 Along with
of high-yielding grain varieties and associated high- modern crop varieties, the use of inorganic fertiliser
input production practices – has been the major driver has also increased significantly. The average per unit
of agricultural productivity growth.32 These drivers area application of fertiliser in China is now several
have been underpinned by agricultural research and times higher than in the USA.35 Application rates on
extension, improvements in agricultural infrastructure vegetables and fruits are particularly high,36 and the area
and the increased application of external inputs. on which they are grown has been expanding. Although
Investment in agricultural R&D tripled between 1990 increased fertiliser application was instrumental in
25
Ye, J. 2015. Land transfer and the pursuit of agricultural modernization in China. Journal of Agrarian Change 15(3) 314–337.
26
Agricultural taxes and levies were finally abolished in 2006, which also improved production incentives.
27
Ye, J. 2015. Land transfer and the pursuit of agricultural modernization in China. Journal of Agrarian Change 15(3) 314–337.
28
Huang, J., Wang, X. and Qiu, H. 2012. Small-Scale Farmers in China in the Face of Modernisation and Globalisation. IIED/HIVOS, London/The Hague.
29
Zuo, Y. et al. 2015. China’s on-going debates over large-scale farming: What are the pros and cons? China Agricultural Economic Review 7(3) 338–343.
30
While in law land is owned by the village collective, the state has the right to make compulsory purchase of land under certain circumstances, as described in
Qian, Z. 2015. Land acquisition compensation in post-reform China: Evolution, structure and challenges in Hangzhou. Land Use Policy (46) 250–257.
31
Ye, J. 2015. Land transfer and the pursuit of agricultural modernization in China. Journal of Agrarian Change 15(3) 314–337.
32
Huang, J. and Rozelle, S. 1996. Technological change: rediscovering the engine of productivity growth in China’s agricultural economy. Journal of
Development Economics (49) 337–369; Fan, S. 1991. Effects of technological change and institutional reform in production growth of Chinese Agriculture.
American Journal of Agricultural Economy 73(2) 266–275; Fan, S. and Pardey, P. 1997. Research productivity and output growth in Chinese agriculture.
Journal of Development Economics (53) 115–137.
33
Beintema, N. and Stads, G. 2010. Public agricultural R&D investments and capacities in developing countries. ASTI Background Note. IFPRI, Washington,
DC; Pardey, P. and Pingali, P. 2010. Reassessing international agricultural research for food and agriculture. Report prepared for the Global Conference on
Agricultural Research for Development (GCARD), Montpellier, France, 28–31 March 2010; Hu, R. et al. 2011. Privatization, public R&D policy, and private R&D
investment in China’s agriculture. Journal of Agricultural and Resource Economics 36(2) 416.
34
Jin, S. et al. 2002. The creation and spread of technology and total factor productivity in China’s agriculture. American Journal of Agricultural Economics
84(4) 916–930.
35
FAOSTAT Statistics Database (http://faostat3.fao.org/)
36
Zhang, W. et al. 2013. New technologies reduce greenhouse gas emissions from nitrogenous fertiliser in China. Proceedings of the National Academy of
Sciences 110(21) 8375–8380.
10 www.iied.orgIIED COUNTRY REPORT
Figure 1. Recent trends in China’s crop and livestock statistics
(a) Total output of main agricultural crops (b) Total output of livestock products
160 Milk
1500 140
Vegetables 120 Eggs
million tons
100
million tons
1000 Tubers Poultry
80
Oil crops 60 Pork
500 40
Fruit
20 Mutton
0 Cereals 0 Beef
19
19
20
20
20
20
19
20
20
19
19
9
9
10
0
0
9
9
9
10
02
06
5
0
5
0
4
8
0
(c) Area under different crop types (b) Total livestock and poultry population (1990–2010)
200 Fruit
150
Vegetables 8000 Sheep
Oil crops
million ha
6000 Cattle
million head
100 Cereals
4000 Pigs
50 2000 Poultry
0 0 1990
1993
1996
1999
2002
2005
2008
1990
1993
1996
1999
2002
2005
2008
2011
Source: Figures produced by the authors using data from FAOSTAT (http://faostat.fao.org)
Table 2. Annual growth rates (%) of China’s agricultural economy, 1970–2010
Pre-reform Reform period
1970–78 1979–84 1985–95 1996–00 2001–05 2006–10
Agricultural GDP 2.7 7.1 4.0 3.4 4.3 4.5
Output:
Grainsa 2.8 4.7 1.7 -0.7 1.1 2.5
Cotton -0.4 19.3 -0.3 -1.9 5.3 -0.9
Oil crops 2.1 14.9 4.4 5.6 0.8 2.7
Fruits 6.6 7.2 12.7 10.2 21.0 5.9
Meats (pork/beef/poultry) 4.4 9.1 8.8 6.5 4.9 2.3
Fishery 5.0 7.9 13.7 10.2 3.6 3.9
Planted area:
Vegetables 2.4 5.4 6.8 9.8 3.1 2.0
Orchards (fruits) 8.1 4.5 10.4 2.0 2.4 8.1
Note a : Chinese statistical reports of grains include cereals, tubers, soy and other beans.
Source: Huang, J, Yang, J and Rozelle, S (2010) China’s agriculture: drivers of change and implications for China and the rest of world. Agricultural Economics
41(s1) 47–55.
www.iied.org 11Stepping stones towards sustainable agriculture in China
increasing yields until the 1990s, its efficiency of use irrigation increased from 46% in 1980 to about 56% in
has greatly decreased, as fertiliser application rates 2011.38 Today irrigated land accounts for about 70% of
often exceed plant nutrient requirements. It is estimated the area sown to grain and 80% of grain production.39
that 30–50% of nitrogen fertiliser is now surplus to
In short, across large parts of the country, and in all
plant growth requirements,37 and fertiliser pollution
areas with significant agricultural output, high external-
of soil and water is a widely recognised problem. The
input agriculture has become the prevalent, conventional
use of other agricultural inputs has also increased
form of agriculture. The significant environmental
dramatically (Table 3). The expansion of irrigation
impacts of this are now widely recognised and are
infrastructure has made significant contributions to
discussed in Chapter 3.
agricultural growth. The proportion of arable land under
Table 3. The growth in agricultural inputs in China, 1952–2010
Types of 1952 1962 1970 1980 1990 2000 2010
agricultural
inputs
Irrigated area (million ha) 199.59 305.45 No data 448.88 474.03 538.2 603.48
Agricultural machinery in 0.184 7.57 21.65 147.46 287.08 525.74 927.80
use (million kW power)
Fertiliser produced (million 0.078 0.63 No data 8.84 25.90 53.82 55.62
tons)
Rural electricity use (million 0.05 1.61 9.57 32.08 84.45 242.13 663.23
mWh)
Pesticides produced No data No data No data No data 0.77a 1.28 1.76
(million tons)
Plastic sheeting produced No data No data No data No data 0.64a 1.34 2.17
(million tons)
Diesel used for agricultural No data No data No data No data No data 14.05 20.23
production (million tons)
Notes: a figure for 1991.
Sources: http://data.stats.gov.cn and National Statistical Bureau Rural Social and Economic Section (ed.). 2006. China Agricultural Statistical Data
Compilation, 1949–2004. China Statistics Press, Beijing. [国家统计局农村社会经济调查司编. 2006年.中国农业统计资料汇编,
1949–2004.中国统计出版社, 北京.]
37
Ju, X. et al. 2009. Reducing environmental risk by improving N management in intensive Chinese agricultural systems. Proceedings of the National Academy of
Sciences 106(9) 3041–3046.
38
World Bank Open Data (http://data.worldbank.org).
39
Wang, J. et al. 2012. China’s water-energy nexus: greenhouse gas emissions from groundwater use for agriculture. Environmental Research Letters 7(1) 014035.
12 www.iied.orgIIED COUNTRY REPORT
Diversity and change
in China’s agriculture
today
The reforms in land tenure and market liberalisation in the
1980s have seen China’s agricultural output grow steadily,
although with significant variation between regions. This
chapter reviews the trends in Chinese agriculture today. The
size of the country and its diverse agro-climatic conditions
2
make for a rich diversity of cropping systems. Modern supply
chains are emerging, and land tenure, the nature of farming
enterprises and marketing systems are all transforming in
response to the changing context.
www.iied.org 13Stepping stones towards sustainable agriculture in China
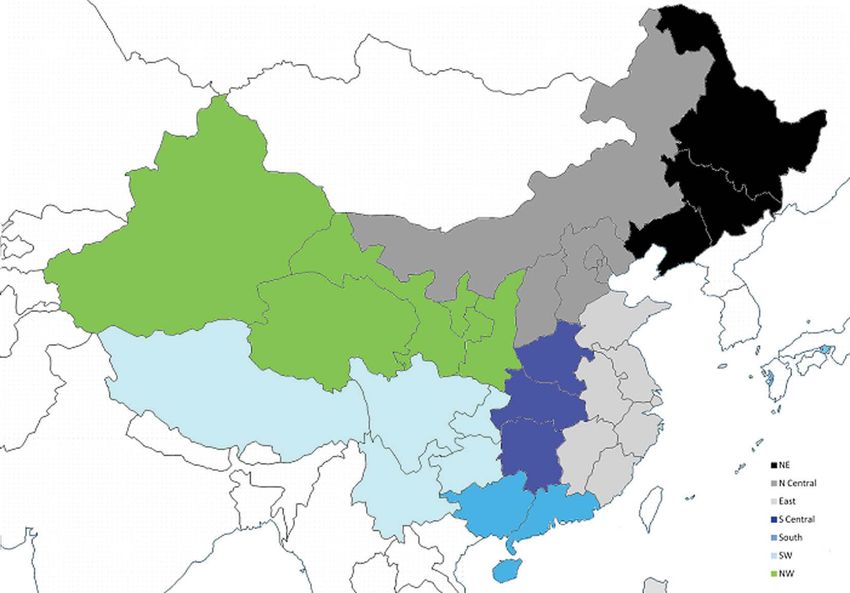
China’s agriculture continues to change. Increasing Hebei, Shanxi, Inner Mongolia and the cities of Beijing
specialisation in different regions is reflected in varying and Tianjin), the eastern region (i.e. Shanghai, Jiangsu,
growth rates of output of different types of agricultural Zhejiang, Anhui, Fujian, Jiangxi and Shandong), the
crops and in changes in cropping systems. New forms central south (i.e. Henan, Hubei and Hunan), the south
of agricultural operations are emerging, including (i.e. Guangdong, Guangxi and Hainan), the southwest
agribusinesses and cooperatives, and marketing (i.e. Chongqing, Sichuan, Guizhou, Yunnan and Tibet),
channels are changing. This chapter provides an and the northwest (i.e. Shaanxi, Gansu, Qinghai, Ningxia
overview of the diversity across the country and recent and Xinjiang).
trends in how agricultural production and marketing
Figure 3 shows the contribution of each region to
are done.
the total gross value of agricultural output (GVAO)
2.1 Agricultural patterns in
in 2010. Nearly two-thirds of GVAO is produced in
China’s eastern, south central and southern regions,
China’s regions
with the largest contribution from the eastern region.
The eastern region includes Shandong province (i.e.
Huang-Huai-Hai agricultural zone), which is by far the
China’s official agricultural zoning method40 identifies
biggest producer of agricultural output value of all the
a number of agricultural zones based on their natural
provinces. It also includes the lower reaches of the
conditions, crop suitability and levels of agricultural
Yangtze River (i.e. Jiangsu, Zhejiang, Anhui provinces),
productivity. However, data on agricultural inputs, crop
which is a major zone for double cropping (e.g. rice-
production and the agricultural economy are reported
wheat rotations) due to its beneficial climatic conditions.
according to administrative regions, which differ from
Together, the eastern, south central and southern
the agricultural zones. This section uses data from the
regions produce about half of China’s cereal crops,41 as
main administrative regions to illustrate the diversity
well as 60% of its vegetables. Inorganic fertiliser use is
of agricultural production across China. The regions
particularly high in these regions, with severe impacts
are (Figure 2): the northeast (i.e. Heilongjiang, Jilin
on the environment.42
and Liaoning provinces), the north central region (i.e.
Figure 2. China’s main agricultural regions defined according to administrative boundaries
40
National Agricultural Zoning Committee (1981) Comprehensive Agricultural Zonation in China. China Agricultural Press, Beijing [全国农业区划委员会, 1981
年.《中国综合农业区划》.中国农业出版社,北京].
41
These are defined in Chinese statistical reports as grains, tubers and legumes.
42
Ju, X. et al. 2009. Reducing environmental risk by improving N management in intensive Chinese agricultural systems. Proceedings of the National Academy
of Sciences 106(9) 3041–3046.
14 www.iied.orgIIED COUNTRY REPORT
Figure 3. Regional contribution to gross value of agricultural output, 2000–2010
35%
4.9%
30%
25%
8.4%
20%
15%
10.5% 7.3% 6.4%
5.8%
10%
12.3%
5%
0%
NE N Central East S Central South SW NW
Annual average (bars) and real growth rates of GVAO between 2000 and 2010 (figure above bars)*
*Nominal GVAO deflated by the agricultural product price index.
Source: Compiled by the authors from data obtained from data.stats.gov.cn
Annual average growth rates in GVAO between 2000 and 2010, mainly driven by growth in vegetables, fruit
and 2010 were highest in the northwest and northeast and other cash crops. For example, Shaanxi produces
regions. The northeast is characterised by intensive about 10% of the world’s apple output. Grapes in
rainfed agriculture, much of which is mechanised. Large Ningxia and wolfberry in Ningxia and Qinghai are
parts of the region have rich peatland soils that are high also rapidly growing cash-crop industries. In Xinjiang,
in organic matter. The region has some of the highest cotton production accounted for a considerable share
unit area yields in the country, and produces about of growth.
one-third of the national maize output. Agribusiness
Agriculture in north central China and parts of central
investment in grain and vegetable production and
south China (e.g. Henan) is largely practised on the
processing has been growing rapidly in recent years.
North China Plain. Multiple cropping involving crop
However, expansion of arable land into peatlands
rotations is common, with crops and rotations varying
and inappropriate cultivation methods have led to
according to factors such as the availability of irrigation
considerable soil erosion in the region.43
and labour. A large variety of crops may be involved
By contrast, the northwest is mostly arid or semi- in rotational cropping, such as wheat, maize, millet,
arid, with large areas of desert. In some parts of sorghum, barley, and cash crops such as cotton, soy
the northwest (e.g. the Yinchuan Plains in Ningxia bean, peanut, sesame or tobacco. Winter wheat is
Autonomous Region,44 oases in Xinjiang Autonomous usually followed by beans or millet, maize or yam; while
Region) agriculture is dependent on irrigation. spring crops are mainly millet, maize or sorghum. In
Elsewhere (e.g. the Loess Plateau zone), rainfed recent years, the area under one crop a year or two
agriculture is still the main form of production. In these crops a year has increased. This is partly because of
regions, single cropping is prevalent due to the seasonal the increase in the area of cash crops (e.g. cotton).
scarcity of water. In the Loess Plateau with its sandy The economic return from cotton is much higher than
soils, soil erosion has been a widespread issue for for many grain crops, but cotton has a long growth
decades.45 Although the northwest contributes only a period, so it cannot be followed by winter wheat. On the
small proportion of national GVAO, all provinces in that other hand, increased access to irrigation has enabled
region experienced high growth rates between 2000 many areas to grow two crops a year. Over-extraction
43
China Meteorological Bulletin 廉毅, 高枞亭,任红玲. 2001年. 20世纪90年代中国东北地区荒漠化的发展与区域气候变化.气象学报 59(6) 730–736].
44
Autonomous Regions are province-level administrative units with significant ethnic minority populations.
45
Zhao, G. et al. 2013. Soil erosion, conservation and eco-environment changes in the Loess Plateau of China. Land Degradation & Development 24(5)
499–510.
www.iied.org 15Stepping stones towards sustainable agriculture in China
of underground water resources has become a major 60% of oil crops were produced in east and south
issue in northern China.46 High levels of nitrogen central China. By contrast, vegetable, meat and aquatic
fertiliser application are also common in this region.47 product output has increased across all regions. This
mainly reflects strong domestic demand for these
A high proportion of the land area in southwest China
products from rural and urban consumers alike. Figure
is mountainous. In mountain areas, rainfed agriculture
5 illustrates regional differences in growth rates for the
involving mixed crop-livestock systems is common,
three major grain crops. Rice production has declined
but crop production in mountain areas is affected
in the southern, southwest and northwest regions, and
by environmental conditions (e.g. low temperatures
wheat production has declined in south and southwest
at higher elevations) and the frequent occurrence of
China. Much of this decrease is due to substitution by
natural disasters (e.g. drought, flooding). However,
48
maize or vegetables, which have seen rapid growth.
these mountain areas are also rich in biodiversity, and
The growth of maize production is mainly driven by the
some households and enterprises have been developing
increase in demand for livestock feed, with livestock
production of medicinal plants and other ‘green’
product output growing in all regions (Figure 6).50
products in recent years.
There have also been significant changes in livestock
The rate of growth in the output of different agricultural
production. While milk production has continued in
products has varied considerably between regions
its traditional heartland (north central China), it has
and provinces in recent years. In some provinces (e.g.
grown rapidly in other regions (Figure 6). Pork and
Zhejiang, Fujian), the total output of cereals and grain
poultry production have gradually moved towards
crops has decreased, while in others output has grown
the south and southeast. Livestock production has
rapidly. In part this reflects a process of increasing
become increasingly specialised, and large numbers
regional specialisation. For example, in 2007, 13 of the
of farmers have exited from the livestock industry over
country’s 31 province-level units produced about 75%
the years, due to a combination of economic and policy
of the total national grain output, and 9 of these 13
pressures.51 Pig rearing is a risky economic enterprise,
provinces supplied 96% of the grain surplus (excess to
with large swings in pork prices often making it
local consumption demand).49 In part, this also reflects
unprofitable.52 Farmers who have ceased raising pigs
the effects of rural-urban migration and urbanisation
have tended to be those more heavily engaged in off-
on agriculture in China’s more developed regions,
farm employment.53 The number of dairy farmers exiting
challenges that are discussed in more depth in Chapter
the industry after the 2008 melamine scandal also
3. Figure 4 shows the regional variations in annual
rose as policies enforcing biosafety inspections made
average growth rates of some of the main agricultural
market participation increasingly difficult.54 Government
products between 2000 and 2010.
policies have also promoted pig rearing in concentrated
While cereal crop output has decreased in south and areas and provided financial support to the development
southwest China, it has grown by between 1 and 3% of larger pig farms.55 Although smallholders still
a year in the other regions, except for northeast China account for the vast majority of farmers raising pigs and
where it has grown by more than 7% a year. Cotton chickens, larger specialised operations account for the
and oil crop output have also seen decreases in some majority of pork and poultry product output.56 Livestock
regions and increases in others, mainly reflecting trends production has become increasingly concentrated in
in specialisation. In 2010, about 45% of all cotton was peri-urban areas, and livestock waste management has
produced in the northwest (mainly Xinjiang), while become increasingly de-linked from crop cultivation.
46
Wang, J., Huang, J. and Rozelle, S. 2005. Evolution of tubewell ownership and production in the North China Plain. Australian Journal of Agricultural and
Resource Economics 49(2) 177–195.
47
Ju, X. et al. 2009. Reducing environmental risk by improving N management in intensive Chinese agricultural systems. Proceedings of the National Academy
of Sciences 106(9) 3041–3046.
48
Su, Y. et al. 2012. Coping with climate-induced water stresses through time and space in the mountains of Southwest China. Regional Environmental Change
12(4) 855–866.
49
National Development and Reform Commission. 2009. National Plan to Add 50 Billion Kilogrammes of Grain Production Capacity. National Development and
Reform Commission, Beijing [国家发展与改革委员会. 2009年. 全国新增1000亿斤粮食生产能力规划].
50
Gale, F., Hansen, J. and Jewison, M. 2015. China’s Growing Demand for Agricultural Imports. USDA Economic Information Bulletin 136. USDA Economic
Research Service, Washington DC.
51
Rae, A. and Zhang, X. 2009. China’s booming livestock industry: Household income, specialization, and exit. Agricultural Economics 40(6) 603–616; Jia, X. et
al. 2012. China’s milk scandal, government policy and production decisions of dairy farmers: The case of Greater Beijing. Food Policy 37(4) 390–400.
52
Gale, F., Marti, D. and Hu, D. 2012. China’s Volatile Pork Industry. Report LDP-M-211-01. USDA Economic Research Service. US Department of Agriculture,
Washington DC.
53
Jia, X. et al. 2014. Pig Production, Smallholders, and the Transformation of Value Chains in China. IIED Issue Paper. IIED, London.
54
Mo, D. et al. 2012. Checking into China’s cow hotels: Have policies following the milk scandal changed the structure of the dairy sector? Journal of Dairy
Science 95(5) 2282–2298.
55
Garnett, T. and Wilkes, A. 2014. Appetite for Change: Social, economic and environmental transformations in China’s food system. Food Climate Research
Network, Oxford.
56
Jia, X. et al. 2014. op. cit.
16 www.iied.orgIIED COUNTRY REPORT
Figure 4. Regional annual average growth rates of main agricultural products, 2000–2010
20%
NE
N Central
15% East
S Central
10% South
S
5% SW
0%
Cereal Cotton Oil crops Vegetables Meat Aquatic
-5%
-10%
Growth rate of output by weight (%)
Source: Compiled by the authors from data obtained from data.stats.gov.cn
Figure 5. Regional annual average growth rates of main crop products, 2000–2010
15%
NE
N Central
10% East
S Central
5% South
S
SW
0%
-5%
rice wheat maize
-10%
Growth rate of output by weight (%)
Source: Compiled by the authors from data obtained from data.stats.gov.cn
www.iied.org 17Stepping stones towards sustainable agriculture in China
Figure 6. Regional annual average growth rates of main animal products, 2000–2010
140% NE
120% N Central
East
100%
S Central
80% South
S
60%
SW
40%
20%
0%
pork other red meat milk eggs
-20%
Source: Compiled by the authors from data obtained from data.stats.gov.cn
2.2 Diversified farming Triple cropping in southern China mainly involves a
green manure–early rice–late rice rotation. The green
systems manure (often alfalfa) is helpful in improving the physical,
chemical and biological traits of soil and enhancing
Farming systems in China are characterised by its fertility. The rapeseed–early rice–late rice rotation
particular planting patterns and crop rotations. Planting is another traditional approach which yields both food
patterns can be roughly divided into three types: single crops and edible oil. Returning rapeseed leaves, flowers
cropping, double cropping and triple cropping.57 The and stalks to the soil enhances soil nutrients and soil
single cropping zone mainly covers the northeast and structure. Vegetables have also become common as the
northwest regions, as well as the hilly dryland areas of third crop in these rotation systems.
north and southwest China, where the growing season
Double cropping in southern China involves spring and
is relatively short. The double cropping zone refers
summer crops with fallowing in autumn and winter. In
to certain regions in north and southwest China, as
the southern Yangtze River basin, double cropping of
well as the Yangtze and Huai River basins. The triple
wheat and rice was the major practice in the past. Now
cropping zone covers the southwest basin, the mid and
the cultivation of two crops of (early and late) rice has
lower Yangtze River basin, as well as southeast and
become the norm, and in some areas triple cropping
southern China. Climate change has seen a gradual
is practised by the addition of barley, wheat, rapeseed
shift northwards of climatic belts and crop suitability
or green manure cultivation in the winter season. The
zones, particularly in the northern part of China.58
southwest region used to rely solely on single cropping,
Crop rotations are practised by farmers not only for
but now includes winter crops like wheat, rapeseed,
the variety and quantity of products obtained, but also
and broad beans. The southwest has also developed
for their effectiveness in balancing soil nutrients and
other double cropping practices such as rice-wheat,
improving soil fertility. Other benefits include reducing
rice-rapeseed, vegetable-rice, and rotational cropping
weeds, pests and diseases, thus reducing the need for
of cereals with beans or sweet potato. In recent years, a
chemical fertilisers, pesticides and herbicides.
triple cropping system has been adopted for cultivating
crops like wheat, corn, and sweet potato in dryland
57
Zuo, L. et al. .2014. Developing grain production policy in terms of multiple cropping systems in China. Land Use Policy (40) 140–146; Li W. (ed.). 2003.
Ecological Agriculture: Theory and practices of sustainable agriculture in China . Chemical Industry Publishing House [李文华(主编).2003年.生态农业:中国可
持续农业的理论与实践.化学工业出版社]; Qiu, J. et al. 2003. Mapping single-, double-, and triple-crop agriculture in China at 0.5°× 0.5° by combining county-
scale census data with a remote sensing-derived land cover map. Geocarto International 18(2) 3–13.
58
Ye, D., Jiang, Y. and Dong, W. 2003. The northward shift of climatic belts in China during the last 50 years and the corresponding seasonal responses.
Advances in Atmospheric Sciences 20(6) 959–967.
18 www.iied.orgIIED COUNTRY REPORT
areas. In north China, triple cropping of wheat, corn, had migrated to towns and cities further away, leaving
and sweet potato is practised in some areas. In Inner land available for cultivation by other households or
Mongolia, Shaanxi, and Gansu provinces, where double enterprises.62
cropping is not practical due to limited water availability
and low winter temperatures, inter-cropping of wheat Small rural households
and corn is practised. Cropping practices have changed
China’s contract households are mostly small farming
in many areas due to the incorporation of cash crops.
operations, with a small average farm size (ca. 0.6
For example, in the Yangtze River basin and Huang-
ha) and low levels of investment in fixed assets.63
Huai-Hai regions, the inter-cropping of wheat with
Large numbers of farmers have migrated seasonally,
cotton has been introduced.
temporarily or permanently to urban areas where wages
2.3 A variety of farm
are higher, and in some areas there is a significant
shortage of labour for household farming operations.64
enterprises Farming households tend to intensify labour inputs to
maintain operations and improve incomes, using mainly
family labour.65 Some households have increased the
Chinese agriculture is still dominated by small-scale
cultivated area by renting land from other households,
household farming: more than 250 million households,
particularly those with insufficient labour resources
with an average land size of 0.6 ha, contribute the
to maintain their own farming operations. The vast
majority of crop output.59 However, several forms of
majority of small farms still apply organic manure,
larger-scale farming operation have also emerged,
though in smaller quantities than in the past,66 and other
including specialised households and large-scale
production inputs (e.g. seeds, fertiliser, pesticides) are
family farms, farmer cooperatives60 and agribusinesses
purchased from input suppliers. Agricultural products
(all described in the sections below). More than 200
partly meet family consumption needs, but the food
million land contracts have been issued, mostly to
produced by the average household only contributes to
small-scale farmers, but more than 30% of the total
about 15% of their calorific intake.67 Most agricultural
contracted arable land area (i.e. 26.7 million ha)
produce is sold, and foodstuffs purchased in nearby
has been rented out to specialised farmers or other
markets. While in the 1980s about two-thirds of
larger-scale operations due to out-migration or other
household income derived from agriculture, with the
factors. By the end of 2014, China had 3.41 million
growth of labour migration and other incomes (e.g. self-
specialised households each cultivating over 3.3 ha of
employment, rental income, welfare payments or other
land; 870,000 large-scale farms (each cultivating an
subsidies), agriculture now provides less than one-third
average of 13.3 ha); 1.29 million registered farmer’s
of household income.68 The majority of Chinese farming
cooperatives; and more than 350,000 agricultural
households are ‘agriculture + wage labour’ enterprises.
enterprises, including 125,000 large-scale agriculture
This has significant impacts on their farming operations,
firms which engage more than 125 million households
including decisions about fertiliser and manure use,
in their supply chains.61 This increase in land rentals
with a resulting impact on the sustainability of natural
and the scale of farm operations has been facilitated by
resources. With most young men and women working
large-scale migration to urban areas and the increase
off-farm, farm work and domestic tasks are increasingly
in off-farm employment. By the end of 2014, there were
undertaken by elderly parents and children.69 These
274 million migrant workers. Of these, 106 million were
trends have prompted some to ask who will do farming
employed off-farm in their local area and 168 million
in the future?70
59
Huang, J., Wang, X. and Qiu, H. 2012. Small-scale Farmers in China in the Face of Modernisation and Globalisation. IIED/HIVOS, London/The Hague.
60
Formally named ‘farmer specialized cooperative economic organizations’.
61
Mai, T. 4 August 2015. Agricultural commercialization lets of more energy through innovation. Farmer’s Daily, 1. [买天.2015年8月4日.农业产业化在创新中
释放更大能量。农民日报,01版 http://szb.farmer.com.cn/nmrb/html/2015-08/04/nw.D110000nmrb_20150804_9-01.htm?div=-1]; State Administration for
Industry and Commerce. 2015. National market actor development in the first half of 2015. SAIC, Beijing. [中国工商总局, 2015年.2015年上半年全国市场主体发
展, www.saic.gov.cn/zwgk/tjzl/zhtj/xxzx/201507/t20150715_158914.html]. See also Ji, X. et al. 2016. Are China’s farms growing? China & World Economy
24(1) 41–62.
62
National Bureau of Statistics. 2015. Bulletin on GNP and social development in 2014. National Bureau of Statistics, Beijing [国家统计局, 2015年.2014年国民
经济和社会发展统计公报].
63
Huang, J., Wang, X. and Qiu, H. 2012. Small-scale Farmers in China in the Face of Modernisation and Globalisation. IIED/HIVOS, London/The Hague.
64
Li, L. and Tang, Z. 2013, Rural-urban migration and its effects on social and economic development in China: A review. Acta Prataculturae Sinica 22(2)
300–306 [李丽华、唐增. 2013年. 我国农业劳动力转移及其影响的研究综述. 草业学报 22(2) 300–306].
65
Van der Ploeg, J. et al. 2014. Peasant-managed agricultural growth in China: Mechanisms of labour-driven intensification. International Journal of the
Sociology of Agriculture and Food 21(1) 155–171; Cook, S. 1999. Surplus labour and productivity in Chinese agriculture: evidence from household survey data.
Journal of Development Studies 35(3) 16–44.
66
Gao, L., Huang, J. and Rozelle, S. 2012. Rental markets for cultivated land and agricultural investments in China. Agricultural Economics 43(4) 391–403.
67
Sun, Y. and Lin, W. 2014. Impact of income and market condition on the nutrition vulnerability of rural household in China: Evidence from CHNS. Studies in
Labor Economics 2(3) 142–156 [孙颖, 林万龙. 2014年.收入水平、市场条件对中国农村家庭营养脆弱性的影响.劳动经济研究 2(3) 142–156].
68
Huang, J., Wang, X. and Qiu, H. 2012. Small-Scale Farmers in China in the Face of Modernisation and Globalisation. IIED/HIVOS, London/The Hague.
69
Chang, H., Dong, X. and MacPhail, F. 2011. Labor migration and time use patterns of the left-behind children and elderly in rural China. World Development
39(12) 2199–2210.
70
Zhu, Q. and Yang, H. 2011. Who is going to till the land? Survey and thoughts on agriculture labor. Journal of China Agriculture University (Social Science
Edition) 28(1) 162–169 [朱启臻, 杨汇泉. 2011年. 谁来种地—对农业劳动力的调查与思考. 中国农业大学学报(社会科学版)28(1) 162–169].
www.iied.org 19You can also read