Valuing Ireland's Coastal, Marine and Estuarine Ecosystem Services - Authors: Daniel Norton, Stephen Hynes and John Boyd
←
→
Page content transcription
If your browser does not render page correctly, please read the page content below
Report No. 239

Valuing Ireland’s Coastal, Marine and
        Estuarine Ecosystem Services
  Authors: Daniel Norton, Stephen Hynes and John Boyd

                                    www.epa.ie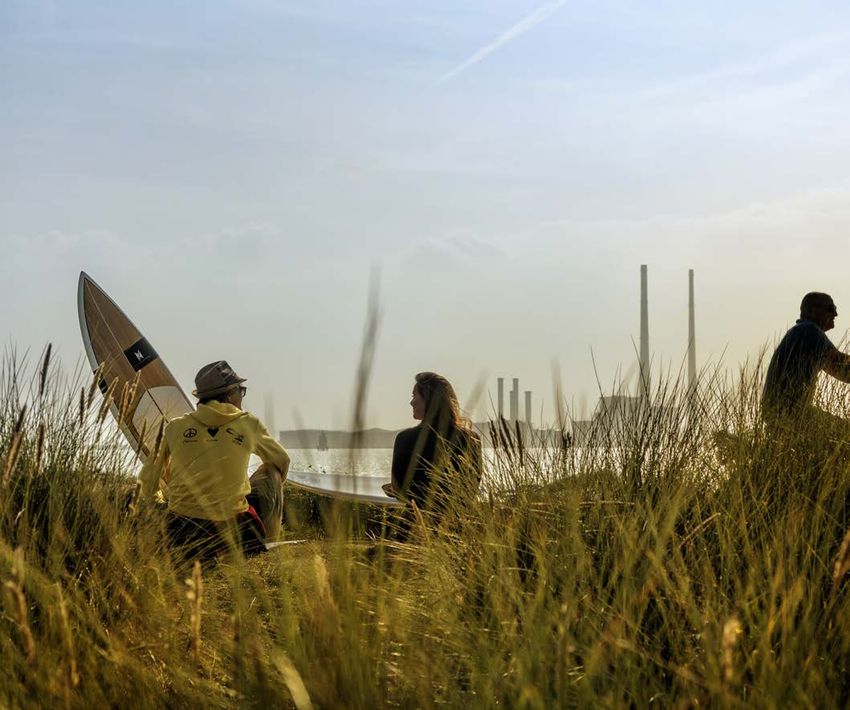
ENVIRONMENTAL PROTECTION AGENCY                                     Monitoring, Analysing and Reporting on the
The Environmental Protection Agency (EPA) is responsible for        Environment
protecting and improving the environment as a valuable asset        • Monitoring air quality and implementing the EU Clean Air for
for the people of Ireland. We are committed to protecting people      Europe (CAFÉ) Directive.
and the environment from the harmful effects of radiation and
                                                                    • Independent reporting to inform decision making by national
pollution.
                                                                      and local government (e.g. periodic reporting on the State of
                                                                      Ireland’s Environment and Indicator Reports).
The work of the EPA can be
divided into three main areas:                                      Regulating Ireland’s Greenhouse Gas Emissions
                                                                    • Preparing Ireland’s greenhouse gas inventories and projections.
Regulation: We implement effective regulation and environmental     • Implementing the Emissions Trading Directive, for over 100 of
compliance systems to deliver good environmental outcomes and         the largest producers of carbon dioxide in Ireland.
target those who don’t comply.

Knowledge: We provide high quality, targeted and timely             Environmental Research and Development
environmental data, information and assessment to inform            • Funding environmental research to identify pressures, inform
decision making at all levels.                                        policy and provide solutions in the areas of climate, water and
                                                                      sustainability.
Advocacy: We work with others to advocate for a clean,
productive and well protected environment and for sustainable       Strategic Environmental Assessment
environmental behaviour.                                            • Assessing the impact of proposed plans and programmes on the
                                                                      Irish environment (e.g. major development plans).
Our Responsibilities
                                                                    Radiological Protection
Licensing                                                           • Monitoring radiation levels, assessing exposure of people in
We regulate the following activities so that they do not endanger     Ireland to ionising radiation.
human health or harm the environment:                               • Assisting in developing national plans for emergencies arising
• waste facilities (e.g. landfills, incinerators, waste transfer      from nuclear accidents.
  stations);                                                        • Monitoring developments abroad relating to nuclear
• large scale industrial activities (e.g. pharmaceutical, cement      installations and radiological safety.
  manufacturing, power plants);                                     • Providing, or overseeing the provision of, specialist radiation
• intensive agriculture (e.g. pigs, poultry);                         protection services.
• the contained use and controlled release of Genetically
  Modified Organisms (GMOs);                                        Guidance, Accessible Information and Education
• sources of ionising radiation (e.g. x-ray and radiotherapy        • Providing advice and guidance to industry and the public on
  equipment, industrial sources);                                     environmental and radiological protection topics.
• large petrol storage facilities;                                  • Providing timely and easily accessible environmental
• waste water discharges;                                             information to encourage public participation in environmental
• dumping at sea activities.                                          decision-making (e.g. My Local Environment, Radon Maps).
                                                                    • Advising Government on matters relating to radiological safety
National Environmental Enforcement                                    and emergency response.
• Conducting an annual programme of audits and inspections of       • Developing a National Hazardous Waste Management Plan to
  EPA licensed facilities.                                            prevent and manage hazardous waste.
• Overseeing local authorities’ environmental protection
  responsibilities.                                                 Awareness Raising and Behavioural Change
• Supervising the supply of drinking water by public water          • Generating greater environmental awareness and influencing
  suppliers.                                                          positive behavioural change by supporting businesses,
• Working with local authorities and other agencies to tackle         communities and householders to become more resource
  environmental crime by co-ordinating a national enforcement         efficient.
  network, targeting offenders and overseeing remediation.          • Promoting radon testing in homes and workplaces and
• Enforcing Regulations such as Waste Electrical and Electronic       encouraging remediation where necessary.
  Equipment (WEEE), Restriction of Hazardous Substances
  (RoHS) and substances that deplete the ozone layer.               Management and structure of the EPA
• Prosecuting those who flout environmental law and damage the      The EPA is managed by a full time Board, consisting of a Director
  environment.                                                      General and five Directors. The work is carried out across five
                                                                    Offices:
                                                                    • Office of Environmental Sustainability
Water Management
• Monitoring and reporting on the quality of rivers, lakes,         • Office of Environmental Enforcement
  transitional and coastal waters of Ireland and groundwaters;      • Office of Evidence and Assessment
  measuring water levels and river flows.                           • Office of Radiation Protection and Environmental Monitoring
• National coordination and oversight of the Water Framework        • Office of Communications and Corporate Services
  Directive.                                                        The EPA is assisted by an Advisory Committee of twelve members
• Monitoring and reporting on Bathing Water Quality.                who meet regularly to discuss issues of concern and provide
                                                                    advice to the Board.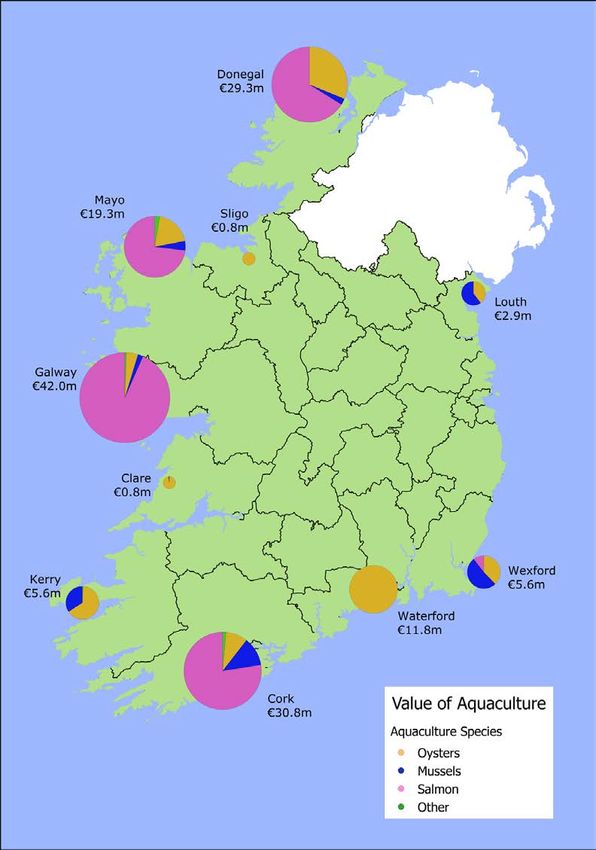
EPA RESEARCH PROGRAMME 2014–2020

Valuing Ireland’s Coastal, Marine and Estuarine
              Ecosystem Services

                            (2014-NC-MS-1)

                       EPA Research Report

                  Prepared for the Environmental Protection Agency

                                        by

   National University of Ireland, Galway and Galway–Mayo Institute of Technology

                                     Authors:

                  Daniel Norton, Stephen Hynes and John Boyd

                 ENVIRONMENTAL PROTECTION AGENCY
                  An Ghníomhaireacht um Chaomhnú Comhshaoil
                PO Box 3000, Johnstown Castle, Co. Wexford, Ireland

                Telephone: +353 53 916 0600 Fax: +353 53 916 0699
                      Email: info@epa.ie Website: www.epa.ie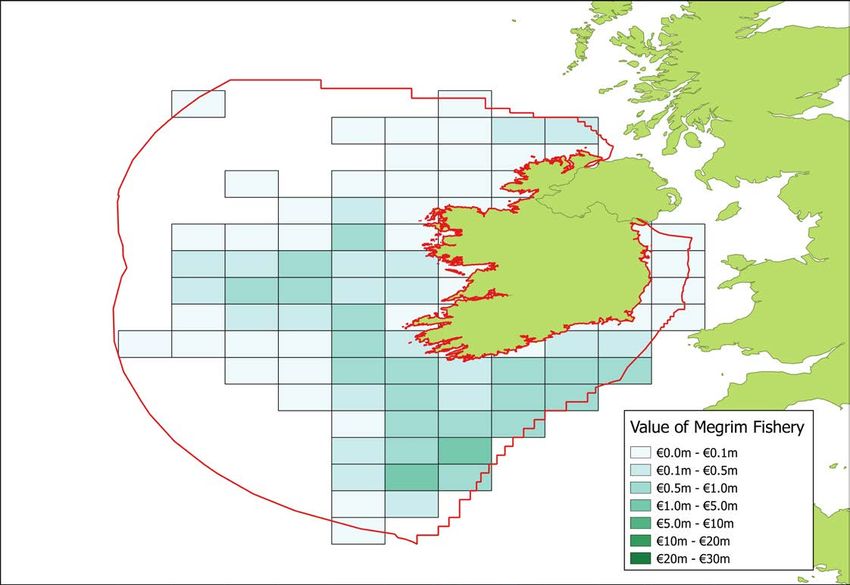
© Environmental Protection Agency 2018

                                 ACKNOWLEDGEMENTS
This report is published as part of the EPA Research Programme 2014–2020. The programme is
financed by the Irish Government. It is administered on behalf of the Department of Communications,
Climate Action and Environment by the EPA, which has the statutory function of co-ordinating and
promoting environmental research.

The authors would like to acknowledge the members of the project steering committee, namely
Dr Aisling O’Connor (EPA), Dr Alice Wemaere (EPA), Eugene Nixon (Marine Institute), Richard
Cronin (Department of Housing, Planning and Local Government), Sue Kidd (Liverpool University)
and Yvonne Leahy (Department of Culture, Heritage and the Gaeltacht).

                                        DISCLAIMER
Although every effort has been made to ensure the accuracy of the material contained in this
publication, complete accuracy cannot be guaranteed. The Environmental Protection Agency, the
authors and the steering committee members do not accept any responsibility whatsoever for loss
or damage occasioned, or claimed to have been occasioned, in part or in full, as a consequence of
any person acting, or refraining from acting, as a result of a matter contained in this publication.
All or part of this publication may be reproduced without further permission, provided the source is
acknowledged.

The EPA Research Programme addresses the need for research in Ireland to inform policymakers
and other stakeholders on a range of questions in relation to environmental protection. These reports
are intended as contributions to the necessary debate on the protection of the environment.

                         EPA RESEARCH PROGRAMME 2014–2020
                    Published by the Environmental Protection Agency, Ireland

ISBN: 978-1-84095-760-0                                                               January 2018

Price: Free                                                                         Online version

                                                 ii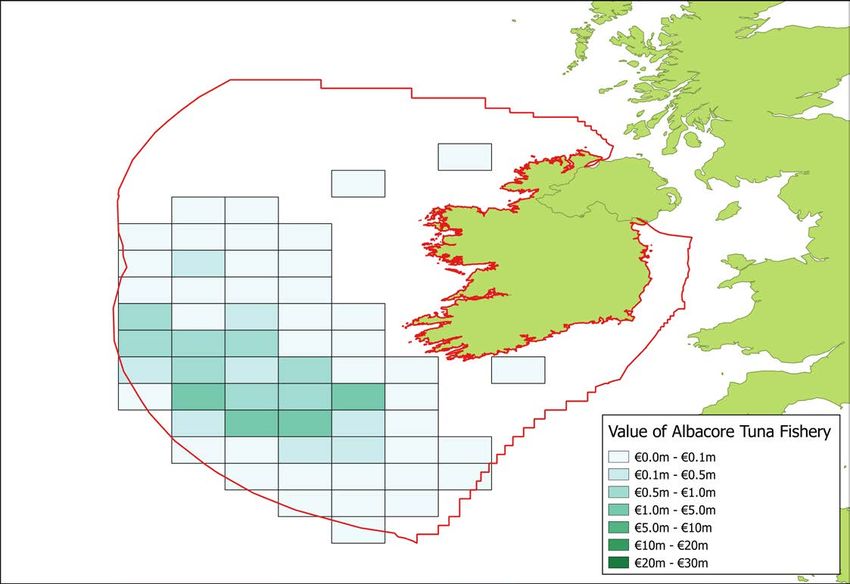
Project Partners

Daniel Norton                                          John Boyd
Socio-Economic Marine Research Unit                    Marine and Freshwater Research Centre
Whitaker Institute for Innovation and Societal         Galway–Mayo Institute of Technology
Change                                                 Galway
National University of Ireland Galway                  Ireland
Galway                                                 Email: john.boyd@nuigalway.ie
Ireland
Email: daniel.d.norton@nuigalway.ie

Stephen Hynes
Socio-Economic Marine Research Unit
Whitaker Institute for Innovation and Societal
Change
National University of Ireland Galway
Galway
Ireland
Email: stephen.hynes@nuigalway.ie

                                                 iii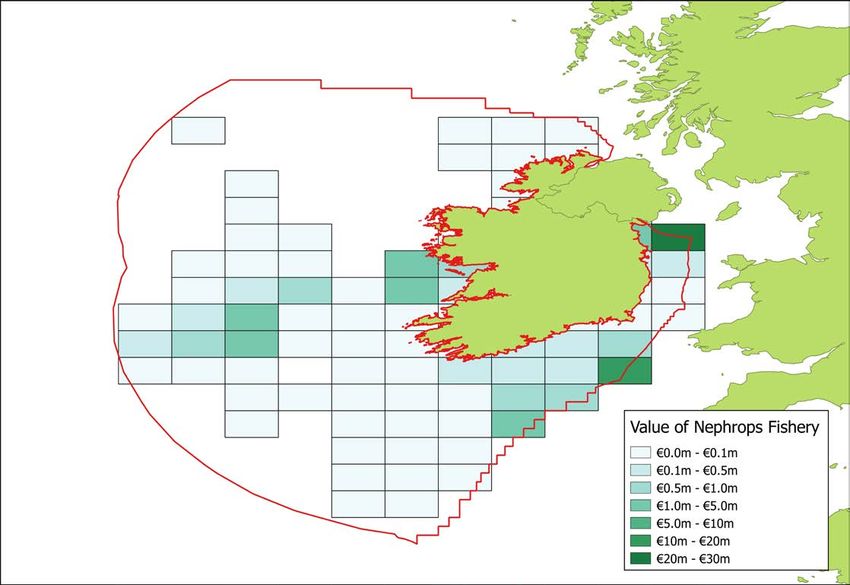
Abstract

This technical report demonstrates the data sources              and waste treatment, at local and regional scales.
and methods that can be used to estimate the value               By categorising coastal, marine and estuarine
of a number of coastal and marine ecosystem service              ecosystems and linking them to reliable estimates of
benefits. In particular, the study estimated the value of        ecosystem service value flows, this project will assist
waste assimilation services, coastal defence services,           decision makers with responsibility for marine and
carbon sequestration services, recreational services,            coastal zone management as they attempt to manage
offshore and inshore capture fisheries, aquaculture              developments in a manner that maximises the delivery
and seaweed harvesting, and the contribution that                of ecosystem service benefit value to society while
proximity to the coast can make to the value of                  minimising forgone market opportunities. The valuation
residential property. These ecosystem services                   of the identified ecosystem service benefits is
occur at multiple scales, from climate regulation                accomplished using secondary sources of information.
and carbon sequestration at the global scale, to                 Guidelines for undertaking an ecosystem services
food provision, marine recreation opportunities                  assessment are also provided in an appendix.

                                                            iv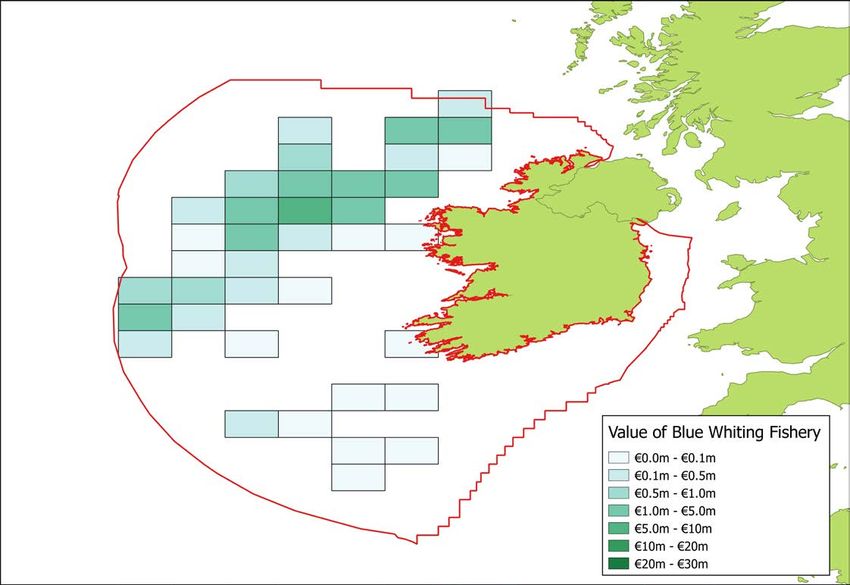
Contents

Acknowledgementsii
Disclaimerii
Project Partners                                                         iii
Abstractiv
List of Figures                                                         vii
List of Tables                                                          viii
Executive Summary                                                        xi
1      Introduction                                                       1
       1.1        Ecosystem Services                                      2
       1.2        Valuing Ecosystem Services                              4
2      Ireland’s Provisioning Marine Ecosystem Services                   8
       2.1        Offshore Capture Fisheries                              8
       2.2        Inshore Capture Fisheries                             10
       2.3        Aquaculture                                           12
       2.4        Algae/Seaweed Harvesting                              13
       2.5        Water for Non-drinking Purposes                       15
3      Ireland’s Regulation and Maintenance Marine Ecosystem Services   17
       3.1        Waste Services                                        17
       3.2        Coastal Defence                                       21
       3.3        Lifecycle and Habitat Services                        24
       3.4        Climate Regulation                                    25
4      Ireland’s Cultural Marine Ecosystem Services                     32
       4.1        Recreational Services                                 32
       4.2        Aesthetic Services                                    33
5      Conclusions                                                      37
References39
Abbreviations45

                                                     v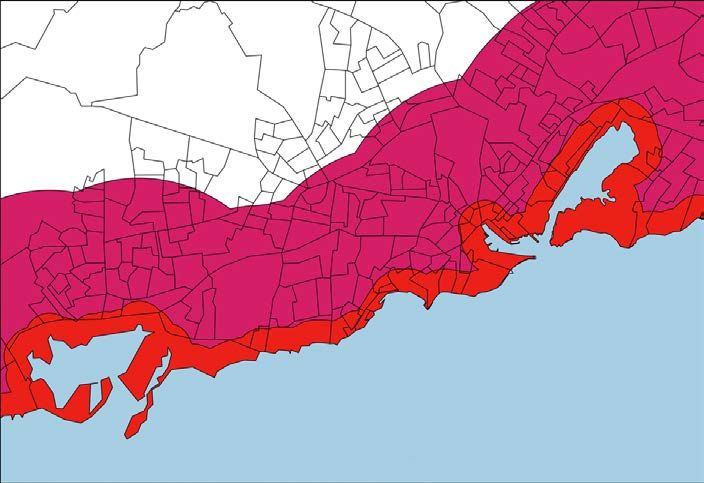
Valuing Ireland’s Coastal, Marine and Estuarine Ecosystem Services

Appendix 1 Details of the Pollutants Discharged from Coastal and Estuarine
            Licensed Urban Wastewater Treatment Plants                                 46
Appendix 2 Guidelines for Undertaking an Ecosystem Services Assessment                 56
Appendix 3 Studies Used in Meta-analysis                                               63

                                                   vi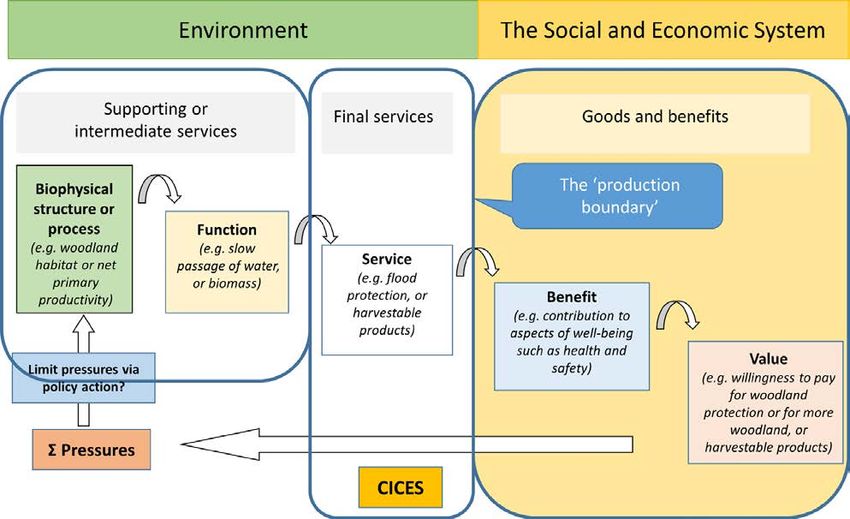
List of Figures

Figure 1.1.   An example of an ecosystem service cascade                                      4
Figure 1.2.   Example of the hierarchical structure of the provisioning ecosystem services    5
Figure 2.1.   The dark blue rectangles show which ICES rectangles were included in
              estimating the value of Ireland’s offshore fisheries                            9
Figure 2.2.   The estimated total landings value per ICES rectangle in millions of euros     10
Figure 2.3.   Value maps for megrim, nephrops, blue whiting and albacore tuna                11
Figure 2.4.   Value of Irish aquaculture activity by county                                  14
Figure 3.1.   Coastal and estuarine WTTPs in Ireland                                         18
Figure 3.2.   Air–sea carbon flux for grid cells off the Irish western coast taken from
              NOAA model                                                                     31
Figure 4.1.   Coastal buffers: an overlay of 0–250 m buffer and 250–1600 m buffer is
              shown for census SAs in Galway City                                            35
Figure A2.1. Flowchart of the steps for undertaking an ecosystem services assessment         57

                                                vii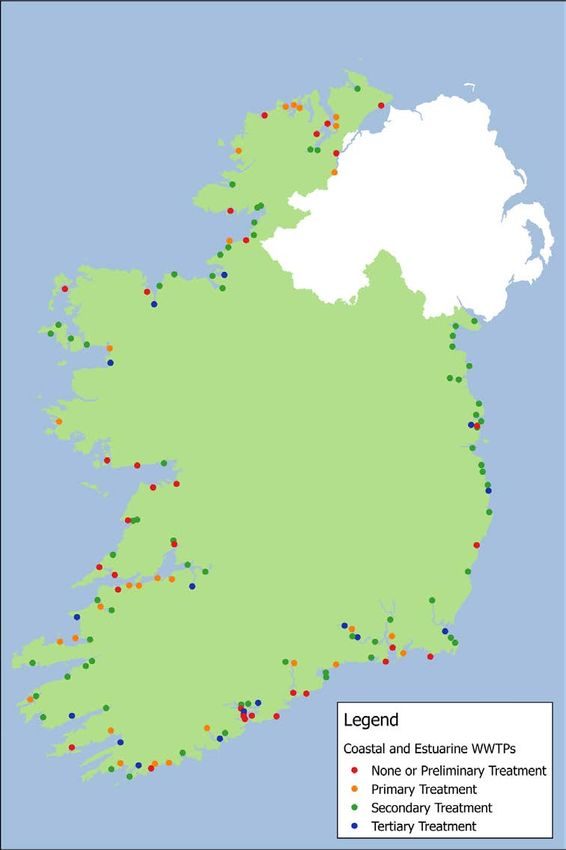
List of Tables

Table ES.1.   Values of Irish coastal and marine ecosystem service benefits                xii
Table 1.1.    MFSD descriptors of GES                                                       2
Table 2.1.    Estimated annual landings and value for capture fisheries within the Irish
              EEZ for vessels longer than 15 m                                              9
Table 2.2.    Offshore landings and value by Member State fishing in the Irish EEZ, 2014   12
Table 2.3.    Estimated landings and value for the selected inshore fisheries in Ireland   12
Table 2.4.    Irish aquaculture production and value 2015                                  13
Table 2.5.    Aquaculture by type and county in 2015                                       13
Table 2.6.    Estimated seaweed harvest in Ireland                                         15
Table 2.7.    Details of water abstraction for cooling in Irish estuaries                  16
Table 3.1.    Shadow prices of removing a kilogram of each pollutant                       17
Table 3.2.    Assumptions for untreated wastewater discharges quantities                   18
Table 3.3.    Assumptions for primary treated wastewater discharges quantities             18
Table 3.4.    Regression for estimating nitrogen emissions for plants with tertiary
              phosphorus removal                                                           19
Table 3.5.    Regression for estimating phosphorus emissions for plants with tertiary
              phosphorus removal                                                           19
Table 3.6.    Regression for estimating nitrogen emissions for plants with tertiary
              nitrogen removal                                                             19
Table 3.7.    Regression for estimating phosphorus emissions for plants with tertiary
              nitrogen removal                                                             20
Table 3.8.    Regression for estimating nitrogen emissions for plants with secondary
              treatment level                                                              20
Table 3.9.    Regression for estimating phosphorus emissions for plants with secondary
              treatment level                                                              20
Table 3.10.   Estimated totals for pollutants discharged into Irish coastal and estuarine
              waters for 2015                                                              20
Table 3.11.   The estimated annual value of the waste treatment ecosystem service for
              each pollutant                                                               21
Table 3.12.   Breakdown of estimated protected lengths of CORINE landcover types by
              saltwater marsh in Ireland                                                   22
Table 3.13.   Land cover type protected by saltmarsh in Ireland                            24

                                                viii
D. Norton et al. (2014-NC-MS-1)
Table 3.14. Coastal, marine and estuarine habitat types based on Annex I of the EU
Directive on the Conservation of Habitat, Flora and Fauna (92/43/EEC) 25
Table 3.15. SAC site name protecting all or part of a coastal, marine or estuarine ecosystem 26
Table 3.16. Carbon flux in 14 estuarine environments in the north-east Atlantic region
(figures from Chen and Borges, 2009) 29
Table 3.17. Annual estimate of carbon flux is based on the mean of three shallow and
coastal marine environments in the north-east Atlantic region (figures from
Chen and Borges, 2009) 30
Table 3.18. Irish coastal and marine ecosystem areas and estimated annual carbon
absorption amounts 31
Table 3.19. Estimated total amount of carbon absorbed by Irish coastal and marine
ecosystems and its value 31
Table 4.1. Marine recreation activities 33
Table 4.2. House price value by number of bedrooms (thousands of euros) 34
Table 4.3. Percentage increase in house prices at and near to the coast 35
Table 4.4. Estimated aesthetic value by county (thousands of euros) 36
Table 4.5. Estimated increased annual value of houses at or near the coast (proxy for
aesthetic ecosystem service) (euros) 36
Table 5.1. Certainty associated with generated values 37
Table A1.1. Details of the pollutants discharged from coastal and estuarine licensed
urban wastewater treatment plants 47
Table A2.1. Potential indicators for marine and coastal ecosystem services 59
Table A2.2. Main methodologies for estimating marine ecosystem service values 62
ixExecutive Summary
This technical report presents the data and methods benefits that humans obtain from contact with
used to estimate the value of a number of marine, nature. Examples of the cultural ecosystem
coastal and estuarine ecosystem service benefits. services in the Irish marine and coastal zones
In particular, values for waste assimilation services, include recreational activities, such as walking
coastal defence services, carbon sequestration along the beach and surfing, as well as the added
services, recreational services, the contribution value that having a sea view from one’s house
that proximity to the coast can make to the value of provides to the resident’s well-being.
residential property, offshore and inshore capture
fisheries, aquaculture and seaweed harvesting are Both market and non-market methods of valuation
presented. Marine ecosystem services are provided by are employed in this report. For provisioning
the processes, functions and structure of the marine ecosystem service benefits, such as wild fisheries and
environment that directly or indirectly contribute to aquaculture, market prices combined with landings
societal welfare, health and economic activities. The and production data provide a good indication of
value of marine ecosystem service benefits can often value. Similarly, estimates of the cost of providing
be quantified in monetary terms using economic an alternative to the service provided by the marine
techniques. As the report Economics of Ecosystems environment, as in the case of using hard-engineered
and Biodiversity (Kumar, 2010) points out, ignoring solutions in place of the coastal defence services
the value of these ecosystem services and persisting of saltwater marshes, can be generated and used
with conventional approaches to wealth creation and as proxies for the value of the ecosystem service
development is a risky strategy if it means losing the provided. However, a number of the services provided
benefits that coastal and marine ecosystems provide. by the marine environment do not command a price
in any market, and stated and revealed valuation
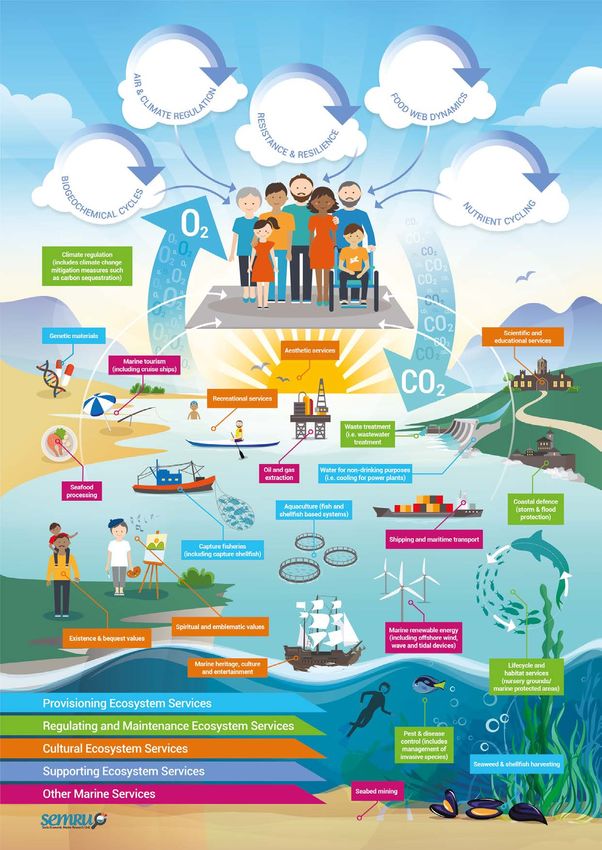
Marine ecosystem services can be classified as
methods are required to estimate these values.
provisioning services, regulation and maintenance
For example, using the travel cost method, we can
services, and cultural or supporting services.
develop a model of demand for coastal recreation from
●● Provisioning services: these ecosystem services which we can estimate the recreational use value of
are tangible goods and there is often a direct our marine resources.
connection between the ecosystem and the
While these primary valuation methods provide
provision of these ecosystem services. Examples
detailed information on non-market value, they are
of the provisioning ecosystem services generated
often time consuming and expensive to implement. In
by Irish marine and coastal ecosystems are the
this desk-based research, we therefore primarily rely
fish and seaweed that are harvested and also the
on secondary values taken from the literature where
aquaculture resources around our coasts.
the value is “transferred” from the original study (where
●● Regulation and maintenance services: these
the primary research has taken place) to the policy site
ecosystem services regulate natural processes
(in this case the Irish marine environment). Table ES.1
and functions in the world around us and are
summarises the estimated quantities and values of
often consumed indirectly. Examples of these
a number of marine and coastal ecosystem services
ecosystem services include carbon sequestration,
provided by Irish waters. This is a non-exhaustive list,
which helps to mitigate climate change, treatment
as there are a number of service benefits that we do
of wastewater and its return to the hydrological
not have valuation estimates for, either because they
cycle, and flood and storm protection by sand
are difficult to quantify in monetary terms, such as
dunes and saltmarsh, which lessens the damage
many of the cultural ecosystem services associated
from winter storms.
with the marine environment, or because there is too
●● Cultural services: the cultural ecosystem services
high an uncertainty associated with the estimates
refer to the psychical, psychological and spiritual
available.
xiValuing Ireland’s Coastal, Marine and Estuarine Ecosystem Services
Table ES.1. Values of Irish coastal and marine ecosystem service benefitsa
Ecosystem service CICES classification Estimate of the quantity of ES per Estimate of the value of ES
annum per annum (€)
Provisioning ecosystem service
Offshore capture fisheries Wild animals 469,735 tonnes 472,542,000
Inshore capture fisheries Wild animals 14,421 tonnes 42,113,000
Aquaculture Animals and aquaculture 39,725 tonnes 148,769,000
Algae/seaweed harvesting Wild plants and algae/plants 29,500 tonnes 3,914,000
and algae from aquaculture
Genetic materials Genetic materials from biota Not quantified Not valued
Water for non-drinking Surface water for non- 1,189,493,326 m of seawater used
3
Not valued
purposes drinking purposes for cooling in power plants
Regulating and maintenance ecosystem services
Waste services Mediation of waste, toxics 9,350,642 kg organic waste 316,767,000
and other nuisances 6,834,783 kg nitrogen
1,118,739 kg phosphorus
Coastal defence Mediation of flows 179 km of coastline protected by 11,500,000
saltmarsh
Lifecycle and habitat services Lifecycle maintenance, 773,333 ha protected through SACs Not valued
habitat and gene pool
protection
Pest and disease control Pest and disease control Not quantified Not valued
Climate regulation Atmospheric composition 42,647,000 tonnes CO2 absorbed 818,700,000
and climate regulation
Cultural services
Recreational services Physical and experiential 96 million marine recreation trips 1,683,590,000
interactions per year
Scientific and educational Scientific and educational Marine education and training fees 11,500,000
services
Marine heritage, culture and Heritage, cultural and Not quantified Not valued
entertainment entertainment
Aesthetic services Aesthetic Flow value of coastal location of 68,000,000
housing
Spiritual and emblematic Spiritual and/or emblematic Not quantified Not valued
values
Non-use values Existence and bequest Not quantified Not valued
values
a
The flow of ecosystem service values should not be added up, as they represent only a certain proportion of the total
economic value (TEV). Aggregating the figures in an effort to give a single figure for the value of marine ecosystem services
in Ireland is an overly simplistic approach that would misrepresent the TEV. In addition, the values represented for each
service use different measures. For example, in some cases, such as fisheries, aquaculture and education, the value is
measured as revenue, while others, such as recreation, are measured as net economic contribution, and the value of waste
treatment and coastal defence is measured using a cost-based approach.
CICES, Common International Classification of Ecosystem Services; ES, ecosystem services; SACs, special areas of
conservation.
xii1 Introduction
For most of history, the oceans have been seen as of environmental values into decision making. At the
a boundless source of food and raw materials from global level, the main policy driver for protection of
their fisheries and whaling industries (Roberts, 2010). biodiversity is the strategic plan arising from the 10th
The seas’ and oceans’ vastness made it seem as if meeting of the Conference of Parties (COP10) to
they could accept unlimited amounts of waste from the Convention on Biological Diversity (CBD). The
the shore. However, in the late 20th century, it was outcome of this strategic plan was 20 targets (Aichi
realised that there are limits and that humankind was Targets) (Cardinale et al., 2012). The targets were in
beginning to test them (Meadows et al., 1972). The addition to previous targets to protect and conserve
pressure on our environment was not just limited to global biodiversity (Balmford, 2005), and they added
the Earth’s marine waters. The terrestrial environment protection of ecosystem services to three of the targets
has also seen increased pressures mainly due to the (Target 11, Target 14 and Target 15).
increase in agricultural land, increased use of water
At a European level, the European Commission (EC)
and increased exploitation of natural and mineral
aims to protect, value and where necessary restore
resources (SCBD, 2014). The main driver of these
nature both for biodiversity’s intrinsic value and for
pressures on both terrestrial and marine environments
its contribution to human well-being and economic
is a combination of exponential increases in population
prosperity through ecosystem services (EC, 2011).
and in consumption of the resources needed to sustain
This commitment has led to the European Union (EU)
human life. The positive effect of this for humankind is
2020 Biodiversity Strategy. The strategy runs to 2020
an increased level of human welfare. Notwithstanding
and, by that time, aims to halt the loss of biodiversity
the recent financial crisis, the effects of which still
and ecosystem services in EU Member States. This
rebound in our society to date, the past 50 years
project contributes to achievement of Target 2 of the
have seen incomes as measured by gross domestic
strategy in Ireland. Target 2 aims for the maintenance
product (GDP) increase. This holds true both for the
and restoration of ecosystems and their services
world population as a whole and on a per capita basis
by 2020. Under Action 5 of Target 2, each Member
(World Bank, 2015). The corollary of these facts is
State will map their ecosystems and services by 2014
that intense pressures are being put on the Earth’s
and assess the economic value of such services
ecosystems, with Steffen et al. (2015) finding that the
by 2020. Mapping these values will allow spatially
planetary boundaries are starting to be breached,
explicit prioritisation and problem identification of
especially with regard to biosphere integrity and
threats to ecosystem services. They are also useful for
biodiversity.
communication between different stakeholders and will
Project or policy decisions often involve a cost–benefit allow up- or down-scaling of values from national level
analysis either implicitly (a policymaker or politician to local level and vice versa (Maes et al., 2013). This
makes a decision) or explicitly (costs and benefits will help to integrate these values into policymaking
are quantified, sometimes in monetary terms, and decisions. The integration of ecosystem service
weighted against each other). In most cases, the costs values into accounting and reporting systems at EU
are more readily quantifiable than the benefits. When and national level by 2020 is required by the EU 2020
a project or policy has impacts on an ecosystem, the Biodiversity Strategy.
non-market benefits provided by the ecosystem are
In addition, the EU also aims to protect the marine
often unaccounted for in the cost–benefit analysis.
environment and ensure sustainable use in the future
These unaccounted for environmental benefits, known
through the Marine Strategy Framework Directive
as “ecosystem services” (MEA, 2005), may result in
(MSFD) (2008/56/EC). The overriding aim of the
sub-optimal decisions being made.
MSFD is to achieve “good environmental status”
Often it is national and international policies that drive (GES) in all EU marine and coastal waters, as
protection of our environment or the incorporation measured by 11 descriptors (Table 1.1), by 2020. It
1Valuing Ireland’s Coastal, Marine and Estuarine Ecosystem Services
Table 1.1. MFSD descriptors of GES
No MFSD descriptor
1 Biological diversity is maintained, including sufficient quality and quantity of habitats and species
2 Marine food webs occur at normal abundance and diversity and at levels capable of ensuring the long-term abundance of
each species
3 Healthy stocks of all commercially exploited fish and shellfish that are within safe biological limits
4 Contaminants in fish and other seafood for human consumption do not exceed unhealthy levels
5 Concentrations of contaminants are at levels that do not give rise to pollution effects
6 Human-induced eutrophication is minimised
7 Marine litter does not cause harm to the coastal and marine environments
8 Non-indigenous species introduced by human activities have minimal effect on native ecosystems
9 Sea floor integrity is at a level that ensures that the structure and functions of the ecosystems are safeguarded
10 Permanent alteration of hydrographical conditions does not adversely affect marine ecosystems
11 Introduction of energy, including underwater noise, is at levels that do not adversely affect the marine environment
is considered the first attempt by an EU directive to A number of national ecosystem assessments have
undertake an ecosystem approach to protect and been undertaken already across the EU. The most
maintain the marine ecosystems (Long, 2011). As can well-known and comprehensive of these is the UK
be seen in Table 1.1, many of the descriptors relate to National Ecosystem Assessment (UK NEA) (UK NEA,
ecosystem services provided by marine ecosystems, 2011), while Ireland has also undertaken work to
such as provision of food (descriptors 3 and 4) assess the value of our biodiversity and ecosystem
and regulating ecosystem services such as waste services (Bullock et al., 2008). However, Brouwer et
treatment (descriptors 5, 6, 7 and 11), or they relate al. (2013) in their review of ecosystem assessments
to the overall achievement of maintaining biodiversity across the EU Member States noted that “marine
and functioning ecosystems upon which ecosystem ecosystem services are relatively less well explored”,
services depend (descriptors 1 and 2). while at national level in Ireland a recent report by
the National Economic and Social Council (NESC,
Currently, Ireland is implementing the MSFD. Many of
2014) highlighted the large gap in environmental and
its aims overlap with the EU 2020 Biodiversity Strategy
economic data in the area of the marine. There has
and the output of this project may contribute to helping
been some work to overcome this, including work
policymakers in their assessments of the measures
done as part of the initial assessment undertaken
needed to achieve GES as required by the MSFD
for the MSFD, and there is spatial data available in
while ensuring the sustainable use of marine goods
online atlases, especially Ireland’s Marine Atlas (http://
and services by present and future generations.
atlas.marine.ie), developed by the Marine Institute for
In 2012, the Irish Government launched an integrated Ireland’s reporting for the MSFD and the Marine Irish
marine plan for Ireland, “Harnessing Our Ocean Digital Atlas (MIDA) (http://mida.ucc.ie/) (Dwyer, 2004).
Wealth” (HOOW) (GoI, 2012). The plan’s primary The lack of marine spatial data relating to marine
goal is to develop a sustainable marine and maritime ecosystem services is a challenge for Ireland and for
economy and to grow the Irish blue economy in other countries (Townsend et al., 2014).
order to increase its contribution to Ireland’s GDP.
However, it also aims to do this in a sustainable
1.1 Ecosystem Services
manner to ensure that Ireland’s marine biodiversity
and ecosystems are protected. One of the key actions, The ecosystem services classification system offers a
which this project will contribute towards, within the way of understanding the indirect effects of decisions
HOOW is Action 15, which is to “promote further that affect the natural environment on human welfare.
research into economic values of marine biodiversity The term was first coined by Erlich and Erlich (1982)
and ecosystem services to ensure best practice but the concept had been previously explored by
planning and management of the ocean resource” to others (Carson, 1962; Krutilla and Fisher, 1975;
ensure delivery of the goals of HOOW. Westman, 1977). The concept gained prominence in
2D. Norton et al. (2014-NC-MS-1)
the late 1990s, particularly following a paper published harvested and also the aquaculture resources around
in Nature by Constanza et al. (1997), which attempted our coasts.
to estimate the value of the Earth’s ecosystem
Regulation and maintenance services: these
services. This was in the same period as a number
ecosystem services regulate natural functions and
of papers started articulating the need for integrating
processes in the world around us and are often
ecosystem services into policy- and decision making
consumed indirectly. Examples of these ecosystem
(de Groot, 1987, 1992; Daily, 1997).1 In turn, a number
services include carbon sequestration, which helps to
of ecosystem services classification systems were
mitigate climate change, treatment of our wastewater
proposed (Daily, 1997; Constanza, 2008; Boyd and
and its return to the hydrological cycle, and flood and
Banzhaf, 2009), which could be used in policy circles.
storm protection by sand dunes and saltmarsh, which
A number of differing definitions of ecosystem services
lessens the damage done by winter storms.
emerged (Fisher et al., 2009); the most common and
succinct definition was that offered by the Millennium Cultural services: the cultural ecosystem services
Ecosystem Assessment (MEA, 2005), which defined refer to the psychical, psychological and spiritual
ecosystem services as “the benefits humans derive benefits that humans obtain from contact with nature.
from nature”, although there are other differing Examples of the cultural ecosystem services in the
definitions, frameworks and classification systems Irish marine and coastal zones include recreational
(Nahlik et al., 2012). activities, such as walking along the beach and surfing,
as well as the added value that having a sea view from
The MEA was initiated in 2001 following a call by
your house provides for your well-being.
the United Nations (UN) Secretary-General, Kofi
Annan. The objective of the MEA was to assess the A thorough understanding of ecosystem functioning
effects of ecosystem change on human well-being and how these functions provide benefits is needed
and then provide evidence for actions needed to in order to determine the change in service flow that
protect ecosystems, their ecosystem services and might occur following a disturbance to an ecosystem.
consequently human well-being dependent on those Analysts can then use a number of techniques to
ecosystem services (MEA, 2005). As well as data estimate the welfare impact that may result from
on the linkage between biodiversity, conservation changes in the supply or quality of these ecosystem
and ecosystem services and their linkages to social services. Böhnke-Henrichs et al. (2013) emphasised
welfare, it provided a system for classifying ecosystem the need to differentiate between different elements of
services into four broad groups. The first three – the ecosystem service cascade (processes, functions,
provisioning services, regulation and maintenance services, benefits and values) (Figure 1.1) so that
services, and cultural services – are all underpinned by different elements are not confused, noting that one
the fourth, supporting services. Following on from the service can deliver multiple benefits and confusing
Economics of Biodiversity and Ecosystems or TEEB services and benefits could lead to double counting.
report (Kumar, 2010), it was noted that only the first This is why a classification system is needed for the
three types of ecosystem services could be valued, assessment of ecosystem values in addition to the
otherwise there would be a risk of double counting (Fu need to classify ecosystem services and identify
et al., 2011) The types of ecosystem services that can gaps in knowledge. In many cases, each new study
be valued can be described as follows. develops its own concepts and classifications or
develops a variation on a previously used ecosystem
Provisioning services: these ecosystem services are
service classification system. However, the UN
tangible goods and there is often a direct connection
(UN et al., 2014) has advocated a move towards a
between the ecosystem and the provision of these
standard approach to an environmental–economic
ecosystem services. Examples of the provisioning
assessment classification system, especially for
ecosystem services generated by Irish marine and
integrating environmental accounts with national
coastal ecosystems are the marine fish and seaweed
accounts. This has led in recent years to a proposed
1 For further discussion of the history of the development of the ecosystem service concept the interested reader is directed towards
Gómez-Baggethun et al. (2010).
3Valuing Ireland’s Coastal, Marine and Estuarine Ecosystem Services
Figure 1.1. An example of an ecosystem service cascade (adapted from Potschin and Haines-Young,
2011).
new international classification system known as the are three main ecosystem services, provisioning,
Common International Classification of Ecosystem regulation and maintenance, and cultural. Figure 1.2
Services (CICES). shows an example of how the hierarchical nature of
CICES works for the breakdown of the provisioning
CICES was originally proposed by Haines-Young and
ecosystem services. CICES is built upon the previous
Potschin (2010). Although it was originally envisaged
classification systems of the MEA and TEEB and
as a method to facilitate the construction of ecosystem
this allows comparability between the classification
accounts, the hierarchical and flexible structure built on
systems used.
the three main ecosystem service types (provisioning,
regulation and maintenance, and cultural) make it
an ideal classification system for the assessment of 1.2 Valuing Ecosystem Services
ecosystem services (Maes et al., 2013). Since the
The valuation of ecosystem services has been widely
original report, it has been updated as part of the
discussed. What is meant by valuation or values is
revision of the System of Environmental–Economic
the change in economic value that is measured as
Accounting (SEEA) by the UN Statistical Commission
the amount of goods or services (typically measured
(UN et al., 2014). This process has led to debate within
in monetary terms) someone is willing to give up
the review process reflecting the wider literature on
to accept a change in an ecosystem service or the
aspects of measuring and valuing ecosystem services.
amount that they are willing to receive to avoid
Such topics include defining the boundary between
a change in an ecosystem service. The former
abiotic and biotic services, the role of water as a
willingness to give up an amount is known as
service and whether ecosystem services are benefits
willingness to pay (WTP) and the latter is known as
or contribute to benefits.
willingness to accept (WTA). In a market situation,
This project will use CICES 4.3, the most up-to-date the amount that is paid by a consumer may be less
version of the classification system to classify the than the consumer’s WTP and the excess value they
ecosystem services to be valued in this report. There did not pay is known as the consumer surplus. The
4D. Norton et al. (2014-NC-MS-1)
costs, which are an estimate of how much it would cost
to replace a service that an ecosystem had previously
provided for free.
Another market-related technique is the production
function approach. Production functions are statistical
models that relate how changes in some ecosystem
functions affect production of another good or service.
These goods or services may have a market price, or
the alternative methods described below can be used.
This method may be able to account for non-linearity
Figure 1.2. Example of the hierarchical structure of
in the relationship between ecosystem functioning and
the provisioning ecosystem services (from Haines-
services. The main challenge to this method is the
Young and Potschin, 2012).
need for good enough data describing the relationship
and, even with such data, it can be very site specific.
economic value of a good is therefore the WTP or,
where there is a market price, it is the market price Revealed preference (RP) techniques are used where
plus the consumer surplus (Hanley and Barbier, 2009). people’s choices can be observed and related back
to market prices or where consumer surplus can be
To find the economic values of various types of estimated from their behaviour. The travel cost method
ecosystem services, there are a variety of methods is used to estimate the value of sites to which people
available. The type of methodology used depends travel for recreation (including hunting, fishing and
on the types of services, whether the benefit being wildlife viewing). It is based on the theory that travel
valued has use value or non-use value and if the data cost represents the price of access to the site. The
are sufficient to use a revealed or stated preference distance travelled and number of trips can be modelled
technique. As many ecosystem services are non- to represent the WTP of individuals for the site.
market goods and services, we have to use proxies to Undertaking the survey may be costly. Hedonic pricing
estimate the economic value of those. These proxies is a statistical modelling technique, which is most
serve in the absence of formal markets and give some commonly used with house or land prices to determine
signals of value. Even in the case where we do have the values of the surrounding environmental levels,
market prices, as is the case for provisioning goods, such as air quality, distance to amenities or a clean
these do not reflect the true economic values, as they water body, and to estimate the value of changes in
omit the consumer surplus element of value and may these ecosystem services to the change in value of
be affected by taxes or subsidies. There are three the house or land. Getting data of sufficient quality and
main types of valuation techniques: market-based, reliability is often the biggest problem with using this
revealed preference and stated preference techniques. technique.
Market-based techniques are based on data that are Stated preference techniques are often used to
relatively readily available in the form of established estimate non-use values. For example, an individual
market prices. Although market prices do not include may gain utility from the knowledge that the blue
consumer surplus, they are more readily available whale is protected and be willing to pay towards that
compared with non-market-based prices and serve protection, even though they may never even see
as a good proxy for the change in value of certain or use a blue whale themselves. Stated preference
ecosystem services, in particular the provisioning techniques are based on constructed hypothetical
ecosystem types. An alternative is to use costs. markets through which individuals are asked to
Avoided costs is a measure of the value of a service express their WTP for environmental goods and
that an ecosystem provides, often for no cost, which services. Contingent valuation is a stated preference
would otherwise have to be borne by human society. method of valuing a single change to an environmental
An extreme example would be the cost to pay good or service. The change is described and the
someone to pollinate fruit if no bees or other pollinators respondent is asked to pay via a charge or tax (the
were available. This is closely related to replacement respondent is asked their WTP for positive changes or
5Valuing Ireland’s Coastal, Marine and Estuarine Ecosystem Services
their WTA for negative changes). In contrast, choice coastal ecosystem services in recent years. One
experiments are based on breaking a good or service of the first attempts was a paper by Costanza et al.
down into a number of attributes and can be used (1997). They made an attempt to value the ecosystem
to measure how respondents trade off between the services provided by all the ecosystems in the world
various attributes. The values of different types and and estimated a total value of US$33 trillion1997 per
levels of attributes are measured by including a cost year (1997 prices). They estimated that the “total
attribute. economic value” of coastal and marine ecosystems
was $20.9 trillion1997 and it accounted for 63% of the
These stated and revealed primary valuation methods
world’s ecosystems “total economic value”, of which
can take time to implement and are often expensive to
coastal systems alone contributed $10.6 trillion1997.
conduct. However, there is a secondary methodology
known as value transfer that is both time and cost More recently, Barbier et al. (2011) undertook
efficient (Brouwer, 2000). In this method, values are a review of five different estuarine and coastal
taken from the literature and their value is transferred ecosystems (coral reefs, seagrass beds, saltmarshes,
from the original study site (where the primary mangroves, and sand beaches and dunes) and
research took place) to the policy site (where the value showed numerous examples of the various benefits
of the benefits is to be estimated). While the values produced by the ecosystems. Coral reefs generate
can often be adjusted for differences between the sites US$15,000–45,000 km–2 of healthy coral reef in the
(income differences, temporal differences, differences Philippines from sustainable fish production (White
in affected population, etc.), there is still the possibility et al., 2000), while, in the Seychelles, an estimate of
of an error in the estimated value. However, it can still US$88,000 total consumer surplus was generated for
provide a broad estimate of the value of the benefits 40,000 tourist visits to its marine parks (Mathieu et
delivered by ecosystem services (Johnston and al., 2003). Examining saltmarshes, King and Lester
Rosenberger, 2010). (1995) estimated £15.27 ha–1 year–1 net income from
livestock grazing in the UK, while, for the ecosystem
For a more detailed examination of the different types
service of lifecycle maintenance, US saltmarsh had
of economic valuation techniques that are applicable
values of US$6471 per acre and $981 per acre for
to valuing ecosystem services, the reader is directed
recreational fishing for the east and west coasts,
towards de Groot et al. (2002) or Hanley and Barbier
respectively, of Florida (Bell, 1997) and a marginal
(2009).
value product of US$0.19–1.89 per acre in a Gulf
While more primary valuation studies need to be Coast blue crab fishery (Freeman, 1991). For sand
undertaken for all ecosystem typologies, especially beaches and dunes, Huang et al. (2007) estimated a
within Europe, at a global scale terrestrial ecosystems WTP of US$4.45 per household for an erosion control
have been studied more than coastal and marine programme to preserve 8 km of beach in Maine and
ecosystems. There is often a clearer relationship New Hampshire. For recreation, a value of US$166
between terrestrial ecosystems and the benefits per trip or US$1574 per household/year was estimated
they produce compared with marine or some coastal for North Carolina beaches in the USA (Landry and
ecosystems, which tend to involve more non-linear Liu, 2009). This review showed that the various
(i.e. more complex) relationships between ecosystem ecosystem services provided by marine and coastal
functioning and the benefits they produce. Ecosystem ecosystems have high values associated with the
services, their benefits and the relationships between benefits they produce.
ecosystem functioning and the benefits produced have
Brenner et al. (2010) undertook a benefit transfer
been extensively studied for terrestrial ecosystems
for the coastal zone of the Catalan coast, which
such as forests (Garrod and Willis, 1992; Cullinan et
examined four coastal and marine ecosystem types
al., 2011) and wetlands (Bateman and Langford, 1997;
that covered 22% of the area under consideration.
Ghermandi et al., 2010).
The yearly ecosystem value was estimated to be
Despite there being a low number of marine and US$3.2 billion (2004) for the coastal area of Catalan.
coastal valuation studies relative to those for terrestrial In the UK, Lusetti et al. (2011) considered the
ecosystems, there have been increased attempts to value of managed coastal realignment scenarios
put values on the benefits generated by marine and (Humber estuary and Blackwater estuary) from an
6D. Norton et al. (2014-NC-MS-1)
ecosystem services perspective. The study found noting that, although the amounts of landings were
that for the Blackwater estuary there was a deep declining, the value of landings had been maintained
greening scenario that involved the creation of 10 at about €180 million. In the same report, the
times as much intertidal habitat (much of it saltmarsh, provisioning services of aquaculture production were
which could produce estimated net benefits of valued (€125 million) but, while seaweed and mäerl
£74.83 million). production and the regulating service related to the
prevention of harmful algal blooms were commented
Looking at non-use values, Eggert and Olsson (2009)
on, no value specific to an Irish context was available.
used a choice experiment with the attributes of
Hynes et al. (2012) undertook a valuation exercise
coastal cod stock levels, bathing water quality levels
for Galway Bay, which used value transfer combined
and biodiversity levels to estimate the values traded
with an ecosystem approach to estimate the values of
off between these aspects of a marine ecosystem.
different ecosystems and the services they provide.
McVittie and Moran (2010) also used a choice
The paper included a novel cultural adjustment
experiment to estimate the non-use values associated
approach, which showed that the lowest transfer error
with the introduction of marine conservation areas
was 50% of the tests when the cultural adjustment
within the UK. The McVittie and Moran study (2010)
was combined with a gross national income (GNI)
attributes included biodiversity, environmental benefits
adjustment. This study showed that the sea and
(such as carbon sequestration, water treatment and
beaches were the two most valuable ecosystems at
recreation) and restrictions to fishing and marine
€137.6 million and €45.3 million, respectively, using
extractive industries. They also argued that non-use
the combined GNI and cultural adjustment. The study
values compose a large segment of the values
also estimated, using the combined approach for the
associated with changes to the marine environment
benefit transfer, that waste treatment (€136.8 million),
because of their spatial remoteness relative to other
non-use value (€34.8 million) and recreation (€34.5
ecosystems.
million) were the most valuable ecosystem services for
Also in the UK, Beaumont et al. (2010) included an the area studied.
economic valuation of the benefits of many marine
In what follows, an assessment of Ireland’s marine
and coastal ecosystem services as part of the UK
and coastal ecosystem services and their values
NEA. For carbon sequestration, it was estimated that
are presented. Using the CICES system as a guide,
the current (2010) value is £19.9 million per year for
estimates for the quantity and value of provisioning,
ecosystems within the coastal margin and, for the
regulation and maintenance, and cultural ecosystem
marine waters in 2004, it was estimated to be worth
services were generated. In each case, those service
£6.7 billion per year. For fisheries, the estimated value
benefits that can be valued are presented under
was £596 million per year in 2008, while recreational
the headings of data source, methodology used
services were worth £17 billion based on 2002 data.
and results. We do not review those ecosystem
In Ireland, Bullock et al. (2008) undertook a valuation services in this technical report where insufficient
mainly of terrestrial ecosystem services particularly data are available to estimate the quantity of the
related to biodiversity but also included a section ecosystem service or the value. We also provide some
on marine and coastal ecosystems. Bullock et al. overarching guidelines for carrying out an ecosystem
(2008) examined the provisioning services of fisheries services assessment in Appendix 2.
72 Ireland’s Provisioning Marine Ecosystem Services
2.1 Offshore Capture Fisheries rectangles (0.5° latitude by 1.0° longitude). As there
is spatial overlap between datasets and they cannot
Ireland is located in UN Food and Agriculture
be aggregated, it was decided to follow the approach
Organization (FAO) major fishing area 27 (Atlantic,
taken by Gerristen and Lordan (2014).
Northeast), which covers 4% of the world’s ocean
surface area and accounts for 10% of the world’s The data used for the ICES statistical areas VIa and
capture fisheries, making it the second most VIIa were taken from the Annex IIa dataset and the
productive area in the world (OSPAR Commission, data used for ICES statistical areas VIb and VIIb–k
2009). The capture fisheries ecosystem service is were taken from the Western Waters dataset. The
measured in tonnes of fish landings and valued using Western Waters data were stripped of the BSA
market price data. (biologically sensitive area) data to avoid double
counting. Owing to concern about the quality of data
from boats under 15 m, which were traditionally not
2.1.1 Data source
required to have vessel monitoring systems (VMS,
The main data source for the capture fisheries is from used to allocate landings data across the rectangles),
the Scientific, Technical and Economic Committee for and boats under 10 m, which are not required to
Fisheries (STECF), which is the advisory body for the log their landings, only data from boats over 15 m
European Commission on fisheries management. The were used for the offshore capture fisheries. Boats
STECF in conjunction with the Joint Research Centre under 15 m are known as the inshore fleet and the
(JRC) and Member States under the Data Collection vast majority work in Irish territorial waters (less than
Framework (DCF) collects, manages and makes 12 nautical miles from the coast). The prices are based
available a wide range of fisheries data needed for on those reported by Gerristen and Lordan (2014) and
scientific advice. This disseminated data collected for the Marine Institute Stock Book (MI and BIM, 2015).
the evaluation of the fishing effort regimes is the main The reference year used is 2014. The Irish EEZ and
source of data for the analysis of offshore capture the ICES rectangles used to estimate the Irish wild
fisheries and can be downloaded from the JRC Data fisheries ecosystem services can be seen in Figure
Dissemination for Fisheries Dependent Information 2.1, and it is noted that some of these straddle the
web page.2 EEZ border between Ireland and the UK, which might
lead to a slight overestimate of the offshore capture
It is also noted that the STECF dataset covers only
fisheries caught by boats longer than 15 m in the Irish
data for EU landings. To look at non-EU fisheries
EEZ.
taking place in the Irish Exclusive Economic Zone
(EEZ), the International Council for the Exploration of For non-EU fisheries, the total tonnage for all
the Sea (ICES) data for ICES areas VI and VII was offshore capture fisheries for ICESs areas VI and
examined using the ICES Official Nominal Catches VII was examined in 2014 and is estimated at
2006–2013 dataset.3 1,690,622 tonnes. The EU took 1,138,595 tonnes and
the non-EU states (Russia, Norway, Faroe Islands,
Iceland and Greenland) took 546,076 tonnes. Of this,
2.1.2 Methodology
538,977 tonnes were blue whiting (Micromesistius
There are a number of STECF datasets that cover the poutassou; FAO code: WHB), making up 99% of the
north-east Atlantic area and include Ireland. The data non-EU catch in ICES areas VI and VII. No other
are available across various EU Member States and species was therefore considered.
are available at the spatial scale of ICES statistical
2 https://stecf.jrc.ec.europa.eu/dd/effort
3 http://www.ices.dk/marine-data/dataset-collections/Pages/Fish-catch-and-stock-assessment.aspx
8D. Norton et al. (2014-NC-MS-1)
Figure 2.1. The dark blue rectangles show which ICES rectangles were included in estimating the value of
Ireland’s offshore fisheries.
To estimate the non-EU blue whiting catch within the Table 2.1. Estimated annual landings and value for
Irish EEZ, maps of where blue whiting were caught capture fisheries within the Irish EEZ for vessels
showed that the vast bulk of the activity that occurred longer than 15 m
within the Irish EEZ was in ICES rectangles VII c2
Species Landings Estimated value (€)
and VI b2. ICES data for these areas showed that (tonnes)
the only non-EU fishing nation catching blue whiting
Hake 33,496 81,033,688
was Norway. From this data, it is estimated that
Blue whiting 159,398 77,784,715
approximately 80,000 tonnes of blue whiting was
Mackerel 101,522 75,123,471
caught by Norway in the Irish EEZ in 2014. Note that
Nephrops 9639 52,459,978
non-EU catches are not accounted for in the maps in
Anglerfish/monkfish 15,757 51,296,108
this report, which rely on STECF data alone.
Horse mackerel 67,266 42,684,084
Megrim 8098 24,379,551
2.1.3 Results Albacore tuna 9864 18,279,184
Whiting 7415 8,439,412
Table 2.1 shows a breakdown of the species landed
Haddock 4718 7,818,730
from waters within the Irish EEZ for all vessels Herring 19,111 5,749,079
greater than 15 m, ordered by value. As there were Cod 1868 4,518,946
no individual-level prices available for some species, Scallop 1357 2,683,604
these were aggregated with “other species” from the Saithe 1196 2,196,076
STECF data, which means that the category “other Witch 1064 2,093,086
species” is not included in the value of landings. This Ling 1696 2,074,902
group makes up less than 0.3% of the offshore capture Boarfish 16,491 2,020,027
fisheries by landings and its value would be expected Sole 221 1,973,941
to be less than 2% of the total value of the offshore Ray and skate 1435 1,850,055
capture fisheries by boats longer than 15 m. It is Turbot 194 1,535,826
estimated that the top 10 valued species make up over Lemon sole 518 1,363,738
90% of the total value.
9You can also read