Editor's Corner Steve Platnick EOS Senior Project Scientist - June 2018. Volume 30, Issue 3.
←
→
Page content transcription
If your browser does not render page correctly, please read the page content below
National Aeronautics and Space Administration

                                                                                                                                the earth observer
The Earth Observer. May - June 2018. Volume 30, Issue 3.

      Editor’s Corner
      Steve Platnick
      EOS Senior Project Scientist

On May 22, 2018 at 12:47 PM PDT (3:47 PM EDT), the Gravity Recovery and Climate Experiment
Follow-On (GRACE-FO) mission launched from Vandenberg Air Force Base in California aboard a SpaceX
Falcon 9 launch vehicle—see launch photo below—as a shared ride with five Iridium NEXT communications
satellites. The twin GRACE-FO satellites successfully separated from the spacecraft over the Pacific Ocean and
are now slowly drifting toward their operational positions.

Like its predecessor, GRACE-FO uses a microwave ranging link—called the Microwave Instrument (MWI)—
to determine the precise separation distance between two identical satellites orbiting Earth about 220 km
(137 mi) apart at an initial altitude of approximately 490 km (305 mi). The MWI, using two frequencies at
24 GHz (K-band) and 32 GHz (Ka-band), is capable of measuring the distance between the two satellites to
within one micrometer.

The changes in separation distance, tracked over time, can be used to create maps of Earth’s gravity field at least
every 30 days, which allows for tracking of changes in Earth’s near-surface mass. In addition, each of the satel-
lites will use GPS antennas to supply at least 200 profiles of atmospheric temperature distribution and water
vapor content daily—see Measuring Atmospheric Temperature and Humidity on page 8 of this issue.
                                                                                                        continued on page 2

The Gravity Recovery and Climate Experiment Follow-On (GRACE-FO) mission launched onboard a SpaceX Falcon 9 rocket,
Tuesday, May 22, 2018, at 12:47 PM PDT (3:47 PM EDT) from Space Launch Complex 4E at Vandenberg Air Force Base in California.
Photo credit: NASA/Bill Ingalls                                                                                                   www.nasa.gov
02            The Earth Observer                                      May - June 2018                                    Volume 30, Issue 3

editor's corner
                       In This Issue
                       Editor’s Corner                              Front Cover       In the News
                                                                                          NASA Mapping Hurricane Damage to
                       Feature Articles                                                     Everglades, Puerto Rico Forests                   31
                                                                                          NASA’s New Space ‘Botanist’ Arrives
                          GRACE-FO: Tracking Earth's Mass
                                                                                            at Launch Site                                    33
                            in Motion                                            4
                                                                                          Tiny Sea Creatures Hold Secrets to
                          Celebrating Earth Day with NASA:
                                                                                            Earth’s Climate                                   35
                            “The Best Day Ever!”                                13
                                                                                      Regular Features
                       Meeting Summaries
                                                                                          NASA Earth Science in the News                      37
                          Summary of the 2018 Sun-Climate
                                                                                          Science Calendars                                   39
                            Symposium                                           21
                          2018 Arctic-Boreal Vulnerability
                                                                                      Reminder: To view newsletter images in color,
                            Experiment (ABoVE) Open Science
                                                                                        visit eospso.nasa.gov/earth-observer-archive.
                            Team Meeting Summary                                28

                  GRACE-FO also tests a new experimental ranging                      ECOSTRESS is expected to provide key insights
                  technology that uses lasers instead of microwaves—                  into how plants respond to heat and water stress by
                  called the Laser Ranging Interferometer (LRI). While                measuring evapotranspiration (ET).2 These measure-
                  the new technology provides a stepping stone to future              ments allow scientists to understand the way in which
                  missions, it also measures changes in the angle between             plants respond to changing water availability. In addi-
                  the two spacecraft and thus enhances conventional                   tion, scientists hope to determine how changes in ET
                  microwave-ranging observations. Together, the very                  throughout the day affect plant growth.
                  precise measurements of location, force, and orbital
                  change translate into an observation of gravity with                In practical terms, the year of data anticipated from
                  improved accuracy. Congratulations to the entire                    ECOSTRESS will also be useful for agricultural water
                  GRACE-FO team! Please turn to page 4 of this issue to               managers. By working with the USDA and other part-
                  learn more about the mission.                                       nering organizations, the ECOSTRESS team will
                                                                                      advance our understanding of how key regions are
                  NASA is preparing to launch two instruments to                      affected by drought conditions and evaluate ways in
                  the International Space Station (ISS) this year:                    which water management communities can make more
                  the ECOsystem Spaceborne Thermal Radiometer                         efficient use of water resources for agriculture. The high
                  Experiment on Space Station (ECOSTRESS) and the                     spatial resolution of ECOSTRESS data will be particu-
                  Global Ecosystem Dynamics Investigation (GEDI,                      larly useful for research on the effects of drought on
                  pronounced like “Jedi” of Star Wars fame).1                         agriculture at the field-scale. While ECOSTRESS data
                                                                                      will initially be used to address key ecosystem questions,
                  ECOSTRESS was delivered to Kennedy Space Center                     they can also be used for a range of other applications
                  on April 9, 2018, where it is in final preparations for             such as studying volcanic activity, urban heat stress and
                  launch to the ISS aboard the SpaceX-15 commercial                   heat waves, and surface temperature for ecosystem and
                  resupply mission (CRS-15), currently scheduled to                   resource management.
                  launch no earlier than June 28, 2018. ECOSTRESS
                  will be robotically installed on the exterior of the                ECOSTRESS was built at and is managed by JPL, with
                  station’s Japanese Experiment Module–External Facility              Simon Hook serving as Principal Investigator (PI). To
                  (JEM-EF) site 10 as soon as it arrives at the ISS.                  learn more about the current status of the mission as it
                                                                                      prepares for launch, please see the News story on page 33
                  1
                    Both ECOSTRESS and GEDI were selected in 2014 as the              of this issue.3
                  winning proposals from the Earth Venture Instrument-2 (EVI-
                  2) Announcement of Opportunity. Earth Venture is run by             2
                                                                                        Evapotranspiration is the combined effects of transpiration,
                  NASA’s Earth System Science Pathfinder program, which over-         the process plants use to release water in order to regulate heat
                  sees a portfolio of projects ranging from satellites, instruments   (similar to the way humans perspire) and evaporation of water
                  on the space station, and suborbital field campaigns on Earth       from the soil.
                  that are designed to be lower-cost and more focused in scope        3
                                                                                        To learn more about ECOSTRESS, visit https://ecostress.jpl.
                  than larger, free-flying satellite missions.                        nasa.gov.
The Earth Observer May - June 2018 Volume 30, Issue 3 03
Meanwhile, GEDI is also now on an accelerated track an unprecedented opportunity to better understand the
editor's corner
for launch, after being moved from the SpaceX CRS-18 Earth’s vegetation.5
mission, which is now delayed to May 2019, to SpaceX
CRS-16, which is currently scheduled for a November With regard to the status of ongoing missions, in our
2018 launch. The move to an earlier launch window last issue, we reported that, on February 22, 2018,
is possible because the GEDI team’s plan all along had CloudSat successfully exited the Afternoon “A-Train”
been to have the GEDI instrument ready to launch by constellation via two thruster burns that placed the
this fall. The lidar instrument is now undergoing final satellite in an orbit below the altitude of the A-Train
integration and testing at GSFC. and near the CALIPSO graveyard orbit—the orbit alti-
tude that will be used by the CALIPSO spacecraft for
While NASA has flown multiple Earth-observing lidars eventual end-of-life operations.6 We are delighted to
in space (e.g., ICESat and CALIPSO) GEDI will be report that CloudSat resumed taking data in Daytime-
the first to provide high-resolution laser ranging of Only Operations (DO-Op) mode from its new position
Earth’s forests. Like ECOSTRESS, it will be robotically on May 7, 2018. The satellite is successfully operating
installed on the exterior of the station’s JEM-EF site 6. with three of four reaction wheels, and has full capa-
That perch will be the perfect vantage point from which bility to make both large and small on-orbit maneu-
to measure the structure of Earth’s tropical and temper- vers. The CloudSat and CALIPSO teams are discuss-
ate forests in high resolution and in three dimensions. ing future operational plans, including an option for
These measurements will help fill in critical gaps in both CALIPSO and CloudSat to fly at the CALIPSO
scientists’ understanding of how much carbon is stored graveyard orbit and resume formation-flying under the
in the world’s forests, the potential for ecosystems to A-Train. A decision has not yet been reached.
absorb rising concentrations of CO2 in Earth’s atmo-
sphere, and the impact of forest changes on biodiversity. Last but not least, as it has done for the past six years,
NASA participated in Earth Day activities held April
The University of Maryland, College Park is leading 19-20 at Union Station in Washington, DC. This year’s
development of GEDI, with Ralph Dubayah serving theme was Amazing Technology. The event featured 23
as Principal Investigator; the instrument is being built hands-on activities that ran the gamut from virtual real-
at GSFC.4 ity experiences, to classifying coral using a touchscreen
interface, to using a handheld spectrometer to test the
Coincident GEDI and ECOSTRESS measurements reflectance of different vegetables. The centerpiece of
provide a unique synergy to address ecosystem dynamics the outreach, as it is with many NASA exhibits, was
questions that cannot be answered using the instruments the Hyperwall—a nine screen, high definition video
independently. The measurements from ECOSTRESS wall—where NASA’s senior management, scientists,
will provide information on the plant’s function, evapo- and outreach representatives delivered 40 multime-
ration, and its water-use efficiency. GEDI will provide dia stories over the course of the two-day event. Each
information on the vegetation structure. Together story lasted about 15 minutes, covering a variety of
these data can be used to obtain a better understand- Earth-science, heliophysics, planetary, and space-science
ing of canopy functional traits and the global carbon topics. This was an extremely successful outreach event
sink potential. These data will be further complemented for NASA. Many thanks to all participants and the
with data from two other instruments scheduled for Science Communications Support Office for organizing
launch to the ISS in 2019: NASA’s Orbiting Carbon this activity each year. Turn to page 13 of this issue to
Observatory-3 (OCO-3) and the Japanese METI's learn more about this year’s Earth Day.
Hyperspectral Imager Suite (HISUI). These instruments
will collect information on vegetation functional traits
and chemical composition through high-spectral-resolu- 5
To learn more about the potential synergies between GEDI,
tion measurements. Together these datasets will provide ECOSTRESS, OCO-3, and HISUI, see the article by
Stavros et al. in the June 22, 2017 issue of Nature Ecology &
Evolution—https://www.nature.com/articles/s41559-017-0194.
6
To learn more, see “CloudSat Exits the A-Train” in the
4
To read a recent more detailed summary of the status of
March–April 2018 issue of The Earth Observer [Volume 30,
GEDI, see the “Summary of the Fourth GEDI Science
Issue 2, p. 4].
Definition Team Meeting” in the March–April 2018 issue of
The Earth Observer [Volume 30, Issue 2, pp. 17-19—https://
eospso.nasa.gov/sites/default/files/eo_pdfs/Mar_Apr_2018_
color%20508_0.pdf]. There was also a more recent NASA
press release available at https://www.nasa.gov/feature/ Note: List of undefined acronyms from the Editor’s Corner and the
goddard/2018/may-the-forest-be-with-you-gedi-to-launch-to-iss. Table of Contents can be found on page 36.
04             The Earth Observer                                    May - June 2018                                  Volume 30, Issue 3

                       GRACE-FO: Tracking Earth's Mass in Motion
feature articles
                    EDITOR’S NOTE: This feature content is taken from the GRACE-FO pre-launch mission brochure (https://
                    eospso.gsfc.nasa.gov/sites/default/files/publications/GRACE_FO%20Mission%20Brochure_508.pdf). While the intent
                    is to reprint it with its original content largely intact, it has been modified slightly to match the style used in The
                    Earth Observer, and to fit the layout space allocated for it.

                   But regardless of                  Mass Transport and Gravity Change On Earth
                   whether water is solid,            Panta rhei—“Everything flows.” These famous words by the Greek philosopher
                   liquid, or vapor, visible          Heraclitus express the truth that our complex world is ever changing and evolving.
                   or invisible, it has one           Even Earth’s gravity field is continually changing. The pull of gravity varies naturally
                   attribute that does                from place to place on Earth, depending on the mass distribution; greater mass exerts
                   not change: its mass.              a stronger gravitational pull. But gravity also changes constantly as mass moves. While
                   Because everything that            the masses of Earth’s land features, such as mountains and valleys, change relatively
                   has mass inevitably has            slowly, the amount of water above, on, or below a particular location can vary season-
                   a gravitational pull               ally, monthly, weekly, and even daily as water cycles between the subsystems (e.g.,
                   associated with it, a              atmosphere, land, ocean, glaciers, polar ice caps, and underground).
                   unique twin satellite              On Earth, the processes that couple and transport water and energy are fundamental
                   observing system has               to today’s most pressing climate science challenges. However, keeping track of Earth’s
                   been used to measure               evolving water system is a formidable task. Water constantly changes its shape, form,
                   the changing forces of             and state as it cycles between the ocean, atmosphere, and land—see Figure 1. It is in
                   gravity to track and               plain sight in lakes, rivers, and seas. It infiltrates the soil and groundwater. It accumu-
                   follow Earth’s water               lates on the ground as snow and can be stored as ice in glaciers and ice sheets, some-
                   masses from the top of             times for hundreds and thousands of years. This makes it challenging to comprehen-
                                                      sively observe and measure how much water cycles between Earth’s subsystems. But
                   the Himalayas to the
                                                      regardless of whether water is solid, liquid, or vapor, visible or invisible, it has one
                   deepest ocean depths
                                                      attribute that does not change: its mass. Because everything that has mass inevita-
                   and deep underground.              bly has a gravitational pull associated with it, a unique twin satellite observing system
                                                      has been used to measure the changing forces of gravity to track and follow Earth’s
                                                      water masses from the top of the Himalayas to the deepest ocean depths and deep
                                                      underground. The measurements contribute to the assessment and monitoring of the
                                                      Earth's heat and sea level budgets.

                   Figure 1. Changes in
                   Earth’s gravity field are due
                   primarily to variations in water
                   content as it moves through
                   the water cycle—one of Earth’s
                   most powerful systems. Earth’s
                   gravity field is continually
                   changing, mostly (but not
                   solely) due to seasonal and
                   climatic changes in water stor-
                   age and flow. Image credit:
                   NASA/JPL-Caltech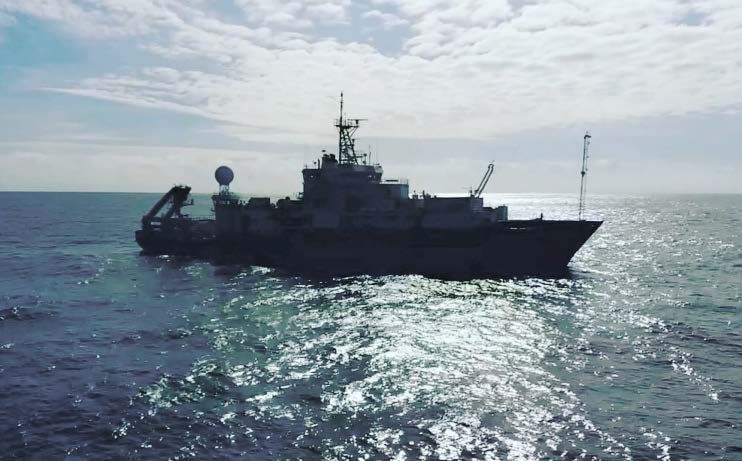
The Earth Observer May - June 2018 Volume 30, Issue 3 05
Given that the force of gravity is an ever-present driv-
feature articles
ing force in the Earth system, it should come as no
surprise that people have sought to describe and quan-
tify its static component since ancient times. These
efforts led to the development of the field of geodesy,
the science branch that accurately measures the size and
shape of Earth, defined by Earth's geometry and grav-
ity field, and Earth’s position and orientation in space.
The field of geodesy took a major leap forward in
2002, when NASA and the German Aerospace Center
(DLR) launched the Gravity Recovery and Climate
Experiment (GRACE) satellite mission to map Earth’s
static gravitational field and how it changes from
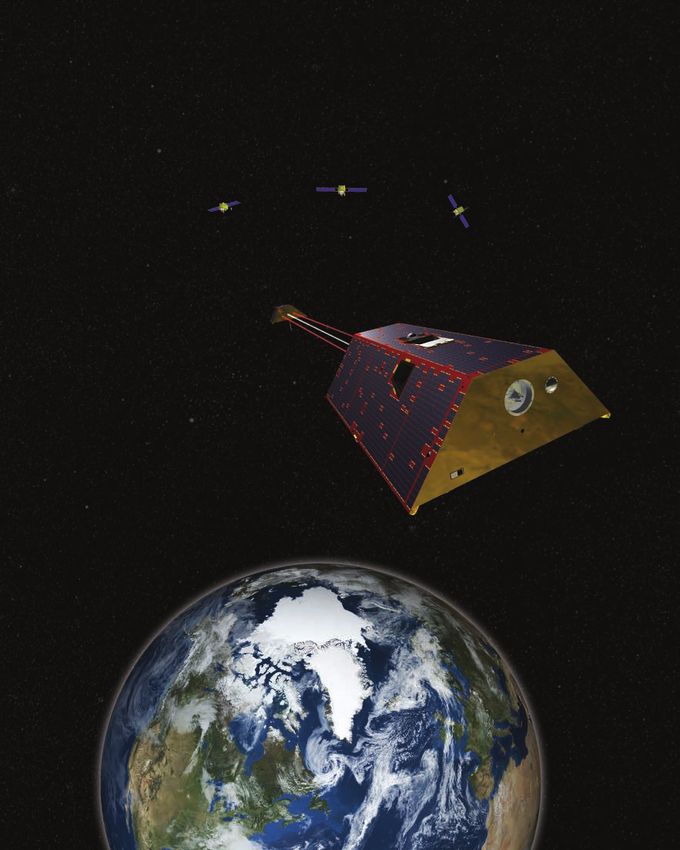
Artist’s conception of
month to month. Circling the planet every 90 minutes for over 15 years at an altitude the Gravity Recovery
of 350-500 km (about 217-310 mi), the twin GRACE spacecraft closely tracked how and Climate Experiment
their relative positions in space are affected by Earth’s gravity. Follow-On (GRACE-FO)
satellites in orbit around the
GRACE’s monthly maps of regional gravity variations provided new insights into how Earth. Image credit: NASA
the Earth system functions and responds to change. Among its innovations, GRACE
for the first time measured the loss of ice mass from Greenland and Antarctica—see
Figure 2; improved our understanding of the processes responsible for sea level rise
and ocean circulation; provided insights into where global groundwater resources During its operation,
may be shrinking or growing, where dry soils are contributing to drought and even GRACE provided
forest fires; and monitored changes in the solid Earth (e.g., from earthquakes).1 After truly global gravity
more than 15 productive years in orbit—lasting three times longer than originally
measurements 100
planned—the satellite mission ended science operations in late 2017. During its oper-
ation, GRACE provided truly global gravity measurements 100 times more accurate, times more accurate,
and at spatial and temporal resolution higher, than had ever been achieved before and at spatial and
from space, providing the much-needed measurements for characterizing how water is temporal resolution
transported and cycled through the Earth system. higher, than had ever
been achieved before
The GRACE Follow-On (GRACE-FO) mission will continue GRACE’s legacy. from space, providing
Monitoring changes in ice sheets and glaciers, underground water storage, the amount
the much-needed
of water in large lakes and rivers, and changes in sea level, provides a unique view of
Earth’s evolving climate as well as its water and energy cycles, with far-reaching bene-
measurements for
fits for its people. Measuring the redistribution and transport of mass around Earth is characterizing how
an essential observation for understanding current and future changes of the Earth’s water is transported
hydrosphere and its subcomponents. and cycled through the
1
To learn more, read "GRACE Mission: 15 Years of Watching Water on Earth" online at https://
Earth system.
gracefo.jpl.nasa.gov/news/117/grace-mission-15-years-of-watching-water-on-earth.
GRACE Observations of Antarctic Ice Mass Changes
Figure 2. The mass of the Antarctic ice sheet has changed over the last several years. Research based on
observations from GRACE indicates that between 2002 and 2016, Antarctica shed approximately 125 giga- Antarctic Ice Loss
tons of ice per year, causing global sea level to rise by 0.35 mm (0.01 in) per year. Image credit: NASA/ (meters water equivalent relative to 2002)
JPL-Caltech/University of California, Irvine -3 -2 -1 0 1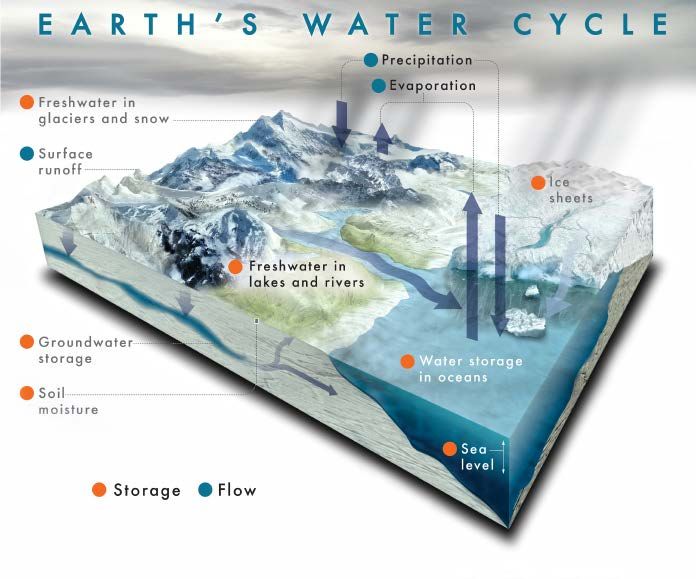
06             The Earth Observer                                                        May - June 2018                                 Volume 30, Issue 3

                                                                        The First GRACE Mission: A Legacy of Discoveries
feature articles
                                                                        "Revolutionary" is a word you hear often when people talk about the first GRACE
                                                                        mission. The twin GRACE satellites, launched on March 17, 2002, have transformed
                   The twin GRACE
                                                                        scientists' view of how water moves and cycles between the ocean, land, and atmo-
                   satellites, launched                                 sphere, and how water storage and availability are affected by droughts, floods, and
                   on March 17, 2002,                                   human intervention.
                   have transformed
                   scientists' view of how                              In March 2017, GRACE celebrated the fifteenth anniversary of its launch. The
                   water moves and cycles                               discoveries achieved using GRACE data reflect the work of researchers worldwide,
                   between the ocean, land                              who have developed innovative techniques to use the data and combine them with
                                                                        other observations and models for new insights into complex Earth system processes,
                   and atmosphere, and
                                                                        as well as for applications.
                   how water storage and
                   availability are affected                            Melting Ice Sheets
                   by droughts, floods, and
                                                                        Antarctica is one of the world's toughest places to collect data, and Greenland isn't far
                   human intervention.
                                                                        behind. Measuring how fast these ice sheets are melting is crucial to better understand rates
                                                                        and variations of sea level rise around the world. In the mid-2000s, GRACE data were used
                                                                        to clearly show that ice losses from Greenland and Antarctica were significantly larger than
                                                                        previous estimates from more indirect observations had suggested. Since GRACE launched,
                                                                        its measurements show Greenland has been losing about 280 gigatons of ice per year on
                                                                        average—see Figure 3—and Antarctica has lost approximately 125 gigatons a year with
                                                                        indications that both melt rates are increasing. To give perspective on how much water this
                                                                        is, a single gigaton of water would fill about 400,000 Olympic-sized swimming pools!

                                                                                  GRACE Observations of Greenland Ice Mass Changes

                                 Greenland Ice Loss
                        (meters water equivalent relative to 2002)

                   -4       -3          -2         -1           0 0.5

                   Figure 3. Research based on observations from the GRACE satellites indicates that between 2002 and 2016, Greenland shed approximately
                   280 gigatons of ice per year, causing global sea level to rise by 0.8 mm (0.03 in) per year. This image, created from GRACE data, shows changes
                   in Greenland ice mass from 2002 to 2016. Darkest shades indicate areas that lost ice mass. The largest mass decreases of up to 30 cm (11.8 in)
                   (equivalent-water-height) per year occurred along the West Greenland coast. Image credit: NASA

                                                                        Underground Water

                                                                        Water stored in soil and aquifers below Earth's surface is sparsely measured world-
                                                                        wide. Before GRACE, hydrologists were skeptical if they would be able to use the
                                                                        data to reveal unknown groundwater depletion. However, over the last decade, by
                                                                        measuring mass changes with GRACE, scientists from NASA and around the world
                                                                        have found more and more locations where humans are pumping out groundwater
                                                                        faster than it is replenished. For example, in 2015, a team of researchers published a
                                                                        comprehensive survey showing a third of Earth's largest groundwater basins
                                                                        are being rapidly depleted—see Figure 4 on page 7. Adding the GRACE data to other
                                                                        existing sources of hydrological data has led to the development of a more efficient
                                                                        and sustainable approach to water management.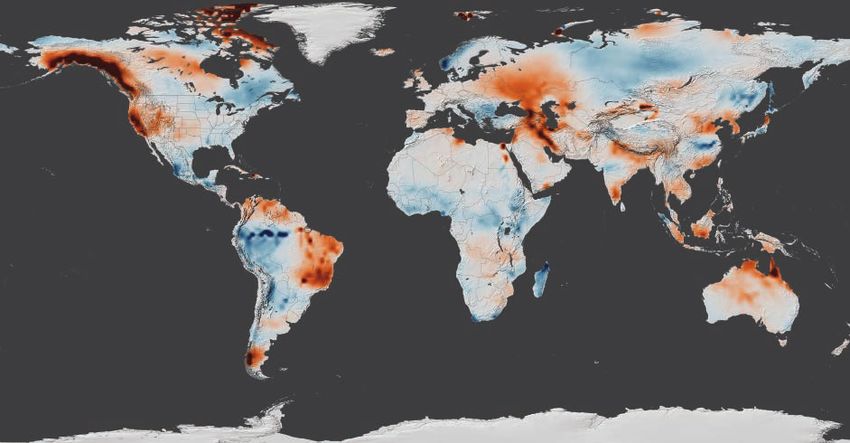
The Earth Observer                                May - June 2018                               Volume 30, Issue 3                  07

                                                                                                                                feature articles
Dry soils can add to drought risk or increase the length of a drought. To help moni-        Figure 4. The gravity variations
tor these changes, NASA provided data on deep soil moisture and groundwater from            measured by GRACE can be
                                                                                            used to determine water storage
GRACE to the National Drought Mitigation Center each week, using a hydrology                on land. By comparing current
model to calculate how the moisture was changing throughout the month between one           data to an average over time,
map and the next. These data were used to prepare weekly maps of U.S. drought risk.         scientists can generate an anom-
                                                                                            aly map to see where terrestrial
Sea Level                                                                                   water storage has decreased or
                                                                                            increased. This map, created
                                                                                            using GRACE data, shows the
Sea level is rising because melting ice from land is flowing into the ocean and seawa-
                                                                                            global terrestrial water storage
ter is expanding as it warms. Since 1992, very precise, continuous measurements of          anomaly in April 2015, rela-
sea level heights worldwide have been made by the NASA-Centre National d'Études             tive to the 2002-2015 mean.
Spatiales (CNES) Topography Experiment (TOPEX)/Poseidon mission and the succes-             Rust colored areas show where
                                                                                            water has decreased, and areas
sor Jason series of sea level altimetry missions. Altimeter measurements show how
                                                                                            in blue are where water levels
much sea level has risen, but not what causes it to rise—i.e., how much of the observed     have increased. The significant
rise is from thermal expansion of seawater and how much is from increased volume due        decreases in water storage across
to ice melting and land runoff.                                                             most of California are related
                                                                                            to groundwater, while decreases
GRACE measured the monthly mass change of the ocean, and these data have enabled            along the Alaska coastline are
                                                                                            due to glacier melt. Image
us to distinguish between changes in water mass and changes in ocean temperatures.          credit: NASA's Scientific
An example of the value of this ability was a study that documented a sizable—if            Visualization Studio
temporary—drop in sea level and linked it to changes in the global water cycle that
was disrupted by the large La Niña event in 2011. The study showed that the water
that evaporated from the warm ocean, causing the drop in sea level, was mostly rained
out over Australia, South America, and Asia. The finding provided a new view into the
dynamics and connections that shape the global water cycle.

Ocean Currents

When combined with measurements from sea-surface-height-measuring satellite altim-
eters, GRACE observations have greatly improved the precision of ocean current esti-
mates. Beyond this classic application for ocean currents, GRACE observations have also
directly been used to assess changes of large-scale current systems. At the bottom of the
atmosphere—i.e., on Earth's surface—changes in air pressure (a measure of air’s mass)
tell us about flowing air, or wind. At the bottom of the ocean, changes in water pres-
sure tell us about flowing water, or currents. A team of scientists at NASA developed a
way to isolate the signal found in GRACE data indicating tiny pressure differences at
the ocean bottom that are caused by changes in deep ocean currents. The measurements
showed that a significant weakening in the overturning circulation, which a network of
ocean buoys recorded in the winter of 2009-10, extended several thousand miles north
08             The Earth Observer                               May - June 2018                                 Volume 30, Issue 3

                                                 and south of the buoys' latitude near 26° N. The new measurements from GRACE
feature articles
                    GRACE-FO                     agreed well with estimates from the buoy network, confirming that the technique can
                    Mission Objectives           be expanded to provide estimates throughout the Atlantic and beyond. Because ocean
                                                 currents distribute heat across the planet, any changes in ocean currents are important
                    The primary
                                                 indicators of how our planet is responding and evolving in a warming climate.
                    objective is to
                    continue the high-           Solid Earth Changes
                    resolution monthly
                    global maps of               The viscous mantle under Earth's crust is also moving ever so slightly in response to
                    Earth's gravity field        mass changes from water near the surface. GRACE has a community of users that
                    and surface mass             seek to quantify these shifts. Scientists at NASA used GRACE data to calculate how
                    changes of the               ice sheet loss and groundwater depletion have actually changed the rotation of Earth
                    original GRACE               as the system adjusts to these movements of mass. Like a spinning top, any change in
                    mission over a               the distribution of mass will cause Earth’s axis to shift, wobble, and readjust. GRACE
                    period of five years.        helps to pinpoint those rotation changes and understand their causes.

                    The secondary                In addition, some large earthquakes move enough mass for GRACE to detect.
                    objectives are to            During 15 years in orbit, GRACE was able to measure the instantaneous mass shifts
                    demonstrate the              from several large earthquakes and monitor the large but slow tectonic mass adjust-
                    effectiveness of a           ments that go on for months and even years after an earthquake. These measurements
                    novel Laser Ranging          provide unprecedented insights into what is happening far below Earth's surface
                    Interferometer               during and after big quakes, such as the 2004 Sumatra event and 2011 Tohuku
                    (LRI) in improving           (Japan) quake, both of which caused devastating tsunamis.
                    the Satellite-to-
                    Satellite Tracking           GRACE Follow-On: Mission Overview
                    (SST) measurement            The GRACE Follow-On joint mission by NASA and the German Research Centre
                    performance, laying          for Geosciences (GFZ) will continue the successful GRACE data record. The
                    the groundwork               GRACE-FO mission builds on and extends the capabilities of its predecessor, and also
                    for improved                 includes an experimental instrument that promises to be more accurate and allows for
                    future space-                the detection of even smaller gravitational signals—see GRACE-FO Mission Objectives.
                    gravimetry missions.         In orbit, the twin satellites will provide accurate measurements of changes in Earth's
                    GRACE-FO will                gravitational field at least every 30 days, and allow for the tracking of changes and
                    also continue                redistribution in Earth’s near-surface mass. In addition, each of the satellites will use
                    measurements of              global positioning system (GPS) antennas to supply at least 200 profiles of atmo-
                    radio occultations           spheric temperature distribution and water vapor content daily—see Measuring
                    for operational              Atmospheric Temperature and Humidity.
                    provision of vertical
                    atmospheric                  Like its predecessor, the GRACE-FO mission consists of two identical satellites orbit-
                    temperature and              ing Earth at about 220 km (137 mi) apart at an initial altitude of approximately 490
                    humidity profiles to         km (305 mi). One of the unique aspects of GRACE and GRACE-FO is that the satel-
                    weather services.            lites themselves are effectively the “instruments.” Unlike other Earth-observing satellites
                                                 equipped with instruments pointing down at Earth’s surface, the GRACE-FO satel-
                                                 lites instead “look” at each other. Together, they represent a single measurement system.

                     Measuring Atmospheric Temperature and Humidity

                     While the main global positioning system (GPS) receivers on the first GRACE mission were used for precise orbit
                     determination, a set of secondary GPS antennas measured the bending of the signals between GRACE and GPS
                     satellites that were low over the horizon. This way, the GPS signals graze and pass through Earth’s atmosphere—
                     known as occultation. The GPS radio waves are altered slightly as they pass through the atmosphere due to refrac-
                     tive effects, and these changes can be analyzed to create atmospheric profiles including refractivity, temperature,
                     pressure, and humidity. Radio occultation measurements complement and continue a long series of similar data
                     obtained by sensors on other satellites and are very useful for weather forecasting and climate studies.

                     GRACE-FO will provide at least 200 daily near-real-time occultation observations from each satellite—data
                     that are used operationally worldwide by leading weather centers to improve global weather forecasts. Over
                     longer time scales, the GPS radio-occultation data are contributing to climate variability studies.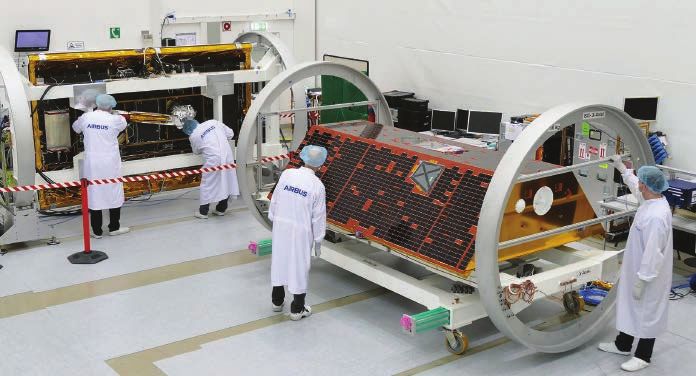
The Earth Observer                                May - June 2018                              Volume 30, Issue 3                   09
One satellite will follow the other along the same polar orbit, with both continually

                                                                                                                                feature articles
sending ranging signals to each other and carefully tracking any changes in the distance
between the two satellites. When the GRACE-FO satellites encounter a change in the
distribution of Earth’s mass—such as a mountain range or reduced mass of under-
ground water—the distance between the two satellites will change—see Figure 5. By
precisely and continuously tracking this change to within a fraction of the thickness of
a human hair during each orbit every month, regionally and temporally varying gravity
changes can be measured with high precision.

                                                                                           Figure 5. How GRACE-FO
                                                                                           Works. This simplified exam-
                                                                                           ple illustrates the movements
                                                                                           of the satellites as they pass
                                                                                           southward from the Caribbean
                                                                                           Sea across Colombia and Peru
                                                                                           (i.e., a denser landmass) to
                                                                                           the Pacific Ocean. The two
                                                                                           satellites begin over the ocean
                                                                                           (Panel 1), but when the lead-
                                                                                           ing spacecraft encounters land,
                                                                                           the land’s higher gravity pulls
                                                                                           it away from the trailing space-
                                                                                           craft, which is still over water
                                                                                           (Panel 2). Once the second
                                                                                           satellite encounters the land, it
                                                                                           too is pulled toward the mass
                                                                                           and consequently toward the
                                                                                           leading spacecraft (Panel 3).
                                                                                           When the lead spacecraft moves
                                                                                           back over water, it is pulled
                                                                                           back slightly by the land, while
                                                                                           the trailing spacecraft contin-
                                                                                           ues over the land. Once both
                                                                                           spacecraft are back over water,
                                                                                           the trailing spacecraft is slowed
                                                                                           by the land (Panel 4) before
                                                                                           returning to its original distance
                                                                                           behind the leading spacecraft.
                                                                                           Image credit: NASA

GRACE-FO will be able to make accurate measurements, thanks in part to the inno-
vative use of two technologies: a microwave ranging system based on GPS technology,
and a very sensitive accelerometer—an instrument that measures
the forces on the satellites besides gravity (e.g., atmospheric
drag or solar pressure). GRACE-FO will use the same two-                  MWI
                                                                             |
way microwave-ranging link as GRACE, called the Microwave                  |
Instrument (MWI). The MWI operates using two frequen-                     LRI

cies—at 24 GHz (K-band) and 32 GHz (Ka-band)—and is
capable of measuring the distance between the two satellites
to within one micron—about the diameter of a blood cell, or
a small fraction of the width of a human hair. This allowed
the GRACE satellites to detect gravitational differences on the
planet's surface with a precision equivalent to a change of 1 cm
(0.4 in) in water height across areas of about 340 km (approxi-
mately 211 mi) in diameter.

With the same kind of microwave ranging system, GRACE-FO satellites can expect             Figure 6. The experimental
                                                                                           Laser Ranging Interferometer
to achieve a similar level of inter-satellite ranging precision. But they will also test   (LRI) is expected to provide
and demonstrate an experimental instrument using lasers instead of microwaves,             better ranging precision
which promises to improve the precision of the separation distance measurements on         than GRACE’s MWI system.
future generations of GRACE satellites by a factor of about 20, thanks to the laser’s      LRI is being tested on
                                                                                           GRACE-FO as an enabling
higher frequencies. The instrument, developed jointly between NASA’s Jet Propulsion        technology for the next genera-
Laboratory, the Max Planck Institut für Gravitationsphysik (Germany), and GFZ, is          tion of mass-change missions.
called the Laser Ranging Interferometer (LRI)—see Figure 6. The LRI is a stepping          Image credit: NASA
10             The Earth Observer                               May - June 2018                                         Volume 30, Issue 3

                                               stone for future missions to enhance gravity measurements. It will also measure changes
feature articles
                         GRACE-FO              in the angle between the two spacecraft and thus support the conventional microwave-
                         at a Glance
                                               ranging observations. Together, the very precise measurements of location, force, and
                                               orbital change translate into an observation of gravity with improved accuracy.
                    Size (of each satellite)
                                               Spacecraft Design and Launch
                         1.94 m wide,
                         3.12 m long,          The GRACE-FO satellites follow the successful design of the original GRACE space-
                         0.72 m high           craft. Each identical satellite is 1.94 m (6.36 ft) wide, 3.12 m (10.25 ft) long, and 0.72
                                               m (2.36 ft) high, with a mass of 600 kg (1,323 lbs). Both spacecraft are covered in
                                               solar panel arrays that power the satellites.
                             Mass
                                               The GRACE-FO satellites will be launched together from Vandenberg Air Force Base
                            600 kg             in California into Earth orbit on a SpaceX Falcon 9 launch vehicle as a shared ride with
                                               five communications satellites. The GRACE-FO satellites will be deployed first from the
                                               launch vehicle into a low-Earth,
                            Power              near-polar orbit, after which the
                                               launch vehicle will continue on
                          Solar cells          to a higher orbital altitude before
                                               releasing the communications
                                               satellites.
                           Altitude
                                               The GRACE-FO twin satel-
                         490 ± 10 km           lites, after release at an altitude
                                               of about 490 km (305 mi), will
                                               be maneuvered to a separa-
                           Velocity            tion distance of about 220 km
                                               (137 mi) apart. As the satellites
                         ~7.5 km/sec           circle Earth, the ranging tech-
                                               nology will measure separation
                                               between the satellites at the
                          Inclination          micrometer level, and the GPS
                                               sensor will provide the location
                              89°              of the satellites in their orbits.
                                               These observations will then be
                                               combined and processed using
                            Orbit              supercomputers to estimate                 GRACE-FO launched aboard a SpaceX Falcon 9 from
                                               month-to-month gravity and                 Vandenberg Air Force Base in California on May 22, 2018.
                          Polar orbit
                                               surface mass variations.                   Pictured here on the Vandenberg launch pad is a Falcon 9 rocket
                                                                                          with the Jason-3 satellite onboard. Photo credit: NASA/Shiflett

                       Orbit Duration

                          90 minutes

                       Orbits Per Day

                             ~15

                         Design Life

                            5 years

                           Fuel Life
                                               The GRACE-FO satellites were assembled by Airbus Defence and Space in Germany with major compo-
                                               nents from a number of countries including Denmark, England, France, Germany, Italy, Sweden, and the
                           >5 years            U.S. This photo shows the satellites inside the IABG testing facility in Munich, Germany. Photo credit:
                                               Airbus DS Industrieanlagen-Betriebsgesellschaft GmbH-A.Ruttloff
The Earth Observer May - June 2018 Volume 30, Issue 3 11
Ground System and Data Products
feature articles
The GRACE-FO mission ground system includes all the assets needed to command and
operate the twin satellites in orbit, as well as manage, process, and distribute their data—
see Figure 7.
To communicate with the satellites, the German Space Operations Center (GSOC) in
Oberpfaffenhofen (Germany) sends commands through ground stations in Weilheim or
Neustrelitz (Germany) directly to the GRACE-FO satellites. Once data have been collected
onboard the spacecraft, they are transmitted to the two German stations or to the GFZ High-resolution, monthly
station in Ny-Ålesund (Norway). From there, all received telemetry is sent to the Raw Data
global models of Earth’s
Center (RDC) in Neustrelitz, and to the Physical Oceanography Distributed Active Archive
Center (PO.DAAC) at JPL in Pasadena, California, as well as to the Information System gravity field will be freely
and Data Center (ISDC) at GFZ in Potsdam (Germany), and the University of Texas available at http://grace.
Center for Space Research (UT-CSR) for monitoring and further analysis. GSOC provides jpl.nasa.gov/data.
real-time monitoring of the spacecraft status and functions, and will send new software
commands as necessary for optimal operations. Data from the GRACE-FO satellites are
returned every 96 minutes.
These data will inform hydrologists about up-to-date land water storage condi-
tions, provide glaciologists with accurate measurements of glacier and ice sheet mass
changes, allow oceanographers to assess global and regional sea level and ocean current
variations, among other uses. Data from GRACE-FO are expected to provide new
perspectives of Earth’s ever-changing water cycle that will benefit society for years to
come—see Applications and Benefits to Society on page 12. Once GRACE-FO is fully
operational, high-resolution, monthly global models of Earth's gravity field will be
freely available at http://grace.jpl.nasa.gov/data.
GPS Tracking
RANGING
CROSSLINKS:
MWI (24 & 32 GHz) Figure 7. This graphic shows
LRI (1064 nm)
how data travel from the
GRACE-FO satellites to
receivers on the ground. The
measurement and housekeep-
GRACE-FO ing data are stored onboard
the GRACE-FO satellites and
DATA FLOW relayed to ground stations
when the satellites pass over
at least once a day. Image
credit: NASA
Science Data System
Mission Operations
Ground Stations S-BAND:
Data Downlinks
&
Spacecraft
Commands
Ny-Ålesund
Science
Data System
Neustrelitz
Mission Operations
CSR
UT-CSR GFZ JPL
(DLR - GSOC)
Weilheim12 The Earth Observer May - June 2018 Volume 30, Issue 3
feature articles
Applications and Benefits to Society
Among the applications of GRACE-FO mission data are improvements to our
understanding and forecasting of freshwater availability, droughts, agricultural
resources, sea level rise, climate change, and solid Earth changes. Data from
“GRACE was a GRACE-FO—along with information from other Earth-observing satellites and
pioneering mission airborne missions, combined with ground-based data—will lead to advances in
that advanced our Earth system science for years to come.
understanding across Monitoring Freshwater Resources
the Earth system—land,
ocean, and ice. The Water resource managers rely on accurate estimates of underground water stor-
entire mission team was age like those provided by GRACE and soon GRACE-FO to monitor freshwater
resources necessary for human activities including public consumption, irrigation,
creative and successful
and sanitation—among other uses.
in its truly heroic efforts
over the last few years, Enhanced Prediction Skills for Weather and Climate
extending the science
By providing GPS radio-occultation measurements daily, coupled with an improved
return of the mission to understanding of the global water cycle, data from GRACE-FO will help advance
help minimize the gap Earth system analysis and weather and climate modeling.
between GRACE and
its successor mission, Improved Forecasting Capabilities for Drought and Flood Risk
GRACE Follow-On.” Too much or too little water can have huge impacts on people around the world.
The agricultural community, wildfire managers, and other decision-makers will use
—Michael Watkins GRACE-FO data to provide weekly maps of drought risk.
Director of NASA’s Jet
Improved Predictions of Flood Potential
Propulsion Laboratory
and GRACE-FO’s GRACE-FO will provide a means to observe monthly variations in total water storage
Science Team Lead within large river basins. The terrestrial water storage signal defines the time-variable
ability of land to absorb and process water, and accounts for the water beneath the
surface. Water storage information from GRACE-FO will allow users to assess the
predisposition of a river basin to flooding as much as 5–11 months in advance.
Improved Sea Level Change Prediction and Ocean Current Monitoring
Data from GRACE-FO will allow scientists to keep a close eye on sea level and deter-
mine—in conjunction with other observations—how much of the change is due to
warming, ice melting, or runoff from land. Ocean bottom pressure measurements from
GRACE-FO will also enable the tracking of deep ocean current changes.
“GRACE-FO allows Better Solid Earth Monitoring
us to continue the
revolutionary legacy of Data from GRACE-FO will also record mass changes originating from earthquakes,
tsunamis, volcanic eruptions, and the Earth’s crust as it adjusts to other mass changes
GRACE. There are sure such as loss of land ice. This effectively provides a window into the interior of our planet,
to be more unexpected and gives researchers new data to infer material properties deep below the surface.
and innovative findings
ahead.”
Conclusion
—Frank Webb
Changes in how mass is distributed within and between Earth’s atmosphere, oceans,
Project Scientist groundwater, and ice sheets are fundamental indicators of the large-scale dynamics of
for GRACE-FO at the planet. For more than 15 years, NASA’s GRACE mission monitored mass changes
NASA's Jet Propulsion every month with far-reaching impact on our understanding of the Earth system and
Laboratory how it is evolving. GRACE-FO continues the legacy of GRACE, tracking Earth’s water
movement and surface mass changes across the planet. Monitoring changes in ice
sheets and glaciers, near-surface and underground water storage, the amount of water
in large lakes and rivers, as well as changes in sea level and ocean currents, provides an
integrated global view of how Earth’s water cycle and energy balance are evolving—
measurements that have important implications for everyday life. The Earth Observer May - June 2018 Volume 30, Issue 3 13
Celebrating Earth Day with NASA:
feature articles
“The Best Day Ever!”
Heather Hanson, NASA’s Goddard Space Flight Center, Global Science and Technology, Inc., heather.h.hanson@nasa.gov
Introduction
With more than seven billion people onboard, Earth is the only
planet in the universe known to support life. It may therefore be
thought of as a huge, populated spacecraft. Consequently, NASA’s
scientists and engineers work tirelessly to advance our scientific under-
standing of Earth as a system and its responses to natural and human-
induced changes, to better keep all systems “Go!”
In recognition of its unique status, people around the world have
celebrated Earth Day for nearly 50 years. While there is a sense that
“every day is Earth Day,” i.e., environmental stewardship and protec-
tion should be a priority every day, April 22 has been set aside to
specifically focus on these themes.
Explaining the design inspiration for the 2018 NASA Science Earth
Day poster, Jenny Mottar [NASA Headquarters—Science Mission
Directorate Art Director] states that, “Earth is really the best seat in the
universe,”—see Figure 1. In fact, to our knowledge it is the only seat
in the universe—and therefore on Earth Day should be celebrated in
true NASA fashion.
Celebrating Earth Day with NASA
Organized by NASA’s Science Communications Support Office,
NASA held its sixth annual Earth Day celebration at Union Station in
Washington, DC, on April 19-20. The two-day event, which was free
and open to the public, took place inside Union Station’s historic (and
newly renovated) Main Hall1—see Photo 1. This central transporta-
tion hub attracts some 25,000 to 30,000 people daily, allowing NASA
potentially to reach a larger group of citizens than those who were Figure 1. The 2018 NASA
already planning to attend the event. Science Earth Day poster.
Credit: Jenny Mottar, NASA
Photo 1. NASA science
activities as seen from a balcony
above Union Station’s Main
Hall. The Hyperwall was the
centerpiece of the exhibit.
Photo credit: NASA
1
Union Station’s Main Hall has now been fully restored nearly five years after a magnitude 5.8
earthquake hit the DC region.14 The Earth Observer May - June 2018 Volume 30, Issue 3
This year’s NASA This year’s NASA Earth Day theme was Amazing Technology. The exhibit featured 23
feature articles
Earth Day theme was hands-on activities that ran the gamut from virtual reality experiences, to classifying
coral using a touchscreen interface, to using a handheld spectrometer to test the reflec-
Amazing Technology.
tance of different vegetables—see Table 1 for a listing of all the activities.
Table 1. Hands-On Activities at NASA’s 2018 Earth Day celebration.
Activity Title Description
To process and store data, computers use a simple coding system, called binary
What’s Binary Code? code. In this activity participants used different-colored beads to encode the initials
of their first and last names.
NASA keeps a close eye on the sun’s ultraviolet (UV) radiation. Participants became
Ultraviolet Beads UV detectives, using specially designed UV-sensitive beads. They walked away with
their very own UV-detection bracelet.
Our “blue ocean” is actually made up of a broad spectrum of colors, depending on
the changing locations of microscopic life in it. Differences in ocean color are visi-
Ocean Life from Space ble from space, thanks to NASA’s satellite technologies. Participants examined how
NASA detects ocean life and took a selfie with their “Best Phyto Friend Forever”
(BPFF).
EO Kids is committed to making Earth science fun and engaging by bringing NASA
Earth Observatory (EO) stories and NASA Earth science data to a younger audi-
Earth Observatory for Kids
ence (ages 9–14). Participants learned about topics in Earth science from a satellite
perspective, and engaged in fun-filled, hands-on activities on a personal level.
Exploring Earth’s Neighbor: Our moon is a stunning and beautiful place! Participants examined how it’s similar
The Moon to—and yet quite different from—Earth.
Participants learned how NASA’s satellites use spectrometers to measure the differ-
Spectral Measurements:
ing amounts of light wavelengths reflected off Earth’s surface. They tested their skill
The World’s Fingerprints
at matching such spectral signatures with features in satellite images.
Satellite observations can monitor the health of plants by measuring multiple wave-
Spectral Measurements, lengths of reflected light. These observations provide scientists with data to help
Plant Health, and predict when and where crops are at risk from drought, floods, and even air pollu-
Your Health! tion. Participants learned how NASA is keeping an eye on our world’s food supply
from space.
Participants learned how scientists use a technique called transit spectroscopy to
Finding an Earth-Like
discover and characterize planets outside of our solar system (called exoplanets) as
Planet Light Years Away
they search for other Earth-like planets in the universe.
In this activity, participants explored how water moves through the ocean. By
The Notion of
observing what happens when fresh water is poured on top of salt water in a tube,
Ocean Motion
they learned how fluids move depending on their densities.
Mapping Temperature, Participants learned why mapping profiles of temperature, pressure, and humidity
Pressure, and Humidity of of the atmosphere around the globe (using a technique called sounding) is important
the Earth to weather forecasting.
NASA satellite observations of the Earth’s environment need to be complemented
Sky View/Ground View with observations made on the ground. Participants learned how they can make
with GLOBE citizen-science, ground-based observations, and got a chance to see an augmented-
reality view of satellite imagery of our planet.
Do clouds affect the temperature and atmosphere of Earth? Participants explored
Clouds and Earth’s
two environments—one with clouds and one without—to learn how clouds affect
Radiant Energy Budget
Earth’s temperature.
When a huge chunk of ice, known as Iceberg A-68, broke off the Larsen C ice shelf
in 2017 NASA was able to observe it. How was that possible? Participants explored
Seeing in the Dark
how the thermal imager on the Landsat satellite can reveal breaks, or rifts, in the ice
shelves and provide valuable insight into how the Earth’s cryosphere is changing.
continued on next pageThe Earth Observer May - June 2018 Volume 30, Issue 3 15
Table 1. (cont.) Hands-On Activities at NASA’s 2018 Earth Day celebration.
feature articles
Activity Title Description
Magnetic Earth, Magnetic Participants viewed a NASA satellite in virtual reality and learned about magnetism
Sun, and Virtual Reality in the sun–Earth system.
One of Saturn’s moons, Titan, has many similarities to Earth, including an atmo-
The Earth and Titan: sphere with clouds and rain. The difference is that Titan is so cold that what rains is
Greenhouse Cousins liquid methane—not water! Participants learned how the greenhouse effect on both
worlds acts like a blanket to warm the surface.
Scheduled to be launched in September 2018, NASA’s ICESat-2 mission will
Lasers, Bouncy Balls, and measure the varying height of the surface of our planet, one laser pulse at a time.
the ICESat-2 Mission Participants learned about the ICESat-2 mission, lasers, and tried out the ICESat-2
Bouncy Ball Photon-Counting Challenge.
Measuring Precipitation Participants learned the nuts and bolts about how and why NASA’s satellites
from Space measure precipitation from space.
NASA is building new technologies today that will help us see Earth like never
Future Tech for
before. Participants could see models of tiny satellites and smart sensors either
Earth Science
already in space or planned for launch in the near future.
NeMO-Net: Drones That Participants played an interactive, game-based feature to map our planet’s
See Through Ocean Waves coral-reef ecosystems. NeMO stands for New Millennium Observatory.
Up, up, and away! Participants learned how NASA’s balloons are used to understand
B-Line to Space
the dynamics of Earth’s atmosphere.
View Your World with Participants used NASA’s Worldview digital tool to explore and visualize Earth
NASA Worldview science data and explore natural hazards.
This touchscreen interface allowed participants to drive a spherical display that
Dynamic Planet
showed a variety of remote-sensing satellite datasets.
Participants could walk away with a free photo of themselves superimposed on an
Digital Photo Booth
astronaut spacesuit.
Participants were given an activity passport that listed the 23 activities to choose from; Participants were given
after completing at least 6 activities (see Photos 2 - 7), they could turn in their pass- an activity passport that
port to redeem a special NASA-provided take-home kit (i.e., a NASA drawstring bag listed the 23 activities to
with some outreach materials of their choosing). choose from.
Photo 2. Participants at the Sky View/Ground View with GLOBE Photo 3. Participants at the NeMO-Net: Drones That See Through
activity used augmented reality goggles to view satellite imagery of Ocean Waves activity used a touchscreen video-game table to classify
our planet. Photo credit: NASA different types of coral reef systems. Photo credit: NASA16 The Earth Observer May - June 2018 Volume 30, Issue 3
feature articles
Photo 4. Participants at the Spectral Measurements, Plant Health, and Photo 5. Participants at the Seeing in the Dark activity moved chunks
Your Health! activity used a handheld spectrometer to test the reflec- of ice around in a large plastic tub of water while viewing temperature
tance of different types of lettuce. Photo credit: NASA differences via an infrared camera’s image projected on an iPhone.
Photo credit: NASA
Photo 6. Participants at the Lasers, Bouncy Balls, and the ICESat-2 Photo 7. Participants at the B-Line to Space activity got an up-close-
Satellite Mission activity released bouncy balls in a cardboard box to and-personal view of a NASA balloon used to study the atmosphere.
demonstrate the laser technology used on the ICESat-2 mission— Photo credit: NASA
scheduled to launch in 2018. Photo credit: NASA
The centerpiece of the NASA experience was the Hyperwall—a nine-screen, high-
definition video wall—where NASA’s senior management, scientists, and outreach
representatives delivered 40 multimedia stories over the course of two days. Each story
lasted about 15 minutes, covering a variety of Earth-science, heliophysics, planetary,
and space-science topics. The exhibit also featured an Explorer 1 “selfie station,” where
The centerpiece of the participants could hold up a paper cutout of the Explorer 1 spacecraft—the first satel-
NASA experience was lite launched by the U.S., on January 31, 1958—to recreate a scene similar to the one
the Hyperwall—a captured in a photograph of three men responsible for the success of Explorer 1—see
Photos 8 and 9. Participants also had a unique opportunity to take photos of Union
nine-screen, high-
Station’s K9, Summer, who helps keep Union Station a safe venue—see A War Dog
definition video Visits Earth Day on page 20.
wall—where NASA’s
senior management, On the first day of the event and as arranged earlier, more than 350 middle- and high-
scientists, and outreach school students from schools in Maryland, Virginia, and the District of Columbia,
representatives delivered joined the general public to attend the event. The students and general public gath-
40 multimedia stories ered in front of the Hyperwall for opening remarks at 10:30 AM—see Photo 10.
To kick off the event, Michael Freilich [NASA Headquarters—Director of the Earth
over the course of
Science Division] explained how aliens coming into our solar system might first be
two days.
drawn to the larger planets such as Jupiter and Saturn, but they’d soon home in
on Earth—the only planet visibly teeming with life. Freilich briefly explained how
NASA uses the vantage point of space to study and monitor our planet, collect-
ing important measurements that impact our daily lives (e.g., weather forecasts).
Former NASA Astronaut Paul Richards spoke next. Richards reminisced about
orbiting Earth in Space Shuttle Discovery, including trips to the International SpaceThe Earth Observer May - June 2018 Volume 30, Issue 3 17
Station. He explained that similar to his experience as a NASA astronaut, we are all
feature articles
astronauts onboard Spaceship Earth—and we must take care of our “spacecraft,”
as there is no backup “Planet B” if we needed one to continue our existence. Next, He explained
Brent Reetz [Union Station—Senior General Manager] and Nzinga Bryant [Union that similar to his
Station Redevelopment Corporation—Vice President and Director of Finance and experience as a NASA
Administration] gave welcoming remarks, emphasizing the station’s green initiatives
astronaut, we are all
and recycling efforts.
astronauts onboard
Following the kick-off presentation, the students were divided into small groups Spaceship Earth—
that followed a rotation schedule that would allow every student access to various and we must take care
activity centers with minimum confusion. Each group completed several of the 23 of our “spacecraft,”
hands-on activities and listened to a variety of multimedia stories at the Hyperwall, as there is no backup
including a presentation titled Viewing Earth from Space: An Astronaut’s Perspective, “Planet B” if we
given by Former NASA Astronaut Paul Richards, where all 350 participants gath-
needed one to continue
ered in front of the Hyperwall. To view the list of Hyperwall stories from the first
our existence.
day, see Table 2 on page 18. In addition to the hands-on activities and Hyperwall
stories, Paul Richards held a one-hour autograph signing that was open to the
public on April 19—see Photo 11. Approximately 1000 other visitors to the station
participated in NASA’s activities on that day.
Photo 8. Pictured here are three men responsible for the success Photo 9. Students recreated the Explorer 1 photograph of three men
of Explorer 1, America’s first Earth satellite, launched January 31, responsible for the success of Explorer 1. Photo credit: NASA
1958. At left is William H. Pickering, former director of NASA/
Jet Propulsion Laboratory, which built and operated the satellite; at
center is James A. Van Allen, of the State University of Iowa, who
designed and built the instrument that discovered the now-well-
known radiation belts which circle the Earth; and at right is Wernher
von Braun, leader of the Army’s Redstone Arsenal team that built the
first-stage Redstone rocket that launched Explorer 1. Credit: NASA
Photo 10. Participants gathered in front of NASA’s Hyperwall for a Photo 11. Former NASA Astronaut Paul Richards held a one-hour
special kickoff celebration. Left to right: Michael Freilich, Former autograph signing—open to the public—on Thursday, April 19.
NASA Astronaut Paul Richards, Brent Reetz, and Nzinga Bryant. Photo credit: NASA
Photo credit: NASAYou can also read