Burnsville, NC Comprehensive Land Use Plan 2021 - Town of Burnsville, NC
←
→
Page content transcription
If your browser does not render page correctly, please read the page content below
Burnsville, NC
Comprehensive
Land Use Plan
2021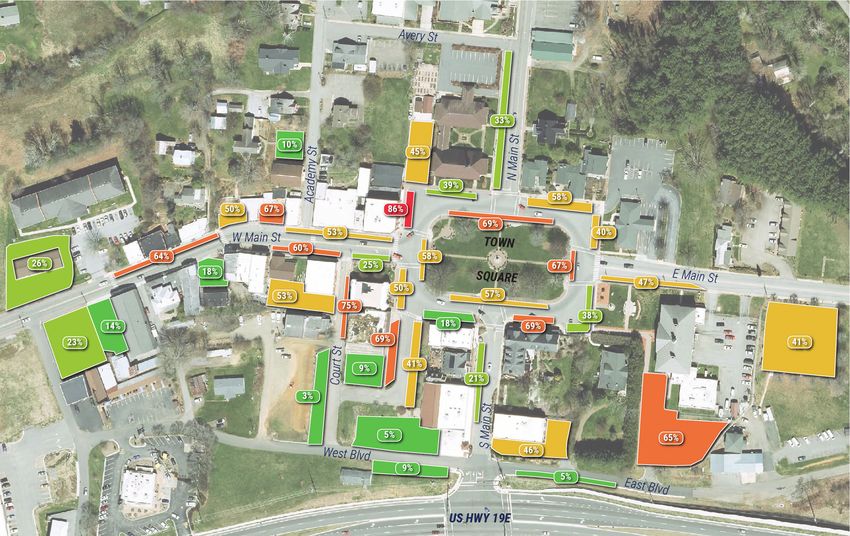
Acknowledgements
Burnsville Town Council                                     Plan
     Theresa Coletta, Mayor                          Steering Committee
         Judy Buchanan                                     Kim Simpson, Chair
          Denise Collier                                      Paul Bradley
           Russell Fox                                       Brian Buchanan
        Bunnie McIntosh                                      Judy Buchanan
                                                              Denise Collier
Burnsville Planning Board                                  Heather Hockaday
                                                            Jamie McMahan
      Kim Simpson, Chair                                      Woody Ryan
         Paul Bradley                                          Jerri Storie
         Woody Ryan                                            Greg Yuziuk
          Jerri Storie
         Greg Yuziuk

                                                       The Burnsville Town Council
  Burnsville Town Staff                                and Planning Board extend a
       Heather Hockaday                               special acknowledgment to all
        Brian Buchanan                               of the community members who
        Leslie Crowder                                participated in the public input
           Chad Fox                                        process for this plan
         Dillon Lundy
        Jeanne Martin

                              Prepared by High Country
                               Council of Governments
                                   January 2021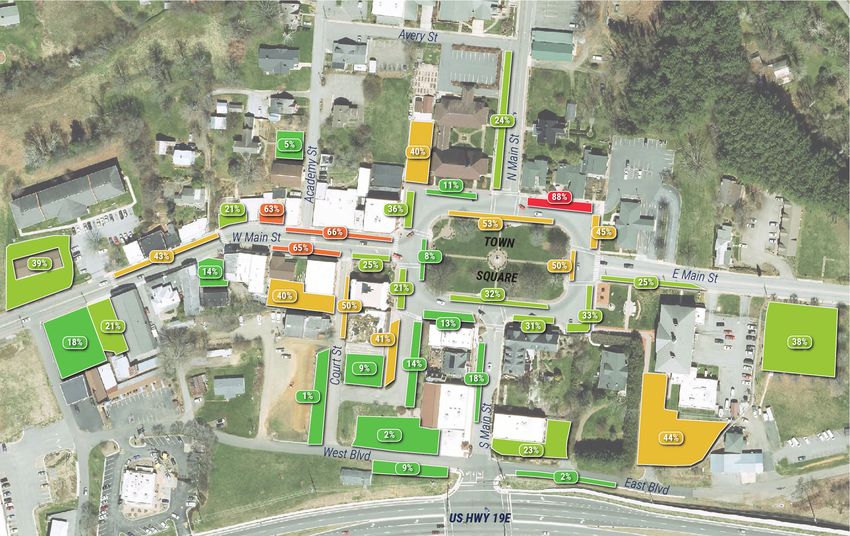
Contents
01 Introduction                                          1
02 Background Information                                2
       Population                                        3
       Income, Employment & Commuting                    5
       Housing                                           7
       Environmental Constraints                        10
       Impermeable Surfaces & Stormwater                13
       Transportation                                   14
       Parking                                          17
       Utilities                                        26
       Development Regulations                          31
       Existing Land Use                                36
       Land Value                                       40
       Building Permit Patterns                         41
       Infill Development                               46
       Parks & Green Space                              47
03 Public Input                                         48
       Survey                                           49
       Survey Results                                   50
04 Future Land Use Map                                  58
05 Recommendations                                      59
       Affordable Housing                               59
       Infrastructure Viability                         60
       Facilitating Commercial Development              61
       Updating Regulations & Planning Board Training   61
06 Appendices                                           63
       Appendix A - Example Minimum Housing Code
       Appendix B - Example Property Maint. Code
       Appendix C - Model Stormwater Ordinance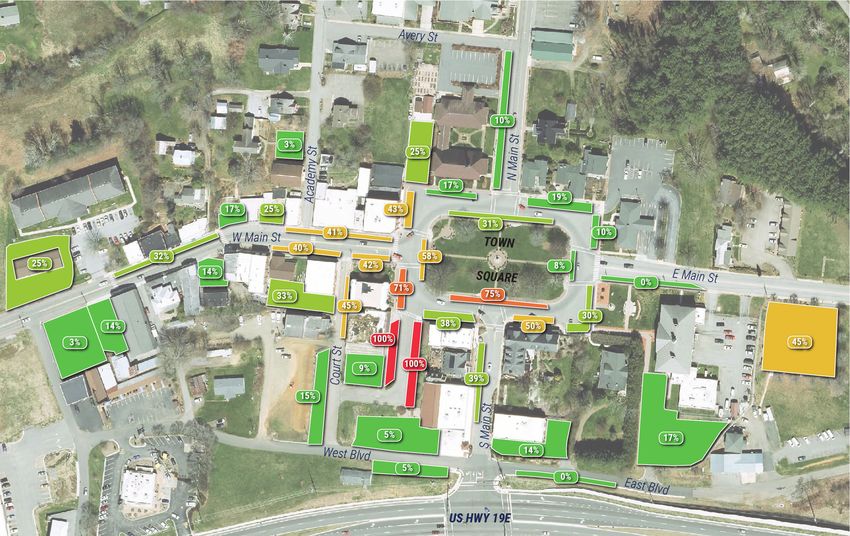
Introduction
         This plan is designed to guide decisions related to
land use over the next 10-15 years within the incorporated
area of the Town of Burnsville. It serves to fulfill the
requirement set by North Carolina General Statute Chapter
160D that local governments adopt a comprehensive
plan as a prerequisite to exercising certain development
regulations. To that end, the contents of this plan meet the
standards for a comprehensive plan as set forth in N.C.G.S.
160D-5-1.
         The bulk of the plan consists of background
information related to land use issues in Burnsville.
Beginning on pg. 2, the reader can find information
related to population, income, employment, commuting,
housing, environmental constraints, transportation, utilities,
development regulations, land value, and parks. This section
also contains the findings of a GIS analysis of Burnsville's
impermeable surfaces, the results of a downtown parking
study, a map displaying the location of land uses within
Town, and a breakdown of building permit patterns over the
past several years.
         The plan's development process included public
input in the form of an online survey that was open to the
public from September through October of 2019. A total of
148 respondents completed the survey, which exceeded
expectations. The plan's recommendations are informed
by the results of the survey, the findings of the background
information, as well as planning best practices. Those
recommendations (25 in total), along with a future land use
map, can be seen beginning on pg. 59.

Photo Credit: Yancey County Economic Development Commission
                                                                 -1-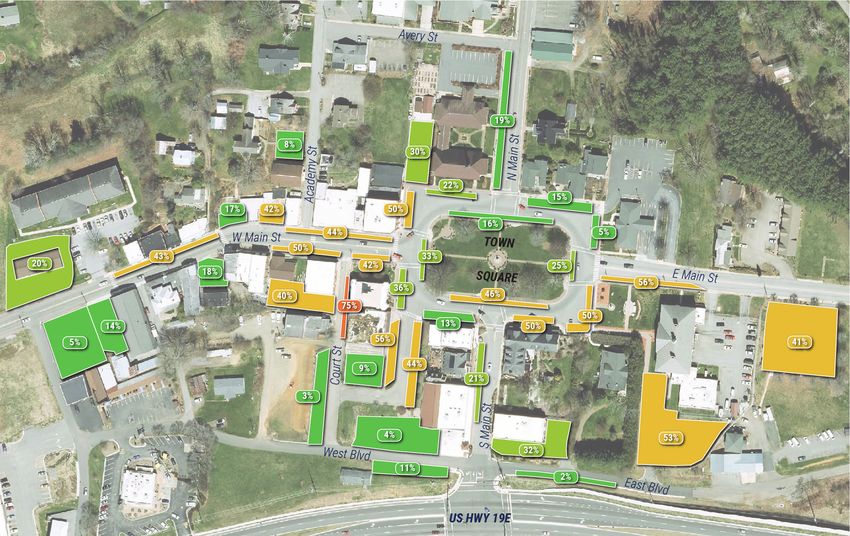
Background
      Information

-2-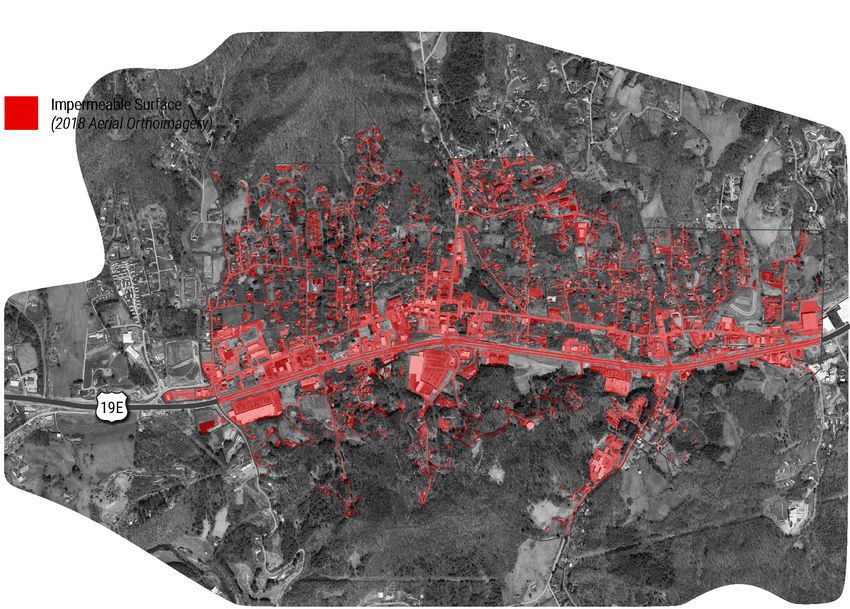
Population

         Burnsville’s total population count has remained            30-59 decreased during the last decade. The charts on the
flat over the past decade. The North Carolina State                  following page display growth rates for all age brackets in
Demographer’s Office estimated Burnsville had a population           the County and State. The data suggests that a large share
of 1,709 as of July 2018, up from 1,693 in 2010. This                of in-migrants are retirement age and that younger residents
growth rate (0.9%) lags only slightly behind Yancey County           may be moving out of the County at a higher rate than other
as a whole over the same time period (3.6%). As shown                age brackets.
in the chart below, Burnsville has the lowest growth rate
of neighboring communities in North Carolina except for
                                                                      A Note About Data Accuracy
Spruce Pine, which lost population from 2010-2018.
         Yancey County’s growth is largely attributable to            Data on rural communities often relies on estimates with high margins
in-migration. Without new residents moving into Yancey                of error. This is particularly true for data from the American Community
County, the community would have steadily lost population             Survey. While it is not 100% accurate, the data is the best available and is
over the past decade. The County has a negative natural               useful for identifying trends. County-level data is used instead of town-level
increase rate, as shown in the chart below. Natural increase          data in some instances where margins of error were extremely high.
is a measure of growth derived by subtracting deaths from
births in any given year.                                                           Burnsville Population by Race, 2018
         Data indicates that Yancey County’s population is                          Source: American Community Survey
trending older. Persons aged 60-69 were the fastest growing
age bracket in the County from 2010-2018, at a rate of
42.1%. The share of the County’s population aged 0-19 and
                                                                                                                 5.7%
  Population Change in Neighboring Communities, 2010-2018                                                      Hispanic
             Source: NC State Demographer’s Office
                                                                                                                      5.2%
           Community                  Population Change                                                               Black
                                                                                                                                  2 or more
            Burnsville                     +0.9%                                                                           4.1%     races
           Spruce Pine                      -0.2%
                                                                                                                                    1.3%
           Bakersville                     +2.4%                                   83.7%                                            Other
                                                                                   White
            Mars Hill                      +12.1%

             Marion                        +7.6%

         Black Mountain                    +7.8%

          Yancey County                    +3.6%

      State of North Carolina               +9%

                                                                                    Burnsville Population by Sex, 2018
   Yancey County Sources of Population Change, 2010-2018
                                                                                    Source: American Community Survey
             Source: American Community Survey,
             NC State Center for Health Statistics

                                                                                     52%                            48%
                                                                                    Female                          Male

                                                               -3-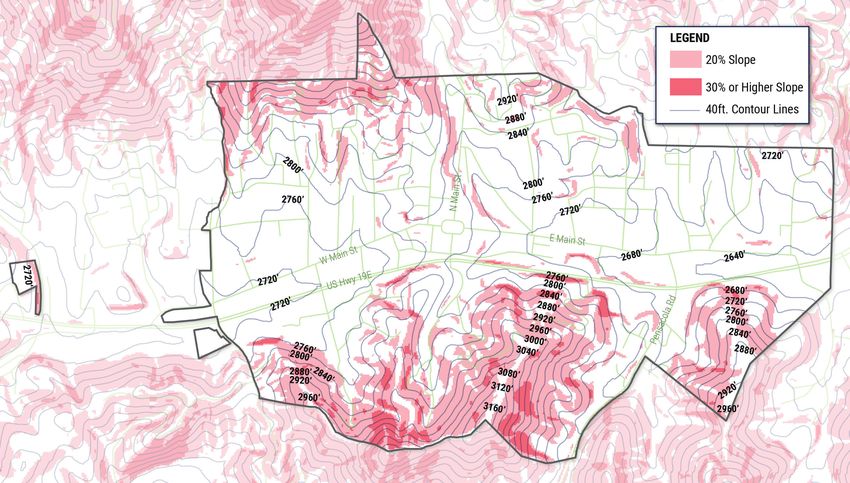
Yancey County Population by Age, 2010-2018
                                                                                    Source: American Community Survey
                                                          Year
                                                                 2010      2013            2016
                                                                 2011      2014            2017
                                                                 2012      2015            2018
                                                    15%
               Percent of Total County Population

                                                    10%

                                                     5%

                    Age Group                                0-9        10-19        20-29        30-39    40-49     50-59      60-69   70-79   80+
Relative Change
      2010-2018                                             11.3%         9%            8.3%      11.4%    10.1%     15.9%      42.1%   23.9%   5.8%

                                                                                North Carolina Population by Age, 2010-2018
                                                                                     Source: American Community Survey
                                                          Year
                                                                 2010            2012             2014        2016            2018
                                                                 2011            2013             2015        2017

                                             15%
    Percent of Total State Population

                                             10%

                                                    5%

             Age Group                                      0-9         10-19        20-29        30-39    40-49     50-59      60-69   70-79   80+
Relative Change
      2010-2018                                             9%          2.9%            2.2%      7.3%     9.5%       3.1%      22.6%   22.2%   9.4%
                                                                                                     -4-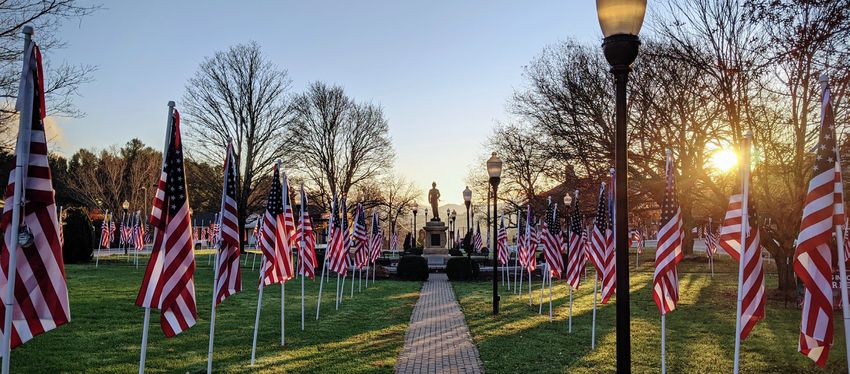
Income, Employment, & Commuting

          Burnsville’s median household income (MHI)                         Yancey County Employment by Industry, 2010-2018
falls below that of Yancey County and the State, but has                            Source: American Community Survey
increased sharply in recent years. As of 2018, MHI in
                                                                             Management,                                  Year
Burnsville was $36,310, 9% lower than Yancey County
as a whole and 30.7% lower than North Carolina. MHI in                         Business, &                                  2010
Burnsville increased by 27% from 2010 to 2018 - more than                        Financial
                                                                                                                           2011
                                                                              Occupations
the MHI increases for Yancey and North Carolina combined.
                                                                                                                           2012
          Yancey County residents are employed in a                             Computer,
wide range of industry categories. The chart to the right                     Engineering,                                 2013
illustrates the sectors that employ the most and least within                   & Science                                  2014
the County, and how employment within those sectors                           Occupations
has grown or shrunk over the past decade. The fastest                                                                      2015
growing industry sector from 2010-2018 was management,                   Education, Legal,
                                                                       Community Service,                                  2016
business, and financial occupations, which doubled its
employment numbers to become the 4th largest sector by                      Arts & Media                                   2017
2018. Natural resources, construction, and maintenance                       Occupations
                                                                                                                            2018
occupations lost the most jobs of any sector over the same
                                                                                Healthcare
time period.
                                                                           Practitioners &
          Half of Burnsville residents commute less than 15
                                                                      Technical Operations
minutes to work. Only 25% commute over 30 minutes to
work. Of those who commute outside Yancey County for
work, most travel to Buncombe, Mitchell, and McDowell                  Healthcare Support
counties. The overwhelming majority of workers in Burnsville                 Occupations
over age 16 have access to at least 1 car (98.4%). While
transit service is available within Burnsville, most workers
commute alone to work via automobile. The charts and
map on the following page illustrate commute times, vehicle             Protective Service
availability, and commuter flow patterns for the County.                     Occupations

                                                                         Food Preparation
        According to data from the American                              & Serving Related
        Community Survey, a program of the US Census                          Occupations
        Bureau, total employment in Yancey County
        decreased by 7.3% between 2010 and 2018.                       Building & Grounds
                                                                                Cleaning &
                                                                             Maintenance
                                                                              Occupations
            Median Household Income, 2010-2018
             Source: American Community Survey                              Personal Care
                                                                                & Service
                                                                             Occupations

                                                                            Sales & Office
                                                                             Occupations

                                                                        Natural Resources,
                                                                           Construction, &
                                                                             Maintenance
                                                                              Occupations
                                                                              Production,
                                                                         Transportation, &
                                                                          Material Moving
                                                                             Occupations
                                                                                             0        500         1,000          1,500
                                                                                                 Estimated Number of Employees

                                                                -5-
Burnsville Commute Time, 2018                           Burnsville Vehicle Availability for Workers Age 16+, 2018
            Source: American Community Survey                                   Source: American Community Survey

                                                                                                                        1.6%
                       7.1%
            7.7%
                                                                                      35.4%

     6.7%                                       37.7%

   3.2%                                                                                                           23.7%

   4.8%

        14.3%
                                                                                         39.3%
                        6%      12.5%

Less than 10 minutes (37.7%)       30-34 minutes (3.2%)
10-14 minutes (12.5%)              35-44 minutes (6.7%)              No vehicle available (1.6%)      2 vehicles available (39.3%)

15-19 minutes (6%)                 45-59 minutes (7.7%)              1 vehicle available (23.7%)      3 + vehicles available (35.4%)

20-24 minutes (14.3%)              60 or more minutes (7.1%)
25-29 minutes (4.8%)

             Yancey County Daily Commuting Patterns
             Source: American Community Survey, 2009-2013

                                                               -6-
Housing

            Single-family dwellings account for most of
   Burnsville and Yancey County’s housing stock. However,
   unlike the County as a whole, the majority of Burnsville’s
   housing is rented rather than owned. As of 2018, slightly
   over half of housing within the Town was renter-occupied.
   Conversely, just under 75% of the County’s housing stock
   was owner-occupied.
            This discrepancy is particularly important given the
   importance of housing affordability to a community’s vitality.
   Without affordable housing, a community will struggle to
   retain and attract population, particularly those of workforce
   age. As shown in the charts on the following page, renters
   tend to be significantly more burdened by housing costs
   than homeowners. Median gross monthly rent in the
   County grew by 26.5% from 2010 to 2018. Median monthly
   homeowner costs for households with a mortgage grew by
                                                                                                According to data from the American Community
   3.8% over the same time period.
                                                                                                Survey, the average household size in Burnsville
            Most personal finance guidelines suggest that a
                                                                                                was 2.25 persons in 2018. This includes those living
   household spending over 30% of its monthly income on
                                                                                                in single-family homes, multi-family homes, and
   rent or a mortgage is cost-burdened and lacking affordable
                                                                                                other living arrangements.
   housing. Given the rapid rise in rent as mentioned above,
   it comes as no surprise that the number of cost-burdened,                                    The median tax assessed value for a single-family
   renter-occupied households increased dramatically between                                    detached residential home in Burnsville was
   2010 and 2018. 52.9% of renter-occupied households in the                                    $122,870 as of January 2020.
   County lacked affordable housing as of 2018, up from 36.3%
   in 2010. Only 18% of owner-occupied households in the
   County were cost-burdened as of 2018.
            There is no single cause for the vast discrepancy in                                 Burnsville Housing Occupancy, 2010-2018
   housing affordability between Yancey County’s homeowners                                         Source: American Community Survey
   and renters. One possible factor is that rent tends to
   respond quicker than housing values to market factors such
   as declining unemployment and rising incomes. Another
   possible factor is that housing costs for homeowners with a
   mortgage decrease relative to income over time, meaning...
   (continued on pg. 7)

                                     Owner vs. Renter-Occupied Housing, 2018
                                       Source: American Community Survey
                               80%
                                                                        Owner-Occupied
                               70%
                                                                        Renter Occupied
Percentage of Occupied Homes

                               60%

                               50%

                               40%

                               30%

                               20%

                               10%
                                       74.3%      25.7%             49.6%      50.4%
                                 0
                                         Yancey County                  Burnsville
                                                         Jurisdiction
                                                                                          -7-
Age of Burnsville Housing Units, 2018 Yancey County Median Gross Monthly Rent, 2010-2018
Source: American Community Survey Source: American Community Survey
25%
$800
Monthly Rent Increased
22.21%
20% 26.5%
from 2010-2018
Percentage of Housing Units
$700
Median Gross Monthly Rent
15% 16.33%
$615 $620
$600 $599
13.45%
12.85%
$600 $611
10% $581 $598
$535
9.26%
9.16%
8.96%
7.07%
5% $500
0.06%
$490
0%
$400
9
9
9
9
9
9
9
er
er
96
94
95
97
98
99
00
rli
lat
-1
-1
-1
-1
-1
-1
-2
ea
10
11
12
13
14
15
16
17
18
or
40
50
60
70
80
90
00
20
20
20
20
20
20
20
20
20
or
10
19
19
19
19
19
19
20
39
Year
20
19
Year Built
Yancey County Median Monthly Home Owner Costs for Yancey County Renter-Occupied Households Paying 30% or More
Households with a Mortgage, 2010-2018 of Household Income on Gross Monthly Rent, 2010-2018
Source: American Community Survey Source: American Community Survey
$1,200 60%
18%
of homeowners 54.9%
are cost-burdened 53.8%
$1,100 50.7%
$1,060 52.8% 52.9%
Percentage of Renters
50%
Median Monthly Cost
$1,032 $1,024
$1,009
$1,000 $981 43.9%
$997 44.9%
$965 $973
40%
$937
$900 38.4% Over
36.3% 50%
of renters are
cost-burdened
$800 30%
10
11
12
13
14
15
16
17
18
10
11
12
13
14
15
16
17
18
20
20
20
20
20
20
20
20
20
20
20
20
20
20
20
20
20
20
Year Year
-8-a lower percentage of total income is devoted to those costs Housing Affordability
as the mortgage matures and inflation rises. Lastly, renters in Yancey County
tend to have lower incomes than homeowners, leaving them Source: North Carolina Housing Coalition
less room within their budget for housing.
In 2019, the average rent for a
It is important to note that housing affordability
2-bedroom apartment was
is not just a low-income problem. According to data from 47 Families
the North Carolina Housing Coalition, a household needed
$716/month
to earn an annual salary of at least $28,640 to afford the
median rent for a 2-bedroom apartment in Yancey County in
2019. This figure falls below the median household income which meant that a household
for the community, but above the average annual salary for needed to earn
many common professions including food preparation & $28,640/year
service, childcare, healthcare, and retail sales. to afford rent
As shown on the map below, there are several public
assistance housing options located in and around Burnsville.
Collectively, they offer 140 dwelling units for those who this amount exceeded the
qualify. Most are restricted to either elderly, disabled, or average annual salary for many
low-income tenants. While these options provide a valuable professions in Yancey County,
safety net, they fail to address the affordable housing including:
problem in Burnsville, particularly among renters.
Food Prep & Service
Compounding the problem is the aging and vacant
$18,880
housing stock in Burnsville. According to data from the
American Community Survey, most housing units within Childcare
Town are over 40 years old. 30% of units are over 60 years $23,110
17 Households
old. Less than 1% of total housing units have been built Healthcare in Yancey County
within the last 10 years. The number of vacant housing $25,670 faced a foreclosure
units has also increased dramatically, nearly doubling
Retail Sales in 2019
between 2010 and 2018. Together, this data suggests that a
$25,680
significant amount of Burnsville’s housing stock is no longer
suitable for habitation without further investment. Less
housing stock (less supply) worsens housing affordability.
Burnsville
Public Assistance HousingEnvironmental Constraints
Environmental features such as slope, soil types, Despite Burnsville’s small land area of only 1,108
waterways, wetlands, and floodplains heavily impact acres, the Town features significant elevation change within
development patterns. Steep slope and floodplains, whether its corporate limits. The lowest lying areas sit at 2,640ft
by virtue of their natural characteristics or the regulations above sea level, located in the eastern portion of Town along
associated with them, prevent construction or make it US Highway 19E. Elevation increases gradually towards the
impractical. Soil types can likewise hinder development due center of Town, hitting 2,800ft near Town Square before
to instability or inability to accommodate functioning septic declining to 2,720ft where the highway crosses Burnsville’s
systems. Regulations surrounding waterways, wetlands, and western corporate limits. The highest elevations are seen
water supply watersheds can dictate the extent and type of in the southern portion of Town, where the highest peak
development within their vicinity. reaches 3,160ft above sea level.
Of these environmental constraints, Burnsville’s land The major concerns with steep slope development
use is mostly affected by slope, waterways, and floodplains. stem from erosion, runoff, and viewshed protection. The
There are no wetlands or water supply watersheds within Town's subdivision regulations contain standards for hillside
Burnsville’s corporate limits. The presence of a public sewer development when lot lines are altered or roadways are
system within Town also limits the consideration given to added. The Town’s zoning ordinance contains a general
soil type when developing a property. This section will focus provision requiring all development, except single-family
on existing conditions and regulations surrounding steep residential units, to meet basic sedimentation requirements.
slope, waterways and their classifications, floodplains, and However, these regulations do not prohibit ridge-top
floodways. development or protect property owners from runoff caused
Slopes exceeding a 20% grade are generally by construction of new single-family homes on existing lots.
considered “steep.” Much of the land south of US Highway Burnsville sits within the French Broad River Basin,
19E in Burnsville falls within this classification, as shown which covers much of western North Carolina. No major
on the map below. It is not a coincidence that this area is streams flow through Town, but the Cane River runs not far
also the least developed portion of Town. The cost and from the southwestern corporate limits. Several creeks and
engineering complications associated with building on a unnamed tributaries flow though Burnsville, as illustrated by
steep slope have the effect of discouraging development in the map on the following page. The largest of these are Little
these areas. Most of the Town’s development is situated in Crabtree Creek, Pine Swamp Branch, Mitchell Branch, and
the areas shown in white on the map. McIntosh Branch.
Burnsville
Steep Slope & Elevation Map
-10-The North Carolina Department of Environmental NCDEQ Restrictions by Stream Classification
Quality (NCDEQ) classifies steams and sets restrictions C TR
on activities for waterways that fall within water supply
watersheds or are deemed high quality waters. There are Receiving Receiving Stream &
Area Affected
Stream 25’ Buffer Area
three classes of streams within Town. McIntosh Branch,
Pine Swamp Branch, Little Crabtree Creek, and Mitchell Domestic &
Wastewater Discharges Allowed Domestic & Industrial
Branch are all “Class C” streams, indicating that they Industrial
fall outside of a water supply watershed. Pine Swamp, Low Density
McIntosh, and Little Crabtree also carry a supplemental Option
designation of “TR,” which indicates they are trout No Restrictions No Restrictions
High Density
waters. The unnamed tributaries within Burnsville are Allowable Density Option
all unclassified. The table to the right contains basic
restrictions associated with these classifications. NCDEQ 25’ Buffer between
Stream Buffer None Required Stream & Graded
also designates streams as “impaired” if they exhibit Area
especially poor water quality. Fortunately, no streams within More Stringent Rules
Burnsville are deemed impaired. Erosion & Sediment Controls Standard Rules
& Buffer
The Federal Emergency Management Agency
Agriculture Best Management
(FEMA) designates Special Flood Hazard Areas throughout Yes Yes
Practices Mandated
the United States. Commonly referred to as “floodplains,”
these areas consist of land adjacent to a creek, stream, or Forest Practices Guidelines Rule
Yes Yes
river which would be inundated by a flood event having a Standards Mandated
1% chance of being equaled or exceeded in any given year.
Transportation Best Management No Specific Stricter Erosion
A flood event of this magnitude was often referred to as Practices Mandated BMP’s Required Controls Apply
a “100-year flood” in previous terminology. Development
within these areas is regulated by Burnsville’s Flood Damage No Specific No Specific
Landfills Allowed
Prevention Ordinance. Restrictions Restrictions
Burnsville Dams/Water Resource Projects
No Specific No Specific
Restrictions Restrictions
Streams & Classifications Map
LEGEND
Unclassified Stream Class C Stream Class C, TR Stream Town Limits
Bailey
Branc
h
McIn
t ar y
trosh Branch
nam rib u
R ay
ed T
U nn
M it
Unnam
nch
Unname d Tri b
Creek
che
ame d T
w a m p Bra
Un
lBl
U
ed T
U nnamed Tribu t a
ch
ra n
ributary
nn
ri b u t
am
ta
P i ne S
ry
u
ed
ary
ek Li t ee
k
Cr e
Tribu t a
r
ee
t le Cra b tree C
b
tr
r
ry
a
y
Un
Cr
U
tary
nam
le
ed
Litt
Ta n troug h ranch
Tri
nna
u
bu
Trib
m ed
ta
nch r
B
Bra
ed
y
Tri
Unnam
p
am
butary
w
eS
Pi n
Ca
ne
R ive
r
Bow l ens C r e e k
-11-Burnsville
Flood Zones Map
The Ordinance dictates allowable development calculated base flood elevation. The base flood elevation is
within floodplains and contains building standards designed used to determine technical specifications of development
to minimize the potential for property damage and loss within the floodplain. Zone AO is a Special Flood Hazard
of life. It also names a floodplain manager responsible for Area where average depths are between one and three
reviewing all applications for development within a Special feet. Average flood depths derived from detailed hydraulic
Flood Hazard Area to ensure compliance with regulations. analyses are shown in the AO Zone. Each zone has its own
FEMA requires municipalities and counties to adopt requirements related to development, subdividing of land,
these ordinance before residents are eligible to purchase and flood insurance.
insurance through the National Flood Insurance Program Property owners have the right to request
(NFIP). amendment to FEMA’s flood map if they feel their land has
In addition to special flood hazard areas, FEMA been incorrectly designated as a Special Flood Hazard
also designates “floodways.” Floodways are the channel Area. The amendment process requires the owner to hire a
of a stream and immediately adjacent land that must be licensed land surveyor or registered professional engineer
reserved to discharge flood waters without increasing water to prepare documentation proving the property in question
surface elevation beyond a specified height. Burnsville’s should not fall within the floodplain. The process is often
Flood Damage Prevention Ordinance severely restricts costly, with little guarantee that the property will be removed
development within a floodway, nearly prohibiting it with a from the Special Flood Hazard Area.
few exceptions. FEMA also identifies areas that would be
inundated by a flood event having a 0.2% chance of being
equaled or exceeded in any given year (formerly referred
to as a “500-year flood”). These areas have far fewer
development restrictions.
The map above illustrates the location of flood
hazard areas and floodways within Burnsville. These
areas are confined to the land adjacent to Mitchell Branch,
McIntosh Branch, Pine Swamp Branch, and Little Crabtree
Creek. Zone AE is a Special Flood Hazard Area that has a
-12-Impermeable Surfaces & Stormwater
Surfaces that repel rather than absorb rainwater are drainage systems, and interspersing permeable surfaces
referred to as “impermeable.” During storm events, these into developments. Maintenance of stormwater structures
surfaces can contribute to flooding, erosion, pollution, and such as culverts, outfalls, catch basins, and drain lines is
stream impairment. A well-planned community seeks to critical. Without regular maintenance, these facilities clog
reduce the amount of impermeable surface area as much as or deteriorate beyond functionality, which worsens flooding
possible while still allowing development that incorporates and transfers water onto neighboring properties.
thoughtful consideration of stormwater management. As shown in the map below, impermeable surfaces
Stormwater runoff has numerous negative cover a large portion of Burnsville. Approximately 242 acres,
results. Rather than absorbing into the ground and slowly or 23.9% of the Town’s incorporated area, is impermeable.
releasing into aquifers or streams, runoff from impermeable Rooftops and pavement account for nearly all of these
surfaces is usually directed directly into surface waters. surfaces. The largest concentrations of impermeable
This increases flow speeds, which contributes to erosion surface area are clustered in the commercial areas of Town,
and water pollution. Sediment from erosion and runoff which are characterized by large buildings, wide roads, and
is detrimental to water quality and the health of aquatic extensive parking lots. Burnsville does not have a current
species. Runoff also increases the temperature of surface map or digital shapefile of the stormwater infrastructure
waters, since rainwater is not allowed time to cool before within Town. Developing such a map would facilitate
entering streams. Increased water temperature negatively maintenance. The Burnsville Zoning Ordinance requires
affects wildlife. Pollution and road salt carried by stormwater new development, except single-family homes, to submit
runoff also contribute to habitat destruction. a storm water drainage plan during the planning approval
Concentrated areas of impermeable surfaces process. With so much of Burnsville’s land area covered
increase the frequency and severity of flooding both in their by impermeable surfaces, it is important that existing
immediate area and further downstream. Flooding risk stormwater infrastructure be maintained and that future
can be mitigated by incorporating stormwater retention development focus on decreasing stormwater impacts.
facilities, well-designed and maintained stormwater
Burnsville
Impermeable Surfaces Map
-13-Transportation
Land use, development patterns, and transportation this corridor are served by less trafficked two-lane and one-
systems are interconnected. For example, communities lane streets that primarily connect residential uses.
with a high concentration of industrial uses often require Maintenance of roadways within North Carolina
multi-lane highways and access to rail. Communities with a is the responsibility of municipalities, NCDOT, and private
compact or pre-WWII development pattern tend to feature property owners. Each year, towns and cities submit a map
a greater emphasis on multi-modal forms of travel such as to the State delineating maintenance responsibility for the
walking or biking. Communities and neighborhoods with streets within their jurisdiction in order to secure Powell
large lot sizes, suburban-style development patterns, and Bill funds. North Carolina distributes these funds, which
infrequent transit service force, by their design, residents to are derived from fuel tax collections, to local governments
rely on access to an automobile to fulfill everyday needs. based on the length of public roadways they maintain. The
Driving is the primary mode of transportation in map below is color coded to illustrate roadway maintenance
Burnsville. The main artery for traffic is US Highway 19E, responsibility according to Burnsville’s 2019 Powell Bill map.
which runs through the center of Town as shown below. US- The Town of Burnsville is responsible for
19E is a four-lane divided highway that connects to Spruce maintaining approximately 11.3 miles of roadway, mostly
Pine to the east and Interstate 26 to the west. It carries consisting of minor residential streets. NCDOT maintains
anywhere from 14,500 to 18,500 vehicles daily according the major roads within Town, including 19E, East Main,
to latest available traffic counts from the North Carolina West Main, North Main, Green Mountain Dr., and Pensacola
Department of Transportation (NCDOT). Traffic along 19E Rd. 2.53 miles of roadway were left unclassified for
leading west out of Town increased significantly from maintenance responsibility in the latest Powell Bill map
2008 to 2018. Meanwhile, traffic on 19E leading east out of submitted to the State. Only three roads (Classic Dr., part of
Town decreased slightly over the same time period. These Robertson St., and the cemetery circle of Boone St.) were
patterns verify what locals know anecdotally - that Burnsville classified as private.
is increasingly becoming linked to the greater Asheville area. Cycling is another viable means of transportation
Aside from US-19E, the most heavily trafficked in Burnsville. Separated bike lanes designate a portion
roadways in Town are East and West Main Streets. West of a roadway’s pavement for bicycle travel only. They are
Main accommodated between 5,100 and 6,800 vehicles per considered safer than shared lanes, sharrows, or riding
day according to the most recent available data. East Main along the pavement shoulder. The presence of bike lanes
had slightly less traffic, accommodating between 4,600 and generally encourages travelers to cycle more often, much
5,700 vehicles per day. The area surrounding East Main, as the presence of sidewalks encourages increased
West Main, and 19E is the commercial corridor of Burnsville, pedestrian trips. In Burnsville, US-19E is the only roadway
with Town Square at its heart. The areas north and south of with dedicated bike lanes. Cycling is legally allowed along
Burnsville
Roadways & Maintenance Responsibility
-14-other roadways within Town, but cyclists must use the same
travel lane as automobile traffic. Sharing a lane does not
generally present a significant safety issue along roadways
with low speed limits and in communities where drivers
are accustomed to cycling traffic. However, residents may
feel discouraged from cycling without dedicated pavement
space or increased community awareness.
Sidewalks are only present in the commercial areas
of Burnsville. The map on the following page illustrates their
location within Town and the neighboring vicinity. Sidewalks
run along either side of US-19E from Mountain Heritage
High School to East Yancey Middle School. Within Town,
sidewalks run along West Main and half of East Main. Town
Square, South Main, North Main, and part of Green Mountain
Drive also have sidewalks. In total, there are 10.9 miles of
sidewalk in Burnsville and the surrounding vicinity. Of this,
the Town is responsible for maintaining the 6.77 miles that
fall within corporate limits, including the sidewalks that run
along US-19E.
Bike lane along US-19E entering the eastern end of Burnsville
Burnsville
Traffic Counts
Source: NCDOT
Station # Most Recent 10-Year Station # Most Recent 10-Year Station # Most Recent 10-Year
AADT Change (%) AADT Change (%) AADT Change (%)
1 820 (2016) +10.8% 8 200 (2015) -4.8% 15 3,100 (2015) -11.4%
2 18,500 (2018) +15.6% 9 6,800 (2015) -21.8% 16 4,600 (2016) -8.0%
3 520 (2016) -10.3% 10 1,800 (2016) -14.3% 17 15,500 (2018) -3.1%
4 14,500 (2018) +11.5% 11 840 (2015) +18.3% 18 450 (2015) -15.1%
5 5,100 (2016) +4.1% 12 5,700 (2016) +3.6% 19 18,500 (2018) -2.6%
6 940 (2015) +3.3% 13 16,000 (2018) -5.9%
7 15,000 (2018) +7.1% 14 2,500 (2018) -37.5%
-15-Burnsville
Sidewalk Location
Sidewalk disrepair was frequently cited as a which provide an approximate indicator of residential and
problem during the input process for the 2019 Yancey commercial clusters. These clusters, along with locational
County Economic Development Plan. Portions of the context, were used to identify areas where sidewalks are
Town’s sidewalk network have deteriorated due to age. most needed. Those areas are highlighted with orange and
Other portions are narrow or have obstructions such as white lines on the map below. Extending sidewalk along
utility poles that limit their accessibility for disabled users. the entire length of East Main Street should be the Town’s
Routine maintenance and capital improvement to the Town’s priority. This would serve existing homes and businesses
sidewalks would improve walkability and appearance. and promote growth along that section of the commercial
While Burnsville’s existing sidewalk network corridor. Addressing the other identified network gaps
provides good connectivity for downtown and the below would improve interconnectedness and serve large
commercial corridor, there are gaps where extending the low-income multi-family housing units (see pg. 7 for more
network would improve pedestrian access. The map below details).
displays concentrations of address points within Town,
Burnsville
Sidewalk Network Gaps
-16-Transit service within Burnsville is provided
by Yancey County Transportation Authority (YCTA).
Headquartered near Town Square, YCTA provides daily
route service to the entire County. They operate a demand-
response service model with no fixed routes except on
special occasions. Regular route service is provided Monday
through Friday from 7:30am to 4:30pm. YCTA utilizes
passenger vans, like the one pictured to the right, which can
accommodate multiple passengers including those who
require a wheelchair. Passengers must pay a fare to use
the service, though some qualify to ride at reduced rates
through government assistance. Yancey County Transportation Authority Passenger Van
Parking
Burnsville serves as a regional tourist destination Weekday Parking Demand, Downtown Study Area
and the central business hub for Yancey County. With so 50%
many trips made into and within Burnsville via automobile
it is important that the Town have adequate parking
44%
44%
availability. To gauge the inventory, location, capacity, and
Average Parking Lot Occupany
40%
42%
42%
availability of parking within Burnsville, High Country Council
39%
of Governments conducted a two- day parking study in July
37%
2020.
30%
31%
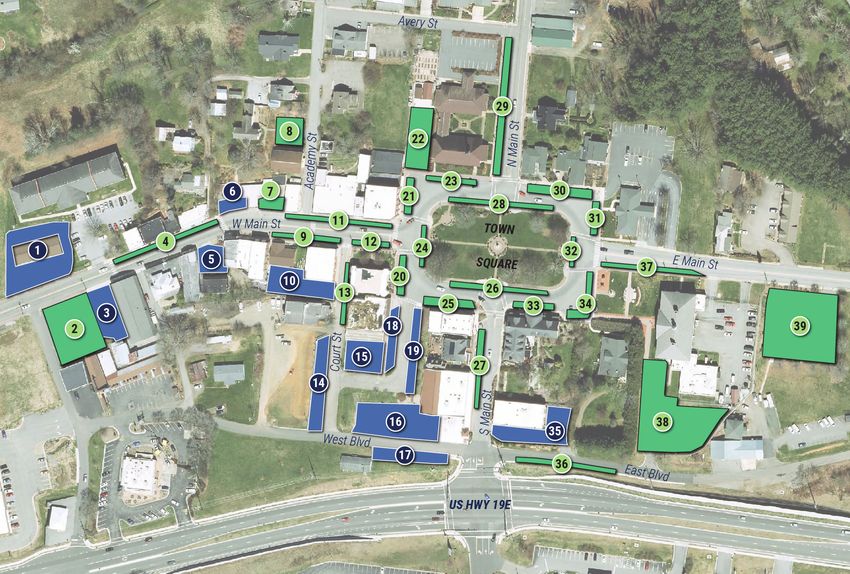
The geographic extent of the study, shown in the
30%
29%
map on the following page, was confined to the downtown
27%
area where parking is in highest demand. Staff inventoried
24%
the number of spaces in each lot or estimated capacity for 20%
non-striped lots. Two days were chosen - Wednesday, July
18%
8th and Saturday, July 11th - to discern how parking usage
differed from weekdays to weekends. The study ran each 10%
day from 7am to 7pm. Once per hour, staff would visually
count how many spaces were being used in each lot. The
number of spaces used in each lot was then divided by 0%
the lot’s total number of spaces to arrive at the occupancy
8a 8am
9a -9am
am m
am am
12 2pm
1p pm
2p pm
3p pm
4p pm
5p 5pm
6p pm
pm
10 -10a
numbers shown in the tables and maps on pg. 16-21.
11 -11
-1
-2
-3
-4
-6
-7
-
-1
-
m
m
pm
m
m
m
m
m
m
m
This study methodology has limitations worth
7a
noting. While it offers a general sense of parking demand Time of Day
and patterns, it is limited to a snapshot in time. It shows
parking patterns across two days, and relies on counts Weekend Parking Demand, Downtown Study Area
taken once per hour. Extrapolating these results across 50%
each hour and across 52 weeks per year requires a level
48%
of assumption. July was chosen as it is typically the peak
45%
tourism season in western North Carolina and features the 40%
Average Parking Lot Occupancy
43%
43%
41%
heaviest traffic and parking usage. The COVID-19 pandemic,
which was underway during the study, may also have
36%
affected the data. Despite these limitations, the study offers
30%
33%
insight into parking demand and availability in downtown
30%
28%
28%
Burnsville.
The study area features 39 lots, collectively
25%
containing 508 parking spaces. 27 of those lots are publicly 20%
22%
owned, containing a total of 335 parking spaces (including
15 handicapped accessible spaces). The remaining 12
lots are privately owned and contain a total of 173 spaces 10%
(including 1 handicapped accessible space). The study
revealed that demand for parking within downtown peaks
between 10am and 2pm on weekdays. Overall demand is
0%
slightly higher on weekends and peaks between 9am and
8a 8am
9a -9am
am m
am am
12 2pm
1p pm
2p pm
3p pm
4p pm
5p 5pm
6p pm
pm
2pm. Some lots and areas were in higher demand than
10 -10a
11 -11
-1
-2
-3
-4
-6
-7
-
-1
-
m
m
pm
m
m
m
m
m
m
others. The color-coded tables and maps on pg. 17-21
m
7a
illustrate demand for each lot. Time of Day
-17-Parking Study Area
Private Lots
Public Lots
Top 5 Most Used Lots on Weekdays All public parking lots are free to use and, with a
Average handful of exceptions, do not have time limits or restrictions.
Rank Lot ID # Lot Location Peak Time
Use The study found that adequate parking exists within
Court St. on-street lot on west
downtown. Even at peak times, and in popular areas, parking
1 13 67% 8am-2pm is still available within reasonable walking distance of any
side of Town Hall
destination within downtown. Special events and infrequent
West Main St. on-street lot in
2 9
front of YummiYarns
58% 2pm-7pm occurrences, such as festivals or days when court is in
session, may strain available parking. However, these
Town Square on-street lot in instances are outliers.
3 21 57% 11am-2pm
front of The Colorful Gypsy
In the event that parking demand increases
4 7
West Main St. off-street lot in
55% 10am-6pm substantially, the Town should explore imposing time
front of Chamber of Commerce limits on more lots and increasing signage to direct drivers
Private lot (used publicly) to larger off-street lots, such as the one across from
5 18 54% 9am-5pm
southwest of Town Hall Mountain Village Apartments. Imposing time limits should
be approached with caution, however, as they discourage
Top 5 Most Used Lots on Weekends exploring downtown and require consistent enforcement to
Average be effective.
Rank Lot ID # Lot Location Peak Time
Use The Burnsville Zoning Ordinance requires new
Town Square on-street lot in developments to provide minimum amounts of off-street
1 33 77% 2pm - 7pm
front of Nu Wray Inn parking unless they are within the C-1 Central Business
District. The amount of parking required is based on land
2 26 Town Square south on-street lot 73% 10am-2pm
use, as shown in the tables on pg. 22-24. The tables also
Town Square on-street lot in contain off-street parking requirements from neighboring
3 21 67% 10am-5pm municipalities for comparison. Towns across the nation
front of The Colorful Gypsy
have reduced or removed off-street parking over the past
Court St. on-street lot on west
4 13
side of Town Hall
62% 11am-6pm two decades. Parking requirements increase development
costs and stormwater runoff, consume space and reduce
Town Square on-street lot in
5 30 58% 12pm-2pm tax value per acre. Burnsville should periodically review their
front of Garden Deli
parking requirements to ensure minimums are justified.Weekday Parking Patterns Percentage of Lot Occupied by Time of Day
m
m
pm
m
2p
1a
pm
pm
pm
pm
pm
pm
am
am
0a
-1
-1
-1
Total ADA
-2
-3
-4
-5
-6
-7
-8
-9
-1
Average Peak
pm
am
am
m
m
m
m
m
m
m
m
m
Lot # Spaces Spaces Use Use
10
11
12
1p
2p
3p
4p
5p
6p
7a
8a
9a
1 20 0 5% 20% 25% 30% 20% 25% 20% 40% 35% 50% 40% 30% 28% 50%
2 22 1 0% 9% 0% 9% 18% 32% 23% 18% 23% 18% 18% 14% 15% 32%
3 14 0 14% 7% 21% 14% 14% 14% 14% 14% 21% 21% 21% 21% 17% 21%
4 7 0 29% 43% 43% 57% 71% 71% 71% 43% 43% 71% 43% 14% 50% 71%
5 7 0 14% 14% 14% 29% 14% 14% 29% 14% 14% 14% 14% 14% 17% 29%
6 6 0 17% 17% 0% 33% 50% 33% 67% 50% 33% 33% 17% 0% 29% 67%
7 6 0 33% 33% 33% 67% 67% 67% 67% 67% 67% 67% 67% 50% 57% 67%
8 10 1 0% 10% 10% 10% 10% 10% 10% 10% 10% 10% 0% 0% 8% 10%
9 5 0 20% 80% 40% 60% 80% 20% 60% 80% 80% 20% 80% 80% 58% 80%
10 18 1 39% 39% 44% 39% 61% 44% 56% 50% 50% 44% 39% 28% 44% 61%
11 8 0 13% 75% 25% 63% 63% 75% 25% 50% 88% 50% 63% 63% 54% 88%
12 3 1 33% 67% 0% 67% 0% 0% 67% 33% 33% 33% 0% 33% 31% 67%
13 5 0 60% 80% 80% 80% 80% 80% 80% 60% 80% 40% 40% 40% 67% 80%
14 17 0 6% 6% 0% 0% 0% 0% 6% 6% 0% 0% 6% 0% 2% 6%
15 11 0 9% 9% 9% 9% 9% 9% 9% 9% 9% 9% 9% 9% 9% 9%
16 28 0 0% 0% 4% 11% 11% 7% 0% 4% 4% 4% 0% 0% 4% 11%
17 14 0 0% 14% 14% 14% 14% 7% 7% 7% 14% 7% 7% 7% 10% 14%
18 8 0 25% 50% 75% 75% 75% 75% 63% 63% 75% 63% 25% 0% 55% 75%
19 16 0 31% 44% 56% 44% 50% 38% 44% 31% 25% 25% 6% 0% 33% 56%
20 7 0 29% 29% 29% 57% 43% 29% 57% 71% 57% 29% 0% 0% 36% 71%
21 7 0 29% 29% 71% 71% 100% 100% 86% 57% 71% 43% 29% 0% 57% 100%
22 15 0 20% 27% 33% 40% 33% 40% 40% 67% 47% 40% 40% 33% 38% 67%
23 9 0 22% 22% 11% 33% 56% 56% 33% 11% 33% 0% 11% 0% 24% 56%
24 3 1 33% 33% 0% 67% 67% 67% 67% 33% 0% 0% 33% 0% 33% 67%
25 10 0 0% 10% 10% 30% 30% 10% 20% 10% 20% 10% 10% 10% 14% 30%
26 7 0 29% 43% 71% 43% 43% 71% 57% 57% 29% 29% 14% 57% 45% 71%
27 7 1 14% 14% 14% 43% 14% 14% 29% 29% 29% 43% 0% 0% 20% 43%
28 8 0 0% 0% 13% 50% 75% 75% 75% 50% 50% 63% 50% 50% 46% 75%
29 30 3 10% 13% 23% 30% 37% 37% 27% 33% 33% 20% 13% 30% 26% 37%
30 12 0 0% 25% 17% 17% 75% 83% 58% 17% 92% 67% 100% 92% 53% 100%
31 5 0 0% 0% 20% 0% 40% 80% 20% 20% 20% 20% 60% 80% 30% 80%
32 3 0 0% 0% 33% 67% 67% 100% 33% 67% 67% 33% 33% 67% 47% 100%
33 4 0 25% 25% 50% 100% 75% 75% 75% 50% 25% 25% 50% 25% 50% 100%
34 10 2 20% 40% 50% 90% 30% 50% 40% 30% 40% 30% 30% 30% 40% 90%
35 14 0 14% 43% 36% 36% 43% 43% 57% 43% 43% 36% 7% 7% 34% 57%
36 22 0 0% 5% 5% 0% 5% 5% 5% 5% 5% 5% 0% 0% 3% 5%
37 9 0 33% 56% 67% 67% 56% 44% 44% 44% 44% 33% 11% 11% 43% 67%
38 40 4 18% 63% 70% 60% 70% 60% 63% 68% 73% 68% 18% 18% 54% 73%
39 38 0 42% 42% 42% 37% 39% 39% 39% 45% 39% 39% 39% 34% 40% 45%
508 16 18% 29% 30% 42% 44% 44% 42% 37% 39% 31% 27% 24%
Totals Average Total Parking Use Within the Entire Study Area by Time of DayWeekend Parking Patterns Percentage of Lot Occupied by Time of Day
m
m
pm
m
2p
1a
pm
pm
pm
pm
pm
pm
am
am
0a
-1
-1
-1
Total ADA
-2
-3
-4
-5
-6
-7
-8
-9
-1
Average Peak
pm
am
am
m
m
m
m
m
m
m
m
m
Lot # Spaces Spaces Use Use
10
11
12
1p
2p
3p
4p
5p
6p
7a
8a
9a
1 20 0 25% 25% 30% 20% 15% 15% 20% 5% 5% 15% 15% 20% 18% 30%
2 22 1 0% 0% 5% 9% 5% 14% 9% 9% 9% 14% 5% 5% 7% 14%
3 14 0 14% 14% 14% 14% 21% 21% 29% 29% 36% 21% 21% 21% 21% 36%
4 7 0 29% 29% 29% 43% 57% 57% 43% 57% 57% 43% 14% 14% 39% 57%
5 7 0 14% 14% 14% 14% 29% 29% 29% 29% 43% 43% 14% 29% 25% 43%
6 6 0 17% 17% 17% 17% 50% 50% 67% 67% 50% 83% 67% 50% 46% 83%
7 6 0 0% 0% 33% 67% 67% 50% 17% 50% 17% 33% 17% 67% 35% 67%
8 10 1 0% 0% 0% 10% 20% 20% 10% 10% 30% 10% 10% 10% 11% 30%
9 5 0 0% 0% 60% 100% 80% 100% 100% 60% 20% 60% 0% 40% 52% 100%
10 18 1 33% 39% 28% 33% 44% 67% 44% 44% 33% 28% 17% 17% 36% 67%
11 8 0 13% 38% 25% 88% 38% 63% 88% 63% 63% 88% 63% 50% 56% 88%
12 3 1 0% 33% 67% 67% 33% 67% 100% 33% 33% 33% 0% 0% 39% 100%
13 5 0 40% 40% 40% 60% 80% 80% 60% 60% 80% 80% 80% 40% 62% 80%
14 17 0 12% 12% 18% 18% 18% 24% 24% 24% 24% 6% 0% 0% 15% 24%
15 11 0 9% 9% 9% 9% 9% 9% 9% 9% 9% 9% 9% 9% 9% 9%
16 28 0 0% 4% 4% 14% 21% 11% 4% 4% 4% 4% 4% 0% 6% 21%
17 14 0 0% 7% 7% 7% 7% 7% 7% 7% 0% 7% 7% 7% 6% 7%
18 8 0 Farmer’s Market (100%) 0% 0% 0% 0% 13% 0% 51% 100%
19 16 0 Farmer’s Market (100%) 6% 6% 0% 13% 6% 0% 53% 100%
20 7 0 43% 86% 71% 86% 29% 86% 14% 57% 14% 43% 14% 0% 45% 86%
21 7 0 0% 29% 43% 100% 100% 71% 100% 57% 86% 100% 71% 43% 67% 100%
22 15 0 20% 20% 27% 33% 47% 47% 33% 40% 27% 20% 27% 27% 31% 47%
23 9 0 0% 11% 11% 44% 56% 44% 33% 33% 11% 0% 0% 0% 20% 56%
24 3 1 67% 67% 33% 67% 67% 67% 67% 67% 67% 67% 0% 0% 53% 67%
25 10 0 10% 30% 50% 60% 30% 20% 30% 20% 10% 10% 10% 10% 24% 60%
26 7 0 57% 71% 71% 100% 100% 71% 100% 71% 57% 57% 57% 57% 73% 100%
27 7 1 57% 29% 43% 29% 43% 43% 29% 29% 29% 29% 29% 14% 33% 57%
28 8 0 0% 13% 38% 75% 100% 50% 75% 50% 25% 13% 25% 75% 45% 100%
29 30 3 10% 7% 10% 13% 7% 10% 13% 10% 3% 3% 17% 17% 10% 17%
30 12 0 0% 0% 17% 58% 75% 92% 100% 67% 58% 50% 92% 83% 58% 100%
31 5 0 20% 0% 20% 0% 20% 100% 80% 60% 60% 40% 80% 60% 45% 100%
32 3 0 0% 0% 0% 33% 67% 67% 67% 33% 0% 33% 100% 100% 42% 100%
33 4 0 50% 50% 50% 50% 75% 75% 75% 100% 100% 100% 100% 100% 77% 100%
34 10 2 30% 20% 20% 50% 50% 30% 40% 50% 40% 40% 40% 50% 38% 50%
35 14 0 7% 7% 14% 29% 29% 57% 29% 43% 29% 21% 21% 7% 24% 57%
36 22 0 0% 0% 0% 0% 0% 0% 0% 0% 0% 0% 0% 0% 0% 0%
37 9 0 0% 0% 0% 0% 0% 0% 0% 0% 0% 0% 0% 0% 0% 0%
38 40 4 18% 18% 18% 15% 18% 18% 18% 18% 18% 18% 18% 18% 17% 18%
39 38 0 45% 47% 45% 45% 50% 58% 45% 47% 45% 42% 45% 45% 46% 58%
508 16 22% 25% 43% 43% 45% 48% 41% 36% 30% 33% 28% 28%
Totals Average Total Parking Use Within the Entire Study Area by Time of DayAverage Weekday Parking Demand, 7am - 11am
Average Weekday Parking Demand, 11am - 3pm
-21-Average Weekday Parking Demand, 3pm - 7pm
Average Weekend Parking Demand, 7am - 11am
Note: The Farmers Market is held on
Saturday mornings, which accounts
for the two 100% lots shown here
-22-Average Weekend Parking Demand, 11am - 3pm
Average Weekend Parking Demand, 3pm - 7pm
-23-Off-Street Parking Minimum Requirements
Zoning Requirements by Community
Use Burnsville, NC Spruce Pine, NC Mars Hill, NC Erwin, TN
Single-Family Dwellings 2 spaces per dwelling unit 1 space per dwelling unit 2 spaces per dwelling unit 1 space per dwelling unit
Multi-Family Dwellings 1.5 spaces per dwelling unit 1 space per dwelling unit 2 spaces per dwelling unit 1 space per dwelling unit
Residential & Accommodations
1 space for each guest room 1 space for each 4 employees
Rooming Houses/Boarding 1 space for each bedroom
+ 1 space for each 2 1 space for each guest room + 1 space for each 2 guest
Houses/Hotels available to rent
employees rooms
1 space for each guest room 1 space for each 1 space for each 4 employees
Motels/Tourist Courts + 1 space for each 2 accommodation or trailer N/A + 1 space for each 2 guest
employees space rooms
2 spaces for each mobile
Mobile Homes 1 space per dwelling unit 2 spaces per dwelling unit 1 space per dwelling unit
home
1 space per mobile home +
2 spaces for each mobile 2 spaces per mobile home
Mobile Home Parks 1 space per dwelling unit 1 space for each 4 mobile
home space space
homes
1 space in addition to
Customary Incidental Home
other applicable parking N/A N/A N/A
Occupations
requirements
Zoning Requirements by Community
Use Burnsville, NC Spruce Pine, NC Mars Hill, NC Erwin, TN
Churches 1 space per 2 seats 1 space per 5 seats 1 space per 3 seats 1 space per 4 seats
Community Centers 1 space per 2 seats 1 space per 4 seats 1 space/100ft² 1 space per 4 seats
Fraternal Organizations & Clubs 1 space per 2 seats 1 space per 4 seats 1 space/4 seats + 1/100ft² 1 space/300ft2 over 1,000ft2
Public Associations 1 space per 2 seats 1 space per 4 seats 1 space/4 seats + 1/100ft² 1 space per 4 seats
Stadiums 1 space per 2 seats 1 space per 4 seats 1 space/4 seats + 1/100ft² 1 space per 4 seats
Assembly Halls 1 space per 2 seats 1 space per 4 seats 1 space/4 seats + 1/100ft² 1 space per 4 seats
Public Facilities & Gathering Places
Auditoriums 1 space per 2 seats 1 space per 4 seats 1 space/4 seats + 1/100ft² 1 space per 4 seats
Gymnasiums 1 space per 2 seats 1 space per 4 seats 1 space/4 seats + 1/100ft² 1 space per 4 seats
Indoor Theaters 1 space per 2 seats N/A 1 space/4 seats + 1/100ft² 1 space per 4 seats
Schools (except high schools & 1 space per classroom & 1 space per classroom & 1 space per employee +1 1 space for each faculty
trade schools) administrative office administrative office space/400ft2 assembly area member
1 space per 10 students + 1 2 spaces per classroom & 1 space for each faculty
High Schools space for each classroom & 1 space per each 4 pupils administrative office + 1 member + 1 space for each 4
administrative office space per employee students
Trade Schools 1 space for each 3 students N/A N/A N/A
Tennis Courts 2 spaces per court N/A 2 spaces per court N/A
Swimming Pools 1 space/140ft2 of pool N/A N/A N/A
Shooting Ranges 1 space per target area N/A N/A N/A
Physical Fitness Facilities 1 space/50ft2 1 space/200ft2 N/A N/A
10 spaces per field or 1 space per each 5 customers
Playgrounds N/A N/A
playground of max capacity
Golf Courses & Country Clubs 2 spaces per tee N/A N/A N/A
-24-Zoning Requirements by Community
Use Burnsville, NC Spruce Pine, NC Mars Hill, NC Erwin, TN
5 spaces for each grease rack 2 spaces for each grease rack
3 spaces per each grease 2 spaces for each bay + 1
Gas/Service Stations + 5 spaces for each wash or wash rack + 1 space for
rack + 2 spaces per gas pump space for each employee
rack each 2 gas pumps
Skating Rinks & Bowling Alleys 1 space/200ft² N/A N/A N/A
1 space for each employee
1 space per staff member + 1
Daycare Facilities N/A and each school vehicle + 1 N/A
space for each 5 students
space for every 5 children
1 space/200ft² + 1 space for 1 space/200ft² + 1 space for
Banks 1 space/150ft² N/A
each 2 employees each 2 employees
Museums & Art Galleries 1 space/200ft² 1 space/200ft² N/A
1 space per 4 seats in 1 space for each 4 seats in 1 space for each 2 seats in 1 space for each 4 seats in
Funeral Homes
assembly room or chapel the chapel or parlor the assembly room or chapel the chapel
1 space/300ft² + 1 space for
Offices: Business & Professional 1 space/300ft² 1 space/300ft² 1 space/400ft²
each 2 employees
1 space for each 3 seating
1 space for each 4 employees
1 space for each 3 seats OR 1 accommodations + 1 space
Restaurants: Indoor N/A + 1 space/100ft² of floor
space/100ft² for each 2 employees on shift
space devoted to patron use
of greatest employment
1 space for each 3 seating
1 space for each 4 employees
1 space for each 2 seats OR 1 accommodations + 1 space
Restaurants: Drive-in/Takeout N/A + 1 space/100ft² of floor
space/80ft² for each 2 employees on shift
Commercial Establishments
space devoted to patron use
of greatest employment
Animal Hospitals 1 space/200ft² N/A N/A N/A
Kennels 1 space for each 4 pens N/A N/A N/A
1 space for each 2 employees
on the shift with the largest 1 space for each employee +
1 space/300ft² + 1 space for
Motor Vehicle Repair employment + 1 space/300ft² N/A 1 space/250ft2 of floor space
each 2 employees
of repair or maintenance used for repair work
space
4 spaces for each 4 spaces for each
Outdoor Sales Establishments salesperson + 1 space for salesperson + 1 space for N/A N/A
each 2 employees each 2 employees
1 space for each 2 employees
on the shift with the largest
employment. Reserve spaces
Car Washes N/A N/A N/A
equal to 5x the capacity of the
facility at the location of both
ingress and egress
1 space/200ft² of sales area
+ 1 space/600ft² of storage
Retail 1 space/333ft² 1 space/100ft² 1 space/200ft²
area + 1 space for each 2
employees
1 space for each employee
1 space for each 2 employees at maximum employment
1 space for each 3
1 space for each 2 employees at maximum employment on a single shift + 1 space
employees, computed on the
Manufacturing on the shift with the largest on a single shift + 1 space for each company vehicle
largest number of employees
employment for each company vehicle operating from the premises
on duty at any period of time
operating from the premises + 1 space/200ft² of sales and
office area.
Shopping Centers 3 parking spaces/1,000ft² 1 space/100ft² sum of individual uses within N/A
1.5 spaces/1,000ft² OR 1 1 space/300ft² + 1 space for
Veterinary Clinics 1/300ft² N/A
space for every 4 employees each 2 employees
-25-Zoning Requirements by Community
Use Burnsville, NC Spruce Pine, NC Mars Hill, NC Erwin, TN
1 space per every 2 beds 1 space for each 2 staff or
1 space for each 2 beds + 1 space for each 4 beds +
+ 1 space for each staff or visiting doctors + 1 space for
1 space for each staff or 1 space for each staff or
Hospitals visiting doctor + 1 space for each 2 employees on largest
visiting doctor + 1 space for visiting doctor + 1 space for
each 2 employees on shift of shift + 1 space for each 4
each 2 employees each employee
greatest employment beds
Medical Facilities
1 space per every 2 beds 1 space for each 2 staff or
1 space for each 2 beds + 1 space for each 4 beds +
+ 1 space for each staff or visiting doctors + 1 space for
Nursing Homes & 1 space for each staff or 1 space for each staff or
visiting doctor + 1 space for each 2 employees on largest
Convalescent Homes visiting doctor + 1 space for visiting doctor + 1 space for
each 2 employees on shift of shift + 1 space for each 4
each 2 employees each employee
greatest employment beds
1 space per every 2 beds
1 space for each 4 beds +
+ 1 space for each staff or
1 space for each staff or
Group Care Facilities visiting doctor + 1 space for N/A N/A
visiting doctor + 1 space for
each 2 employees on shift of
each employee
greatest employment
6 spaces per doctor + 1 per
Medical & Dental Offices 3.5 spaces/1,000ft² 5 spaces per doctor 1 space/300ft²
employee
Utilities
The availability and capacity of public utilities often approximately 3,825 people. Given Burnsville’s most recent
dictates the location and intensity of development. This population estimate of 1,709, one can calculate that about
plan will focus on water and wastewater service, since both 55% of the water system’s customers live outside Town
services are provided by the Town of Burnsville. However, it limits. The total number of metered connections has
is also helpful to briefly summarize the availability of other decreased by 6% since 2010.
major utilities - natural gas, electric, and internet. Residential users account for most of the system’s
Piedmont Natural Gas offers service within connections (81.5%), but industrial, commercial, and
downtown, the immediate vicinity, and along US Hwy 19E. industrial customers consume much more water per
Burnsville is located at the end of Piedmont’s distribution connection. As illustrated by the infographic below, on
network, which makes extensions and connections for large average commercial users consume nearly twice as much
users challenging. The company only installs new natural water per connection as residential users. Institutional users
gas pipeline when they reasonably assess that demand consume fifteen times more water per connection. Industrial
within a neighborhood or new development is high enough users consume the most water per connection - an average
to provide a return on their upfront investment. of 14,750 gallons a day - the equivalent of 128 homes.
French Broad Electric Membership Corporation
provides electrical service to Burnsville and Yancey County. Burnsville Average Daily Individual Water Usage
They operate a physical office and operations base on West by User Type, 2019 (shown to scale)
Main Street. 3-phase electric, which many commercial and Source: NCDEQ Local Water Supply Plan, 2019
industrial users require, is available within Town. French
Broad also partners with the United States Department of
Agriculture to offer the Rural Economic Development Loan Residential Users
and Grant program, which provides funding to local non- 115
profit organizations for projects that will create and retain gallons per day
employment in rural areas.
Burnsville is fortunate to have high-speed fiber
internet service throughout Town. The provider, Country
Cablevision, used a $25,300,000 grant from USDA’s Rural
Utilities Service in 2010 to run over 909 miles of fiber optic
cable in Yancey and Mitchell counties. The service provides
Commercial Users Industrial Users
229 229
internet speeds more than capable of handling modern
gallons per day
bandwidth demands. Free Wi-Fi is available for visitors and gallons per day
shoppers to use in the downtown area.
Burnsville is the only public water provider in
Yancey County. Its system, which has operated for over 100
years, includes approximately 46 miles of water main (see
next page for a service area map). As of 2019, Burnsville Institutional Users
served just under 1,500 metered connections, representing 1,727
gallons per day
-26-Areas Within 500ft of a Water Main
Burnsville Water System Pipeline Inventory
Source: Burnsville Asset Management & CIP, 2016
Category Feet Miles % of Total
12-inch 36,770 7.0 15.2%
10-inch 1,234 0.2 0.5%
Burnsville’s 46 miles of water main consist of pipes
8-inch 34,394 6.5 14.3% of varying age and structure. The chart to the left provides
a detailed breakdown. Burnsville has replaced 28,573 linear
Diameter
6-inch 60,512 11.5 25.1%
feet (5.4 miles) of water distribution lines and added 23,029
4-inch 14,678 2.8 6.1%
linear feet (4.36 miles) of new distribution lines since 2010.
2-inch 86,923 16.5 36.0% The system’s primary water source is a raw
1-inch 3,489 0.7 1.4% water intake on the Cane River, which is located south of
Burnsville. There are also two emergency raw water intakes
3/4-inch 3,225 0.6 1.3%
on Bowlens Creek. Raw water is piped to the system’s sole
Asbestos Cement 9,111 1.7 3.8% treatment plant, which pumps potable water to a 275,000
Cast Iron 20,382 3.9 8.4% gallon clearwell, an adjacent 2,000,000 gallon primary
storage tank, and a 300,000 gallon tank near Altec. The
Copper 454 0.1 0.2%
treatment plant was constructed in 1989.
Material
Ductile Iron 77,067 14.6 31.9% Utilities within North Carolina are required to
Galvanized 16,882 3.2 7.0%
submit usage and system data to the State’s Department of
Environmental Quality (NCDEQ) each year. NCDEQ compiles
HDPE 1,426 0.3 0.6% this information into a report and uses it to track trends
PVC 115,903 22.0 48.0% and anticipate long-term needs. Much of the information
contained in this section is derived from those reports.
Good 84,362 16.0 35.0%
NCDEQ’s 2019 report found that Burnsville used 49% of its
Condition
Fair 105,800 20.0 43.9% permitted raw water supply. That level of usage is consistent
Poor 51,063 9.7 21.2% with recent years, as shown on the chart on the next page.
NCDEQ projects that Burnsville’s water system will use 78%
Over 50 years 17,404 3.3 7.2%
of its capacity by 2040.
40 - 49 years 23,637 4.5 9.8% According to NCDEQ’s Local Water Supply Plan for
30 - 39 years 56,403 10.7 23.4% Burnsville, total water usage for the system rose steadily
Age
from 2010-2018, before declining in 2019. Decreases in
20 - 29 years 66,853 12.7 27.7%
commercial, industrial, and institutional consumption
10 - 19 years 44,429 8.4 18.4% accounted for most of the loss. Those user types, though
Less than 10 years 32,499 6.2 13.5%
small in number, make up an out-sized portion of system-
wide consumption. This is illustrated by the chart on the
System Total 241,225 45.7 following page.
Burnsville Water System, Number of Meters by Use, 2010-2019
Source: NCDEQ Local Water Supply Plans, 2010-2019
Type 2010 2011 2012 2013 2014 2015 2016 2017 2018 2019
Residential 1,301 1,308 1,205 1,198 1,200 1,188 1,205 1,207 1,241 1,211
Commercial 258 258 242 243 242 250 251 247 260 249
Industrial 4 4 5 5 8 8 4 4 4 4
Institutional 17 17 19 19 20 20 19 19 25 22
-27-You can also read