Closing the gap Financing and resourcing of protected and conserved areas in Eastern and Southern Africa - IUCN Portal
←
→
Page content transcription
If your browser does not render page correctly, please read the page content below
Closing the gap
Financing and resourcing of protected and conserved areas in Eastern
and Southern Africa

INTERNATIONAL UNION FOR CONSERVATION OF NATURE - BIOPAMA PROGRAMME
Financing and resourcing of protected and conserved areas in Eastern and Southern Africa

Closing the gap
Financing and resourcing of protected and conserved areas in Eastern
and Southern Africa

                                                                                                             I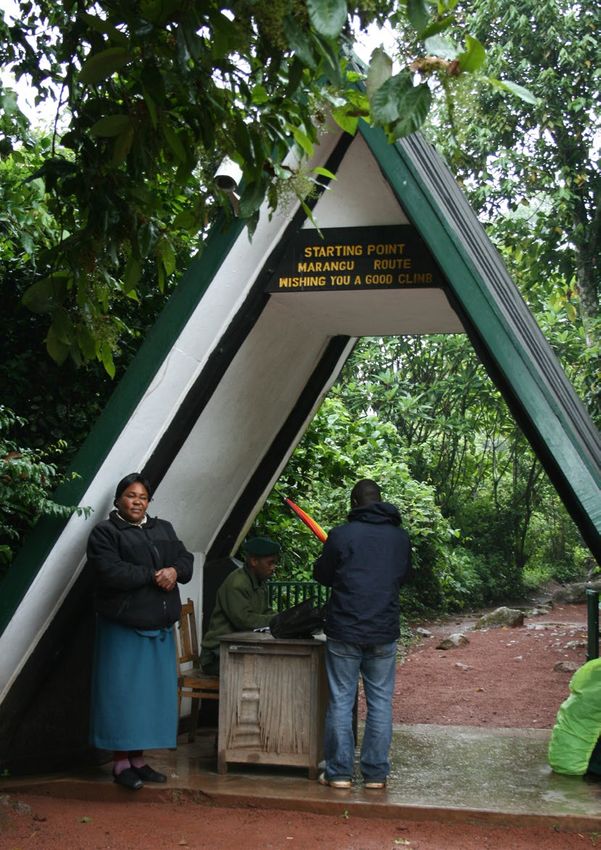
Closing the gap

The designation of geographical entities in this book, and the presentation of the material, do not imply the
expression of any opinion whatsoever on the part of IUCN [**or other participating organisations] concerning the
legal status of any country, territory, or area, or of its authorities, or concerning the delimitation of its frontiers
or boundaries.
The views expressed in this publication do not necessarily reflect those of the European Union, the African,
Caribbean and Pacific (ACP) Group of States, IUCN or other participating organisations.

IUCN is pleased to acknowledge the support for this publication produced under the Biodiversity and Protected
Areas Management (BIOPAMA) Programme, an initiative of the African, Caribbean and Pacific (ACP) Group of States
financed by the 11th European Development Fund (EDF) of the European Union. BIOPAMA is jointly implemented
by the International Union for Conservation of Nature and the Joint Research Centre of the European Commission.

IUCN acknowledges Conservation Capital for providing substantive content to this report.

Published by:                           IUCN Regional Office for Eastern and Southern Africa, in collaboration with
                                        the Biodiversity and Protected Areas Management (BIOPAMA) Programme

Copyright:                              © 2020 IUCN, International Union for Conservation of Nature and Natural
                                        Resources

                                        Reproduction of this publication for educational or other non-commercial
                                        purposes is authorised without prior written permission from the copyright
                                        holder provided the source is fully acknowledged.

                                        Reproduction of this publication for resale or other commercial purposes is
                                        prohibited without prior written permission of the copyright holder.

Citation:                               IUCN ESARO (2020). Closing the gap. The financing and resourcing of
                                        protected and conserved areas in Eastern and Southern Africa. Nairobi,
                                        Kenya: IUCN ESARO; BIOPAMA.

Cover photo:                            Micheile Henderson - Unsplash

Layout by:                              Penrose CDB

Available from:                         IUCN, International Union for Conservation of Nature
                                        The Biodiversity and Protected Areas Management (BIOPAMA) Programme
                                        Rue Mauverney 28
                                        1196 Gland, Switzerland
                                        biopama@iucn.org
                                        www.iucn.org/resources/publications
                                        www.biopama.org

II
Financing and resourcing of protected and conserved areas in Eastern and Southern Africa

 Table of contents
    Executive summary                                                                                              IV
    Glossary and list of acronyms                                                                                  IX
 1. Introduction                                                                                                    1
 2. Methodology                                                                                                     3
 3. The funding gap in Eastern and Southern Africa                                                                  8
     3.1 The global biodiversity funding gap                                                                        9
     3.2 The need to increase the protected area estate and related funding                                         9
     3.3 Protected and conserved areas in Eastern and Southern Africa                                              10
     3.4 Downgrading, downsizing, and degazettement of protected areas in Eastern                                  12
     and Southern Africa
     3.5 Protected area expansion in Eastern and Southern Africa                                                    14
     3.6 Protected area expenditures and revenue flow                                                               15
     3.7 Eastern and Southern Africa’s biodiversity financing and resourcing                                        16
     challenge
 4. Traditional sources of finance for protected areas                                                            20
     4.1 Government support                                                                                        21
     4.2 Donor support                                                                                            22
     4.3 Nature-based tourism                                                                                      25
     4.4 Utilisation                                                                                              28
 5. Maximising self-generated revenue through nature-based tourism                                                32
     5.1 The nature-based tourism market                                                                          33
     5.2 The benefits of nature-based tourism                                                                      35
     5.3 Opportunities for further development of nature-based tourism in ESA                                      37
 6. Emerging sources of finance for protected areas                                                                41
     6.1 Conservation Trust Funds                                                                                 42
     6.2 Debt for Nature Swaps                                                                                    44
     6.3 Payment for Ecosystem Services                                                                           47
     6.4 Mitigation measures / Biodiversity offsets                                                               50
     6.5. Collaborative management / Public-Private Partnerships                                                   52
 7. New sources of finance for protected areas                                                                    56
     7.1 Outcomes-based financing mechanisms                                                                       57
     7.2 Green and blue bonds                                                                                      57
     7.3 Tax incentives                                                                                            58
     7.4 Project Finance for Permanence                                                                            59
     7.5 Other                                                                                                    60
 8. Conclusion                                                                                                    62
    Bibliography                                                                                                  XII
    Annexes                                                                                                      XXII
         Conservation Trust Funds                                                                                XXIII
         Debt for Nature Swaps                                                                                   XXIV
         Payment for Ecosystem Services                                                                          XXIV

Photo: Photo caption

                                                                                                                         III
Closing the gap
|Executive summary
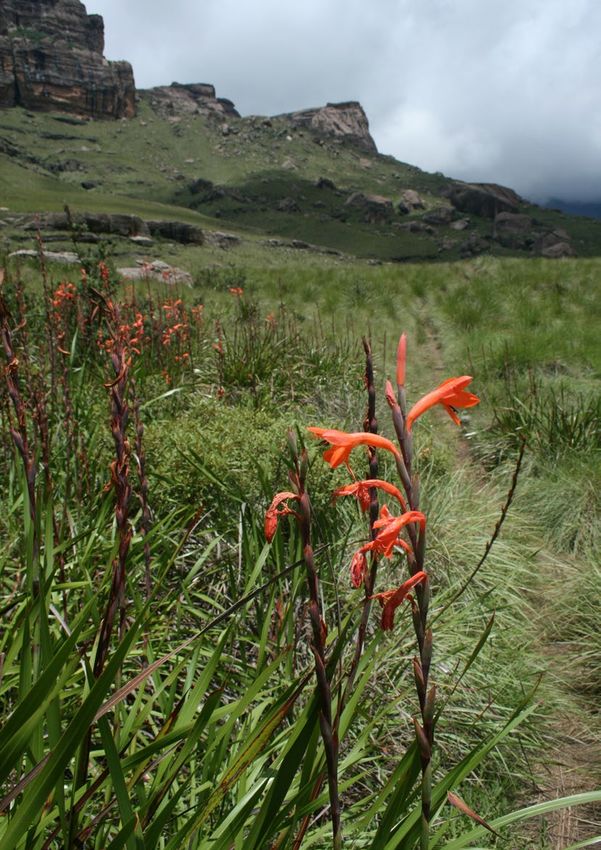
Photo: Ukhahlamba Drakensberg Park - IUCN
IV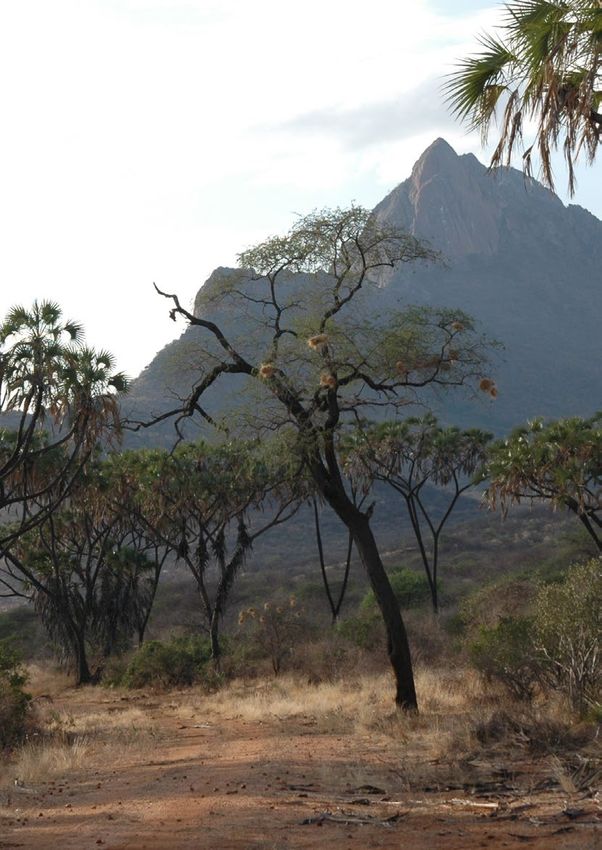
Financing and resourcing of protected and conserved areas in Eastern and Southern Africa

The funding gap                                                     Many protected areas in the Eastern and Southern African
                                                                    region have significant economic potential and can
                                                                    optimise their economic potential if revenue generating
Africa’s protected and conserved areas play a vital role in
                                                                    models are designed properly. While not all areas have the
sustaining human well-being, protecting biodiversity and
                                                                    inherent values and potential as some of the more iconic
providing valuable ecosystem services upon which people,
                                                                    and accessible landscapes, the vast majority of protected
wildlife and economies depend. However, these natural
                                                                    areas can do more to develop internal revenue sources and
assets are not adequately funded, putting them and the
                                                                    increase revenue.
services they provide at risk. Global and regional studies
have been done on the financial gap and all conclude that
                                                                    Nature-based tourism in particular represents a significant
a significant gap exists for the funding and resourcing of
                                                                    opportunity to develop and maximise revenue streams for
protected areas (PAs).
                                                                    conservation and to generate benefits for communities.
                                                                    The Eastern and Southern African region is well placed
Perhaps the most striking example of this financing gap
                                                                    to maximise tourism related revenues for conservation,
in the Eastern and Southern African region is a recent
                                                                    including developing products and services that serve
assessment of the annual cost of managing protected areas
                                                                    different market segments and optimising existing and new
that support lions. This study assessed more than 282 state-
                                                                    concession agreements. An enabling policy environment
owned protected areas and concluded that available funding
                                                                    and factors such as appropriate infrastructure, ease of
only satisfied 10-20% of management needs. In total, the
                                                                    access, and safety and security, alongside inherent values
funding gap for Africa’s PAs with lions was estimated at
                                                                    such as large intact landscape and charismatic wildlife are
approximately USD 1.5 billion per annum (Lindsey, P.A., et
                                                                    prerequisites for the successful development of nature-
al., 2018).
                                                                    tourism.

While PAs with lions are more expensive to manage
                                                                    In addition to the traditional sources of funding, there are
and budget requirements differ from protected area to
                                                                    also various other financing options, either already in use
protected area, the outcome of this study provides a stark
                                                                    or in development across the Eastern and Southern Africa
reminder of the sheer size of the annual conservation
                                                                    region. These include emerging finance mechanisms such
financing gap in Africa. Personal communications with a
                                                                    as Debt for Nature Swaps (DNS) and biodiversity offsets as
range of conservation actors (governments, PA agencies,
                                                                    well as more creative mechanisms such as outcomes-based
private individuals, community associations and non-
                                                                    financing, green or blue bonds and tax incentives. There is
profit organisations) during the development of this report
                                                                    significant opportunity to scale these mechanisms across
confirmed that conservation work is largely underfunded
                                                                    the region.
and severely limits conservation management.

In addition, despite the clear lack of resources for the
adequate management of the existing protected areas, there
                                                                    Reducing the funding gap
is a need to increase the PA estate to adequately conserve
                                                                    From this report it is evident that most protected and
Africa’s biological diversity and ecosystem services. This
is putting additional pressure on the already stretched             conserved areas in Eastern and Southern Africa face a
budgets of those that traditionally fund conservation work          significant funding gap and that there is a need to increase
(such as governments, donor agencies and conservation               self-generated revenues and develop innovative finance
organisations). This is especially true in developing regions,      mechanisms.
where conservation funding currently competes with other            Key recommendations in this regard include:
development objectives, such as infrastructure, education
and public health.                                                  •    Understand the gap: In order to develop and
                                                                         implement effective strategies to address the protected
                                                                         area funding gap, governments and conservation
Sources of funding                                                       management agencies and managers must first
                                                                         understand the gap by conducting an assessment for
                                                                         individual protected areas and the entire protected area
Traditional sources of funding for conservation include
                                                                         system;
government and donor support as well as self-generated
revenue, such as for example fees collected from nature-
                                                                    •    Develop and execute associated plans and strategies:
based tourism or the utilization of wildlife through hunting
                                                                         Strategies to address the gap must be developed and
and wildlife ranching.
                                                                         implemented based on actual needs, including practical
While governments and donors provide significant funding
                                                                         business or tourism development plans for individual or
for conservation, it is clear that these sources alone are
                                                                         clusters of protected areas;
inadequate to bridge the funding gap. Protected areas are
therefore increasingly underperforming and will become
more dependent on self-generated revenue.

                                                                                                                                    V
Closing the gap

•    Encourage the development of self-generated               support the development of professional PA business plans,
     revenue: Self-generated revenue, especially derived       to be used as a blueprint for development and further
     from appropriate and sustainable nature-based             fundraising.
     tourism, should be fully developed, diversified and
     maximised. Tourism must be developed with a
     professional tourism plan. Adequate funding must            Note from the Editor
     be reinvested into the natural assets generating this
     revenue, the protected areas, wildlife and ecosystems;      This report was written before the emergence of the
                                                                 global pandemic caused by Coronavirus SARS-CoV-2
•    Explore innovative finance options: Different               (COVID-19). The COVID-19 crisis has brought into
     emerging or new financing mechanisms should be              sharp focus the underlying financing and resourcing
     explored following the business plan needs outlined         challenges facing protected and conserved areas
     above. Development of these mechanisms require              around the world. For example, the pandemic has
     proper commercial due diligence, an in-depth                resulted in the shutdown of the tourism industry,
     understanding and significant technical support,            resulting in a significant decrease in conservation-
     resources and the relevant enabling environment; and        related funding for many protected areas who rely on
                                                                 tourism-based revenue.
•    Build an enabling environment: An enabling policy
     and regulatory environment is a critical requirement        The COVID-19 pandemic has exposed the risks
     and must be created to ensure that self-generated           inherent in the current funding model for protected
     revenues as well as more innovative financing solutions     areas across Eastern and Southern Africa. The crisis is
     can be developed and that revenue is used to improve        exacerbating the existing gap in funding for protected
     conservation management, secure the natural asset           areas and provides a harsh reminder of the need for
     and benefit the local communities living alongside          revenue diversification and the risks of over-reliance
     these protected areas.                                      on a single source of funding, such as tourism.

Most of these recommendations will require significant           This report highlights a number of creative financing
financial and technical support to government and                mechanisms that are already in place in Africa. These
protected areas authorities (government, private and             need to replicated and scaled up to increase the
community). It is suggested that donors and conservation         resilience of the region’s conservation estate to future
organisations prioritise and design programmes and               shocks.
activities that will improve, support and develop the
financial sustainability of protected areas and protected
areas authorities. Specifically, donors should initially

                                                                        Photo: Isimangaliso Wetland Park - Christine Mentzel

VI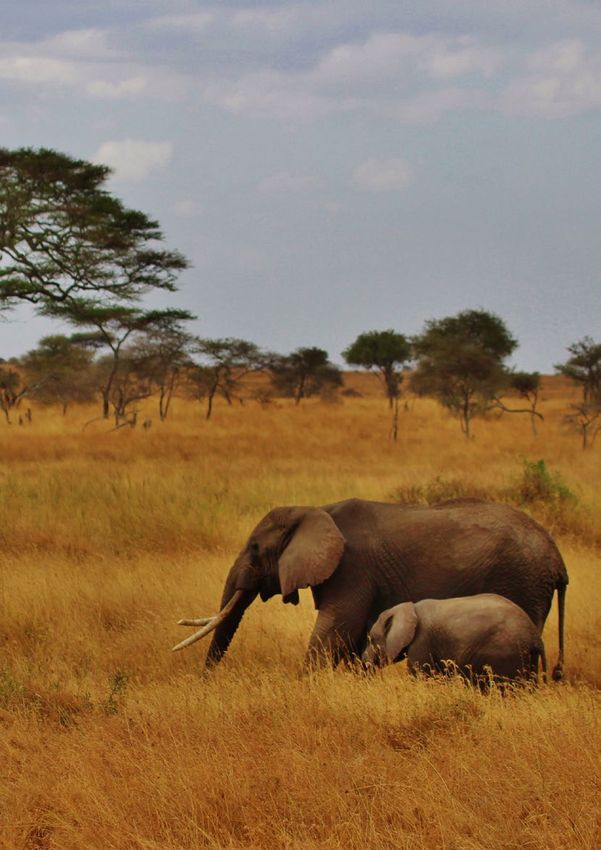
Financing and resourcing of protected and conserved areas in Eastern and Southern Africa

|Glossary and list of
                                            acronyms

                                                                    Photo: Leo Niskanen

                                                                                     VII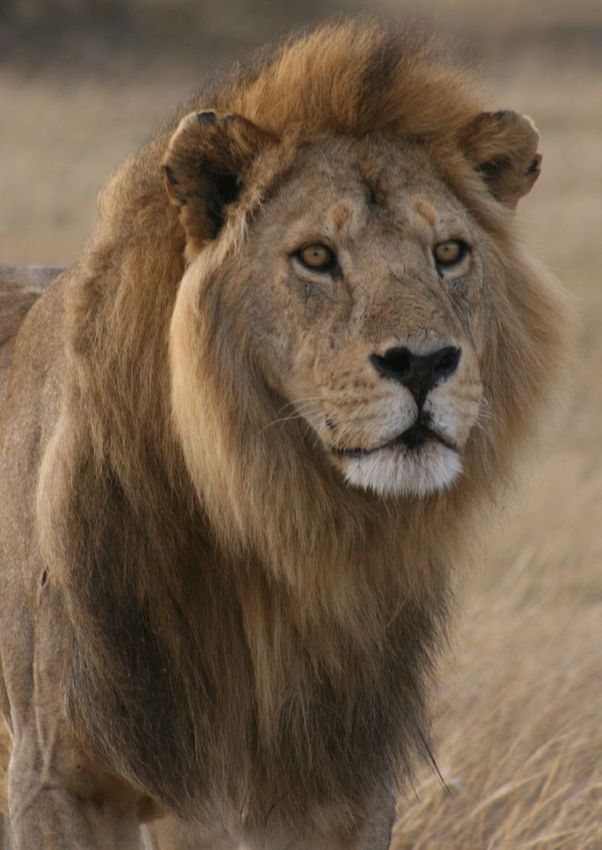
Closing the gap

Glossary
Biodiversity Offsets                               Biodiversity offsets compensate for the net impacts of a
                                                   development project after other mitigation measures have
                                                   been implemented.

Conservation Trust Fund                            Private, legally independent grant-making institutions that
                                                   provide sustainable financing for biodiversity conservation
                                                   and often finance part of the long-term management costs
                                                   of a country’s protected area system or a specific protected
                                                   area.

Collaborative management                           Collaborative management occurs when a non-profit
                                                   organisation or a private sector entity partners with a
                                                   wildlife authority, and the authority either outsources
                                                   aspects of management or specific conservation activities
                                                   to the partner organization, or enters into an agreement
                                                   with the private partner that covers the full spectrum of
                                                   management. This is increasingly taking the form of a
                                                   public-private partnership (PPP), e.g. through delegated
                                                   management, integrated co-management, bilateral co-
                                                   management, or financial and technical management.

Debt-For-Nature Swap                               An agreement that reduces a developing country’s debt
                                                   stock or service in exchange for a commitment to protect
                                                   nature from the debtor government.

Effectively and equitably managed protected area   A PA managed with planning measures in place to ensure
                                                   ecological integrity and the protection of species, habitats
                                                   and ecosystem processes, with the full participation of
                                                   indigenous and local communities, and such that costs and
                                                   benefits of the areas are fairly shared (CBD, 2020b).

Financing                                          Ability to secure stable and sufficient long-term finance
                                                   (BIOPAMA, 2019).

Green and blue bonds                               A green or blue bond is a debt instrument issued by
                                                   governments, development banks or others to raise
                                                   capital from investors to finance projects with positive
                                                   environmental, economic and climate benefits.

Joint-Venture                                      Business arrangements in which two or more parties agree
                                                   to pool their resources for the purpose of accomplishing a
                                                   specific task (Hargrave, M., 2020).

Nature-based tourism                               Nature-based tourism is any type of tourism that relies
                                                   on experiences directly related to natural attractions and
                                                   includes ecotourism, adventure tourism, extractive tourism,
                                                   wildlife tourism and nature retreats (Pacific Asia Travel
                                                   Association; 2015).

Outcomes-based financing mechanisms                Innovative financing instruments that attract investment
                                                   capital to address issues traditionally funded by the public

VIII
Financing and resourcing of protected and conserved areas in Eastern and Southern Africa
sector. Examples include species bonds and protected area
bonds where investors receive a financial return only on the
completion of the objective.
Payments for Ecosystem Services (PES) Payments for Ecosystem Services occur when a beneficiary
or user of an ecosystem service makes a direct or indirect
payment to the provider of that service.
Protected Area A protected area is a clearly defined geographical space,
recognised, dedicated and managed, through legal or other
effective means, to achieve the long term conservation
of nature with associated ecosystem services and cultural
values. (IUCN Definition 2008)
Resourcing Allocation of finance in a timely manner and appropriate
form (BIOPAMA, 2019).
List of acronyms
APN African Parks Network
AWF African Wildlife Foundation
BBDO Batten, Barton, Durstine & Osborn
BBOP Business and Biodiversity Offset Programme
BIOPAMA Biodiversity and Protected Areas Management Programme
BIOFIN Biodiversity Finance Initiative
CA Conservation Area
CAMPFIRE Communal Areas Management Programme for Indigenous
Resources
CBNRM Community-Based Natural Resource Management
CBD Convention on Biological Diversity
CFR Central Forest Reserve
CTF Conservation Trust Fund
DNS Debt for Nature Swap
DNPW Department of National Parks and Wildlife
DGEF Directorate of Environment and Forestry (Direction générale
de l’environnement et des forêts Comores)
EAC East African Community
ESA Eastern and Southern Africa
EA SOPA East Africa State of Protected Areas Report
IXClosing the gap
EWCA Ethiopian Wildlife Conservation Authority
FZS Frankfurt Zoological Society
GEF Global Environment Facility
GIZ German Corporation for International Cooperation
GMA Game Management Area
IAG International Airline Group
IUCN International Union for Conservation of Nature
JV Joint Venture
KWCA Kenya Wildlife Conservancies Association
KWS Kenya Wildlife Service
MEWT Ministry of Environment, Wildlife, and Tourism
MPA Marine Protected Area
MSR Marine Special Reserve
NACSO Namibian Association of Community Based Natural Resource
Management Support Organisations
NBSAP National Biodiversity Strategy and Action Plans
NRT Northern Rangelands Trust
OECD Organisation for Economic Cooperation and Development
PA Protected Area
PADDD Protected Area Downgrading, Downsizing, and
Degazettement
PES Payments for Ecosystem Services
RDB Rwanda Development Board
REDD Reducing Emissions from Deforestation and Forest
Degradation
SANParks South African National Parks
SMNP Simien Mountain National Park
SMSP Seychelles Marine Spatial Plan Initiative
SNPA Seychelles National Park Authority
TANAPA Tanzania National Parks Authority
TNC The Nature Conservancy
TIES The International Ecotourism Society
XFinancing and resourcing of protected and conserved areas in Eastern and Southern Africa
UN United Nations
UNDP United Nations Development Programme
UNEP United Nations Environment Programme
USAID United State Agency for International Development
UWA Uganda Wildlife Authority
WB World Bank
WCMC World Conservation Monitoring Center
WDPA World Database on Protected Areas
WMA Wildlife Management Areas
WCS Wildlife Conservation Society
WTTC World Travel and Tourism Council
ZAWA Zambia Wildlife Authority
ZPWMA Zimbabwe Parks and Wildlife Management Authority
XIFinancing and resourcing of protected and conserved areas in Eastern and Southern Africa
|
1 Introduction
Photo: Elephants - IUCN
1Closing the gap
Africa supports an extraordinary diversity of wildlife and funding gap. This report is meant to support protected area
wild lands. The continent hosts one third of the planet’s authorities and governments in understanding mechanisms
biological diversity. Approximately one quarter of the for increasing funding for conservation management and to
planet’s mammalian species and a fifth of all bird species help the International Union for the Conservation of Nature
occur in Africa (Conservation Capital, Space for Giants, design effective programmes that will help mitigate funding
Conservation Capital, Space for Giants, United Nation gaps and sustainability challenges for protected areas in
Environment Program (UNEP), 2019). Africa and support the capacity development of protected
area managers.
Protected areas have historically and continue to play a
vital role in protecting biological diversity and ecosystem Increasing revenue for protected area management is just one
services upon which Africa’s economy and people depend aspect of what is required to ensure effective conservation
(Wuerthner, G., Crist, E. and Butler, T., 2015). These management. How and where revenue is spent within a
areas need reliable and sustainable sources of funding protected area system is critical. For example, if revenue
to maintain their daily management operations, meet from a park simply supports a protected area headquarters,
conservation targets, provide quality visitor experiences, this will not result in enhanced conservation performance.
where appropriate, and provide benefits and income to The topic of revenue and capital allocation (resourcing) and
government and to the communities living in or in proximity expenditure is a critical issue and partially addressed in this
to the conservation areas. report (section 4.6). However, a detailed analysis is beyond
the scope of this report.
There have been various assessments done on how much
it costs to manage protected areas (Parker, C. et al., 2012;
Credit Suisse, World Wildlife Fund (WWF) & McKinsey, 2014;
Emerton, L. et al., 2006). While the exact financial gap
might be debated, it is widely accepted that protected areas
need a reliable source of funding for effective management
and that the current funding available for African protected
areas is wholly inadequate (Fitzgerald, K.H., 2017).
This report aims to provide an overview of the current status
of protected area finance in the Southern and Eastern African
region, covering 24 countries,1 to understand the extent of
the challenge. The report also outlines the different innovative
finance mechanisms that might be used to help decrease the
Photo: Eastern Arc Mountains, Kenya-Tanzania - Peter Howard
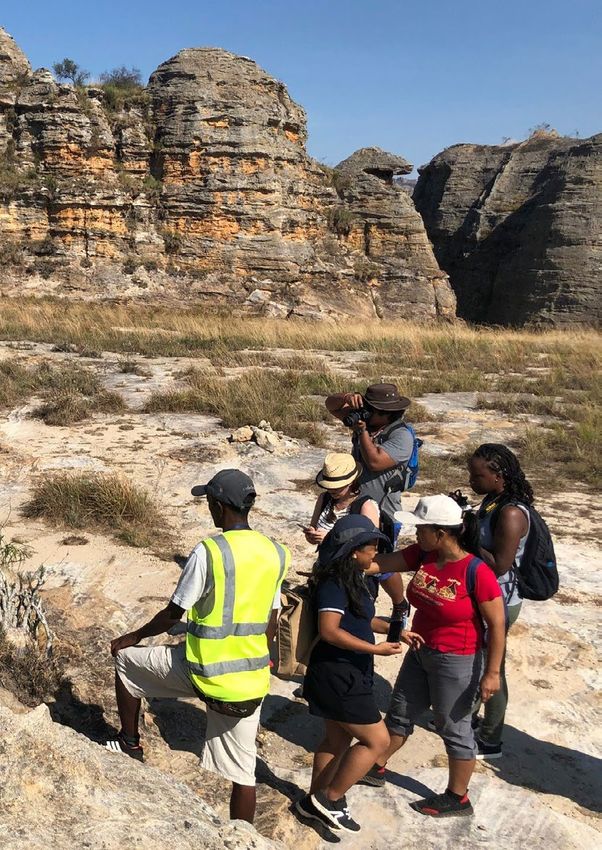
Angola, Botswana, Comoros, Djibouti, Eritrea, Eswatini, Ethiopia, Kenya, Lesotho, Madagascar, Malawi, Mauritius, Mozambique, Namibia,
1
Rwanda, Seychelles, Somalia, South Africa, South Sudan, Sudan, Tanzania, Uganda, Zambia, and Zimbabwe
2Financing and resourcing of protected and conserved areas in Eastern and Southern Africa
|
2 Methodology
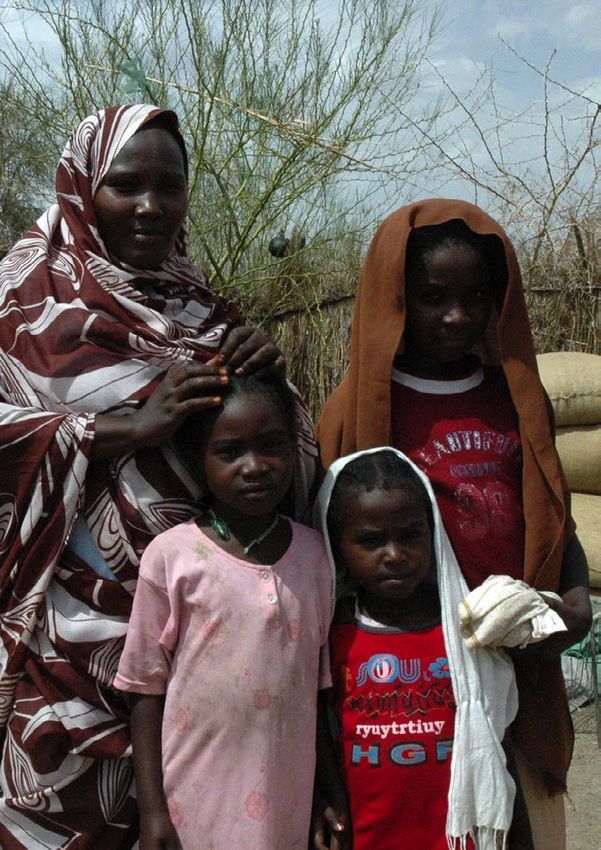
Photo: Family in Tenedba - Eastern Sudan - IUCN
3Closing the gap
2.1 Objective 2.3 Protected area
This study aims to better understand the financing and definition and scope
resourcing needs and challenges and the associated funding
gap of protected and conserved areas in 24 countries in For this report, protected and conserved areas are defined
Eastern and Southern Africa (ESA), explore the opportunities according to the IUCN and Borrini-Feyerabend and Hill
and potential for the development of financing mechanisms definitions.
that can support conservation, and enable governments,
protected area authorities and managers to increase revenue The IUCN protected area definition is: “A clearly defined
generation to reduce the funding gap while improving the geographical space, recognised, dedicated and managed,
management of Africa’s protected areas. through legal or other effective means, to achieve the long-
term conservation of nature with associated ecosystem
This study is a first step towards measuring the conservation services and cultural values (IUCN definition 2008).
financing gap in ESA and reviewing existing and potential
finance mechanisms. The Biodiversity and Protected Areas The Borrini-Feyerabend and Hill (2015: 178) conserved
Management Programme (BIOPAMA) of the International area definition: A conserved area is one that “…regardless
Union for the Conservation of Nature (IUCN) will use this of recognition and dedication, and at times even regardless
study to design and execute initiatives to support building of explicit and conscious management practices, achieves
the capacity of the ESA governments to assist them in de facto conservation and/or are in a positive conservation
addressing the financing gap. trend and likely to maintain it in the long term.”
For the purpose of this study, the following categories of
2.2 Scope of the study terrestrial and marine protected and conserved areas were
considered:
Geography: The study covers the Eastern and Southern • National Parks and Reserves
Africa regions, including the following 24 countries: • Multiple Use Conservation Areas (i.e. Game Management
Angola, Botswana, Comoros, Djibouti, Eritrea, Eswatini, Areas (Zambia), Safari Areas (Zimbabwe))
Ethiopia, Kenya, Lesotho, Madagascar, Malawi, Mauritius, • Community conservancies and indigenous conservation
Mozambique, Namibia, Rwanda, Seychelles, Somalia, South areas (i.e. Wildlife Management Areas (WMAs) (Tanzania)
Africa, South Sudan, Sudan, Tanzania, Uganda, Zambia, and and Communal Areas Management Programme for
Zimbabwe. Indigenous Resources (CAMPFIRE) areas (Zimbabwe))
• Privately owned conservation areas
This study covers the following dynamics:
The terms protected area and conservation area (CA) are
• Identification of general financing gaps in protected and used interchangeably in this report and are defined as above.
conserved areas;
• Existing financing and resourcing that are being used by
protected and conserved areas throughout the region,
2.4 Sourcesof finance
•
challenges and opportunities;
Use of the existing funds in each country;
and expenditures of
• Identification of alternative innovative financing protected areas
approaches, the pros and cons of each mechanism and
examples of its applicability; and The main method of data collection for this study was a
• Development of case studies illustrating relevant
desk-based research approach using various sources of
financing examples throughout the report.
information. This report was not meant to collect primary
data. Data was collected from the latest available annual
“Financing” and “resourcing” of protected areas: BIOPAMA
reports and financial statements from state protected area
defines “financing” as “an ability to secure stable and
authorities, community conservancy associations, and
sufficient long-term finance,” while “resourcing is an
community and private conservancies. Current information
allocation of finance in a timely manner and appropriate
on PA revenue and expenditures was not easily obtained.
form” (BIOPAMA, 2019). This report will cover both aspects
and looks at sources of PA financing, as well as on how the
Table 1 presents the data available from PA management
funding is allocated and used by the PAs.
authorities (reports available online and information
obtained directly from the PA authorities). The desktop
analysis was complemented by stakeholder interviews
and by information available in existing literature and case
studies providing relevant examples to illustrate the trends.
4Financing and resourcing of protected and conserved areas in Eastern and Southern Africa
Table 1: Available data for a selection of Protected Areas management authorities.
Total area under
Number of PAs
Organization Name Country management, Information year
under management
Hectares
Kenya Wildlife Service Kenya 66 4,803,832 2016
Kenya Forest Service Kenya 0 1,975,236 2014
Tanzania Forest
Tanzania 506 13,600,000 2015
Services Agency
Uganda National
Uganda 661 1.136.306 2018/2019
Forestry Authority
Tanzania National Parks Tanzania 22 10,455,910 2013
Rwanda Development
Board, Tourism and Rwanda 5 233,519 2017
Conservation Department
Uganda Wildlife Authority Uganda 40 2,475,597 2018/2019
South African
South Africa 19 0 2017/2018
National Parks
Namibian Association
of CBNRM Support Namibia 84 16,315,100 2017/2018
Organisation
The Northern
Kenya 39 4,221,483 2017
Rangeland Trust
Seychelles National
Seychelles 8 6,105 2017
Park Authority
Eswatini National
Kingdom of Eswatini 4 35,457 2018/2019
Trust Commission
National Park and
Mauritius 11 7,232 2014
Conservation Service
Ethiopian Wildlife
Ethiopia 13 2,947,298 2018/2019
Conservation Authority
Ministry of Environment,
Botswana 18 10,921,400 2012/2013
Wildlife and Tourism
TOTAL 1,478 61,213,102
5Closing the gap
2.5Defining the protected Based on the literature review, the most up to date and in-
depth regional assessment of the financing gap is a 2018
area financing gap study on the finance requirements of Africa’s PAs that
support lions. The data from this study includes information
on 15 countries (Angola, Botswana, Ethiopia, Kenya,
Conservation organizations and authorities are restricted by Mozambique, Malawi, Namibia, Rwanda, Sudan, South
their funding allotment. Most often protected area authorities Sudan, Tanzania, Uganda, South Africa, Zambia, Zimbabwe)
develop aspirational budgets for PA management; however, and covers 263 state-owed protected areas with lions and
their actual annual budgets are based on funding available. more than 1 million km2 (Table 2).
Therefore, an analysis of their current expenditures from
annual reports and other literature does not reflect the
real costs and budget requirements needed for effective
conservation management.
Table 2: Country data used for estimation of the financing gap: 15 countries and 263 Protected Areas from Lindsey, P. et al
2018.
PA Area in Lion
Country Name Number of PA
Range, km 2
Angola 1 78,484
Botswana 61 242,738
Ethiopia 26 57,910
Kenya 20 36,189
Mozambique 20 115,935
Malawi 4 4,540
Namibia 10 64,763
Rwanda 1 1,020
(North) Sudan 1 8,400
South Sudan 4 42,292
Tanzania 37 177,146
Uganda 10 12,032
South Africa 13 30,579
Zambia 33 165,777
Zimbabwe 22 43,986
Total 263 1,081,791
6Financing and resourcing of protected and conserved areas in Eastern and Southern Africa
Other literature and databases used during the review
included:
• IUCN: Sustainable Financing of Protected Areas,
2006; National Biodiversity Strategy and Action Plans
(NBSAPs), Convention on Biological Diversity (CBD),
2005, 2018, 2019, 2020;
• BIOPAMA: Management Effectiveness, Governance,
and Social Assessments of Protected and Conserved
Areas in Eastern and Southern Africa, 2019;
• Databases: PADDDTRACKER, Global Database on
Protected Area Management Effectiveness, Protected
Planet, World Tourism Organisation, World Travel &
Tourism Council;
• Protected Area reports and annual budgets;
• Key word research in academic data bases; and
• Studies conducted and reports developed by
Conservation Capital or partner organisations.
All relevant sources of information and references are
mentioned in footnotes throughout the report and provided
in the literature review and the reference list.
Photo: Batwa women earning about visioning their landscapes, Burundi - IUCN
7Closing the gap
|
3 The funding gap in Eastern
and Southern Africa
Photo: Serengeti National Park - Christine Mentzel
8Financing and resourcing of protected and conserved areas in Eastern and Southern Africa
3.1The global biodiversity 0.9 billion per year in 2005 (CBD, 2005)2, while fewer than
6% of the countries reporting to the CBD indicated that they
funding gap had adequate resources for protected area management
(Watson, J. et al., 2014).
Protected and conserved areas play a key role in protecting
biological diversity and ecosystem services upon which 3.2 Theneed to increase
people depend. These areas need reliable and sustainable
sources of funding to maintain their daily management the protected area estate
operations, meet conservation targets, provide quality
visitor experiences, where appropriate, and provide benefits and related funding
to communities living in proximity to the conservation areas
(Convention on Biological Diversity, 2018). Global context
A number of studies have been completed to assess the While there are clearly not enough financial resources for
financial gap for PA management (Parker, C. et al., 2012; the adequate management of existing protected areas,
Credit Suisse et al. 2014; Emerton, L. et al., 2006). While the there is a need to increase the protected area estate globally
exact figure may vary, there is general consensus that the to secure the world’s biological diversity (Nature Needs Half,
current amount of funding available for the protection and 2019). Over the past four decades there has been a ten-fold
management of conservation areas are wholly inadequate. increase globally in the number of PAs listed by the United
A report by Credit Suisse, WWF, and McKinsey Group in 2014 Nations (UN), with over 104,000 PAs reported in 2004,
estimated that USD 300-400 billion is required annually and 242,423 PAs (terrestrial and marine) in 2019 (UNEP-
to fund global biodiversity protection. Even if the current WCMC, IUCN, Protected Planet, 2019b). The area under
governmental and philanthropic conservation efforts are protection has likewise expanded globally, from 2.4 million
doubled to roughly USD 100 billion per year, the report km2 in 1962 (Emerton, L. et al., 2006) to over 20.4 million
theorised, global biodiversity conservation is still faced with km2 in 2019 (UNEP-WCMC, IUCN, Protected Planet, 2019b).
a global funding gap of USD 200-300 billion per annum The PA terrestrial coverage increased from 14.7% in 2016 to
(Credit Suisse et al, 2014). The United Nations Development 15% in 2019, and marine coverage increasing from 10.2%
Programme (UNDP) Biodiversity Finance Initiative (BIOFIN) to 17.1% in national waters worldwide (UNEP-WCMC, IUCN,
suggests a similar estimate of the global annual financing Protected Planet, 2019b). In 2010, at the CBD, members
gap at USD 150 – 440 billion (BIOFIN, 2019). agreed to Target 11: By 2020, at least 17% of terrestrial
and inland water, and 10% of coastal and marine areas,
The exact estimate of global spending on biodiversity especially areas of particular importance for biodiversity
and ecosystems services is challenging to provide due and ecosystem services, are conserved through effectively
to considerable gaps and inconsistencies in biodiversity and equitably managed, ecologically representative and well
finance reporting and tracking (Organisation for Economic connected systems of protected areas and other effective
Cooperation and Development (OECD), 2019). According to area-based conservation measures, and integrated into
Parker, C. et al. (2012), global spending on biodiversity and the wider landscapes and seascapes (CBD, 2018). It is
ecosystem services reached USD 53 billion per year in 2010, anticipated that at the forthcoming CBD meeting in China in
the OECD estimation of spending on biodiversity-relevant 2020, new targets will be established for protected areas,
activities (based on available government budgets data) calling for potentially 30% of the world land and waters to
was USD 49 billion in 2015 (by comparison, the fossil-fuel be protected by 2030 (CBD, 2020a). Other campaigns such
and agriculture sectors received USD 500 billion of subsidies as Nature Needs Half are calling for 50% of the globe to be
and government support per year (OECD, 2019)). Of USD set aside for conservation (Nature Needs Half, 2019).
53 billion allocated for biodiversity conservation, 74% was
spent in the developed world, only 6% in Africa (Parker, C. et The potential expansion of PAs will require an increase
al., 2012) and 5% in Latin America. in funding for conservation management. However, the
increase of protected areas (CBD, 2020a) has historically
A recent study of 2,167 PAs, representing 23% of the global not correlated with an increase in finance for management.
terrestrial protected area estate, found that less than 25% According to a study published by the WWF, the cost of
of the PAs have adequate resources, staffing or budget increasing global marine conservation areas to 30% will
(Coad L., et al., 2019). In developing countries, this PA require USD 228 billion over the period from 2015 to 2050
financing gap was estimated to be approximately USD 0.2- (Reuchlin-Hugenholtz, E. & McKenzie, E. 2015), while
Convention of Biological Diversity (CBD) (2005). ‘Options for Mobilizing Financial Resources for the Implementation of The Programme of
2
Work by Developing Countries and Countries with Economies in Transition’, Working group on protected areas, Italy. Available at: http://
web.bf.uni-lj.si/students/vnd/knjiznica/Skoberne_literatura/gradiva/zavarovana_obmocja/mt_catini_rpt.pdf.
9Closing the gap
more recently a study estimates the gross costs for nature However, despite an important achievement in the
conservation across half the Earth could be USD 100 billion protection of the terrestrial areas, marine water protection
per year (Dinerstein, E. et al, 2019). Despite the expected is below the Aichi targets (10 % of coastal and marine
increase in the government and donor financing (Credit areas to be conserved by 2020 through effective and
Suisse et al., 2014) the financing gap is nearly impossible equitably managed connected systems of protected
to cover without involvement from the private sector and areas) (CDB, 2018) with only 6% (485,000 km2) of marine
moving beyond depended on traditional funding sources. waters protected (computation based on UNEP-WCMC
and IUCN. Protected Planet, 2019a). The rest of Africa (34
countries) have relatively similar achievements in terms of
3.3 Protectedand conserved terrestrial area protection (13% of terrestrial area protected
areas in Eastern and representing 2.2 million km2), but better marine protection
results (16% of protected marine area, representing 1
Southern Africa million km2 (computation based on UNEP-WCMC and IUCN.
Protected Planet, 2019a). However, the high coverage of
marine protection is mostly due to several island countries
Eastern and Southern African countries have achieved
such as Saint Helena, Ascension and Tristan da Cunha (with
important progress in establishing and maintaining a globally
55% of marine area protected) and Mayotte (100%). Without
significant network of PAs, having on average 17% of their
these countries, the level of marine areas under protection
territories protected, which represents 2.1 million km2. The
would only be 1% (computation based on UNEP-WCMC and
24 countries in the scope of this study include more than
IUCN. Protected Planet, 2019a).
5,000 (UNEP-WCMC and IUCN. Protected Planet, 2019a)
protected areas,3 including 431 “strict” protected areas with
IUCN management categories I through IV (all of them in
one way or another strictly limiting human activities in the
areas, except the minimum necessary for maintenance and
the conservation activities and eco-tourism) (Dudley, N.,
2013).
Photo: Isimangaliso Wetland Park - Christine Mentzel
3
The protected area types include all national designation categories, such as national parks, marine and terrestrial reserves, hunting,
natural, game reserves and others. Source: UNEP-WCMC and IUCN. ‘Protected Planet: The World Database on Protected Areas (WDPA)’.
Protected Planet [online data base]. (October 2019a). Cambridge, UK: UNEP-WCMC and IUCN. Available at: https://www.protectedplanet.
net/. (Accessed: 6 November 2019).
10Financing and resourcing of protected and conserved areas in Eastern and Southern Africa
Table 3: Protected area overview of 24 countries in Eastern and Southern Africa: 17% of terrestrial and 6% of marine area.
Adapted from UNEP-WCMC and IUCN
No of Terrestrial
Total Total Total Total
No of PA with PA Marine PA
Country terrestrial terrestrial marine marine
PA I - IV IUCN coverage, coverage, %
PA, km2 area, km2 PA, km2 PA, km2
categories %
Angola 14 12 87,507 1,255,218 7% 24 493,753 0%
Botswana 22 20 169,370 581,163 29% NA NA NA
Comoros 8 1 173 1,701 10% 32 165,505 0%
Djibouti 7 1 344 21,844 2% 12 7,031 0%
Eritrea 4 3 5,936 121,834 5% 0 78,827 0%
Ethiopia 104 25 200,074 1,135,429 18% NA NA NA
Kenya 411 41 72,545 586,770 12% 904 112,400 1%
Lesotho 4 1 80 30,495 0% NA NA NA
Madagascar 157 55 33,242 594,719 6% 8,998 1,205,825 1%
Malawi 133 9 27,190 118,860 23% NA NA NA
Mauritius 44 32 97 2,062 5% 50 1,280,068 0%
Mozambique 44 10 170,662 791,082 22% 12,821 574,410 2%
Namibia 148 12 313,534 827,465 38% 9,646 562,728 2%
Rwanda 10 5 2,320 25,452 9% NA NA NA
Seychelles 40 14 242 487 50% 209,930 1,340,839 16%
Not Not
Somalia 21 Not available Not available Not available Not available Not available
available available
South Africa 1580 Not available 102,060 1,224,385 8% 224,640 1,542,560 15%
South Sudan 27 12 98,214 633,580 16% NA NA NA
Sudan 23 4 42,698 1,871,252 2% 10,662 66,786 16%
Swatini 14 8 738 17,336 4% NA NA NA
Tanzania 840 76 361,594 947,253 38% 7,330 243,130 3%
Uganda 712 22 39,059 243,145 16% NA NA NA
Zambia 635 36 286,161 755,640 38% NA NA NA
Zimbabwe 232 32 106,837 392,573 27% NA NA NA
Total 5234 431 2,120,677 12,179,745 485,049 7,673,862
11Closing the gap
3.4 Downgrading, downsizing, In addition, PAs have been downgraded, downsized or
degazetted (DDD) in the region. According to a study on
and degazettement of DDD from 1900 to 2010, at least three countries would also
have reached the 2020 CDB target in Africa in the absence
protected areas in Eastern of these events: Kenya (12% coverage would be 18.5%),
Rwanda (9% coverage would be 22.9%), and Uganda (16%
and Southern Africa coverage would be 20.7%) (Masciaa, M. B. et al. (2014).
While the average percentage of terrestrial PAs in 24 A further analysis of DDD events from 1902 to 2018 shows
countries in the scope of this study (17%) have achieved that 87% of the DDD event took place in five countries, with
the Aichi Target 11 (to have at least 17% of terrestrial Kenya hosting almost half of the DDD events (307) in the
and inland waters protected by 2020) (CBD, 2018), some region.
countries significantly outperform others, with protected
area coverage varying by a factor of 20 (between 2% and
50% of each country’s terrestrial territory) (Table 3).
The Seychelles (50%), Tanzania (38%), Namibia (38%) and
Zambia (38%) have the greatest percentage area protected,
while almost 60% of the countries in the region, have not
yet achieved the CDB 2020 target.
4%
7% KENYA
UGANDA
11%
OTHER
47% ZAMBIA
13%
TANZANIA
13% MALAWI
Number of DDD events
18%
1 144
Figure 1: Total Downgrading, Downsizing, and Degazettement events, by country, 1902–2018. Adapted from: Conservation International &
World Wildlife Fund (2019). Adapted from: Conservation International & World Wildlife Fund (2019).
While the reasons for a DDD event is often unknown, the
data from 189 DDD events in the region shows that the main
causes (accountable for 46% of events) include resource
extraction such as the mining and oil and gas activities and
conservation and development planning4 (simultaneous
reallocation of lands or regulatory changes to multiple
protected areas and rural settlements).
4
Definition: “Protected area downgrading, downsizing, or degazettement resulting from legal changes that are designed to enhance the
conservation efficiency and efficacy of a class, group, or geographically distinct set of protected areas. Involves simultaneous reallocation
of lands or regulatory changes to multiple protected areas. Does not include individual instances of degraded protected areas; excision
of settlements; or excision of protected area land that no longer serves a conservation purpose. Excludes protected area downgrading,
downsizing, and degazettement to attain non-conservation ends or divest from protected areas no longer serving a conservation function.”
Source: PADDTRACKER [online data base]. Available at: https://www.padddtracker.org/. (Accessed: 13 December 2019).
12Financing and resourcing of protected and conserved areas in Eastern and Southern Africa
Conservation Planning
12% 15%
Forestry
Industrial Agriculture
13% 6%
Infrastructure
10% Land Claims
Mining, Oil & Gass
13%
7% Multiple Causes
9% Rural Settlements
15%
Other
Figure 2: Main causes of DDD events, 1902 – 2018. Adapted from: Conservation International & World Wildlife Fund (2019). Adapted from:
Conservation International & World Wildlife Fund (2019).
160
140
120
100
80
60
40
20
0
I
ER
A
A
DA
A
AW
NY
NI
BI
TH
AN
M
ZA
AL
KE
ZA
O
UG
N
M
TA
Degazzete Downgrade Downsize
Figure 3: Degazettement, downgrading and downsizing, by country, 1902 – 2018.Adapted from: Conservation International & World Wildlife
Fund (2019).
Despite the high number of the DDD events, the total expansion and settlements in the coming decades, the
number of DDD activities have been decreasing over the last degree to which habitat within PAs (as of 2015) has been
20 years. For example, in the period from 2000 to 2009, converted for human use is encouragingly low (6.8%)
the total number of DDD in the 24 countries in the scope (Riggio, J., et al., 2019).
of the study totalled 56, while in the last 10 years (2009
– 2019), this number decreased to only 11 (eight of which However, unless protected areas can demonstrate economic,
related to downgrading due to infrastructure and industrial social and ecological value, they will remain under pressure
development, such as mining, oil and gas). While the scale to be converted to lands with more “profitable” economic
of the DDD instances may be larger in the latter case, the activities. A recent example of such pressure is the decision
number of incidences has decreased. Scale is difficult to of the Government of Tanzania to annul twelve protected
extrapolate from the DDD database. areas and seven nature reserves “that have no wildlife and
lack trees” (a total area of 707,660 hectares) for use to 920
A recent study on the current state of human encroachment villages for farming and livestock (PetersonWood, B. & Stein
into PAs in five Eastern African countries (Kenya, Tanzania, A., 2019; Xinhuanet, 2019).
Burundi, Uganda and Rwanda) concluded that despite the
rapid human population growth of nearly 3% (The United
Nations, 2017) per year and the related expected agricultural
13Closing the gap
3.5 Protectedarea announced its intention to proclaim 30% of the marine
Exclusive Economic Zone (EEZ), a further 40,000,000
expansion in Eastern ha (The Government of Seychelles, 2017), to be
protected, of which 50% (Seychelles Marine Spatial
and Southern Africa Plan Initiative (SMSP), 2019) will be managed as
‘high biodiversity zones,” restricting almost all human
Despite the DDD events referenced above, PAs have been activities. This target was realised due to a debt-for-
expanded, established or upgraded throughout the ESA nature swap (developed and finalised in 2016 by the
region. For example, in the past two decades Tanzania: Nature Conservancy (TNC)), that allowed Seychelles
to restructure a part of its national debt in exchange
• created four new national parks (Saanane Island (2.2 for protecting its waters. A Marine Spatial Planning
km2), Jozani-Chwaka Bay (50 km2), Kitulo Plateau process is currently underway and is expected to be
(465 km2), and Nyerere National Park in Selous Game finalised in 2020. As a part this commitment, two
Reserve (30,000 km2)) (Tanzania National Parks new Marine Protected Areas (waters surrounding the
Authority (TANAPA), 2019); Aldabra archipelago, and the stretch of ocean between
• upgraded two game reserves to national parks (Mkomazi the Amirantes group of coral islands and Fortune Bank)
(3445 km2) and Saadani (1062 km2)), with another five covering 210 000 km2 of biodiverse ocean waters (size
(Biharamuro (1462 km2), Burigi (2200 km2), Ibanda (200 of Great Britain) were established in 2018 (TNC, 2019).
km2), Kimisi (1,026 km2), and Rumanyika (unclear)) • Rwanda: In 2018, the Rwanda Development Board (RDB)
approved for upgrade in 2018); and expanded Volcanoes National Park for the first time in
• enlarged five existing national parks (Arusha (112 km2), three decades, through the donation of a 27.8-hectare
Lake Manyara (108 km2), Mikumi (3,233 km2), Ruaha property from the African Wildlife Foundation (AWF)
(14,500 km2), and Katavi (4207 km2)) (Riggio, J. et al., (RDB, 2018). While this amount of land may seem small
2019). compared to other parts of Africa, Rwanda is one of
the most densely populated countries in Africa (Sawe,
African Governments are also pledging further support for B.E., 2017), making this size significant. This expansion
expansion of the PA estate. Examples include: provides additional habitat for the expanding population
of the endangered mountain gorilla.
• Uganda: Mary Goretti Kitutu, the then Ugandan State • Ethiopia: The Simien Mountain National Park (SMNP)
Minister for the Environment vowed that Uganda in Ethiopia was expanded from the original size of
would be a conservation leader in Africa, committing 136 km2 (in 1976) to 412 km2 (in 2007) (Ethiopian
to increase the area under protection to 30% by 2030 Wildlife Conservation Authority (EWCA), 2015)–more
(NTV Uganda, 2019). than doubling the size of the Park. This is a significant
• South Africa: South Africa’s “National Protected increase in a highly fragile and ecologically significant
Area Expansion Strategy” identifies the key areas for landscape. SMNP was included on the list of the World
conservation and protection in each of its provinces, Heritage Sites in Danger in 2006. The expansion of the
covering 190,109 km.2 According to the strategy the Park to provide habitat for endemic and threatened
number of “Well Protected Ecosystems” is anticipated species was listed as one of the criteria for removal
to more than double while “Not Protected Ecosystems” from the list. In 2017 the SMNP was removed from this
will reduce by around 70% in the next 20 years list due to the expansion efforts by the Government
(Department of Environmental Affairs, 2016). South of Ethiopia (United Nations Educational, Scientific and
African National Parks (SANParks) has also set a target Cultural Organization (UNESCO), 2017).
of expanding the territory under its management by • Comoros: The Government of Comoros developed a
21,500 hectares from 2015 to 2022 (SANParks, 2019). strategic expansion plan for protected areas from 2017
In 2019, the Tembe Elephant Park, a community-owned – 2021. The plan envisages the establishment of five
park managed by the provincial authority Ezemvelo Kwa new national parks and creation of the Protected Areas
Zulu Natal Wildlife Authority, announced their intention Managing Agency (“Agence des aires protégées”) by
to expand by 26,000 hectares to provide space to 2021 (Directorate of Environment and Forestry (DGEF),
elephants to breed, almost doubling the current size 2017).
of the park (29,800 ha) (Hattingh, M. & Mdletshe, M.,
2019). Additionally, 20 new Marine Protected Areas Despite the positive tendency in the increase of PAs, there
(MPA) were gazetted in 2019 increasing the marine area has not been a correlative increase in financing to cover
protected around the country’s mainland territory from management and operational costs. In most cases the
0.4% to 5% (Save Our Seas Foundation, 2019). increase in the number of PAs has meant that the scarce
• Seychelles: In 2000, the President of the Republic financial resources of the PA authorities are stretched even
of Seychelles made a commitment to declare 50% thinner. A 2017 review of the financing of protected areas
of Seychelles terrestrial area under biodiversity by IUCN in Eastern Africa confirmed that proper financing
conservation by 2020. In 2013, the government is one of the greatest barriers to adequate conservation
performance (EA SOPA, 2017).
14Financing and resourcing of protected and conserved areas in Eastern and Southern Africa
3.6Protected area Natural Resource Management Support Organisations
(NACSO). Other major expenses include other administrative
expenditures and costs, depreciation, and amortization expenses.
revenue flow Some State PAs also share revenue with local communities.
For example, in Rwanda, 10% of all revenue generated by
The current expenditures of PA management authorities the RDB in the national parks goes to local communities
show that, for the majority of these organisations, funding (RDB, 2019). This is the highest revenue share for PAs in
is mostly (c. 90% on average) spent on operating costs such Africa. Other PA authorities provide financial benefits to
as staff, marketing, maintenance, trainings, consumables, communities on an ad-hoc basis. Community conservancies
consulting and audit fees, and insurance, with very few have a much higher revenue share given the natural
investments into capital expenditures or capacity building. asset is owned by the community. For example, NACSO
conservancy members attribute up to 40% of the revenue to
Staff expenses especially make up a significant part of the the communities either in the form of the cash revenue, off-
overall budget. For example, staff costs constitute 30% take (game meat and other natural products) or community
of EWCA budget and 50-60% of the budgets of Eswatini development projects. In Kenya, the communities also own
National Trust Commission, Kenya Wildlife Services (KWS), the land; therefore, they can attribute revenue to community
SANParks, and Namibian Association of Community Based development and conservation management of their own
natural asset.
1%
2%
4%
Staff expenses
8%
Other administrative operating costs
40%
Depreciation & amortization expenses
Investments (CAPEX/ maintenance)
45% Donations, community revenue, sharing, etc.
Other
Figure 4: Expense breakdown of 11 community and national Protected Areas in seven ESA countries.
Protected area authorities’ budgets generally have significant revenue from conservation and concession fees
limited investments in capital expenditures, maintenance, (SANParks, 2018). In Rwanda, Volcanoes National Park
conservation programmes, or capacity building. These are accounts for 38% of all visits and generates over 90% of
mostly covered through donor programmes and support all revenues for the Rwanda Development Board, the
(see Chapter 5.2). In cases where authorities do invest in department in charge of managing Rwanda’s protected
capacity development, for example, these expenses are areas and wildlife (RDB, 2017).
relatively low. For example, in 2016, KWS’s budget for
employee training and development was 1.5% of the total Most funding is directed towards flagship areas, leaving
budget (Office of the Auditor General, Republic of Kenya, many PAs effectively non-functional. For example, a
2016). majority of KWS’s budget is directed towards Amboseli,
Tsavo and Mt. Kenya National Parks, leaving other parks
Most PA agencies in ESA are required to remit their revenue underfunded and non-operational due to a dearth in finance
to central treasury and then apply for their yearly budget, in (EA SOPA, 2017). Revenue expenditure and retention is a
some cases receiving less than they generated (see Chapter key aspect of ensuring effective conservation management.
5.1). Therefore, even if one Park is able to generate sufficient This is not covered fully and in detail in this report but should
revenue to supports its operations, these profits are used be guided by PA and PA system business plans to ensure
to subsidise less profitable parks. For example, TANAPA that any increase in funding is managed properly and drives
manages 506 protected areas in Tanzania, yet only two enhanced conservation performance.
National Parks, Kilimanjaro and Serengeti, generate 74%
of revenue in 2013 (TANAPA, 2013). In South Africa, out of
the 19 national parks, Table Mountain and Kruger National
Parks hosted 77% of all visitors in 2017- 2018 generating
15Closing the gap
3.7Eastern and Southern such as local geographical features, shape, climate, cultural
context, species living in the area, adjacent land uses and
Africa’s biodiversity financing populations, there is consensus that there is a significant
funding gap across ESA.
and resourcing challenge A 2019 study assessed the management costs, revenue and
Eastern and Southern Africa’s PAs face a significant subsidies of 282 state-owned PAs with lions and concluded
financing and resourcing challenge, especially those areas that available funding only satisfied 10-20% of management
that protect large and wide-ranging mammals such as needs. In total, the funding gap of these PAs was estimated
rhino, elephant, lion and wild dog. It has been estimated that at approximately USD 1.5 billion per annum (Lindsey, P.A. et
effective elephant conservation requires an annual budget al. 2018).
of USD 365-930 per km2. A study conducted by Packer, C.
et al. (2013) found that the annual cost of managing PAs A review of the financial data from PAs across 15 ESA
that support lions is approximately USD 2,000 per km2 countries also showed that 12 of these countries face
in unfenced areas and USD 500 per km2 in fenced areas. significant funding gaps (correlated from data Lindsey,
Packer’s findings were later confirmed by work done by P.A., 2018). Even though Eastern and Southern African
Lindsey, P. A. et al. (2018) who estimated that effective regions generally have similar funding gaps (56% and 64%),
management of PAs with lion requires USD 1,000 – 2,000 some individual countries, such as South Africa, Kenya,
per km2. However, the majority of protected areas in Africa and Rwanda, appear to be better funded, suggesting that
are managed with less than USD 50 per km2 (Fitzgerald, K.H., countries with enabling legislation (such as South Africa
2017), suggesting that these areas are grossly underfunded wildlife ownership policies) and well-developed nature-
by c. 90%. based tourism are able to contribute more to the financing
of their PAs.
While the funding, management and associated staffing
requirements of individual PAs varies according to factors
Total 15 countries East African countries Southern African countries
8% 6%
12%
30% 30%
56%
32%
64%
62%
Donor funding Government funding & self generated revenue Funding gap
Figure 5: Funding gap and available financing resources in fifteen ESA countries.
Across the ESA region there are a number of examples that the Zimbabwe Forestry Commission (a parastatal
highlight the funding gap. Examples include: responsible for the sustainable utilization of forest
resources and management of gazetted forests) incurred
• Kenya: The Kenyan Wildlife Service manages 66 deficits of USD 6.3 million and 3.8 million respectively in
protected areas covering 4.8 million hectares, over 8% 2016 (Office of the Auditor-General Zimbabwe, 2018).
of the country. Their budget deficit in 2016 constituted • Zambia: A 2013 study on the Game Management
USD 5.5 million, while its accumulated deficit reached Areas (GMAs) in Zambia highlighted a huge financing
USD 56 million (Office of the Auditor General, Republic challenge for the Zambia Wildlife Authority (ZAWA)
of Kenya, 2016). KWS has indicated that 50% of its who, at that time, managed Zambia’s 20 national parks
Parks are non-operational (EA SOPA, 2017) and they and 36 GMAs. Reduced government support for ZAWA
are looking at ways to increase revenue. resulted in a budget deficit of USD 12 million as of 2013.
• Zimbabwe: Zimbabwe Parks and Wildlife Management In that same year, ZAWA only generated USD 4.6 million
Authority (ZPWMA), which is responsible for managing in revenue but had an annual wage bill of at least USD
13% of Zimbabwe (5 million ha) (ZPWMA, 2017) and 12 million (Lindsey, P. A. et al., 2013).
16You can also read