LET'S RESPOND A TOOLKIT TO INTEGRATING CLIMATE CHANGE RISKS AND OPPORTUNITIES INTO MUNICIPAL PLANNING
←
→
Page content transcription
If your browser does not render page correctly, please read the page content below
LET’S RESPOND
                A TOOLKIT TO INTEGRATING CLIMATE CHANGE RISKS
                AND OPPORTUNITIES INTO MUNICIPAL PLANNING

environmental affairs
Department:
Environmental Affairs
REPUBLIC OF SOUTH AFRICA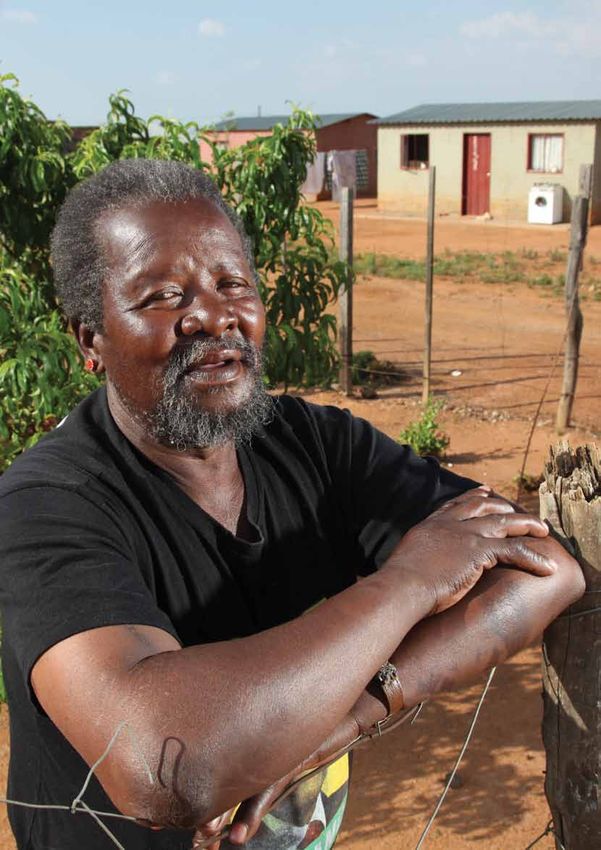
LET’S RESPOND TOOLKIT                                                                      Contents
A toolkit to assist in integrating climate change
                                                                                            TOOL 1    Climate Response Integration Process Planning Checklist and Timeframe                                  2
risks and opportunities into municipal planning
                                                                                            TOOL 2    Climate Change and Municipal Planning: a presentation                                                  6

                                                                                            TOOL 3    A Directory of Key Regional Climate Change Resources                                                   24

                                                                                            TOOL 4    Determining Local Climate Change Impacts (risks, vulnerabilities and opportunities) Support Sheet      29
Published by
Department of Environmental Affairs, Department of Cooperative Governance,                  TOOL 5    Responding to Local Climate Impacts Support Sheet                                                      32
the South African Local Government Association in partnership with Deutsche Gesellschaft
                                                                                            TOOL 6    Climate Information Web Portals                                                                        35
für Internationale Zusammernarbeit (GIZ) GmbH, on behalf of the German Federal Ministry
of Environment, Nature Conservation and Nuclear Safety (BMU).                               TOOL 7    Climate Summary Report for Thohoyandou                                                                 40

                                                                                            TOOL 8    Municipal Greenhouse Gas (GHG) Emissions Calculator and Electricity Sector Efficiency Planning Tool:   47
Developed by
                                                                                                      www.cityenergy.org.za
Sustainable Energy Africa and Palmer Devlopment Group.
                                                                                            TOOL 9    GHG Emissions and Energy Development Analysis Table                                                    52
Photos supplied by
                                                                                            TOOL 10   Climate Change Analysis Report template                                                                54
Department of Environmental Affairs
Department of Cooperative Government                                                        TOOL 11   Workshop template: Developing a local climate change response vision and key objectives                56
Emfuleni Local Government
South African National Botanical Institute                                                  TOOL 12   Sector Climate Change Response Options (mitigation and adaptation)                                     62

Sustainable Energy Africa                                                                   TOOL 13   Sector Plan Climate Response Considerations Review Guide                                               67

                                                                                            TOOL 14   Climate Change Response Action Plan Template                                                           78
South Africa, April 2012
                                                                                            TOOL 15   Project Selection Support Tool                                                                         80

                                                                                            TOOL 16   Key Performance Indicator Tool                                                                         83

                                                                                            TOOL 17   Local Implementation Case Studies                                                                      85

                                                                                            TOOL 18   Is your IDP climate response ‘credible’?                                                               96

                                                                                           LETS RESPOND TOOLKIT                                                                                                   1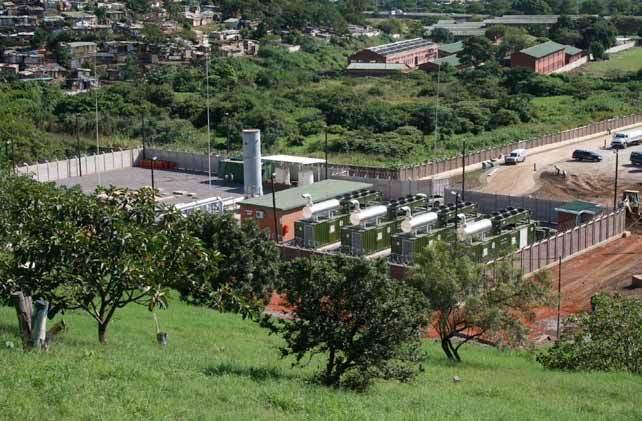
PHASE 1              PHASE 2        PHASE 3        PHASE 4

    TOOL                  1

                                               Preparation

                                                                 Analysis

                                                                                     Strategy

                                                                                                   Projects

                                                                                                                Implementation
                                                                                                                Integration
                                                                                                                                        ACTIVITY                                                     RESPONSIBLE PERSON   BY WHEN   RESOURCES

                                                                                                                                        Phase 2: Strategy
                                                                                                                                        Prepare and hold Stakeholder Climate Change Response
                                                                                                                                        Vision and Objectives workshop:
                                                                                                                                        •   Set date
                                                                                                                                        •   identify all stakeholders and any relevant experts
                                                                                                                                            for inputs
                                                                                                                                        •   consider who will facilitate
                                                                                                                                        •   make venue and catering arrangements
                                                                                                                                        •   ensure presentations are ready
                                                                                                                                        Develop Climate Response Strategy document for
                                                                                                                                        council approval and inclusion into objectives within the
                                                                                                                                        SFAs
                                                                                                                                        Prepare and hold Sector climate response planning
     Climate Response Integration Process Planning Checklist and Timeframe                                                              sessions

     Objective: This tool is designed to assist the climate change coordinating committee to plan the climate response                  Phase 3: Projects
     integration process. The tool should be used at the very beginning of the planning process, to develop the integration             Support departments to prioritise climate response
     plan, but will also provide a useful checklist throughout. The Timeframe table supplements the checklist and provides a            projects and develop detailed project plans
     cross reference to key IDP milestones to facilitate integration of climate response into IDP planning. Adjust it to include
                                                                                                                                        Phase 4: Integration
     any IDP processes of importance to your municipal process that may not be included here.
                                                                                                                                        Review draft IDP and budgets to make sure these include
                                                                                                                                        climate response dimension
      ACTIVITY                                                              RESPONSIBLE PERSON        BY WHEN              RESOURCES
                                                                                                                                        Review strategic scorecard and make sure dates for this
      Preparation                                                                                                                       revision are incorporated into this process
      Establish climate change response coordinating                                                                                    Identify any other key areas for integration – such as the
      committee with reps from relevant departments;                                                                                    Municipal 2030 vision
      schedule meetings.
                                                                                                                                        Communicate the municipal response to community:
      Familiarise with climate integration process outlined in                                                                          identify how this will be done and develop necessary
      the Guide                                                                                                                         materials
      Process plan development and presentation to IDP                                                                                  Identify useful learning networks to boost municipal
      drafting team forum. Ensure that dates and activities align                                                                       climate response action capacity
      with IDP processes

      Phase 1: Analysis
      Identify key resources and conduct problem assessment
      looking at climate projections and GHG emissions issues
      Compile an Analysis Report on climate change in
      preparation for determining municipal strategic priorities
      Prepare presentation of Analysis Report information for
      stakeholder workshops (building on the PPT presentation
      provided in TOOL 2)

2    LETS RESPOND TOOLKIT                                                                                                              LETS RESPOND TOOLKIT                                                                                     3
TOOL 1
Climate Response Integration Process Timeframe
Review SBU/sector plans in line with SFA
Draft IDP and budget to full council
Engage councillors on IDP priorities
Initial budget allocations
Feedback on Status Quo
IDP and budget to Exco
Finalise Analysis Report
To council for adoption
IDP Milestones
Council solidifies SFAs
Public participation
SFAs Process Plan
Finalise draft IDP
Engagement SFAs
Budget finalised
Climate Response Integration Aug Sept Oct Nov Dec Jan Feb March April May
Preparation
Climate change response committee established with rep on IDP Forum
Climate response IDP Process plan development
Phase 1: Analysis:
Compile an Analysis Report on Climate change
Prepare presentation of Analysis Report
Feedback climate analysis into IDP Status Quo Analysis Report
Confirm IDP Analysis Report (Status quo) has adequate climate analysis
Phase 2: Strategy
Stakeholder workshop establishes key climate objectives and related KPIs in line with SFAs
Sector planning sessions
SBUs and Sector plans include climate response dimension within their strategic plan-SFA alignment reviews
Engage councillors on climate aspects of IDP priorities
Phase 3: Projects
Sector /department planning sessions
Initial budget projections
Develop detailed climate response action plans
Phase 4: Integration
Climate response projects in the SDBIPs and MTEF budget allocations
Review Climate Responsive IDP ‘requirements’
Communicate the municipal response to community
Project and programme implementation and monitoring
4 LETS RESPOND TOOLKIT LETS RESPOND TOOLKIT 5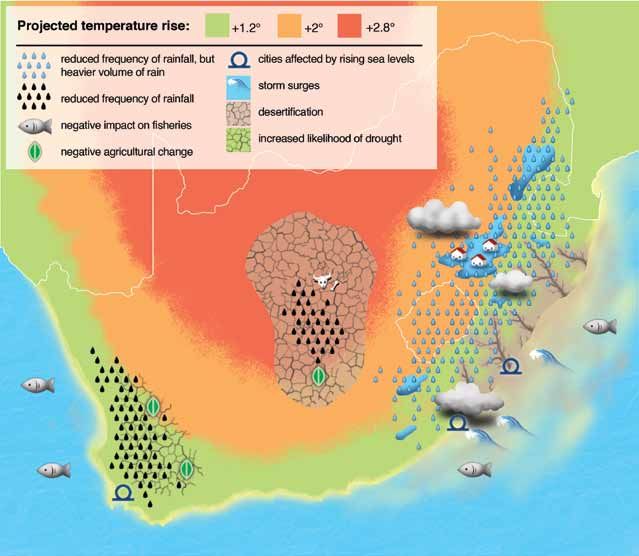
PHASE 1 PHASE 2 PHASE 3 PHASE 4
TOOL 2
Preparation
Analysis
Strategy
Projects
Implementation
Integration
Outline Slide 2 Outline
What is climate change?
Why is the climate changing? Share with participants that during this presentation you will cover
Our national climate change picture the following areas (if using in modular form, adjust accordingly):
Planning in the face of uncertainty: national and
local responsibilities
• Explain climate change and its causes (Modules 1 and 2);
Integrating climate change response into our
IDP: the process plan
• Explore some of the impacts of climate change locally, nationally and
Our local experience of environment, climate
impacts and emissions responsibilities globally (Module 3);
2 • Detail national government’s response to climate change (Module 4);
• Show the relevance of climate change to local government in terms
of its ability to deliver on its mandates (Module 4 and 5);
• Highlight how local government can respond to climate change
(Module 4 and 5); and
• Provide a picture of key environmental issues in your municipality and
your understanding of the impacts of a changing climate in your own
Climate Change and Municipal Planning: a presentation municipality. Also mention any key greenhouse gas emissions areas in
Objective: this tool will support communication of the climate change integration process to stakeholders and can be your municipality (Module 6).
used in meetings and workshops. The presentation has 6 modules.
Slide 3 – Module 1: What is Climate Change?
Modules 1 and 2 provide an overview of climate change (what it is and why it is happening);
Module 3 details the impacts of climate change globally and locally;
Module 4 looks at policy responses and why local government is a key player in climate response;
Module 5 outlines local government responsibilities with regard to climate change and how they can tackle these; and
Module 6 provides a picture of climate experience in your local municipality.
3
The tool has two components: a set of slides and speaker notes. Users of the tool are encouraged to use the presentation
(set of slides) available on the accompanying CD and can adjust and modify it to suit their needs; and to bring in the
experience of your municipality. The notes will provide you with important background information to the slides and Slide 4
direct you in ‘localising’ the slides for your particular municipality. Climate change is
a change of the This slide provides a definition of climate change.
general weather
conditions of
Speaker notes
which the most
significant change Additional information or points you could raise:
is an increase in
temperature of
the earths • Climate naturally goes through warm and cold periods, occurring
Slide 1 Cover Slide: Let’s Respond surface
Let’s Respond over hundreds of years. The environment is usually able to adapt to
A guide to integrating climate risks and
such a changing climate if these changes take place slowly;
opportunities into Municipal IDPs Consider including a local image and/or your municipal logo 4
• Human activity is currently causing the climate to change (in addition
to the natural cycles of change) so quickly that different parts of the
earth’s system cannot adapt fast enough to ensure survival. This poses
an enormous threat to the survival of humanity, plants and animals;
• Climate change is a global problem. The world shares one
1
atmosphere, therefore we will have to solve this problem together.
6 LETS RESPOND TOOLKIT LETS RESPOND TOOLKIT 7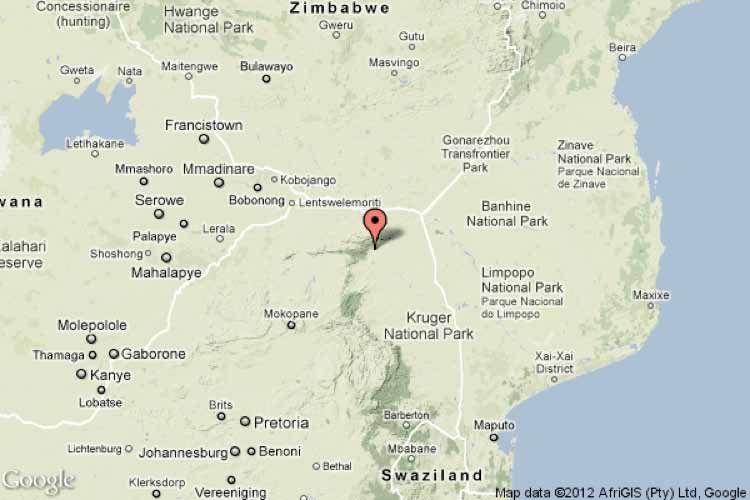
TOOL 2
Slide 5 The Greenhouse effect Slide 8 – The Greenhouse effect
Climate change is
different to
changes in This slide explains the difference between weather and climate and Atmospheric science can be confusing! A quick overview of the
weather.
the timescales over which they occur. Greenhouse Effect is provided. You can decide on how much detail
Weather changes
continuously on a your think your audience is interested in:
hourly and daily
basis while climate
change occurs
over large time • The earth’s climate is driven by a continuous flow of energy from the
scales ranging
from 50 years
sun;
onwards
5 8 • As the sun’s energy reaches the earth (mainly in the form of visible
light), about 30% is reflected back into space, while the remaining 70%
Slide 6 passes through the atmosphere to warm the surface of the earth. The
earth warms up and then releases the heat (infrared radiation) slowly
Besides an increase in average temperature,
climate change also causes significant changes in This slide gives an overview of what kind of changes in climate we back into space (the earth being far cooler than the sun);
rainfall patterns, and an increase in extreme
weather events giving rise to floods and droughts. can expect.
• Greenhouse gases (ghgs) keep the planet at a temperature essential
for life on earth. Ghgs in the atmosphere trap some of the infrared
You may wish to further note:
radiation, preventing it from escaping from the earth’s surface to
• Climate change is real and is already upon us: we are experiencing space;
these changes; • The main greenhouse gases are water vapour, carbon dioxide, ozone,
6
• Climate changes include: extended dry seasons, increasing methane, nitrous oxide and halocarbons and other industrial gases.
temperatures, extreme storms and sea level rise; Apart from the industrial gases, all of these gases occur naturally.
Together, they make up less than one percent of the atmosphere.
• These changes give rise to impacts that include: drought, crop failure, This is enough to produce a natural greenhouse effect that keeps the
livestock death, damage to infrastructure, runaway fires; planet some 30 degrees Celsius warmer than it would otherwise be.
• Our vulnerability will determine how seriously the impacts affect us, This is essential to support life;
for example, an increase in disease, disabling of existing livelihoods • Climate change is occurring as a result of human activities that have
and damage to household assets will have the greatest effect on the introduced a massive increase in the levels of greenhouse gases in
poorest in our society; the atmosphere;
• In general, the faster the climate changes, the greater the risk • The major human emissions of GHG come from:
of damage. A changing climate poses an enormous risk to food
production, availability and use of water, health risks and economic • Burning coal, oil, and natural gas (carbon dioxide)
development. • Agriculture and changes in land use, i.e. chopping down of forests
and thus reducing the earth’s natural ability to absorb ghgs
Slide 7 – Module 2: Why is the climate changing? (methane and nitrous oxide)
• Vehicle exhaust fumes and other sources (ozone)
• Other industrial activities (industrial gases such as CFCs –
chloroflourocarbons, HFCs – hydroflourocarbons, and PFCs –
perfluorocarbons)
• This is all happening at an enormously rapid pace. The result is known
as the enhanced greenhouse effect;
7
• Warming up is the simplest way for the climate to get rid of the
extra energy. However, even a small rise in temperature will be
accompanied by many other changes: in cloud cover, wind patterns
and ocean patterns for example.
8 LETS RESPOND TOOLKIT LETS RESPOND TOOLKIT 9
TOOL 2
The following three slides present scientific evidence of the enhanced greenhouse effect taking place on our Key contributors to global warming
planet Slide 13
[2006-Total Anthrop. Emissions:8.4+1.5 = 9.9 Pg]
Energy use : 9
Fossil Fuel Emission (GtC/y)
8 Emissions
fossil
This slide provides a graphic illustration of the source of greenhouse
7
fuels 6
(oil, coal, gas) 5
Human-induced CO2 increase - globally
Slide 9 4
3
2
gas emissions detailed in slide 12.
1
0
1850 1870 1890 1910 1930 1950 1970 1990 2010
Changes in 4001850 1870 1890 1910 1930 1950 1970 1990 2010
The graphs in slide 9 show rapid increases in carbon dioxide [CO2]1990 - 1999: 1.3% y-1
• GHG emissions from energy use and changes in land use are the
Atmoapheric [CO2] (ppmv)
land use cover : 380
2000 - 2006: 3.3% y-1
deforesta9on
emissions in our atmosphere over the last 300 years, mainly from major contributors to global warming.
360
and agriculture
340
burning fossil fuels. 320
• It is again worth noting the exponential growth of GHG emissions
2 ppm/year
300
280
0.81850 1870 1890 1910 1930 1950 1970 1990 2010
produced by humans over time. This is indeed alarming and poses
Over the 10,000 years before industrialization, carbon dioxide levels 0.6 Temperature
Temperature (deg C)
0.2 C/decade
13
a threat to survival, necessitating urgent action towards reducing
0.4
increased by less than 10%. In the 200 years since the industrial 0.2
0
emissions to levels ‘required by science’ to curb catastrophic climate
revolution in the 1800’s, levels have risen by over 30% and continue to
-0.2
Atmospheric CO2 has increased by 37% since -0.4
the industrial revolution -0.6
change.
9 rise by over 10% every 20 years. 1850 1870 1890 1910 1930 1950 1970 1990 2010
Local evidence of CO2 increase over time
Slide 10
Evidence of global warming Slide 14
Measured increases in average global temperature
Measured rise in average global sea level consistent with the
This slide provides a summary of the evidence that global warming is
warming of the earth
This slide brings the issue of climate change closer to home, showing
Concentration of Greenhouse gases
Extreme events: Rainfall; heat waves; droughts;
indeed happening. Additional detail worth noting includes:
that even South Africa is being affected.
hurricane intensity, coastal flooding throughout the world
Glaciers/snow cap melt on land
Arctic and Greenland icecaps melting – reduced snow
cover in the Northern Hemisphere
• The last ten years are the hottest on record. The warming trend over
Scientific data from the South African Weather Services station at Cape Wildfires increasing in frequency and intensity
More intense longer droughts observed since the 1970s especially
the previous century was reported as 0.6 degrees Celsius by the
Point, Cape Town, reveals rapidly increasing concentrations of carbon in the tropics and sub tropics
Cold days, cold nights and frost becoming less frequent
international panel for climate change. It now stands at around 0.7
dioxide over our country. Intense drying observed in Southern Africa, southern Asia,
Mediterranean and the Sahel – decreasing water availability
degrees Celsius.
13
• Sea levels have risen at an average of 1.8 mm per year since 1961, but
Source: Source
SAWS Annual
: SAWSReport 08/09
Annual Report 08/09
Data from Global
Data fromAtmosphere Watch at Watch
Global Atmosphere SA Weather
at SAService,
WeatheratService,
Cape Point
at Cape Point
10
at 3.1mm per year since 1993.
World Average temperature Slide 11
The average temperature of the
earth's surface has risen by 0.74
• The changes in temperatures, rainfall and climate are broadly
This slide demonstrates the link between the increase in greenhouse predicted to get more and more severe, with impacts that include
degrees Celsius (°C ) since the late
1800s
South Africa’s surface air
temperature has warmed significantly gases in the atmosphere and the warming trend (temperature rise) drought, water scarcity, extreme weather events and altered seasons.
over much of the country since the
1950s
across the planet.
Temperature is expected to increase
Slide 15 – Module 3: Our national climate picture
by another 1.8°C to 4°C by the year
2100 should the necessary acDon not
be taken.
There is a >90% chance that
at least half of the observed
warming has been as a This ‘module’ will look at answering:
result of human‐caused
greenhouse gas emissions
(IPCC, 2007) 11
• What is South Africa’s contribution to the global greenhouse gas
(GHG) emissions?
Source of greenhouse gas emissions
Slide 12
• Which sectors are the main contributors to GHG emissions?
Greenhouse gas emissions come
from a broad range of human
activities This slide illustrates the source of greenhouse gas emissions (ghgs) • What are the impacts of climate change on South Africa?
emissions, explaining where they really come from.
• How are we responding to these impacts?
14
• The pie chart on the left shows that the burning of fossil fuels such
as coal, oil and natural gas to power our countries (through use SA carbon footprint Slide 16
in transport, electricity supply) is the major contributor of carbon Fossil fuel emissions by country (2008)
http://en.wikipedia.org/wiki/List_of_countries_by_carbon_dioxide_emissions
South Africa is ranked as the 13th largest carbon dioxide emitter in the
• Data collection by the United States Department of Energy's Carbon Dioxide Information
dioxide (56%). This is followed by deforestation (17%). The cutting
Analysis Center (CDIAC) for the United Nations
• Data only considers CO2 emissions from burning of fossil fuels and cement manufacture;
not from land use, land-use change and forestry
world (on an absolute emissions basis) and the largest in Africa. On a per
Annual emissions % of global
down of trees destroys the earth’s natural ability to absorb carbon
Rank Country (1000s tonnes) emissions
N/A World 29,888,121 100%
12
1 China 7,031,916 23.53%
capita basis, as illustrated in the slide diagram, our emission level is over
2 United States 5,461,014 18.27%
dioxide;
3 India 1,742,698 5.83%
4 Russia 1,708,653 5.72%
5 Japan 1,208,163 4.04%
double that of the world average and close to three times that of Africa.
6 Germany 786,660 2.63%
7 Canada 544,091 1.82%
8 Iran 538,404 1.80%
• The pie chart on the right reveals the key sectors responsible for
9 United Kingdom 522,856 1.75%
10 South Korea 509,170 1.70%
11 Mexico
12 Italy
475,834
445,119
1.59%
1.49% The reason is that South Africa has a very energy-intensive economy;
the emissions. It is evident that the energy supply sector contributes
13 South Africa 435,878 1.46%
14 Saudi Arabia 433,557 1.45%
15 Indonesia
16 Australia
406,029
399,219
1.36%
1.34% heavily reliant on the use of ‘dirty’ fossil fuels (mainly coal) to power it.
to a quarter of the globe’s ghg emissions. Forestry and agriculture
17 Brazil 393,220 1.32%
18 France 376,986 1.26%
19 Spain 329,286 1.10%
20 Ukraine 323,532 1.08%
cumulatively contribute close to a third of our global emissions. 14
10 LETS RESPOND TOOLKIT LETS RESPOND TOOLKIT 11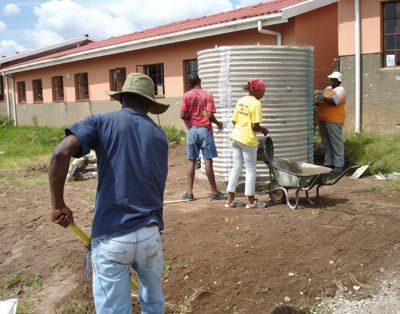
TOOL 2
Share of SA’s greenhouse gas emissions by sector
Slide 17 Observed climate impacts in South Africa Slide 20
This slide details the breakdown of GHG emissions sources in South This slide illustrates some of the observed climate change impacts in
Africa. South Africa.
The pie chart on the left shows that the energy sector is responsible for We can expect (broadly):
•Increased severity of storms and
the lion’s share of South Africa’s GHG emissions (79%). This is owing resulting damage to coastal
ecosystems and infrastructure
to coal providing an estimated 72% share of the country’s total primary
•Unseasonal cold spells affecting
agricultural production • Extreme storms and rising sea levels affecting coastal cities and
ecosystems;
•Scientists have observed that the
DEAT 2007 DEAT 2000
energy supply, much of which is used to produce South Africa’s electricity steadily shrinking range of the Quiver
tree (Kokerbome) of the Northern Cape
correlates with observed climatic
15 generation capacity. Coal is a major feedstock for the country’s synthetic changes. 20
• Changed seasons, and new minimum and maximum temperatures,
fuel industry (e.g. Sasol’s coal-to-liquid-fuel). Energy supply is therefore affects when plants bloom and fruit, when insects hatch, or when
enormously carbon intensive. streams are at their fullest. This in turn affects time for planting,
pollination of crops, food availability, migration of birds, breeding of
The pie chart on the right details energy consumption by sector.
fish, water supplies for drinking and irrigation, forest health and more.
Observed climate impacts in South Africa Slide 18 • Reduction in rainfall and increase of drought conditions on the
western side: Scientists have observed that the steadily shrinking
South Africa is already experiencing the impact of climate change. range of the Quiver tree (Kokerbome) of the Northern Cape
Conservative estimates of damage costs due to extreme weather- correlates with observed climatic changes.
related events (flooding, fire, storms and drought) have been placed at
• Wetter with hotter temperatures on the eastern side of the country;
Courtesy Dennis Laidler, DEADP
approximately one billion rand per year between 2000 and 2009. Look at
Annual direct cost of extreme events to South the information in the Introduction to the Guide for more detail on the It is worth noting that these new conditions result in:
Africa from
2000 to 2009 cost of inaction.
conservatively R 1 billion • Drought; crop failure; livestock death; damage to infrastructure;
16 runaway fires; and an increase of vector-borne disease (e.g. Malaria).
Climate change projections for Southern These impacts all contribute to disabling of existing livelihoods and
Africa Slide 19
damage to household assets, which deepens poverty.
This slide shows projected changes in South Africa’s climate:
Observed climate impacts in South Africa Slide 21
• All of Africa is projected to warm during the 21st century to levels
greater than the annual global warming average. A generally drier This slide illustrates the impact of climate change on our coastal
southern Africa (5 – 15% reductions in current rainfalls) is forecasted. and marine environment.
• A distinct pattern of winter rainfall loss in the west and summer • South Africa’s weather and climate patterns are strongly influenced
rainfall increase in the east, yet with some local scale variations.
Adapted from SARVA data
by the oceans bordering it. The country derives significant socio-
Rainfall is indicated to decrease for the Limpopo province in spring
17
economic benefits from marine and coastal resources.
and for the Western Cape in winter.
• Climate change impacts the functioning of estuaries and coastal
• Summer rainfall region projected to become drier in spring and 21
environments, which has profound consequences for marine and
autumn (shorter summer); however, during summer, more frequent coastal environments. There is an increasing risk of species extinction
cloud-band formation takes place over eastern South Africa, resulting and coral damage projected with warming of the oceans.
in increased summer rainfall totals.
• General increase in relatively large rainfall events over eastern Slide 22
South Africa in particular. This area is projected to experience an Bush encroachment
increase in frequency and intensity of rainfall concentrated mostly in South African rangelands support a range of economic activities including
Open savannah, E. Cape
the early summer (September, October, November).
S. Africa, 1955 conservation and tourism, commercial livestock production and
smallholder livestock systems (browsing and grazing). These lands are
• Dry spells (longer summers) may be expected to occur more vulnerable to bush encroachment (the expansion of the spread of bush
frequently along the western and northern margins of South Africa, Same place, 1998 growth) as a result of enhanced growth from rising atmospheric CO2.
between spring and autumn.
(T. Hoffmann, IPC, UCT)
22
12 LETS RESPOND TOOLKIT LETS RESPOND TOOLKIT 13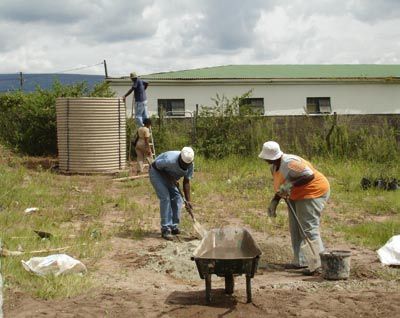
TOOL 2
SA’s vulnerability to climate change
Slide 23 (Slide 24 continued)
The socio-economic factors that increase South Africa’s
vulnerability to climate change :
Large proportion of SA’s population has low resilience to
Having discussed these observed impacts, it is important to point out Human health
extreme climate events (poverty; high disease burden; inadequate
housing infrastructure and location) that climate change is a complicated problem, linked to difficult issues
Climate change generated events exacerbate existing socio- such as poverty, economic development and population growth. • The impacts of climate change on humans can be felt either directly
economic challenges, inequalities and vulnerabilities
Much of SA has low and variable rainfall
(e.g. through heat stress) or indirectly through floods, fires and
A significant proportion of surface water resources is already fully In South Africa, as with the rest of Africa and other developing countries, degradation of natural ecosystem services (e.g. clean air and water).
allocated
our socio-economic circumstances increase our vulnerability to the
Agriculture and fisheries are essential for food security and local
livelihoods • Health impacts, e.g. a wetter, warmer climate would expand the
impacts of climate change.
spread of malaria. Cholera outbreaks have been associated with
extreme weather events, especially in poor, high-density settlements.
23
Urgent action is needed to limit the degree of climate change and adapt
to its impacts to shield the environment, people and the economy of our • Some impacts due to climate change may already be occurring, as a
country. result of rainfall (drought and floods) and temperature extremes.
• Vulnerable sectors of society will be susceptible to negative climatic
Slide 24
Projected impacts of an unstable climate in South Africa
System/Conditions Changes changes, with effects on poverty levels and food security.
already fully allocated; reductions in
Water availability, increased frequency of
extremes Water Extreme weather events
most scenarios suggest adverse
Agriculture impacts, particularly for small-scale
farmers
Human health strong interactions with environmental
quality and current disease burden
• Since South Africa is generally arid to semi-arid, less than nine • The changes in temperatures, rainfall and climate are broadly
Extreme events
weather-related impacts are already
exacerbated by poor land management in
percent of the annual rainfall ends up in rivers on average, and about projected to get more and more severe. Impacts include drought,
parts of South Africa
degradation trends likely worsen
five percent recharges groundwater in aquifers. water scarcity, food insecurity, extreme weather events (e.g. big
Natural resources without addressing sustainable
management issues; opportunities for storms) and changed seasons.
increasing resilience of rural and urban • Together with high rainfall variability, especially in drier areas, this
communities
Human settlements
and livelihoods
emerging understanding suggests
significant and adverse impacts
means that rainfall and river flow are unpredictable and unevenly • Damage costs due to extreme weather-related events (flooding, fire,
distributed, with only 12% of the land area generating 50% of stream
24
storms and drought) are conservatively estimated to be R1 billion
flows. This results in some areas experiencing droughts, while others per year between 2000 and 2009.
experience flooding.
Natural resources
• Climate change is one of drivers currently informing water resource
planning decisions in South Africa. Most critically, surface water • Our biodiversity will be severely affected, especially the grasslands,
resources are already over-allocated and the country is experiencing fynbos and succulent Karoo, where a high level of extinction is
water stress. predicted.
• Demand is expected to increase with economic growth, increased • Commercial forestry is vulnerable to increased occurrence of
urbanisation, higher standards of living and population growth. wildfires and changes in available water in the south-western regions.
Surface water (rivers, dams, etc) and groundwater is also exposed to • Strong trends have been detected in the physical marine environment
pollution from urban, industrial and agricultural sources, e.g. water (rising sea level, warming of the Agulhas current and parts of the cold
treatment works, land-fills and mines. All of these changes will have Benguela current) anticipated to threaten the survival of important
significant impacts on the future availability of water resources. fishery resources; however projections of climate change impacts
Agriculture remains uncertain.
Human settlements and livelihoods
• Maize production in summer rainfall areas and fruit and cereal
production in winter rainfall areas are likely to be significantly Extended dry seasons, increasing temperatures, extreme storms and
negatively affected. sea level rise result in drought, crop failure, livestock death, damage to
• Small-scale and homestead dry-land farmers are most vulnerable. infrastructure (e.g. buildings, roads, etc) and runaway fires. It will further
Intensive irrigated agriculture is better buffered, but vulnerable to entrench poverty with the increase of vector-borne disease (e.g. malaria),
water shortages. disabling of existing livelihoods and damage to household assets.
14 LETS RESPOND TOOLKIT LETS RESPOND TOOLKIT 15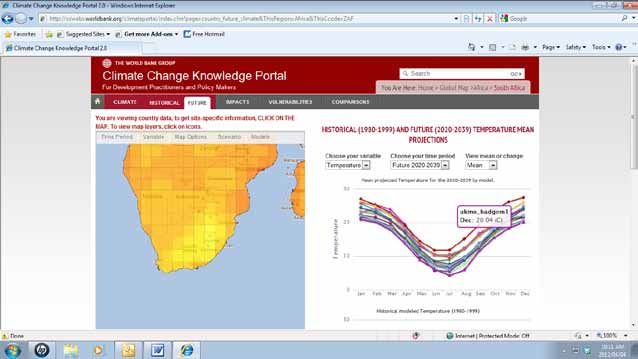
TOOL 2
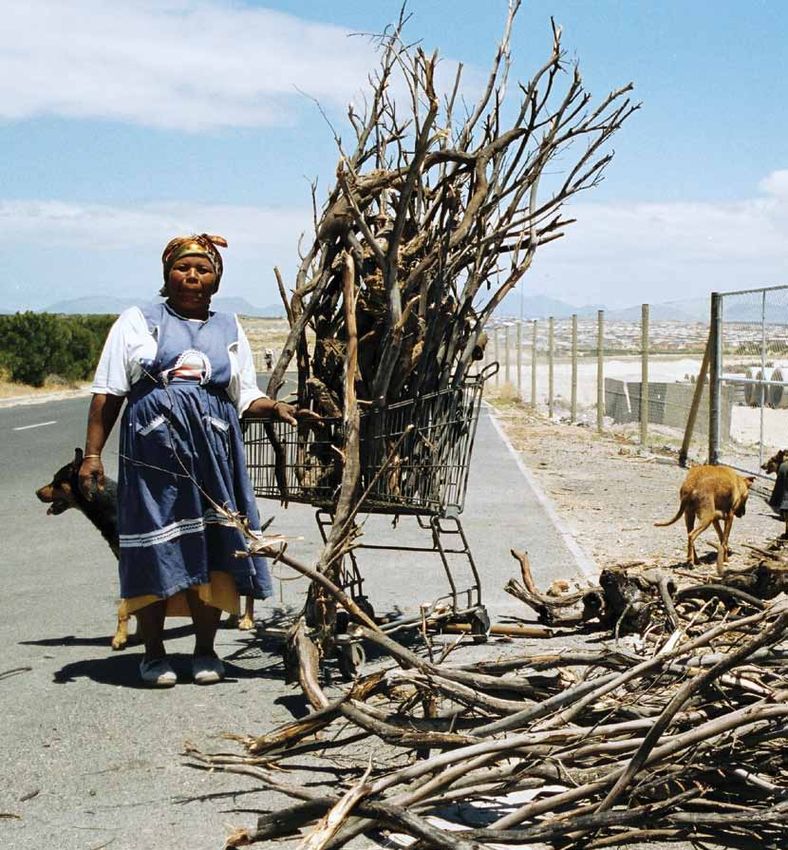
Slide 25 – Our local experience of climate: impacts and National response to climate change Slide 28
vulnerabilities Significant national response to climate change includes:
Na$onal Climate Change Response White Paper; and
• There has been significant national leadership in response to the
INSERT OWN MUNICIPAL EXPERIENCE OF
CURRENT CLIMATE VARIABILITY IN HERE INSERT YOUR OWN MUNICIPAL EXPERIENCE IN HERE Na$onal commitments to greenhouse gas (GHG) reduc$ons.
challenge of climate change.
In support of this the government has developed a number of
policies and programmes such as:
• South Africa is committed to contributing its ‘fair share’ to the
It is a good idea to start with existing issues and concerns relating to the Na$onal Energy Efficiency Strategy;
a Renewable Energy Programme; and global efforts of reducing GHG emissions levels and managing the
climate. Working from existing problems outwards helps to draw people A research programme on na$onal vulnerability to projected
climate change impacts.
unavoidable impacts of a climate already undergoing change.
into something that they can relate to. It also ensures that your climate Municipal actions therefore have a well developed national
framework in which to work.
response moving forward builds on the valuable existing experience you • Government has policies and programmes to meet energy efficiency
25 have in your municipality in handling current climate variables. 28 and renewable energy targets, sustainable development, green
economic development and extensive national research programmes
Some examples include: on climate change and associated vulnerabilities. These all support
local action.
In Thulamela Local municipality: Deforestation of indigenous Mopane
wood, which is illegally harvested as it fetches a good price. Deforestation • National commitments to GHG reductions: South Africa has
affects the grazing environment and causes severe erosion which in turn committed to reduce its GHG emissions by 34% below the
makes the effects of flooding far worse. Local people are very dependent current emissions path by 2020; and by 43% by 2025.
on the land for their livelihoods. • National Climate Change Response White Paper: The policy
on South Africa’s GHG reduction commitments and how the
In Emfuleni Local Municipality: Pollution (illegal dumping, oil spillage,
country will achieve them.
sewage) of water resources by industrial businesses and informal
settlements is affecting people living downstream and degrading the river • National Energy Efficiency Strategy: This strategy outlines South
ecosystem, Emfuleni’s major water source, the health of which is critical Africa’s energy efficiency goals and how it aims to achieve them.
as a ‘buffer’ to absorb flooding impacts. • Renewable energy programme: The national Department of
Energy aims to have 3,725 Mega-Watts of renewable energy
EXAMPLE:
insert your own municipality’s experience in here Slide 26 (e.g. wind power, solar power, etc) installed by 2016. The bidding
process for these projects is currently underway.
Emfuleni’s Climate Experience
Experiencing high levels of flooding since 2008 during December and January
EXAMPLE ONLY – REMOVE THIS SLIDE FOR YOUR
Cost to municipality – have had to buy rescue boats and train disaster
management team to dive
PRESENTATION • A research programme on national vulnerability to projected
Existing pollution and degradation of the river system affects its ability to absorb
climate change impacts.
This slide shows you how you could detail the current climate and
the flood impacts
Struggle to manage the water pollution problem as limited capacity – small
environmental experience in your municipality.
number of environmental officers to monitor local businesses
Informal settlements suffer in floods, with drowning and loss of homes, but very
difficult to move these people who have nowhere else to live
Other: Heat waves during summer – resulted in heat stress and high level
diseases, changing seasonal patterns affecting agriculture and people’s livelihoods
26
Slide 27
Module 4: Planning in the face of uncertainty: national
and local responsibilities
Planning in the face of
uncertainty
This ‘module’ looks at what the role of government (national and
local) is in responding to climate change. It outlines the local
government mandate in terms of climate response and introduces
the process to integrate climate change response into local (IDP)
27 planning.
16 LETS RESPOND TOOLKIT LETS RESPOND TOOLKIT 17TOOL 2
The local government climate response mandate Slide 29 Why do local authorities need to be climate responsive? Slide 30
• The na(onal Climate Change Response White Paper
recognises local government as an important site of delivery. Climate change is a global issue however the impacts of changing weather patterns will be
• The National Climate Change Response Strategy (NCCRS) is the felt locally and municipalities need to ensure that they can adapt to projected changes
Moving on to the local sphere of government, where the actual impacts
• Sec(on 10.2.6 iden(fies the key cons(tu(onal mandates of
local government that are cri(cal in developing our na(onal
climate response: blueprint for South Africa’s response to climate change. The policy of climate change will be felt, the question arises: why does local
Critical actions to reduce climate change and greenhouse gas emissions can best be
recognises local government as an important site of delivery. Its twin government need to be climate responsive?
– Planning and urban development undertaken locally
– Municipal infrastructure and services
– Water, energy and waste demand management
– Local disaster response objectives are (1) to contribute to the global efforts to bring GHG Municipalities have an obligation to manage resources as efficiently as possible in the
• Points to support needs: Clarify mandates (DCOG), Fiscal emissions to levels ‘required by science’ to curb catastrophic climate
interests of their citizens - not responding will cost more
• Many of the critical actions to manage climate variability and reduce
support (NT), Intergovernmental coordina(on (SALGA),
Response strategies (Province)
change; and (2) to manage the unavoidable impacts of a climate Municipalities have important control and influence over:
climate change impacts, as identified in national policy, fall within local
• Climate change toolkit
already undergoing change. Building Land use
Urban parks
and Water
Electricity Waste
Transport
Air quality
Other
relevant
government responsibilities as detailed in the Constitution of South
codes planning supply management management policy
Africa (Act 108 of 1996) and the Municipal Systems (Act 32 of 2000).
conservation
areas
29 30
• Section 10.2.6 in particular notes the key role of local government in
(1) planning and urban development; (2) municipal infrastructure and • There are important benefits and opportunities for local government
services; (3) water, energy and waste demand management and (4) in responding to climate change challenges, notably:
local disaster response. It indicates awareness that local government • Energy efficiency improves economic competitiveness
will need support to fulfil these mandates. In particular, it identifies
the following support needs and responsible institution: • Business opportunities may arise through new, ‘green’ industries
such as energy efficiency
• Clarifying of mandates (national department of Cooperative
Governance); • Public transport reduces pollution and congestion; improved
mobility of people stimulates economic activity
• Fiscal support (National Treasury)
• Improved building quality, particularly in low-income housing,
• Intergovernmental coordination (South African Local greatly improves health and quality of life
Government Association)
• Replenishing the natural resource base through rebuilding
• Response strategies (provincial government) wetlands, planting trees and clearing alien plants creates jobs and
enhances important environmental services such as water, flood
protection, fish and plant stocks
• Urban greening (planting trees/shrubs in the urban area) absorbs
carbon and provides shade and beauty
• Not responding will cost more, for example:
• In 2007 and 2008, floods in the Western Cape Province cost the
government more than one billion rand each year.
• Losses of R2.5 billion were caused by eight extreme weather
events in the Eden District (Knysna, George, etc) alone, between
2003 and 2008. The damage was largely to property and roads.
• In 2007, the cost of road repairs resulting from extreme weather
events used up almost 97% of the total transport budget of the
Western Cape Province for that year. The province estimates that
damages from unmitigated climate change could range between
5% and 20% of GDP annually by 2100.
Municipalities have important control and influence over building codes,
land use planning, urban parks and conservation, water and electricity
supply, waste management, transport, air quality management, and other
relevant policy areas. Look at the Local Government Mandates section
in the Introduction to the Let’s Respond Guide for more detail.
18 LETS RESPOND TOOLKIT LETS RESPOND TOOLKIT 19TOOL 2
How do we respond to the local impacts of climate
change? Slide 31 Building climate resilience - examples of action (adaptation)
Slide 34
Tree Planting
How then does local government respond? The key is that municipalities Includes examples of building resilience within communities through
Harvesting the
rain – eThekwini
How do we plan for the local effects of climate
change when they could very well range from need to plan and respond appropriately, considering the impacts (which adaptation actions:
rela8vely manageable to catastrophic? …
vary from manageable to catastrophic) of climate changes that expose Working for Water
Programme
The challenge for municipali8es is not to predict
communities to a number of risks (large and small) and influences the • Restoring wetlands helps with flood prevention, because a wetland is
the future, but to approach the future with the
right tools and the right informa8on. ability of local government to deliver on its mandate. a natural flood “buffer,” acting as a storage space for all the water
Post Carbon Ci,es, Daniel Lerch, Post Carbon Ins,tute
• The National Working for Water programme involves the removal
of alien plants/trees. It has many benefits:
31 34
• creating jobs
How do local authorities respond to climate impacts?
Slide 32
• saving water (alien plants generally absorb more water)
Mitigation and Adaptation
are the 2 broad ways that local governments can respond to climate
change
As per the text on the slide • protecting from floods (alien plants sometimes block rivers and
MITIGATION ADAPTATION cause them to flood)
Focus on reducing
greenhouse gas emissions,
Focus on building resilience
to the impacts and effects of a
There are two broad ways that local governments can respond to climate
through: changing climate within our
communi:es. This requires : change: • increasing the amount of local plants/fish (alien plants generally
energy efficiency and an assessment of
renewable energy use, localised risks, and
the integra:on of kill local plants/fish, because they use most of the water/
• Mitigation efforts focus on reducing greenhouse gas emissions,
in an interna:onal effort to climate change
bring emissions to a level
required by science to curb
considera8ons into all
areas of decision‐making.
nutrients)
global warming.
through initiatives related to energy efficiency and renewable energy
• Urban greening (tree planting) absorbs greenhouse gases and
32 use, in an international effort to bring emissions to a level required by
science to curb global warming. provides shade and beauty.
• Adaptation efforts are an attempt to build resilience within our • Rainwater tanks collect rainwater from roofs of homes. This water
communities to the impacts and effects of climate variability and a can be used for washing, local food gardens, etc.
changing climate. This requires an assessment of localised risks, and an
integration of climate change considerations into all areas of decision-
Why integrate climate change into the IDP?
Slide 35
making. The lifespan of today’s development decisions
Integra(ng climate change into a municipal IDP offers a means of iden(fying and priori(sing
op(ons for ac(on when adap(ng planning to climate change and when reviewing ac(on.
The development planning decisions made today will greatly affect the
In short, mitigation tries to minimise climate change, while adaptation vulnerability of people to climate change in future. For example water-
helps people cope with the climate changes that are already occurring or
related infrastructure (dams, pipes, storm water system, etc) is typically
will occur soon.
designed to last 50 to 100 years, which is when there might be severe
climate change (if climate mitigation is not enough). Climate change will
Lower carbon development - examples of actions (mitigation)
Slide 33 cause water shortage, flooding and water quality reduction, with related
Efficient lighting Solar water
deaths and disasters.
Adapted from Stafford et al 2011
heaters and
Ceilings
These are examples of mitigating actions. All interventions focus on the 35
reduction of greenhouse gases (GHGs) through renewable and energy
It is therefore critical that the planning decisions made by local
efficiency initiatives:
Energy efficient street/
traffic lighting Invest in public
government today are made in consideration of the severe impacts of
transport
• Efficient lighting: provides good quality lighting and uses less climate change in the next 5, 10, 20 and 50 years.
electricity generated from the country’s coal-fired power stations
(coal-fired electricity creates a lot of greenhouse gas emissions)
Integrating climate change into our IDP Slide 36
To integrate climate change into our IPD we need to:
33 • Solar water heaters installed on the roofs of homes heat water using Understand regional and local risks and vulnerabili3es Slide text refers.
the sun’s energy; avoiding the use of electricity to heat water Draw on local knowledge, experience and ins3tu3onal memory
Adjust current plans to be flexible to a range of possible impacts
Es3mate baseline emissions and iden3fy emission sources
Iden3fy and choose the most effec3ve response op3ons(mi3ga3on and
• Installation of ceilings in homes keeps them cooler in summer and adapta3on)
Ensure that municipal plans fit with plans of related ins3tu3ons (such as
warmer in winter making homes more comfortable; saving on money district Municipali3es, neighbouring municipali3es, provinces, water boards and
so forth)
needed to buy electricity, paraffin, gas, etc, to heat/cool the house; This is not
intended to duplicate other planning processes, but to mainstream climate
improving building quality, particularly of low-income housing; and change issues into all planning processes
a new planning or repor3ng requirement
greatly improving health and quality of life.
36
• Public transport: safe, affordable and reliable public transport is
more energy efficient than private car use. Public transport reduces
pollution and traffic jams, improves mobility of people and stimulates
economic activity.
20 LETS RESPOND TOOLKIT LETS RESPOND TOOLKIT 21TOOL 2
Integrating climate change: Phases
Slide 37 Slide 39 - 41
Allocates responsibility to drive the process, plans the way and develops
Preparation council commitment to the climate change response approach
The slide outlines the major phases of the integration process that Following two slides are DEMONSTRATION DEMO SLIDES: These show examples of the kind of information you
Phase 1 • Development of Climate Change Analysis Report for inclusion in the IDP
the municipality will be undertaking. This involves a simple, five phase only – an example of local climate and could present here.
Analysis Situational Analysis (Status Quo Report)
emissions information in Thulamela
Phase 2 • Supports a participatory planning exercise to develop a municipal climate
process, aligned with the IDP planning approaches. Each phase includes Municipality.
response vision and objectives, for inclusion within the IDP Strategic
Strategy Focus Areas and alignment of Sector Plans with these
steps to integrate the unfolding climate response into the IDP drafting
Phase 3
Projects
• Takes the new climate priorities into detailed project development
plans, and identifies capacity, resources and performance management
systems to integrate this into the Municipal operational systems
process. The steps are accompanied by support tools.
Phase 4 • Ensures that climate response work is visible throughout the IDP and
Integration
Approval
related development plans.
• Communicating what the municipality is doing about climate change to • Preparation allocates responsibility to drive the process, plans
Implementation its citizens and residents, and establish important learning networks
37 the way and develops council commitment to the climate change
response approach. Weather event
1985 – 1992:
Drought – no rain
Impacts
Food shortage – local livelihoods and businesses affected
Death of livestock
Human deaths through extreme heat and dehydration
Issuing of food parcels = 16 months of municipal capacity diverted to this task
Erosion of soil
• Phase 1: Analysis will develop a municipal Climate Change Analysis
Skin irritation, malaria, bilharzia, cholera, typhoid (from stagnant water) =
pressure on health system, many deaths
Malnutrition
Climate ‘refugees’ – people forced off the land, don’t return = permanent loss
Report for inclusion into the IDP Status Quo Report (Situational
of agricultural production, new entrants into labour market needing jobs
1992 ‐ 1994: rain came – and high levels malaria post the dry times
Dec 2000 – Feb Landslides
2001; and again Damage to infrastructure: roads, houses, bridges, electricity and water
2002: heavy storms infrastructure – enormous cost
Analysis).
and floods Ran short of mielie meal
Couldn’t bury the dead because couldn’t get death certificates because cut off
from town
No road infrastructure left, can’t cross streams ‐ communication cut off
Sewerage overflowed
Deaths where people stranded in mountains, disease
• Phase 2: Strategies supports a participatory planning exercise to
Schools collapsed and many had to close for quite a long time
Work stopped – economic disruption where crops washed away; those
dependent on subsistence food, or on trading local agricultural produce where
destitute; often no fall back – dependent on daily income from sales of fruit and
veg
develop a municipal climate response vision and objectives, for
2009 – 2010: need to change planting times
unusually high levels unusual cold – plants won’t survive, change type of crops
of winter rains – vegetables usually planted like dry winter, wet destroys veg
above average for knowledge of when rains come is very important – nb local knowledge, dept
these months agriculture also (via radio) informs people when to start planting
inclusion within the IDPs Strategic Focus Areas (SFAs) and the Extreme heat affects water and livestock
Extreme winds This is experiences in the month of November in a particular area of the
alignment of Sector Plans with these.
municipality; it can be strong enough to flatten houses.
Particular vulnerabilities noted:
• elderly
• those dependent on small scale agriculture, subsistence farming – lose crop and livelihood for
whole season gone
• Phase 3: Projects takes the new climate priorities into the detailed
• malaria in outlying areas
project development plans, and identifies capacity, resources and
Participants developed an
performance management systems to integrate this into the understanding of energy issues and
key responses towards improving
energy services for development and
Municipal operational systems. mitigation of climate change:
• Deforestation: Mopane wood sought after
• Phase 4: Integration, Approval and Implementation ensure that and is illegally harvested
•Local air pollution from boilers, wood, etc
the climate response work is visible throughout the IDP and related
•Solar home systems – frustrations due to
limited application and preference is for
electrification
development plans. •Non compliance with regulations causes
short circuiting of electricity wiring in new
houses
•Diesel pumps along rivers get washed away
in floods, polluting the rivers
Slide 38
•Increasing price of fuel impacts trade and
commerce
•Mid-high income households consume large
amounts of electricity
Include your own municipal information on climate here: likely
INSERT OWN MUNICIPAL CLIMATE CHANGE ANALYSIS
REPORT INFORMATION: changes, experience of changes and/or extreme weather events, local
•Likely climate changes, impacts and vulnerabilities
experience of impacts on climate, communities, business.
To conclude Slide 42 - 43
•GHG emissions picture and key energy and emissions
issues “It is clear that
something is
To conclude: Thank you.
coming and if
we are not
prepared for it
there will be
trouble.”
38
Ms. Damana,
Senior Manager
Sustainable Development,
Vhembe District Municipality
Limpopo Province
42
43
22 LETS RESPOND TOOLKIT LETS RESPOND TOOLKIT 23PHASE 1 PHASE 2 PHASE 3 PHASE 4
TOOL 3
Preparation
Analysis
Strategy
Projects
Implementation
Integration
• A report titled Impacts, Vulnerability and Adaptation in Key South African Sectors: An Input into the Long Term
Mitigation Scenarios Process was published by Midgley et al (2008).
Provincial climate change reports
Western Cape:
• A Status Quo Vulnerability and Adaptation Assessment of the Physical and Socio-Economic Effects of Climate
Change in the Western Cape (Midgley GF, Chapman RA, Hewitson B, Johnston P, De Wit M, Ziervogel G, Mukheibir
P, Van Niekerk L, Tadross M, Van Wilgen BW, Kgope B, Morant PD, Theron A, Scholes RJ, Forsyth GG, 2005)
• A Climate Change Strategy and Action Plan for the Western Cape (The Department of Environmental Affairs and
Development Planning, Western Cape, December 2008)
Document: http://www.capegateway.gov.za/other/2009/1/cc_strategy_and_action_plan_finaljanuary_09.pdf
Eastern Cape
• The Eastern Cape Department of Economic Development and Environmental affairs released the Provincial Climate
A Directory of Key Regional Climate Change Resources Change Response Strategy, 2010.
Document available on: www.deaet.ecprov.gov.za
Objective: This tool provides an overview of essential resources available to support municipalities while developing the
climate change analysis report for the municipal area (Phase 1).
Municipal Adaptation Plans and Documents
All documents outlined in this tool are available in the accompanying CD.
• eThekwini Municipality published a Climate Change Municipal Adaption Plan - Health and Water in 2009. In the Headline
Adaptation Strategy, public health and water supply sectors were identified as the key sectors that would be impacted severely
Regional Climate Change Programmes by climate change.The municipality is currently developing sector-specific adaptation plans for the water and health sectors.
Website: http://www.erm.com/
The Southern Africa Regional Climate Change Programme is a five year programme (2007-2012) that Contact: Dr. Debra Roberts, Deputy Head: Environmental Management, Development Planning, Environment and
plays a facilitation and technical assistance role in building the region’s adaptive capacity, strengthening Management Unit, eThekwini Municipality, e-mail: RobertsD@durban.gov.za
the evidence for adaptation, and partners with institutional structures to strengthen the region’s climate • eThekwini Municipality: Roberts, D. Thinking globally, acting locally: Institutionalizing climate change
finance absorptive capacity. The initial phase of the study produced a sub-regional map identifying adaptive at the local government level in Durban, South Africa 253-270 in Bicknell, J. D. Dodman, et al., Eds. (2009).
capacity “hot spots.” A host of useful publications are available for download from the programme’s website. Adapting to Climate Change: understanding and addressing the development challenges. London, Earthscan.
Website and contacts: http://www.rccp.org.za/ Available at http://eau.sagepub.com/content/20/2/521.abstract
• A Framework for adaptation to Climate Change, 2006, was developed by the City of Cape Town. The framework guides
National climate change Reports and Policies the city in prioritising the most urgent adaptation activities.
Document: http://www.erc.uct.ac.za/Research/publications/06Mukheibir-Ziervoge%20-%20Adaptation%20to%20CC%20
• South Africa’s Second National Communication was published in 2011.The document reports on the current status in%20Cape%20Town.pdf.
of projected climate change in South Africa, together with a status update on mitigation and adaptation measures, plans • eThekwini Municipality (2011). Durban: a climate for change- transforming Africa’s future. Environment Planning and
for the future, and the challenges in implementing them. This forms part of the country’s commitments as signatory Climate Protection Department AND the Energy Office, Ethekwini Municipality.Available online at http://www.erm.com/ or
to the United Nations Framework Convention on Climate Change. for more information contact Debra Roberts: RobertsD@durban.gov.za; Tel: +27 (31) 311 7875 or Derek Morgan,
Document [size: 4MB]: http://www.sanbi.org/sites/default/files/documents/documents/sncdraftnov2010.pdf MorganD@durban.gov.za; Tel: +27 (31) 311 1139.
• The National Climate Change Response White Paper was published in 2011 by the Department of Environmental This booklet provides a wide range of cross-sectoral interventions with which the Municipality is involved in
Affairs. The objective of this policy is to make a fair contribution to the global effort to stabilise greenhouse gas response to climate change. It also emphasizes the strong linkages that exist between climate protection agenda
concentrations in the atmosphere at a level that prevents dangerous anthropogenic interference with the climate system. and the sustainability agenda at the local level.
It aims to adapt to, and manage, unavoidable and potentially damaging climate change impacts, through interventions • Ziervogel, G & Methner, N (2009). Adapting South African Cities and Towns – a local government guide to climate
that build and sustain South Africa’s social, economic and environmental resilience, and emergency response capacity. change adaptation planning. Sustainable Energy Africa, Cape Town.
Document: http://www.info.gov.za/view/DownloadFileAction?id=152942 Available for download from www.cityenergy.org.za
• The Long Term Mitigation Scenario (LTMS) for South Africa was released by the Department of Environmental Affairs
in 2008. It explores how South Africa can meet a ‘required by science’ emissions scenario to curb catastrophic global
warming. Although the focus of the study was on mitigation, there was also an adaptation component.
24 LETS RESPOND TOOLKIT LETS RESPOND TOOLKIT 25You can also read