NEW SMARTS Supporting Queensland's knowledge-intensive industries through science, research and innovation
←
→
Page content transcription
If your browser does not render page correctly, please read the page content below
NEW
SMARTS
Supporting Queensland’s
knowledge-intensive
industries through science,
research and innovation

Report prepared by Claire Naughtin,
Joanna Horton and Hien Pham

CITATION                                                           CURRENCY CONVERSIONS
Naughtin C, Horton J, Pham H. 2019. New smarts: Supporting         All dollar value figures denote Australian dollars unless
Queensland’s knowledge-intensive industries through science,       otherwise specified. Conversions were made using the annual
research and innovation. CSIRO Data61: Brisbane, Australia.        average exchange rate for a given currency, as specified by the
                                                                   Reserve Bank of Australia’s historical data. Conversions for 2019
                                                                   values and forecast conversions were made using the exchange
COPYRIGHT AND DISCLAIMER                                           rate for February 2019.
© Commonwealth Scientific and Industrial Research
Organisation and the Queensland Government Department of
Environment and Science 2019. To the extent permitted by law,      ACKNOWLEDGEMENTS
all rights are reserved and no part of this publication covered    The authors would like to acknowledge the generous
by copyright may be reproduced or copied in any form or by         contributions of the industry, government and academic
any means except with the written permission of CSIRO.             stakeholders who participated in the interviews and workshop
                                                                   held as part of this project. We also thank the project team
                                                                   members at the Queensland Government Department of
IMPORTANT DISCLAIMER                                               Environment and Science for their input, enthusiasm and
CSIRO advises that the information contained in this               guidance in this project.
publication comprises general statements based on scientific
research. The reader is advised and needs to be aware
that such information may be incomplete or unable to be
used in any specific situation. No reliance or actions must
therefore be made on that information without seeking
prior expert professional, scientific and technical advice. To
the extent permitted by law, CSIRO (including its employees
and consultants) excludes all liability to any person for any
consequences, including but not limited to all losses, damages,
costs, expenses and any other compensation, arising directly or
indirectly from using this publication (in part or in whole) and
any information or material contained in it.
CSIRO is committed to providing web accessible content
wherever possible. If you are having difficulties with accessing
this document please contact csiroenquiries@csiro.au.
CONTENTS
Executive summary........................................................................................................... vi
1   Introduction .................................................................................................................. 1
2 Snapshot of Queensland’s knowledge economy..........................................................3
3 Defining emerging industries...................................................................................... 9
    Phases of industry emergence...........................................................................................................................................9
    The four ‘Silicons’: Case studies of knowledge clusters.................................................................................................11

4 The emerging knowledge-intensive industries.......................................................... 17
    Sustainable energy ..........................................................................................................................................................19
    Cyber-physical security.....................................................................................................................................................26
    Smart mining, exploration and extraction.....................................................................................................................31
    Personalised and preventative healthcare......................................................................................................................37
    Advanced materials and precision engineering............................................................................................................43
    Next generation aerospace and space technologies.....................................................................................................47
    Advanced agriculture.......................................................................................................................................................53
    Circular commodities.......................................................................................................................................................59

5 Policy implications for science................................................................................... 66
    Improving collaboration between institutions, sectors and disciplines......................................................................66
    Supporting research across the entire pipeline.............................................................................................................67
    Attracting, training and retaining a skilled and diverse workforce..............................................................................68
    Broadening the role of government as a customer, enabler or innovator..................................................................69
    Positioning universities in supporting the advanced knowledge economy................................................................70

6 Conclusion.................................................................................................................... 71
Appendix A: Strategic foresight methodology................................................................73
Appendix B: Methodology for quantifying emerging
knowledge-intensive industries.......................................................................................74
    Modelling approach for emerging industries................................................................................................................ 74
    ANZSIC category definitions for emerging industries................................................................................................... 74

References.........................................................................................................................79
FIGURES
Figure 1. Number (left axis) and share (right axis) of knowledge workers in Queensland by industry in 2016................3

Figure 2. Share of workforce classified as knowledge workers in Australia, by state and territory, 2016.........................4

Figure 3. Higher education expenditure on research and development (R&D, in thousand dollars) in Australia,
by state and territory, 2016.......................................................................................................................................................4

Figure 4. Business expenditure on research and development (R&D, in thousand dollars) in values (left axis) and as a
percentage of gross state product (GSP, right axis) in Australia, by state and territory, 2015–16......................................5

Figure 5. Number of completed higher education degrees in Queensland, by field of study, 2017..................................6

Figure 6. Number (left axis) and share (right axis) of employed persons with science, technology, engineering and
mathematics (STEM) qualifications in Australia, by state and territory, 2016 .....................................................................6

Figure 7. Number of patents filed per million residents in Australia, by state and territory...............................................7

Figure 8. Service exports as a share of total exports (left axis) and the value of service exports
(in billion dollars, right axis) from Queensland......................................................................................................................7

Figure 9. Key phases of industry emergence...........................................................................................................................9

Image of San Francisco Bay Area, California, United States - the location of the Silicon Valley knowledge cluster........11

Image of Cambridge, United Kingdom - the location of the Silicon Fen knowledge cluster.............................................12

Image of Tel Aviv, Israel - the location of the Silicon Wadi knowledge cluster..................................................................13

Image of the Gold Coast, Queensland, Australia - the location of the ‘Silicon Sunshine’ knowledge cluster.................14

Figure 10. Number of employees (left axis) and firms (right axis) in the sustainable energy sector in Queensland......20

Figure 11. Growth in number of publications on the Web of Science across top 10 fastest growing fields
of study in Queensland from 2008–18...................................................................................................................................20

Figure 12. Amount of electricity generated via rooftop PV panels (in GWh) in Australia, by state and territory...........21

Figure 13. Cost of lithium-ion batteries worldwide (in dollars per kWh)...........................................................................22

Figure 14. Number of solar PV systems with concurrent battery storage capacity in Australia,
by state and territory...............................................................................................................................................................22

Figure 15. Number of employees (left axis) and firms (right axis) in the cyber-physical security sector
in Queensland..........................................................................................................................................................................27

Figure 16. Expenditure on cybersecurity in Indo-Pacific nations
(in billion dollars).....................................................................................................................................................................28

Figure 18. Business expenditure on research and development in Queensland by industry
(in thousand dollars), 2015–16...............................................................................................................................................33

Figure 19. Aggregate quantity of coal seam gas, condensate, crude oil, liquefied petroleum gas
and natural gas produced in Queensland
(in petajoules)..........................................................................................................................................................................34

Figure 20. Number of employees (left axis) and firms (right axis) in the personalised
and preventative healthcare sector in Queensland..............................................................................................................37

Figure 21. Healthcare expenditure as percentage of GDP in East Asia and the Pacific, across OECD
(Organisation for Economic Co-operation and Development) countries and in Australia, 2005–2015 ..........................38

Figure 23. Projected percentage of the Queensland population aged 65 years and older (medium series)..................39

Figure 24. Number of requested Medicare items for telehealth services in Australia,
by state and territory, 2008–18..............................................................................................................................................40

iv      New Smarts
Figure 25. Number of employees (left axis) and firms (right axis) in the advanced materials
and precision engineering sector in Queensland.................................................................................................................44

Figure 26. Share of manufacturing firms in Queensland by progress to advanced manufacturing, 2017.......................44

Figure 27. Number of employees (left axis) and firms (right axis) in the next generation aerospace
and space technologies sector in Queensland......................................................................................................................48

Figure 28. Population density (people per square kilometre) in Australia, by state and territory...................................49

Figure 31. Number of employees (left axis) and firms (right axis) in the advanced agriculture sector
in Queensland..........................................................................................................................................................................54

Figure 32. Growth in gross value added based multifactor productivity indexes across Australia
(index, 1994–95 = 100)............................................................................................................................................................55

Figure 33. Average annual global growth rates for selected crop yields............................................................................56

Figure 34. Daily protein and fat consumption in Asia and worldwide................................................................................56

Figure 35. Number of employees (left axis) and firms (right axis) in the circular commodities sector in Queensland..60

Figure 36. Commodity prices for selected commodities worldwide...................................................................................61

Figure 37. Kilograms of waste per capita in Australia by processing stream and state and territory, 2014–15...............61

Figure 38. Projected waste generated annually from lithium‑ion batteries in Australia (in tonnes),
by projection method..............................................................................................................................................................62

Figure 39. Share of businesses collaborating on innovation with higher education
or research institutions across OECD countries as a percentage of product and/or
process-innovating businesses in each size category, 2012–14...........................................................................................66

Figure 40. Amount of funding awarded by the Australian Research Council (ARC, in dollars),
by state and territory...............................................................................................................................................................68

TABLES
Table 1. Challenges and opportunities at each phase of industry formation.....................................................................10

Table 2. Enabling technologies that are applied and integrated across
emerging knowledge-intensive industries............................................................................................................................18

                                                                                                                                                                                            v
EXECUTIVE
SUMMARY

Knowledge is an increasingly important driver of Queensland’s       This report identifies a set of eight emerging ‘knowledge-
economy and will support the state in growing and diversifying      intensive industries’ for Queensland, defined as industries that
its industries in the future. Advances in enabling technologies,    do, or are predicted to, draw heavily on technology and/or
combined with existing research capabilities and local,             human capital inputs. These industries are driven by shifts in
national and international market shifts, present opportunities     multiple supply and demand trends, where a change in supply
for stakeholders to seed new industries and increase the            provides opportunities to offer new products or services or
knowledge-intensification of existing or previously dormant         deliver existing business processes more efficiently, and a
industries. While this future horizon presents new opportunities    change in demand opens up a new market. This report aims to
to provide economic, environmental and social benefits for the      inform future policy and strategy decisions concerning science
state, there are current gaps that will need to be addressed.       in Queensland.

Eight emerging knowledge-intensive industries

                                               Drawing upon strengths in renewables research and enabling sensors, platforms and
             SUSTAINABLE ENERGY                nanotechnologies to provide sustainable, affordable and reliable energy products
                                               and services.

                                               Responding to the need for improved cybersecurity and leveraging research capabilities
             CYBER-PHYSICAL SECURITY
                                               in robotics and autonomous systems to provide technical and behavioural solutions.

             SMART MINING,                     Using enabling remote technologies and deep mining research and industry expertise
             EXPLORATION AND                   to enhance the knowledge intensity of the entire mining chain, from exploration to
             EXTRACTION                        mine remediation.

                                               Drawing upon world-class biomedical research facilities and infrastructure,
             PERSONALISED AND
                                               platforms, sensor technologies and 3D printing to provide customised and proactive
             PREVENTATIVE HEALTHCARE
                                               healthcare services.

                                               Leveraging advances in 3D printing and automation and existing strengths in advanced
             ADVANCED MATERIALS AND
                                               manufacturing research to provide high-value, low-volume customised inputs for a
             PRECISION ENGINEERING
                                               range of sectors.

             NEXT GENERATION                   Capitalising on geographical strengths and aerospace businesses and research to grow
             AEROSPACE AND SPACE               niche markets in the design, development, testing and maintenance of flight vehicles
             TECHNOLOGIES                      and Earth observation.

                                               Utilising deep food science expertise and enabling technologies to transition a strong
             ADVANCED AGRICULTURE              and mature agriculture industry into one that produces more sustainable, secure and
                                               nutritious products.

                                               Leveraging existing biotechnology research and an emerging biofutures sector to
             CIRCULAR COMMODITIES
                                               transform and reduce existing waste streams from industries and consumer markets.

vi   New Smarts
These industries were estimated to be at the ‘co-evolutionary’    4. Broadening the role of government as a customer, enabler
phase of industry emergence – the phase characterised by             or innovator: International knowledge clusters demonstrate
growth in the number of firms in that industry, where such           some instances where new industries emerged as a result
growth is supported by networks of enterprises, universities,        of government being an early customer and adopter, and
governmental agencies and others. These industries                   others where government had minimal involvement. While
show a strong potential for growth with later phases of              government is often viewed as a key source of funding for
industry emergence characterised by employment growth.               emerging industries, there are a variety of roles government
Knowledge-intensive firms can emerge via a variety of factors,       can play in facilitating industry growth.
as highlighted in this report by case studies of local and
                                                                  5. Positioning universities in supporting the advanced
international knowledge clusters.
                                                                     knowledge economy: Universities and research institutes
                                                                     have developed commercialisation entities to improve
Policy implications for science                                      the translation of research, but they have a broader role
                                                                     to play in enhancing industry–research collaboration
1. Improving collaboration between institutions, sectors             and responding to emerging education and workforce
   and disciplines: Collaboration is a persistent challenge          requirements. Graduate programs that offer flexibility and
   for the research sector at the local and national level, but      on-the-job training and are responsive to industry needs will
   emerging knowledge-intensive industries will depend upon          be necessary in future.
   inputs from multiple sectors, institutions and disciplines.
   Funding schemes that incentivise joint proposals as well as
   collaborative research and infrastructure initiatives could    This report presents a set of emerging knowledge-intensive
   help lessen current barriers to collaboration.                 industries that demonstrate the options available to
                                                                  Queensland, drawing upon the state’s research capabilities,
2. Supporting research across the entire pipeline: Research       enabling technologies and emerging sources of supply and
   funding is often skewed towards applied research as it has a   demand. Each industry faces a number of challenges to
   clearer economic pathway to impact, but basic research can     future growth concerning the research sector, infrastructure,
   provide broader environmental, health and social dividends.    education and the workforce, but through a coordinated effort,
   Basic research is needed to develop new knowledge for          Queensland can realise the full potential of its growing and
   applied projects and a short-term focus on applied research    evolving knowledge economy.
   funding could have longer-term consequences for growing
   Queensland’s emerging knowledge-intensive industries.          CSIRO’s Data61 was commissioned by the Queensland
                                                                  Government Department of Environment and Science
3. Attracting, training and retaining a skilled and diverse       to conduct this strategic foresight project as part of the
   workforce: Labour and skills shortages could limit future      Q-Foresight program – an initiative under a multi-year
   growth for a range of emerging industries, particularly as     Strategic Partnership Agreement between the Queensland
   these industries are predicted to demand new skills or skill   Government and Data61. Q-Foresight is Australia’s only
   combinations. These challenges are compounded in some          dedicated strategic foresight program and is designed to
   emerging knowledge-intensive industries which struggle to      provide state government agencies with improved information
   attract future workers due to outdated perceptions of the      for decision making about future trends, risks and scenarios.
   industry or which lack sufficient workforce diversity.

                                                                                                                               vii
viii New Smarts

1 INTRODUCTION

The Queensland economy, like many other advanced                    But what knowledge-intensive industries are emerging in
economies, has seen significant shifts over the past several        Queensland? There have been a number of reports that have
decades. Advances in technology, changes in consumer                aimed to explore emerging industries, such as the Queensland
preferences and globalisation, among other factors,                 Government’s industry roadmaps which have highlighted
have increased the focus on the generation of value from            advanced manufacturing, aerospace, mining equipment,
knowledge-intensive goods and services. While generation            technology and services, biofutures, biomedical, defence, food
and application of knowledge has played a longstanding role         and agriculture, and the screen industries.7–14 These industry
in economic growth, its importance has been intensified by the      roadmaps pinpoint Queensland’s competitive strengths;
enhanced connectivity provided by technology, particularly          strengths that provide opportunities to diversify its economy
through the internet.1 As such, knowledge-intensive activities      and grow knowledge-intensive jobs.15 Other reports have
will be a key driver of future growth, job creation and             similarly identified emerging industries in the Asia-Pacific
prosperity in Queensland’s economy.                                 region16 and high-potential digital industries for Australia.17
The term ‘knowledge economies’ was first coined by the              What is missing is a clear account of how Queensland’s science
Organisation of Economic Co-operation and Development               sector contributes to, or could contribute to, the state’s
(OECD) in 1996, and since then, a range of definitions have         emerging knowledge-intensive industries. Understanding the
been put forward.2 According to the World Bank, a knowledge         scientific capabilities that are needed to support the state’s
economy can be defined as an advanced economy where                 areas of competitive advantage and respond to emerging
greater importance is placed on the creation, dissemination         sources of supply and demand is critical to growing and
and use of knowledge assets over capital or labour assets and       diversifying Queensland’s knowledge economy. Extending
wherein there are high levels of knowledge-based activities.3       upon prior industry roadmaps and reports, this report aims to
‘Knowledge-intensive industries’ are the key contributors to a      identify a set of emerging knowledge-intensive industries for
knowledge-based economy and can be defined as industries            Queensland and explore the opportunities and challenges for
that draw heavily on technology and/or human capital inputs.4       the science sector in growing and developing these industries
                                                                    over the coming decades.
Science, technology, engineering and mathematics (STEM)
disciplines can drive innovation in primary, secondary and          CSIRO’s Data61 was commissioned by the Queensland
services-related industries in a number of ways.5 For instance,     Government Department of Environment and Science to
the application of fundamental STEM developments or                 conduct this project as part of the Q-Foresight program – an
infrastructure in areas such as computing and communications        initiative under a multi-year Strategic Partnership Agreement
technology can enable significant shifts in the types of services   between Queensland Government and Data61. This initiative
organisations provide and how these services are delivered.         is designed to provide state government agencies with
Moreover, STEM-related activities can drive innovation              improved information for decision making about future
internally within organisations (e.g. through the presence          trends, risks and scenarios. Using strategic foresight methods,
of skilled STEM workers or internal STEM-based research) or         this program aims to support the development of enhanced
externally through collaborations between industry, university,     policies, service delivery strategies and outcomes for the
research institutes and government.                                 people of Queensland.
However, the contributions of science, technology and research      This report first provides a snapshot of Queensland’s
to innovation in existing and new knowledge-intensive               knowledge economy (Chapter 2) and outlines a theoretical
industries are not always clear-cut. This is because service        framework for identifying different phases of emergence
innovation models are complex and STEM-related outputs can          for knowledge-intensive industries (Chapter 3). Chapter 4
be intangible, limiting their visibility to those outside of the    presents a set of emerging knowledge-intensive industries for
process.5,6 Consequentially, the value of science, technology       Queensland and the current research, infrastructure, education
and research in emerging knowledge-intensive industries             and workforce gaps that could limit future industry growth.
can be understated.6 As global competition for markets              The report concludes with a set of policy considerations for
continues to intensify, Queensland’s science sector will play an    future decisions in the science sector (Chapter 5). Details on
important role in growing new knowledge-intensive industries        the strategic foresight process and quantitative modelling are
and increasing the knowledge-intensification of existing or         listed in the appendices.
previously declining industries.

                                                                                                                                      1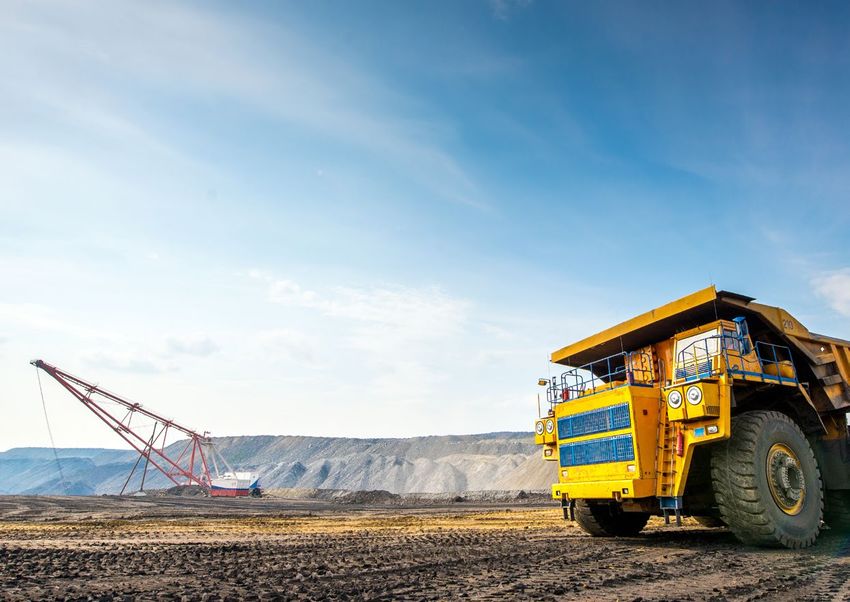
2 New Smarts
2 SNAPSHOT OF
QUEENSLAND’S
KNOWLEDGE ECONOMY
Queensland had 816,022 knowledge workers in 2016, Queensland is home to 10 of Australia’s universities, with the
representing 39.8 per cent of the state’s total workforce.18 majority of the campuses based in the south-east corner of
Here ‘knowledge workers’ are defined as those employed as the state. These universities are recognised nationally and
managers and administrators, professionals and associate internationally for their strengths in key science domains.
professionals.19 A large number of these knowledge workers For example, according to the World University Rankings,
were employed in the healthcare and social assistance sector the University of Queensland (UQ) is first in Australia for
and knowledge workers made up the highest share of the agriculture and forestry and environmental sciences and the
workforces pertaining to professional, scientific and technical Queensland University of Technology (QUT) places first for
services and other services (see Figure 1). When compared to communication and media studies.21 UQ is also the top-ranking
other states, Queensland falls near the lower end in terms of Australian institution on Nature’s index for international
the proportion of its workforce that is working in knowledge- scientific research collaboration.22 These research strengths
related occupations (see Figure 2). provide a strong foundation for growing Queensland’s
knowledge economy.
200,000 Number of knowledge workers 70
Share of knowledge workers
Share of knowledge workers (%)
60
Number of knowledge workers
160,000
50
120,000
40
30
80,000
20
40,000
10
0 0
es
ns
es
ce
g
es
de
ty
ng
n
es
es
ng
de
es
u n ce s
ng
es
g
in
t io
in
ic
ic
io
fe
ic
ic
ic
ic
ic
an
a
a
ri
si
ni
vi
in
sh
rv
rv
Tr
Tr
rv
rv
at
rv
rv
rv
Sa
tu
uc
ou
i
st
er
a
M
Se
Se
Fi
ic
Se
Se
Se
Se
Se
il
le
ac
Tr
si
tr
d
eh
tS
ta
d
sa
As
an
ns
al
te
uf
er
n
te
od
e
d
an
ar
Re
or
nc
t io
m
an
le
ic
as
Co
an
ta
th
al
n
W
Fo
hn
pp
ho
om
y
ra
io
W
Es
ci
ea
O
M
n
tr
nd
su
d
c
at
Su
io
So
W
es
d
cr
ec
Te
l
an
, W Re a
tr
at
an
In
la
or
Re
d
l
d
is
Te
d
uc
an
n
an
nd
ta
,F
er
an
in
io
d
nd
Ed
d
os
an
re
m
at
la
e
re
at
an
c
a
iv
,P
Ad
lt u
tifi
Ca
ia
od
ts
g
at
ia
rt
nc
in
cu
Ar
en
m
tr
ic
as
lt h
ed
po
ir
na
is
bl
ri
m
ci
,G
,H
M
ea
in
ns
Ag
Pu
co
,S
Fi
it y
m
H
al
n
a
Ac
al
io
Tr
Ad
nt
ic
on
at
tr
Re
si
rm
ec
es
El
fo
of
In
Pr
Figure 1. Number (left axis) and share (right axis) of knowledge workers in Queensland by industry in 2016
Data source: Queensland Government Statistician’s Office20
360 4,000,000
Percentage of workforce classified
Higher education expenditure
on R&D (in thousand dollars)
as knowledge workers (%)
50
3,000,000
40
30 2,000,000
20
1,000,000
10
0 0
ACT NSW VIC NT SA QLD TAS WA NSW VIC QLD WA SA ACT TAS NT
Figure 2. Share of workforce classified as knowledge workers in Australia, Figure 3. Higher education expenditure on research and development
by state and territory, 2016 (R&D, in thousand dollars) in Australia, by state and territory, 2016
Data source: Australian Bureau of Statistics23 Data source: Australian Bureau of Statistics24
Higher education institutions, government and not-for-profit Businesses expenditure on R&D in Queensland totalled $1.9
organisations and businesses all contribute to research and billion in 2015–16, the majority of which is concentrated in
development (R&D) activities. Queensland’s higher education experimental development (65.2 per cent).25 Mining (25.8 per
institutions spent a total of $1.9 billion on R&D in 2016, with cent), professional services (22.1 per cent) and manufacturing
the majority of these funds coming from general university (18.5 per cent) were the largest contributors to business
funding (60.1 per cent) and Australian Government competitive expenditure on R&D.25 In this expenditure, Queensland is on
grants (16.0 per cent).24 This figure places Queensland’s par with Western Australia – where mining contributes double
higher-education sector as the third-highest in terms of higher the R&D expenditure compared to Queensland’s mining sector
education expenditure on R&D, with New South Wales and – while New South Wales and Victorian businesses invest much
Victoria in the top two spots (see Figure 3). The top three more heavily in R&D (see Figure 4). Queensland has one of the
fields of research to receive this funding were medical and lowest shares of business expenditure on R&D as a percentage
health sciences (26.2 per cent), engineering (10.4 per cent) of gross state product in Australia (see Figure 4) and Australia
and biological sciences (10.0 per cent) and 51.3 per cent of this spent less on business R&D (1.0 per cent of gross domestic
funding was allocated to applied research.24 product) than the OECD average (1.6 per cent) in 2015.26
4 New Smarts7,500,000 Business expenditure on R&D 1.6
Share of GSP
6,000,000
Business expenditure on R&D
Business expenditure on R&D
1.2
as a percentage of GSP (%)
(in thousand dollars)
4,500,000
0.8
3,000,000
0.4
1,500,000
0 0
NSW VIC WA QLD SA TAS ACT NT
Figure 4. Business expenditure on research and development (R&D, in thousand dollars) in values (left axis) and as a percentage of gross state product
(GSP, right axis) in Australia, by state and territory, 2015–16
Data source: Australian Bureau of Statistics25
A strong supply of STEM-related capabilities will be necessary
for growing Queensland’s knowledge economy. STEM
disciplines account for a small proportion of Queensland
higher education degree completions, however, with most
completions in the fields of management and commerce,
health, and society and culture (see Figure 5). The number of
Queensland workers with STEM qualifications is projected
to grow at a much slower rate than other fields over the
period 2018–22,28 driven by factors such as a lack of industry
collaboration with schools and universities, workforce
shortages in qualified STEM teachers, a lack of funding to grow
this workforce and poor student engagement in STEM.29,30
According to the 2016 Census, 15.3 per cent of Queensland’s
workforce had STEM qualificationsa – a figure comparable to
that of New South Wales and Victoria but slightly below the
national average of 17.4 per cent (see Figure 6).
5Agriculture Environmental and Related Studies
Architecture and Building
Information Technology
Engineering and Related Technologies
Creative Arts
Nature and Physical Sciences
Education
Society and Culture
Health
Management and Commerce
0 3,000 6,000 9,000 12,000 15,000
Number of higher education degree completions
Figure 5. Number of completed higher education degrees in Queensland, by field of study, 2017
Data source: Department of Education and Training27
600,000 STEM-qualified workers 25
STEM-qualified share of workforce
Number of STEM-qualified employees
20 Share of workforce with STEM
450,000
qualifiedcations (%)
15
300,000
10
150,000
5
0 0
NSW VIC QLD WA SA ACT TAS NT
Figure 6. Number (left axis) and share (right axis) of employed persons with science, technology, engineering and mathematics (STEM) qualifications in
Australia, by state and territory, 2016
Data source: Australian Bureau of Statistics31
6 New SmartsAs a measure of knowledge-economy output, the number
of patent applications filed in Queensland grew by 16 per
Number of patents filed per million residents
250 cent from 2011 to 2018, compared to an average national
2011 2018
growth of 14.5 per cent.32,33 However, the number of patents
filed per million residents is lower in Queensland, with the
200
state consistently among the lowest-performing states and
territories over the past decade (see Figure 7). UQ represented
150 a major source of Queensland’s patent applications filed in
2017 and was third-highest in Australia for the number of
resident patents filed by a single organisation.34
100
Service exports are another output from Queensland’s
knowledge economy. Services accounted for 15.3 per cent of
50 Queensland exports in 2017–18, with the majority of these
being travel services (76.2 per cent).35 Although the value of
Queensland’s service exports has grown consistently over the
0 past five years, the value of service exports as a proportion of
ACT NSW WA VIC QLD SA TAS
total exports has declined in recent years (see Figure 8). This
decline corresponded to an increase in liquified natural gas
Figure 7. Number of patents filed per million residents in Australia, by (LNG) exports from Queensland.36 Although primary products
state and territory
accounted for a larger share of Queensland’s exports in 2017–
Data source: IP Australia32,33 18 (51.9 per cent) than for other states (e.g. 35.2 per cent for
New South Wales and 30.6 per cent for Victoria),35 the growth
in LNG exports reflects a diversification of Queensland’s
exports into new resource domains.
Share of total exports Value of exports
20 20
Value of service exports (in billion dollars)
as a share of total exports (%)
Percentage of service exports
15 15
10 10
5 5
2012–13 2013–14 2014–15 2015–16 2016–17 2017–18
Figure 8. Service exports as a share of total exports (left axis) and the value of service exports (in billion dollars, right axis) from Queensland
Data source: Department of Foreign Affairs and Trade35,37–41
78 New Smarts
3 DEFINING EMERGING
  INDUSTRIES

A central aim of this project was to identify a set of emerging
knowledge-intensive industries for Queensland. This

                                                                      Scale (e.g. number of sales, firms, etc.)
chapter outlines the different phases of industry emergence,                                                                                                          Renewal
highlighting the specific phase which was used to isolate
emerging industries. These industries were defined by
emerging sources of supply and demand that may be
geopolitical, environmental, social, technological or economic
in nature. These new knowledge-intensive clusters were
refined and validated through stakeholder consultations and
the final set of emerging industries and their associated supply
and demand drivers are presented in Chapter 4.                                                                                                                        Decline

Phases of industry emergence                                                                                      Initial
                                                                                                                                Co-
                                                                                                                            evolutionary
                                                                                                                                           Growth   Maturity   Decline/Renewal

Changes in economic, social, technological and geopolitical
                                                                                                                                 Phases of industry emergence
conditions are reshaping existing industries and giving rise to
new industries. The process of identifying emerging industries        Figure 9. Key phases of industry emergence
has generated much interest in academic, government and
industry domains, particularly given the positive impact              Source: Adapted from Phaal et al.44

that such industries can have on economic development.42
Emerging industries reflect the earliest phases of development,
where the boundaries between markets, technologies and                In the ‘co-evolutionary phase’, there is a significant qualitative
industry participants are yet to crystallise.43,44 They may be a      shift from the initial phase, characterised by rapid imitation
sub-sector or technology-driven niche market of an existing           of organisational, technical, product and service innovations
industry45 or an entirely new industry that is born from a new        across firms.42,49 There is convergence around how markets,
scientific discovery or innovation46 or the convergence of            products and services are defined and referred to by
multiple technologies.47                                              stakeholders, which opens up a window of opportunity for
                                                                      firms to enter the new industry.50 The number of firms in the
The start of the industry emergence process can be divided
                                                                      new industry increases,51 with the establishment of firms and
into three phases: initial, co-evolutionary and growth (see
                                                                      start-ups often supported by networks of existing enterprises,
Figure 9 and Table 1). In the ‘initial phase’, changes in industry,
                                                                      universities, venture capitalists, government agencies and
market or technological conditions become evident, but
                                                                      professional associations (e.g. conference organisers).52 This
the novel structure or identity of new industries is not yet
                                                                      report considers trends associated with the co-evolutionary
clear.42 While this phase is characterised by high levels of
                                                                      phase as indicators of emerging knowledge-intensive
entrepreneurial activity and opportunities for new entrants
                                                                      industries that have a high potential for future growth.
to enter previously dominated markets,42 firms that emerge
during the initial phase of industry emergence often lack             In the ‘growth phase’ of industry emergence, there is strong
sufficient resources, practices and skills.48                         and rapid growth in industry sales and the new industry order
                                                                      that emerged in previous phases takes hold.42 The number
                                                                      of firms in the new industry reaches its peak and begins to
                                                                      plateau.51 There is a greater sense of permanency around the
                                                                      new industry through the establishment of a dominant design
                                                                      and broad acceptance of the new industry category among
                                                                      stakeholders.50 Competition among firms increases too53 and
                                                                      a clear market leader emerges.42 In later phases of industry
                                                                      formation, applications, production processes and business
                                                                      models reach maturity.44

                                                                                                                                                                                 9
Table 1. Challenges and opportunities at each phase of industry formation
INITIAL CO-EVOLUTIONARY GROWTH
Challenges • Poorly defined business • Increased competition • Reduction in
models and limited between technologies, entrepreneurial activities
resources available to technology designs, value • Increased firm competition
commercialise products chains and platforms from incumbents and
• High market uncertainty, • Lack of accepted new entrants
making it difficult to develop industry standards
customer and producer bases
• Competition from late-
coming free-riders
Opportunities • Openings for new entrants to • Increased collaboration • Improvements in
enter markets between firms and product quality
• Strong entrepreneurial activity with universities and • Rapid growth in firm sales
research institutes and employment
• First-mover advantage
in market • Emergence of dominant • Common industry and
category, facilitating technology standards begin
communications with to emerge
industry stakeholders
Source: Gustafsson et al.42 and Horton et al.16
There are a range of factors that can trigger or drive an Moreover, drivers of industry emergence are subject to the
industry to emerge and grow. Scientific or technological broader socio-economic landscape. When the first digital
developments are among the most prominent factors that audio player, MPMan, was released by South Korean firm
challenge the current operating environment or industry Saehan in the late 1990s, access to MP3s and broadband
structure and can give rise to new products, technologies or internet was poor and as such, the product did not gain
services.44,54 Other key drivers can include cultural or social market traction.58 However, when Apple launched the iPod in
movements,55 changes in the regulatory environment,54 or 2001, MP3s and broadband internet were widely accessible.58
demand shifts.56 For example, the emergence of the not- Enabled by access to technology and its intuitive and seamless
for-profit recycling industry in the United States has been interface design, the iPod quickly became the dominant digital
attributed in part to the broader community understanding audio player on the market, accounting for 48 per cent of the
and practice of recycling behaviours.57 market by 2008.58 This report takes into account the broader
socio-economic landscape and scientific and technological
advances in defining a set of emerging knowledge-intensive
industries for Queensland.
10 New SmartsThe four ‘Silicons’: Case studies Government played a major role in the development of Silicon
Valley, beginning in 1913 when the US Navy invested heavily in
of knowledge clusters radio technology and awarded a number of major government
contracts to wireless technology firms in the Bay Area.63 These
New knowledge clusters can emerge via a variety of
contracts acted as an incubator for early high-tech firms in the
factors. This section highlights four case studies of local
beginning phases of their development.63 Stanford University
and international knowledge clusters that have emerged in
was also a critical catalyst in developing new enabling
previous decades or are currently emerging: Silicon Valley
technologies.63,64 In the 1940s, the university secured several
in the San Francisco Bay area (United States); Silicon Fen in
military-sponsored technology projects, which strengthened
Cambridge (United Kingdom); Silicon Wadi in Tel Aviv (Israel);
its reputation and attracted talented researchers64 and built
and ‘Silicon Sunshine’ on the Gold Coast (Australia). Local
the Stanford Industrial Park to facilitate industry–research
governments, universities, research institutes and enterprises
collaborations and commercialisation.64
have had different levels of involvement in these emerging
knowledge clusters, demonstrating multiple paths to industry A number of enabling regulatory changes occurred in the 1970s
formation. These case studies also illustrate the strong role and 1980s too: capital gains tax on stock profits was reduced,65
that local scientific and technological capabilities play in universities were granted rights to the commercialisation of
emerging knowledge clusters. intellectual property (IP) generated from federal funding,66
and citizens were allowed to invest their pension funds in
venture capital, which facilitated Silicon Valley’s switch from
SILICON VALLEY public funding to private equity.67 Although commercial work
Silicon Valley, in the San Francisco Bay Area, is arguably the and consumer products began to make up a larger percentage
world’s most famous example of a successful technology and of Silicon Valley’s ventures, these developments drew on the
knowledge-intensive cluster. Innovation and information existing infrastructure, expertise and industry–research–
products and services account for 26.1 per cent of employment government collaborations that had been developed over the
in Silicon Valley (2018 figure),59 with the Bay Area accounting preceding 70 years of government support.
for an estimated 329,200 local tech jobs in 2017 – more tech
jobs than in any other city in the United States.60 In 2017, Silicon
Valley generated 12.9 per cent of all patent registrations in
the United States61 and had 636 patents granted per 100,000
people, versus 106 in California as a whole.62
Image of San Francisco Bay Area, California, United States - the location of the Silicon Valley knowledge cluster
11SILICON FEN The literature on technology-focused industry growth also
notes that patterns of high-technology growth are strongly
Silicon Fen refers to the cluster of technology, bioscience and
associated with less-urbanised local environments.75 In
medicine companies that rapidly emerged in Cambridge,
Cambridge, the availability of vast tracts of land on which to
United Kingdom – a phenomenon also referred to as the
build the science and technology park was crucial,73 as were
‘Cambridge Phenomenon’. Since 1960, about 5,000 technology
the lifestyle qualities that made Cambridge an attractive place
companies have been founded in Cambridge68 and about 1,000
to live.72 Similar natural advantages likely exist in Queensland
of these companies still operate in the area.69 Employment
too. The Cambridge phenomenon highlights an alternative
in the knowledge-intensive sector in Cambridge was 29 per
path to industry emergence from Silicon Valley (i.e. industry
cent in 2015–1670 and over the period 2010–11 to 2015–16,
supported by university initiatives in the absence of formal
the turnover of Cambridge companies grew by 7.5 per cent
government support).
per annum and employment by 6.6 per cent per annum.70
The University of Cambridge was a key facilitator in the
emergence of Silicon Fen and the cluster emerged without
government engineering.
In the early 1950s, Cambridge University established itself
as a science and technology leader, building one of the first
general-purpose electronic computers.71 It later founded the
Cambridge Science Park in 1970 and allowed faculty members
to develop commercial applications and start new businesses
outside of the university.72 This enabled the creation of local
knowledge economies. For instance, the information and
communication technology (ICT) faculty staff at the University
of Cambridge were well placed to anticipate and respond
to growing economic demand for ICT-related products and
services72 and one in six Cambridge graduates went on to
work for Silicon Fen companies.73 Many Silicon Fen companies
can be traced back to scientific and technological capabilities
developed within Cambridge University, either as spin-out
companies based on university research or start-ups founded
by students or faculty.74
Image of Cambridge, United Kingdom - the location of the Silicon Fen knowledge cluster
12 New SmartsSILICON WADI The Israeli Government has played an active role in enabling
the success of Silicon Wadi. The Israeli Innovation and
Tel Aviv, Israel, is home to a cluster of high-tech start-up
Technology policy adopted during the 1990s promoted
companies known as Silicon Wadi. In 2016, 1,883 high-tech
R&D within the business sector, provided tax incentives for
companies were based in the Tel Aviv–Yafo Municipality,
venture capital through the Yozma Program and encouraged
representing a quarter of all Israeli high-tech companies and
entrepreneurial activity through a Technological Incubators
around 64 per cent of these were start-ups.76 Tel Aviv’s high-
Program.79 The Israeli Government also prioritised investment
tech industry employed 38,091 people in 2016, which equated
in science and technology education.77 Today, the Israel
to 12 per cent of Israel’s total workforce.76 The majority of these
Innovation Authority is a central government agency
companies are focused on big data and cloud computing, the
responsible for fostering innovations across a broad range of
Internet of Things and financial technology.76
sectors78 and there remains a strong feedback loop between
The success of Silicon Wadi and Israeli’s broader technology the military, the start-up sector and the Technological
industry has been attributed to several factors. Firstly, a Incubators Program.
relative lack of capital and resources in Israel relative to other
OECD countries pushed it to invest heavily in high-technology
industries.77 Reliable telecommunications infrastructure and
a highly educated workforce played a role in ensuring the
success of this investment.77 The Israeli military also recruits
talented high school graduates who spend long periods in
elite military technology units and are trained in state-of-
the-art military technologies that can later be spun off into
commercial applications.77 Israel’s mandatory military service
helped foster collaborations between Israelis within the
innovation ecosystem.78
Image of Tel Aviv, Israel - the location of the Silicon Wadi knowledge cluster
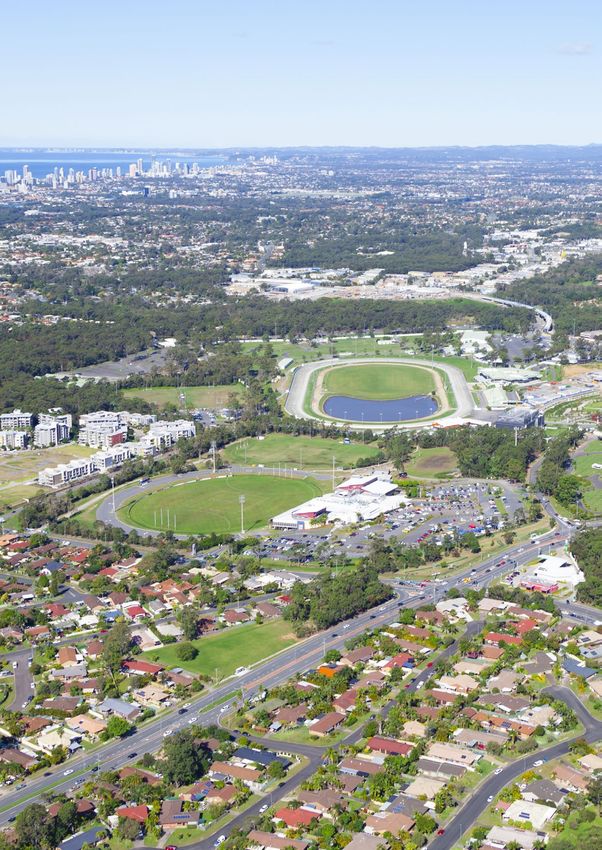
13‘SILICON SUNSHINE’ The Gold Coast Health and Knowledge Precinct is well-
connected to other knowledge hubs in Brisbane and the Gold
Queensland is home to the Gold Coast Health and Knowledge
Coast, benefiting from recent infrastructure developments in
Precinct, which reflects the emergence of a new knowledge
the Gold Coast’s light rail, creating a ‘knowledge corridor’ in
cluster for the state – a cluster for which this report has coined
South East Queensland.80
the term ‘Silicon Sunshine’. It is a 10 to 15-year project that will
result in a 200-hectare hub for high-tech development and This concentration of experts and world-leading research
research collaboration in the health and biomedical sector. institutes is a crucial factor supporting the Precinct’s
The Precinct has already provided 9,200 jobs and is anticipated development. For example, Griffith University partnered with
to contribute 11,000 more.80 It is also expected to contribute the Gold Coast Health and Hospital Service in 2017 to use the
$1.4 billion to Queensland’s economy upon completion.81 This Griffith University Clinical Trial Unit to conduct trials with Gold
is one of the various biomedical-knowledge clusters that have Coast clinicians as lead investigators.83 More than 100 trials
emerged across South East Queensland, with others including have been undertaken or completed to date, rapidly building
the Herston Health Precinct, Health City Springfield Central and the Gold Coast Health and Knowledge Precinct’s clinical trial
the Sunshine Coast Health Precinct.10 capacity and reputation.84 The Precinct is already attracting
international firms too: for instance, Materialise – a world-
The Gold Coast Health and Knowledge Precinct is a highly
leading additive manufacturing company – plans to locate its
planned project, with a master plan designed by the
Australian headquarters within the Precinct to capitalise on the
Queensland Government80 and $2.4 million of the 2019 state
facilities and its existing partnerships with local universities
budget dedicated to its development.82 The Precinct capitalises
and hopsitials.85
on its proximity to Griffith University’s Gold Coast campus
and also encompasses the Gold Coast University Hospital,
Gold Coast Private Hospital, the Institute for Glycomics and
Griffith University’s Menzies Health Institute Queensland.80
Image of the Gold Coast, Queensland, Australia - the location of the ‘Silicon Sunshine’ knowledge cluster
14 New Smarts15
16 New Smarts
4 THE EMERGING
  KNOWLEDGE-INTENSIVE
  INDUSTRIES
This report identifies a set of emerging knowledge-intensive       Each emerging knowledge-intensive industry is supported
industries that could provide significant social, environmental    by the application and convergence of multiple enabling
and economic benefits for Queensland. These industries fall        technologies. Below is a high-level summary of enabling
at the intersection of multiple emerging supply and demand         technologies that fall at the intersection of other social,
trends and drivers, which can cover changes in local, national     environmental, political and scientific trends, supporting
and global markets, new technologies and innovations, and          the growth of Queensland’s emerging knowledge-intensive
competitive advantages in science and research expertise.          industries. The identification of these industries and the
Here a change in supply presents opportunities for firms to        trends that underpin them were informed by desktop research
offer new products or services or provide existing products        and stakeholder consultations across government, industry
and services more efficiently and at lower cost. Conversely,       and academia (see Appendix A for further methodology
a change in demand can create new markets or customer              details). Each emerging knowledge-intensive industry (and
preferences and can drive firm activity in response to             its broader industry structure) is quantified in terms of the
this demand.                                                       number of employees and firms (see Appendix B for modelling
                                                                   methodology details). Here, firm growth is taken as a lead
This report outlines eight emerging knowledge-intensive
                                                                   indicator of industry emergence, with employment growth
industries for Queensland. But these industries and their
                                                                   occurring at later phases of formation.
underlying firms will not evolve in isolation; rather they
will likely co-evolve together in an emerging ecosystem of
knowledge-intensive industries in Queensland. In some cases,
the downstream activities associated with an existing or
emerging industry (e.g. the development of new technology
products or materials) could support upstream activities in the
supply chain of another industry. Emerging digital technologies
and knowledge generated across scientific domains can have
broad applications too, with the potential to support growth in
multiple industry sectors (see Table 2).

                                                             Sustainable
                                                               energy

                             Circular                                                  Cyber-physical
                           commodities                                                    security

                                                                                                   Smart mining,
                       Advanced                                                                   exploration and
                      agriculture                                                                   extraction

                       Next generation                                                      Personalised and
                     aerospace and space                                                      preventative
                         technologies                                                          healthcare

                                                       Advanced materials and
                                                        precision engineering

                                                                                                                               17
You can also read