ACHIEVING WORLD-CLASS CANCER OUTCOMES - A STRATEGY FOR ENGLAND 2015-2020 - Report of the Independent Cancer Taskforce - Cancer Research UK
←
→
Page content transcription
If your browser does not render page correctly, please read the page content below
ACHIEVING WORLD-CLASS
  CANCER OUTCOMES
   A STRATEGY FOR ENGLAND
           2015-2020

    Report of the Independent Cancer Taskforce
1 ACHIEVING WORLD-CLASS CANCER OUTCOMES A STRATEGY FOR ENGLAND 2015-2020
2

CONTENTS
EXECUTIVE SUMMARY                                                         4

1.   THE CURRENT LANDSCAPE OF CANCER IN ENGLAND                           7

2.   AMBITIONS AND PERFORMANCE METRICS                                   12
     2.1   CANCER INCIDENCE                                              12
     2.2   CANCER SURVIVAL                                               12
     2.3   PATIENT EXPERIENCE AND QUALITY OF LIFE                        13
     2.4   UNDERPINNING METRICS                                          13

3.   PRINCIPLES                                                          16

4.   HOW SHOULD WE REDUCE THE GROWTH IN THE NUMBER OF CANCER CASES?      17
     4.1  LIFESTYLE AND AWARENESS                                        17
     4.2  SMOKING                                                        18
     4.3  OBESITY AND OVERWEIGHT                                         19
     4.4  ALCOHOL                                                        20
     4.5  UV RADIATION EXPOSURE                                          20
     4.6  HPV INFECTION                                                  21
     4.7  DRUGS TO PREVENT CANCER                                        21
     4.8  LIFESTYLE-BASED SECONDARY PREVENTION                           22
     4.9  OCCUPATIONAL EXPOSURES                                         22

5.   HOW SHOULD WE IMPROVE SURVIVAL?                                     23
     5.1  SCREENING                                                      23
     5.2  EARLY DIAGNOSIS                                                26
     5.3  TREATMENT                                                      34
     5.4  MOLECULAR DIAGNOSTICS                                          39
     5.5  ENHANCING TREATMENT SERVICE DELIVERY                           41
     5.6  SPOTLIGHT ON TARGET GROUPS                                     42
     5.7  EARLY ACCESS TO PALLIATIVE CARE AND AHP SERVICES               45
     5.8  RESEARCH AND INNOVATION                                        45

6.   HOW SHOULD WE IMPROVE EXPERIENCES OF CARE, TREATMENT AND SUPPORT?   48
     6.1  MEASURING PATIENT EXPERIENCE                                   48
     6.2  INCENTIVISING CONTINUOUS IMPROVEMENT IN PATIENT EXPERIENCE     50
     6.3  STAFF EXPERIENCE                                               50
     6.4  SHARED DECISION-MAKING                                         50
     6.5  DIGITAL COMMUNICATION                                          51
     6.6  WORKFORCE COMMUNICATION SKILLS                                 52
     6.7  ROLE OF CLINICAL NURSE SPECIALISTS                             52
     6.8  CANCER SUPPORT GROUPS                                          53
3        ACHIEVING WORLD-CLASS CANCER OUTCOMES A STRATEGY FOR ENGLAND 2015-2020

    7.   HOW SHOULD WE IMPROVE THE QUALITY OF LIFE OF PATIENTS AFTER TREATMENT
         AND AT THE END OF LIFE?                                                  54
         7.1   LIVING WITH AND BEYOND CANCER                                      54
         7.2   MEASURING QUALITY OF LIFE                                          55
         7.3   COMMISSIONING SERVICES FOR PEOPLE LIVING WITH AND BEYOND CANCER    56
         7.4   FOLLOW-UP PATHWAYS                                                 57
         7.5   CANCER REHABILITATION                                              58
         7.6   DEPRESSION                                                         58
         7.7   PROVISION OF CARE IN THE COMMUNITY                                 59
         7.8   SUPPORTING PEOPLE WITH CANCER TO RETURN TO WORK                    59
         7.9   END OF LIFE AND PALLIATIVE CARE                                    60

    8.   HOW SHOULD WE IMPROVE THE EFFICIENCY AND EFFECTIVENESS OF DELIVERY AND
         DRIVE IMPLEMENTATION?							                           		              62
         8.1       COMMISSIONING                                                  63
         8.2       LOCAL IMPROVEMENT ARCHITECTURE                                 65
         8.3       NATIONAL QUALITY STANDARDS                                     66
         8.4       QUALITY ASSESSMENT                                             67
         8.5       WORKFORCE                                                      68
         8.6       CANCER DATA AND INTELLIGENCE                                   72
         8.7       RESPONSIBILITY FOR IMPLEMENTING THE STRATEGY                   73
         8.8       NATIONAL ACCOUNTABILITY                                        74
         8.9       VALUE FOR MONEY                                                74
         8.10      BEYOND 2020                                                    74

    9.   HOW MUCH WILL IT COST?                                                   75
         9.1  COSTS DRIVEN BY GROWTH IN DEMAND, INFLATION AND NEW TECHNOLOGY      75
         9.2  SPECIFIC INITIATIVES IN THE STRATEGY – COSTS INCLUDED IN BASELINE   75
         9.3  SPECIFIC INITIATIVES IN THE STRATEGY – INCREMENTAL ANNUAL COSTS     76
         9.4  SPECIFIC INITIATIVES IN THE STRATEGY – INCREMENTAL CAPITAL COSTS    77
         9.5  COST SAVINGS – CONTRIBUTION TO THE FUNDING AND EFFICIENCY GAP       77

    ANNEX A: METHODOLOGY AND ACKNOWLEDGEMENTS                                     79

    ANNEX B: GLOSSARY AND ABBREVIATIONS                                           81

    ANNEX C: REFERENCES                                                           87
4

EXECUTIVE SUMMARY
Over the next five years, we can improve           Over the last ten years, we have been able
radically the outcomes that the NHS delivers       to fill critical gaps in our knowledge about
for people affected by cancer. This report         cancer. We have begun to understand its
proposes a strategy for achieving this.            intricacies better as well as the short and
                                                   long term impacts it can have on patients.
It includes a series of initiatives across the     This has enhanced our ability to address
patient pathway. These emphasise the               these impacts and deliver improved
importance of earlier diagnosis and of living      outcomes for patients, their carers and their
with and beyond cancer in delivering               families, as well as limit the burden that
outcomes that matter to patients. The report       cancer places on society.
recognises that no two patients are the
same, either in their cancer or their health       However, the number of people diagnosed
and care needs. At its heart, it sets out a        and living with cancer each year will
vision for what cancer patients should             continue to grow rapidly, even with major
expect from the health service: effective          improvements in prevention. The primary
prevention (so that people do not get              reasons for this are our ageing population
cancer at all if possible); prompt and             and our success in increasing survival. This
accurate diagnosis; informed choice and            will place significant additional demand on
convenient care; access to the best effective      health and social care services. Cancer
treatments with minimal side effects; always       survival in England has improved
knowing what is going on and why; holistic         significantly over the last 15 years. More than
support; and the best possible quality of life,    half of people receiving a cancer diagnosis
including at the end of life. It is crucial that   will now live ten years or more. But our
patients are treated as individuals, with          mortality rates are higher than they could
compassion, dignity and respect                    be. In addition, unacceptable variability
throughout. The strategy seeks also to             exists in access to and experience of care
harness the energy of patients and                 across different areas, sub-groups of the
communities and encompass their                    population and cancer types. There is much
responsibilities to the health service. This       we could do to improve patient experience
means taking personal ownership for                and long-term quality of life, and to make
preventing illness and managing health;            our care more patient-centred.
getting involved in the design and
optimisation of services; and providing            The Independent Cancer Taskforce has
knowledge as experts through experience.           consulted widely to determine how the NHS
                                                   can deliver a step-change in outcomes. It
For the NHS, there is the opportunity to           has identified where opportunities exist for
deliver the vision set out in the Five Year        improvement, and how resources can be
Forward View (FYFV). Because of the strong         used differently and in a more targeted way.
evidence base that exists, cancer is uniquely      Realising the potential will require a broad
placed to be an early exemplar. Success in         set of approaches, including more
delivering the aspirations of this strategy will   integrated pathways of care and increased
depend on devolved decision-making,                investment. It will need the active
agility, and new models of care, within a          involvement of a range of individuals and
framework of national standards and                organisations beyond the NHS. Many of
ambitions. In turn, this will be reliant on        these approaches will deliver benefits not
research and intelligent use of data to drive      just for cancer patients, but for people with a
continuous improvement, as well as a “test         range of other conditions. They will also
and learn” approach in areas where the             deliver financial savings in the medium to
evidence of what works is immature. It will        long term.
also be reliant on the culture and attitude of
health care professionals in embracing             This report encompasses a large number of
partnership working with patients, seeing          recommendations. However, we propose
them as equals in decisions about their            that the six strategic priorities over the next
treatment and care.                                five years should be:
5       ACHIEVING WORLD-CLASS CANCER OUTCOMES A STRATEGY FOR ENGLAND 2015-2020

    • Spearhead a radical upgrade in                                   follow-up care will be in place for the
      prevention and public health: The NHS                            common cancers. A national quality of
      should work with Government to drive                             life measure should be developed by 2017
      improvements in public health, including                         to ensure that we monitor and learn
      a new tobacco control strategy within the                        lessons to support people better in living
      next 12 months, and a national action                            well after treatment has ended. We also
      plan on obesity. We should aim to reduce                         recommend that CCGs should
      adult smoking prevalence to less than                            commission appropriate End of Life care,
      13% by 2020 and less than 5% by 2035;                            in accordance with the NICE quality
                                                                       standard, and taking into account the
    • Drive a national ambition to achieve                             independent Choice Review and
      earlier diagnosis: This will require a shift                     forthcoming Ambitions;
      towards faster and less restrictive
      investigative testing, quickly responding to                  • Make the necessary investments
      patients who present with symptoms, by                          required to deliver a modern high-
      ruling out cancer or other serious disease.                     quality service, including:
      We recommend setting an ambition that
      by 2020, 95% of patients referred for testing                    o Implementing a rolling plan to replace
      by a GP are definitively diagnosed with                            linear accelerators (linacs) as they
      cancer, or cancer is excluded, and the                             reach 10-year life and to upgrade
      result communicated to the patient, within                         existing linacs when they reach 5-6
      four weeks. Delivering this will require a                         years;
      significant increase in diagnostic                               o Working to define and implement a
      capacity, giving GPs direct access to key                          sustainable solution for access to new
      investigative tests, and the testing of new                        cancer treatments, building from the
                                                                         Cancer Drugs Fund;
      models which could reduce the burden
                                                                       o Rolling out a molecular diagnostics
      and expectation on GPs;                                            service which is nationally-
                                                                         commissioned and regionally
    • Establish patient experience as being                              delivered, enabling more personalised
      on a par with clinical effectiveness and                           prevention, screening and treatment;
      safety: We have the opportunity to                               o Implementing plans to address critical
      revolutionise the way we communicate                               workforce deficits and undertaking a
      with and the information we provide to                             strategic review of future workforce
      cancer patients, using digital                                     needs and skills mix for cancer. The
      technologies. From the point of cancer                             priority deficit areas to address should
      diagnosis onwards, we recommend                                    be radiology, radiography and
      giving all consenting patients online                              endoscopy for diagnosis; and clinical
                                                                         oncology, medical oncology and
      access to all test results and other
                                                                         clinical nurse specialists for treatment
      communications involving secondary or                              and care;
      tertiary care providers by 2020. We should                       o Supporting a broad portfolio of cancer
      also systematise patients having access                            research.
      to a Clinical Nurse Specialist (CNS) or
      other key worker to help coordinate their                     • Overhaul processes for commissioning,
      care. We should continue to drive                               accountability and provision. We
      improvement through meaningful patient                          recommend setting clearer expectations,
      experience metrics, including the annual                        by the end of 2015, for how cancer
      Cancer Patient Experience Survey, which                         services should be commissioned. For
      should be embedded in accountability                            example, most treatment would be
      mechanisms;                                                     commissioned at population sizes above
                                                                      CCG level. By 2016, we should establish
    • Transform our approach to support                               Cancer Alliances across the country,
      people living with and beyond cancer:                           bringing together key partners at a sub-
      We recommend accelerating the roll-out                          regional level, including commissioners,
      of stratified follow up pathways and the                        providers and patients. These Alliances
      “Recovery Package”. The aim should be                           should drive and support improvement
      that by 2020 every person with cancer will                      and integrate care pathways, using a
      have access to elements of the Recovery                         dashboard of key metrics to understand
      Package, and stratified pathways of
6

  variation and support service redesign.
  We should also pilot new models of care
  and commissioning. For example, the
  entire cancer pathway in at least one
  area should have a fully devolved budget
  over multiple years, based on achieving a
  pre-specified set of outcomes.

The National Audit Office has estimated
cancer services cost the NHS approximately
£6.7bn per annum in 2012/13. The Five Year
Forward View projections indicate that this
will grow by about 9% a year, implying a
total of £13bn by 2020/21. The
recommendations set out in this report will
cost an estimated £400m per annum, of
which approximately £300m per annum
may already be included within the FYFV
baseline projections. However, in the
medium term, implementation of these
recommendations should contribute
substantially in excess of £400m per annum
to the projected £22bn funding gap.

If the NHS is successful in implementing the
initiatives and ambitions outlined in this
strategy, we expect that the most significant
benefits will be:

• An additional 30,000 patients per year
  surviving cancer for ten years or more by
  2020, of which almost 11,000 will be
  through earlier diagnosis;
• A closing of the gap in survival rates
  between England and the best countries
  in Europe and elsewhere;
• Better integration of health and social
  care such that all aspects of patients’ care
  are addressed, particularly at key
  transition points;
• Cancer patients feeling better informed,
  and more involved and empowered in
  decisions around their care;
• A radical improvement in experience and
  quality of life for the majority of patients,
  including at the end of life;
• A reduction of the growth in the number of
  people being diagnosed with cancer;
• A reduction in the variability of access to
  optimal diagnosis and treatment and the
  resulting inequalities in outcomes;
• Significant savings which can be re-
  invested to cope with increases in
  demand and to achieve further
  improvements in outcomes.
7               ACHIEVING WORLD-CLASS CANCER OUTCOMES A STRATEGY FOR ENGLAND 2015-2020

    1. THE CURRENT LANDSCAPE OF
    CANCER IN ENGLAND
    Every two minutes someone in England will                                  are increasing our age-standardised risk.
    be told they have cancer. Half of people                                   These changes place increasing demands
    born since 1960 will be diagnosed with                                     on the health system, alongside demands
    cancer in their lifetime1 (see Figure 1), with                             resulting from the changing nature of other
    that proportion continuing to rise. The good                               conditions. As noted in the FYFV, long-term
    news is that cancer survival is at its highest                             health conditions – rather than illnesses
    ever2, with significant improvements made                                  amenable to a one-off cure – now consume
    over the last 15 years. More than half of                                  70% of the health service budget.
    people receiving a cancer diagnosis will
    now live ten years or morei2. This progress
    has been driven by improvements in our                                     New cancer patients diagnosed
    knowledge of how to treat and control                                      400,000
                                                                                                                                     s
                                                                                                                                case
    cancer, combined with the commitment of                                                                               new
    NHS staff to deliver transformative care.                                                                   o je cted
                                                                               300,000                        Pr
                                                                                                 ses
                                                                                           New ca
          Lifetime risk of cancer
         55%                                                                   200,000

                                                                               100,000
         50%

                                                                                    0
         45%                                                                             2000          2010          2020                2030
                                                                                         Year of diagnosis

         40%                                                                              Figure 2: Incidence projection4

                                                                               Cancer is the biggest cause of death from
         35%                                                                   illness or disease in every age group, from
                                                                               the very youngest children through to old
                 1930             1940             1950            1960        age, with mortality significantly higher in
                 Year of birth
                                                                               men than in women. Death rates in England
                 Figure 1: Lifetime risk of cancer1                            have fallen by more than a fifth over the last
                                                                               30 years and by 10 per cent over the last
    A total of 280,000 individuals are now                                     decade5. They are expected to continue to
    diagnosed with cancer in a year, a number                                  fall, with a drop of around 17% by 20306 (see
    which has been growing by around 2% per                                    Figure 3). But 130,000 people still die from
    annum3 (see Figure 2). Around half of these                                cancer each year – a number that has
    diagnoses will be of the most common                                       remained relatively constant as incidence
    cancers – breast, lung, prostate, and                                      has increased. There also remain groups of
    colorectal – and the other half will be of rare                            patients for whom outcomes and quality of
    or less common types. Incidence is                                         life are particularly poor. Survival has
    expected to reach over 300,000 diagnoses in                                improved significantly in some types of
    2020, and more than 360,000 in 20304. The                                  cancer, notably malignant melanoma,
    rise is due partly to the ageing and growth of                             breast, testicular and prostate cancers.
    the population, a result of the overall success                            However, in lung, pancreas and
    of the healthcare system, such that people                                 oesophageal cancers and most brain
    are less likely to die early from other                                    tumours, survival has remained stubbornly
    conditions, such as cardiovascular disease.                                low to date.
    But the rise in cancer diagnoses is also in
    part driven by shifts in our lifestyles, which

    i
        Age-standardised ten-year survival from all cancers is now above 50%
8
Fig 4 - Deprivation.pdf 1 16/07/2015 10:14
Actual and Projected Number of Deaths, UK Avoidable
Cancer of
300 Lung unknown
Larynx
650
primary
M
Liver
ale
250 1,600 650
Rate per 100,000
Per Stomach Others
so
ns
200
Fem
ale 1,400
Oesophagus
150
1,200
Bowel
0
770
1970 1980 1990 2000 2010 2020 2030
Bladder
Year 11,700 730
Figure 3: Cancer mortality projections –
actual and projected number of deaths,
persons, UK6
Bladder
Cancer of
We see significant variation in survival Lung unknown 520
primary
outcomes for patients across England. For Others
example, one year survival in some CCGs is 1,700
more than 10% higher than in others7. This Oesophagus
variability cannot be explained solely by
correlation with deprivation levels. It can be 1,100
quantified across a number of indicators. For Stomach
example, there is around a two-fold
1,000
difference in the proportion of cancers
Bowel
diagnosed at an early stage8.
860
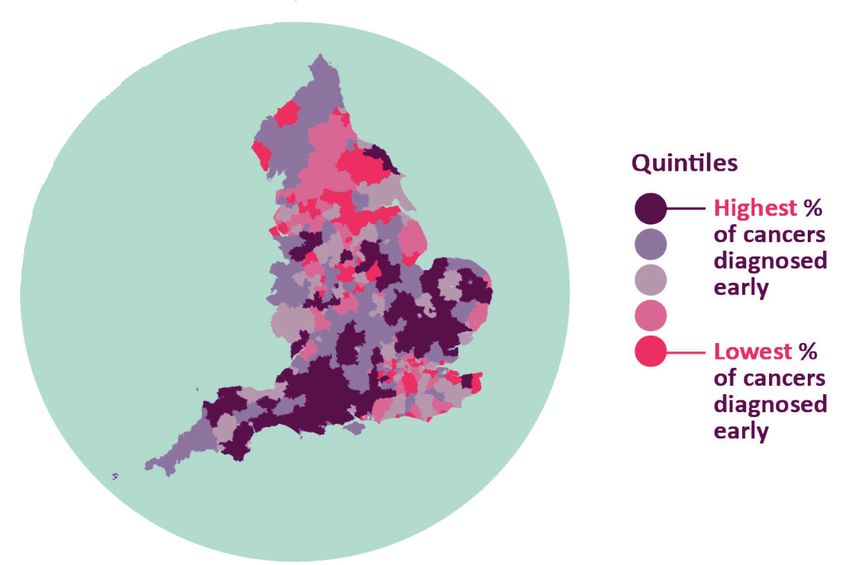
Health inequalities across England mean 9,900 Liver
600
there is potentially avoidable variation in
survival outcomes9 (see Figure 4). There
would be around 15,300 fewer cases and Figure 4: Yearly excess cancer cases and
19,200 fewer deaths per year across all deaths attributed to deprivation9
cancers combined9 if socio-economically
deprived groups had the same incidence
rates as the least deprived . More than half People in the UK with a cancer diagnosis
of the inequity in overall life expectancy
between social classes is linked to higher
smoking rates among poorer people.
2 3.4
The combination of improvements in survival million million
and detection, and a growing and ageing (projected)
population has resulted in an estimated 2
million people living in England who have
had a cancer diagnosis. This represents an
2010 2015 2020 2025 2030
increase of 0.3 million in the last five years10
and the number is projected to rise to 3.4
million in 203010 (see Figure 5). Of people Figure 5: Projections of cancer prevalence in
living with cancer, prostate is the most England, 2010 – 203010
prevalent type in men and breast in women.
Patient experience of hospital treatment has
been measured systematically for the last
four years and been positive overall.
However, this masks considerable variability,
with older and younger patients, those from
BME groups, those with less common9 ACHIEVING WORLD-CLASS CANCER OUTCOMES A STRATEGY FOR ENGLAND 2015-2020
cancers and those in some parts of the
country such as London all reporting lower With no other
levels of satisfaction11. Furthermore, patients long-term
across the country report that poor conditions (LTCs)
communication is the aspect of care most in
need of improvement, both in terms of the 30%
information they are given about their With 1 other LTC
diagnosis and treatment options, and in the
level of compassion and empathy they
22%
receive.
With 2 other LTCs
Historically, there has been less focus on the
18%
care received by patients after their initial
treatment. We know that patients who have With 3+ other LTCs
been diagnosed with cancer have a greater
risk of being diagnosed with cancer again in
the future. Many of the treatments we use
29%
can have long-term physical and mental
health consequences, which result in a high
proportion of individuals requiring Figure 6: Proportion of people with cancer in
subsequent health and social care support, the UK living with other long-term conditions12
and there are also practical impacts for
patients such as loss of income. Our lack of Many patients have inadequate care
attention to these issues may result in poorer support or may be carers themselves.
quality of life for patients and increased Therefore, it is imperative to take a holistic
pressure on their carers, as well as inefficient and individual perspective in considering
use of scarce resources. the after-treatment care and support that
patients need. Not doing so can have
Many patients treated for a primary cancer multiple adverse consequences, not least
will also develop secondary or metastatic exacerbating the “bed-blocking” problem
cancer, which can often be incurable. which bedevils NHS secondary care services.
Nevertheless, these patients may live for
many years with the disease, and they For too many people, cancer remains a
should be given the treatment and support disease from which they will die. Evidence
they need to live for as long and as well as shows that many of these people are not
possible, managing their cancer effectively experiencing the care they would like at the
as a chronic condition. end of their lives. Around three in four people
The experience and quality of life that with cancer would prefer to die at home with
patients have through and beyond the right support and with their friends and
diagnosis and treatment is equally as family around them, rather than in a hospital
important as clinical effectiveness and or hospice13. However, less than a third are
safety. Because the majority of cancer able to exercise that choice at present. We
patients are over the age of 65, it is also the also know that just one in five people with
case that many have multiple morbidities. It cancer who die at home have complete
is estimated that 70% of cancer patients pain relief all the time in the last three
have at least one other long-term condition months of life, compared with just under two-
that needs managing and over a quarter thirds of those with cancer who die in a
have at least three other such conditions12 hospice14.
(see Figure 6).
Despite international surveys15 ranking the
NHS highly on the basis of overall
performance in health and efficiency, this is
not true of cancer outcomes, in which we
lag considerably behind countries of similar
wealth. Some aspects of our delivery – such
as screening and vaccine uptake, and
smoking cessation services – are admired
across the world, but this is not reflected in10
our survival rates. We have amongst the effective treatments. Neither do we have the
lowest levels of cancer incidence of rich optimal capacity and configuration of
countries, but amongst the highest levels of resources to support patients beyond their
mortality16. This situation has persisted since initial treatment.
researchers began collating these data
systematically in the 1990s. There is now Lung cancer
5-year survival changes, 1995-1999 to 2005-2007
strong evidence that late diagnosis and sub-
optimal access to treatment – particularly for 0% 5% 10% 15% 20%
patients with more advanced disease - are Canada
the key drivers for these poorer clinical Australia
outcomes.17-21
Sweden
The most up-to-date published international Norway
comparisonsii show that relative survival
during 1995-2007 improved for breast, Denmark
colorectal, lung and ovarian cancer patients UK* cancer
Lung cancer 22 Breast
in all jurisdictions
5-year . However,
survival changes, 1995-1999the gap in
to 2005-2007 5-year survival changes, 1995-1999 to 2005-2007
survival between
Lung cancer the highest performing Breast cancer
0% 5% 10% 15% 20% 70% 75% 80% 85% 90%
countries
5-year (Australia,
survival changes,Canada
1995-1999and Sweden)
to 2005-2007 5-year survival changes, 1995-1999 to 2005-2007
Canada Sweden
and the lowest (England, Northern Ireland, Bowel cancer
Australia Australia
0% 5% 10% 15% 20% 70% 75% 80% 85% 90%
Wales and Denmark) remains largely
Canada 5-year survival changes, 1995-1999 to 2005-2007
Sweden
unchanged,
Sweden except for breast cancer, where Canada 45% 50% 55% 60% 65%
Australia
the UK is narrowing the gap22 (see Figure 7). Australia
Australia
MoreNorway
recently, the survival gap has also Norway
Sweden Canada
started to close in stomach and rectal Canada
Denmark Denmark
Norwayaccording to as yet unpublished
cancers, Norway
UK* Sweden
UK*
data. But it remains significant in lung and
Denmark Denmark
colon cancers. Here there is also evidence
Lung cancer
Norway
5-year survival changes, 1995-1999 to 2005-2007
of aUK*
worse stage distribution at diagnosis UK*
Denmark 0% 5% 10% 15% 20%
than comparator countries, i.e. cancers are
Bowel
more cancer on average at the time of
advanced Ovarian
Canada
UK* cancer
5-year survival changes, 1995-1999 to 2005-2007 5-year survival changes, 1995-1999 to 2005-2007
diagnosis. Australia
Bowel cancer
45% 50% 55% 60% 65% Ovarian cancer
25% 30% 35% 40% 45%
5-year survival changes, 1995-1999 to 2005-2007 *5-year
UK includes
SwedensurvivalEngland,
changes,Northern Ireland
1995-1999 and Wales
to 2005-2007
Australia
Treatment differences play a more Canada
signifi cant role45%than anticipated
Canada
50% 55%
at the
60%
time65% Norway
Norway
25% 30% 35% 40% 45%
Australia Canada
these international comparisons were Denmark
Sweden Australia
Canadawith survival within stage being
initiated, Norway
poorerNorway
in England too (particularly for more UK*
UK*
Sweden Australia
advanced
Denmarkbreast and ovarian cancers). Denmark
AcrossNorway
Europe, cancer survival for older UK*
peopleUK* (75 and above) tails off markedly
Denmark Denmark
Bowel cancer
compared with survival for younger age
UK* (e.g. 55-64) 23. In 2012, one year 5-year survival changes, 1995-1999 to 2005-2007
groups
* UK includes England, Northern Ireland and Wales
survival was 57% and 77% in these groups 45% 50% 55% 60% 65%
respectively 23
. Australia
* UK includes England, Northern Ireland and Wales
Canada
Over the last several years, the growth in
demand for cancer services has not been Sweden
met by an associated growth in capacity. Norway
There are significant workforce deficits,
Denmark
particularly in diagnostic services, oncology,
and in specialist nursing support. These UK*
shortfalls result in severe bottlenecks in the
diagnostic process, suboptimal care in * UK includes England, Northern Ireland and Wales
certain parts of the country, and an inability
to deliver newer, evidence-based and cost- Figure 7: Age standardised five-year survival
trends, 1995 – 2007, by cancer and country22
ii
Comparisons are with countries that also have universal health coverage and comprehensive cancer registration11 ACHIEVING WORLD-CLASS CANCER OUTCOMES A STRATEGY FOR ENGLAND 2015-2020
Finally, commissioning of cancer services
has become highly fragmented and, partly
as a result, insufficiently accountable. CCGs
consistently report that they have neither the
expertise nor the time adequately to
commission complex cancer services, many
of which are changing rapidly as research
drives progress. Until recently, CCGs had little
role in the commissioning of diagnostic
services, and some still do not. Pathways are
neither optimised for patients nor for use of
resources. Furthermore, there is a lack of
hard accountability when providers or
commissioners fail to meet national targets,
as demonstrated by hospitals missing the 62-
day wait standard for over a year24.
In conclusion, there may be much to
celebrate since the first NHS Cancer Plan was
published in 2000, but there remains much
more to do.12
2. AMBITIONS AND PERFORMANCE
METRICS
This strategy focuses on the outcomes which some less common cancers or those with the
matter most to patients and society. This is poorest outlook, will offer greater scope for
not only about improving survival. We also gains than others. This strategy focuses on
need to ensure that we reduce the incidence three ambitions related to survival:
of cancer and improve patients’ experience
and quality of life. • Increase in 5 and 10-year survival.
Surviving for ten years following a cancer
2.1 CANCER INCIDENCE diagnosis is far more meaningful for
patients than one or five years. Many
Much could be done to slow the rise in the experts believe it should be possible that,
numbers of patients being diagnosed with by 2034, 3 in 4 patients in England
cancer each year. Increasing incidence diagnosed with cancer will survive at least
places a considerable burden on the NHS. 10 years following their diagnosis,
But it also places a huge burden on patients compared with 50% now, benefitting
and their families, as they undergo intensive around 150,000 patients per year. By 2020,
and sometimes debilitating treatment. We 57% of patients should be surviving ten
recommend focusing attention on two key years or more.
ambitions in this area:
• Increase in one-year survival, with a
• We will start to see a discernible fall in reduction in CCG variation. Surviving
age-standardised incidence and a one year after diagnosis is clearly a pre-
reduction in the number of cases linked requisite for long term survival and data is
to deprivation. As noted above, overall available much sooner, which enables
incidence has been rising, and we have commissioners and providers to track
also seen an increase (5%) in age- progress. Furthermore, one-year survival
standardised incidence rates over the last trends, alongside staging data, will
ten years. Prevention efforts take time to specifically enable us to assess progress
feed through in to incidence, beyond a on earlier diagnosis. We propose that
five-year timeframe, but setting an one-year survival should reach 75% by
ambition that is measured and reported 2020 for all cancers combined, compared
on will keep the focus on these efforts, so with 69% now. Reducing variability will be
that we see the benefits in the longer term. a key driver of overall improvement at a
population level. Whilst it is implausible
• By 2020, adult smoking rates will have that variability can be eliminated entirely,
fallen much further. Smoking remains by raising survival across CCGs towards the
far the largest modifiable risk factor for highest levels being delivered today
cancer, responsible for around 60,000 should be possible.
new cases per year in England25.This
strategy sets a specific ambition that adult • Reduction in survival deficit for older
smoking rates should fall to 13% by 2020, people. Recent international comparison
and that rates in routine and manual data suggests that the deficit in survival is
workers should fall to 21%. even greater for older people than it is for
younger age groups for some types of
cancer. Moreover, if we are to narrow the
gap with other countries overall, we will
2.2 CANCER SURVIVAL also need to do so with older patients.
Achieving improvements in survival will
require a combination of earlier detection
and diagnosis, better treatment and access
to treatment, improved access to data and
intelligence and reductions in variability
around the country. Some cancer types, e.g.13 ACHIEVING WORLD-CLASS CANCER OUTCOMES A STRATEGY FOR ENGLAND 2015-2020
2.3 PATIENT EXPERIENCE AND 2.4 UNDERPINNING METRICS
QUALITY OF LIFE Many of the metrics proposed above are
The NHS needs to move to a more patient- only available after a considerable time lag.
centred service in line with the aspirations set Therefore it is essential that we also have a
out in the FYFV, with a change in the series of supporting metrics, which will
relationship between patients and enable commissioners and providers to
professionals. It is therefore appropriate to have more rapid feedback on the impact of
have ambitions that reflect this shift. In interventions and more timely intelligence
addition, we need to transform our on the likely trajectory against the ambitions
approach towards supporting people to live set out above. These metrics should also be
well outside hospital and to return to their a key focus for Cancer Alliances, as the
lives as far as possible after treatment has main vehicles for local service improvement
ended. To achieve this requires a significant (see section 8.2).
focus on measuring and improving people’s
quality of life. For some areas, we do not yet Recommendation 1: NHS England, working
have reliable measures, so these will need to with the other Arms Length Bodies, should
be developed over the coming years: develop a cancer dashboard of metrics at
the CCG and provider level, to be
• Continuous improvement in patient reported and reviewed regularly by
experience with a reduction in Cancer Alliances. The following metrics
variation. In the latest Cancer Patient should be included as a minimum:
Experience Survey (CPES), 89% of patients
said overall their care was excellent or CCG Dashboard:
very good11. It is quite likely that patient
expectations will increase in coming • Proportion of patients referred by a GP
years, so that maintaining or improving on with symptoms receiving a definitive
this level of satisfaction will require cancer diagnosis or cancer excluded
considerable effort. Some patient groups, within 2 and 4 weeks, with a target of
such as those with rare and less common 50% at 2 weeks and 95% at 4 weeks by
cancers, report less satisfactory 2020
experience. In addition, some areas of
the country score poorly on patient • Proportion of diagnoses through
satisfaction measures and we should emergency presentation
expect these areas to deliver significant
improvement in the coming years. CPES • Proportion of cancers diagnosed at
should continue to evolve and should be stage 1 or 2, with a target of 62% by
repeated every year, with patient 2020 for cancers staged, and an
satisfaction measured for every hospital increase in the proportion of cancers
and CCG. staged
• Continuous improvement in long-term • Screening uptake, with an ambition of
quality of life. We want people with 75% for FIT in the bowel screening
cancer to lead healthy, fulfilled and programme by 2020
productive lives, as far as is possible,
whether they have completed treatment • One-year survival
or are living with an advanced and
incurable form of the disease. To this end • Proportion of patients meeting cancer
the strategy proposes the development of waiting times targets: target of 96%
a national metric of quality of life, meeting 31 day target and 85% meeting
underpinned by a robust approach to 62 day target
measurement, which will incentivise the
provision of better aftercare interventions, • CPES data
as well as more informed choice at the
point of diagnosis. • Proportion of patients with patient-
agreed written after-treatment plan,
with a target of 95% by 202014 • Under-75 mortality • Over-75 indicator (to be developed) • Further patient experience and quality of life measures as they are developed, e.g. Patient Reported Outcome Measures (PROMs) • Proportion of people who die who had a personalised end of life care plan Provider Dashboard: • Proportion of patients meeting cancer waiting times targets: target of 96% meeting 31 day target and 85% meeting 62 day target • CPES data • Data from clinical audits • Further patient experience and quality of life measures as they are developed, e.g. PROMs • Proportion of cancer patients participating in research Figure 8 is an illustration of how the ‘cancer dashboard’ for a CCG might be presented, including many of the metrics above. Where data are available we would expect them to be broken down across different cancer types and equality groups on request. The dashboard would be generated by the National Cancer Intelligence Network in conjunction with NHS England. For people who die from cancer, we need to incentivise the system to ensure these individuals experience a “good” death, with their preferences taken in to account. A good deal of end of life care is provided outside the NHS and suitable metrics have been proposed in the Choice Review.
15   ACHIEVING WORLD-CLASS CANCER OUTCOMES A STRATEGY FOR ENGLAND 2015-2020

                                Figure 8: Example ‘dashboard’ of metrics

                                Figure 8: Example 'dashboard' of metrics
16
3. PRINCIPLES
Certain principles are central to the context quality standards and appropriate
and successful implementation of this population sizes.
strategy:
• Systems of external accountability:
• One-size fits no-one: No two patients are Many different organisations at local and
the same, either in their cancer or in their national level deliver services to prevent
needs. We must strive towards greater cancer and to treat and support cancer
stratification and personalisation of patients. Individual care pathways can
approaches. Critical to this will be systems span several of these organisations. A
and processes which capture the needs system of external accountability is
and circumstances of individual patients therefore necessary, both at local and
and their carers, and the recognition and national levels, to ensure cross-
acceptance by doctors and other health organisational issues are appropriately
care professionals of the patient as an considered and resolved.
equal partner in their care.
• Research and data as drivers of
• Co-design: It is clear that fragmentation continuous improvement: Substantial
of care is a reality for patients across opportunities exist to reduce variation and
many health and social care pathways. to drive progress through intelligence and
Putting the patient at the heart of the re- innovation. All parts of the health service
design of services for cancer (and other must embed a culture in which data and
long-term conditions) will require a will intelligence are seen as drivers of
and determination that must be realised. improvement and that research and
This principle should be embedded in controlled data access are viewed as a
every aspect of the cancer journey, to core responsibility.
ensure that services are responsive to
patients’ needs. • Agility: The pace of progress in all
aspects of cancer means that we need
• Pre- and post- treatment are as processes and systems that are agile and
important as treatment: This strategy adaptable. Agility will enable the rapid
places considerable emphasis on the spread of cost-effective innovations.
prevention and earlier diagnosis of Furthermore, this strategy takes a “test and
cancer, as well as on living with and learn” approach in many areas,
beyond cancer, and end-of-life care. recognising that we don’t know all the
answers to the many different challenges
• Individual responsibility and self- we face, and we need to try different
management: We need to facilitate and solutions and evaluate them carefully
empower people to take their share of before national roll-out.
responsibility for staying healthy and
where appropriate enable them to • Cancer as an exemplar for other
manage their health and care needs. conditions: Many aspects of cancer
services are relevant for other conditions.
• Devolved decision-making, within Equally, a large proportion of cancer
national standards and ambitions: patients have one or more other long-
Cancer services (and the NHS more term conditions. Cancer is uniquely
broadly) are too extensive for all decisions placed to drive forward the vision set out
to be made nationally. Local or regional in the FYFV. We should learn what works for
decision-making unlocks creativity and cancer, and ensure we apply lessons as
innovation, provides a vehicle for quickly as possible to other areas. Cancer
clinicians and patients to drive service care should also take opportunities to
development, and enables appropriate learn from other conditions.
consideration of local circumstances (e.g.
rural geographies). However, local
decision-making must be within a
national framework of agreed service17 ACHIEVING WORLD-CLASS CANCER OUTCOMES A STRATEGY FOR ENGLAND 2015-2020
4. HOW SHOULD WE REDUCE
THE GROWTH IN THE NUMBER OF
CANCER CASES?
supported in making appropriate lifestyle
Chapter Summary choices. This is important not only for cancer
but a variety of other potentially avoidable
• More than 4 in 10 cases of cancer are conditions such as cardiovascular disease,
caused by aspects of our lifestyles which diabetes and dementia.
we have the ability to change. Tobacco
remains the main risk factor, followed by The figures for England are stark. Despite
obesity being widely acknowledged as having the
best smoking cessation services in the world,
• We need to continue to raise awareness nearly one in five adults still smokes. A third
of the impact risk factors have on our of people drink too much alcohol. A third of
health, especially in selected populations, men and half of women don’t get enough
and support people to make changes exercise. Almost two thirds of adults are
overweight or obese. Our young people
• Efforts to tackle smoking rates should have the highest consumption of sugary soft
continue at pace, with the ultimate aim of drinks in Europe26.
reaching 5% in adults by 2035
• Vaccination and chemo-prevention will 4.1 LIFESTYLE AND AWARENESS
play an increasing role
An estimated 4 in 10 cases of cancer could
• With increasing numbers of people be prevented, largely through modifying
surviving their primary cancer, we need a aspects of our lifestyles which we have the
stronger focus on preventing secondary ability to change27. The main risk factors
cancers include tobacco, weight, diet, alcohol
consumption, UV exposure and lack of
sufficient physical activity (see Figure 9).
There is much more we could do to ensure These are supplemented by other exposures,
that people are engaging with health and such as air pollution, occupational risks,
community services early enough to shift infections (including Human Papilloma Virus
focus onto preventing rather than treating and viral hepatitis B and C) and radiation.
disease. The ability of our National Health
Service to deliver the care required now and Awareness needs to start early. The
in the future is entirely dependent on the progression of children through school
health of our nation. We will not be able to presents an opportunity to influence lifestyle
sustain comprehensive health and social behaviours, including through children
care coverage unless we take more being able to influence their families.
concerted action on prevention. Rising Information on healthy lifestyles could be
numbers of cancer cases that could be packaged with more tailored content
prevented should be seen as unacceptable. relating to common signs and symptoms of
It is within our control to prevent many cases cancer and other conditions. Early
of cancer and we should seize this awareness would also provide young
opportunity. This will require fundamentally people with the confidence to make best
resetting the social contract within society, use of primary care services in later life, for
such that individuals take more responsibility example in how to have constructive
for their own health. It will also require conversations about their health.
stronger leadership from Government,
healthcare providers, and local
organisations, so that individuals are18
and diseases. Increased risk of cancer can
Lifestyle factors be a powerful driver of change for many
individuals, but there are low levels of
KEEP awareness of the links between many risk
A factors and cancer.
HEALTHY BE SMOKE FREE
WEIGHT
Health and Wellbeing Boards (HWBs) can
EAT FRUIT
continue to play a valuable role as
& VEG facilitators to encourage local government,
local health services, communities and
DRINK
charities to work together to develop local
LESS strategies, taking a cross-disease approach,
ALCOHOL to address major social and environmental
T LESS
determinants of ill health. An important part
EA
SA
LT
T A HIGH
BE EAT LESS
EABRE DIET
FI of local strategies will be health promotion
initiatives to raise awareness and help
SU
T
NS R PROCESSED
MA
VE
& RED MEAT I
BE ACT
individuals make healthier choices around
risk factors including smoking, alcohol, diet
and physical activity. Partners should work
Other factors together to ensure that local approaches
are tailored to the local community, and
appropriately target specific groups in which
M IN I
certain cancer types are particularly
M
Y
N
TI
RT
E S M IS E A H
PENT O N
MINIMISE MINIMISE
RISKS AT
WORK
CERTAIN
INFECTIONS
BR
prominent (e.g. prostate cancer, triple-
negative breast cancer for BME groups).
D
such a
IF E A S T F E EE
s
ON
M I N ra
-ray
P O S SIB L
M
C
TI
IS E A
I
yx
R A DI
su
s
B&
HP
ch a do
s a s b e sto s
ar
na ss
H n d un nece
V,
tis
.P ti
ylo pa
He
Each time a person interacts with the health
r i, E B
V, HIV,
service is an opportunity to encourage a
Figure 9: Preventable cancer risk factors conversation about healthy lifestyles.
Making ‘every contact count’ is an essential
Subject to evaluation of pilots being culture shift that needs to be embraced by
undertaken by Teenage Cancer Trust and everyone in the NHS who has contact with
others, NHS England and Public Health the public and has the opportunity to have a
England should consider the evidence base conversation to improve health.
for rolling out a cancer education
programme to all secondary schools to raise
awareness of healthy lifestyles and cancer 4.2 SMOKING
symptoms.
Smoking rates have halved in Great Britain
The health of the nation is not solely the over the last 35 years, declining steadily
responsibility of NHS organisations; we need since the 1970s (see Figure 10). Current rates
to harness efforts across local government, for all adults in England are at 18.4%28
employers and the wider community to although rates vary by age. This remarkable
tackle prevention. Many local approaches change is principally down to governments
are already in place or are being adopting a comprehensive and consistent
developed. However, there is now a need for approach, both in supporting smokers to
greater urgency, with concerted action to quit and in discouraging and denormalising
focus on cancer. Local organisations are smoking in society as a whole. Indeed, we
best-placed to determine which have not yet seen the benefit of measures
combination of initiatives across education, introduced in the last Parliament, some of
housing, planning and healthcare would which are still to be implemented.
deliver the most impact, and which should
be led through workplace health and
wellbeing initiatives. A local approach also
enables occupational risk factors in specific
geographies to be taken into account. It is
important to note that most risk factors are
relevant to a number of different illnesses19 ACHIEVING WORLD-CLASS CANCER OUTCOMES A STRATEGY FOR ENGLAND 2015-2020
Cigarette smoking prevalence (%) It is imperative that we maintain a focus to
100% drive down smoking rates further and target
those groups with the worst outcomes to
reduce health inequalities. For hard to reach
80% groups, evidence suggests that smoking
cessation services and taxation are the
60% interventions which make the biggest
difference. High quality smoking cessation
services, coupled with Government action
40% male
s on marketing and taxation, mean that we
female should be optimistic that further declines are
s
20% possible in the years ahead. New
technologies such as e-cigarettes offer
additional means to help people quit. Public
0%
1974 1980 1990 2000 2010 Health England and Government should
Year carefully monitor the research programme
initiated by Cancer Research UK, in
Figure 10: Cigarette smoking prevalence conjunction with PHE, to understand better
(%), Great Britain29 the use and safety of e-cigarettes in
reducing tobacco consumption.
But smoking still kills. 18.4% of the population
equates to more than 8m adults; up to two- Adult smoking rates have been declining by
thirds of long term smokers will die as a result around 0.7% per year over the last 10 years29.
of their smoking if they do not quit30. Smoking If we maintain the current trajectory, we
remains the leading cause of preventable would therefore be at 15% by 2020. We
death and disease in England, responsible recommend being more ambitious than this.
for around one in six deaths of adults aged The Government’s existing tobacco control
35 and over in 201331. It remains the largest plan comes to an end in 2015. A recent
preventable cause of cancer, with an report by ASH sets out some of the steps we
estimated 19% of cancer cases and more should consider next36.
than a quarter of cancer deaths in the UK
linked to exposure to tobacco smoke25, 32. Recommendation 2: Government should
Around 60,000 cases per year could be work with Public Health England and NHS
prevented if tobacco smoke exposure was England to publish a new tobacco control
eliminated25. There is growing evidence that plan within the next 12 months. The
smoking not only impacts cancer risk but ambition should be to reduce adult
also response to treatment. There is also a smoking prevalence to less than 13% by
strong financial rationale to continue to 2020 and less than 5% by 2035, and
tackle smoking. The estimated total cost of reduce smoking among routine and
tobacco use to society in England is £13.8 manual workers to 21% by 2020. The plan
billion per year33, compared with revenue should include a full range of actions,
from tobacco in 2013/14 of £7.6 billion34. such as a tobacco industry levy, a tax
escalator, payment based incentives to
Smoking throws into sharp focus the ensure smoking cessation services are
challenge we face in England to tackle strengthened and a focus on groups
health inequalities. Smoking prevalence is where smoking rates remain high,
higher amongst people with lower incomes including social marketing campaigns
(23% of individuals in the lowest income where appropriate. It should highlight the
band, compared to just 11% amongst those importance of NHS action in primary and
who earn £40,000 or more29). In addition, secondary care, in particular among
smoking is relatively widespread amongst those with long-term conditions.
people with mental health problems; an
estimated 42% of tobacco in England is used
by people with mental health issues35. 4.3 OBESITY AND OVERWEIGHT
Smoking related inequalities also exist by
gender, sexual orientation, and level of Obesity represents a critical challenge to the
education. NHS, and its impact on the health of our
nation is growing in significance. England is20
amongst the worst performers on obesity in
Western Europe. The proportion of the Recommendation 3: Public Health
population that is overweight increased from England should work with the Government
58 per cent to 67 per cent in men and from and a wide range of other stakeholders to
49 per cent to 57 per cent in women between develop and deliver a national action
1993 and 201337 (see Figure 11). Sixteen per plan to address obesity, including a focus
cent of boys and 15% of girls aged 2 to 15 on sugar reduction, food marketing, fiscal
are obese37. The proportion of children who measures and local weight management
are obese doubles while they are at primary services. Within this there should be a
school. Less than one in ten are obese when strong focus on children. Implementation
they enter reception class, but by the time of the programme should be supported by
they reach year six, nearly one in five are PHE, aligned with the physical activity
obese. A programme of work should be strategy ‘Everybody active, every day’.
undertaken to evaluate the curriculum in
primary schools and how lifestyle factors
and behavioural changes are 4.4 ALCOHOL
communicated.
Alcohol consumption has more than
Overweight and obesity prevalence (%) doubled in the UK since the 1950s39, 40.
70%
Excessive alcohol consumption leads to
around 12,800 UK cases of cancer each year
s
le and is linked to several different types of
Ma
cancer41. As little as one standard drink a
ns day can increase the risk of a number of
so
60%
cancers. Consumption clearly has wide-
r
Pe
Fe males
reaching impacts beyond cancer, including
increasing the risk of other health conditions,
and to date much of the focus has been on
50% these wider societal issues. Awareness
amongst the public of the links between
alcohol and cancer specifically is low, with
only a third identifying it as a risk factor.
40% Therefore there is an opportunity for a
comprehensive alcohol strategy to
1995 2000 2005 2010 acknowledge the risk of cancer to help drive
Year
behaviour change. PHE has undertaken a
rapid evidence review of alcohol harm and
Figure 11: Obesity and overweight prevention and is writing a report to
prevalence (%), England Government which will outline possible
policy solutions.
These statistics presage significant problems
for the future in the form of cancer and other Recommendation 4: The PHE report should
illnesses. An estimated 5% of cancer cases in form the basis for the development of a
the UK each year are linked to excess national strategy to address alcohol
bodyweight - 17,000 cases a year across consumption, possibly including measures
bowel, womb, oesophageal, pancreatic, to tackle price, marketing, availability,
kidney, liver, gallbladder and post- information on products and social
menopausal breast cancers38 – as well as marketing campaigns to raise awareness.
being linked to other conditions such as
diabetes. Obesity can also have an impact
on survival once a person has developed
cancer because certain ‘life-saving’
4.5 UV RADIATION EXPOSURE
treatments, including surgery, may not be UV exposure is linked to one frequently lethal
available to patients. Unlike tobacco, there cancer, malignant melanoma, which is
has to date not been coordinated and increasing in incidence. It is now the fifth
concerted action taken to address obesity, most common cancer type in England,
and it is essential that this now becomes a responsible for 1,900 deaths per year42.
priority. Continued action on UV exposure therefore21 ACHIEVING WORLD-CLASS CANCER OUTCOMES A STRATEGY FOR ENGLAND 2015-2020
remains important to prevent more cases of Recommendation 5: By December 2016,
this cancer. There are a number of simple PHE should determine the level at which
actions that individuals can take to reduce HPV vaccination for boys would be cost-
their exposure to UV radiation, but where effective. JCVI should make a final
certain populations continue to need decision by 2017. Assuming a cost-
support is in making healthy choices related effective price can be achieved, national
to sunbeds. In those areas where sunbed use roll-out should take place by 2020.
remains high, local strategies can helpfully
include measures to limit over-exposure to
UV radiation. Health and Wellbeing Boards 4.7 DRUGS TO PREVENT CANCER
provide a forum to bring together local
partners to ensure, through the joint Strategic The use of drugs to prevent cancer
Needs Assessment (JSNA) process, that (including secondary cancers) is
strategies are tailored to the needs of the increasingly likely to play a key role,
local community and are appropriately particularly to prevent breast cancers in
targeted to high-risk groups. specific groups of women. Tamoxifen is
indicated for five years for pre-menopausal
women at high risk and either tamoxifen or
4.6 HPV INFECTION aromatase inhibitors, e.g. anastrazole, for
post-menopausal women at high risk, e.g.
HPV is one of the most common sexually those who have a strong family historyiii44.
transmitted infections. Persistent infection However, there is currently considerable
with high-risk HPV types can lead to the variability in uptake and adherence of these
development of cervical, other rare ano- medicines, given the long period over which
genital cancers and some cancers of the they are taken. A more systematic approach
head and neck. to making these drugs available could
significantly improve outcomes.
The HPV vaccine is currently offered routinely
to females aged 12 to 13 years and the Recommendation 6: NHS England should
programme’s primary aim is to reduce the work through CCGs to ensure that GPs are
incidence of cervical cancer in women. The appropriately prescribing chemo-
HPV vaccination programme in England has preventive agents to reduce the risk of
been one of the most successful in the world, invasive breast cancer where their use is
with more than 86% of year 8 girls receiving established through NICE guidelines.
all three doses43 and early indications of a
reduction in HPV 16/18 infections43. Since Approximately 5% of colorectal cancers
September 2014, the programme has have a genetic hereditary basis45. Some
switched to a two-dose schedule. The patients with these cancers have hereditary
success of this programme needs to be non-polyposis colorectal cancer (HNPCC) or
sustained and built upon. Men who have sex Lynch Syndrome. A randomised controlled
with men are a group at high risk for HPV trial has shown that the long term use of
infection, and will benefit much less from the daily aspirin by individuals known to harbour
herd protection effects of the adolescent these genetic mutations can substantially
female programme. Expanding the reduce the incidence of subsequent
vaccination programme to include this colorectal cancer46.
group of men is under consideration
currently by the Joint Committee of Recommendation 7: NHS England should
Vaccination and Immunisation (JCVI). commission NICE to develop updated
Assessment of the extension of HPV guidelines for the use of drugs for the
vaccination to adolescent boys is ongoing prevention of breast and colorectal
and as the benefits of HPV vaccination cancers. Updated guidelines should
become better known, there is good reason consider the use of aromatase inhibitors
to consider the effectiveness and cost- for untreated post-menopausal women at
effectiveness of gender-neutral vaccination. high risk and the use of aspirin for
individuals with HNPCC. Once these
guidelines are published, CCGs should
Use of tamoxifen or an aromatase inhibitor for five years in post-menopausal women at high risk has been shown to reduce the risk of invasive breast cancer by
iii
50% or more, with the benefit extending to 20 years or moreYou can also read