Green Space in Wellington's Central City: New Zealand ...
←
→
Page content transcription
If your browser does not render page correctly, please read the page content below
Green Space in Wellington’s Central City:
Current provision, and design for future wellbeing

Report for Wellington City Council
October 2019

                                       Authors:
 Paul Blaschke, Ralph Chapman, Elaine Gyde, Philippa Howden-Chapman, Jenny Ombler,
                   Maibritt Pedersen Zari, Meredith Perry, Ed Randal.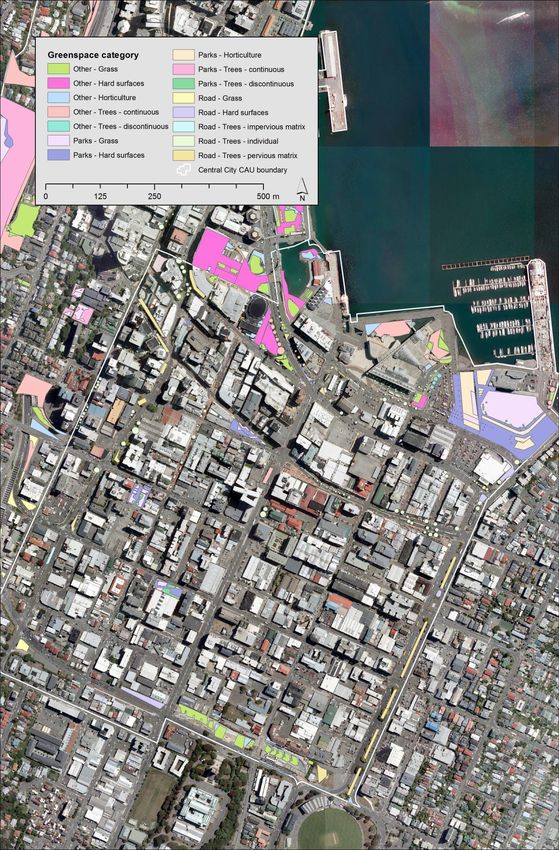
Key points summary
•   Green space is needed in central city areas to provide health and wellbeing benefits for current
    and future residents, commuters and visitors, and increased amenity, liveability and economic
    benefits. Green spaces also provide ecosystem and resilience benefits that will help mitigate and
    adapt the city to climate change and other environmental shocks.

•   We report here on a detailed study of the provision of public green space in central Wellington
    City in relation to current and projected future population levels.

•   The study focused on the three Census Area Units (CAU) of central Wellington City. These CAUs
    contain a total of 41.19 ha of public green space. More than half of the central city’s public green
    space is located not in City parks and gardens but in road reserves or in other non-council areas,
    and some is of relatively low quality and poorly accessible.

•   The amount of green space per capita in each CAU is highest at 41m2 in Thorndon-Tinakori Road
    CAU, 23m2 in Lambton CAU, and lowest at 6m2 in Willis St-Cambridge Terrace CAU. There is a very
    significant lack of greenspace within 300m of the population-weighted centre of the Willis St–
    Cambridge Terrace CAU.

•   Green space amount per capita in central Wellington City declines substantially - by half on
    average - when projected population growth to 2043 for the three CAUs is considered.

•   Increasing the total amount, accessibility and quality of green space in the central city will need
    to be achieved in order to accommodate future population growth and fulfil a vision of “central
    city green spaces that enhance community and ecosystem health”.

•   A central city green space policy that achieves the maximum possible protection and optimal use
    of current green space, augmented by purchase of additional land in population growth areas, is
    most likely to meet the needs of residents and visitors, now and in the future.

                         Figure 1. Glover Park, Wellington (Wellington City Council)

Green Space in Wellington’s Central City                    October 2019                         Page 1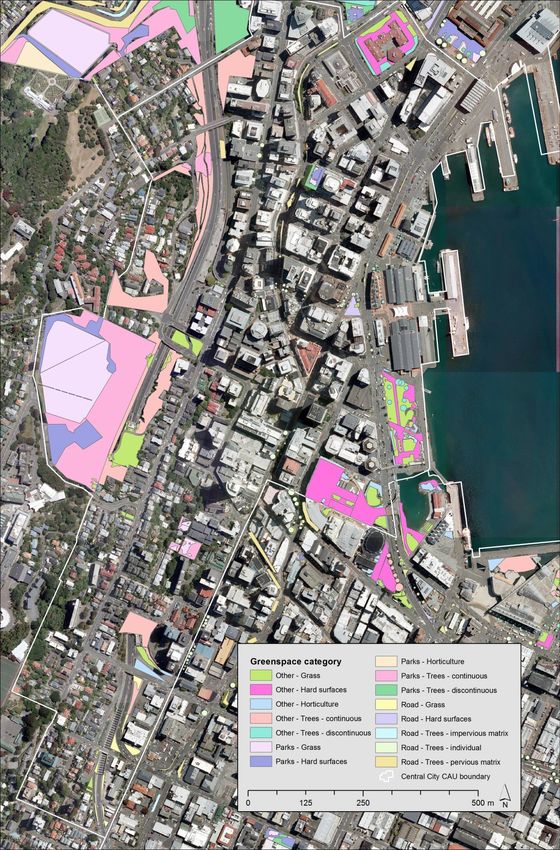
Contents
Key points summary................................................................................................................................ 1
Executive Summary................................................................................................................................. 5
Introduction ........................................................................................................................................ 5
Current state of green space in central Wellington............................................................................ 6
Future of central Wellington green space .......................................................................................... 8
Green space and other land uses........................................................................................................ 9
Recommendations summary ............................................................................................................ 10
Acknowledgements........................................................................................................................... 10
1.0 Introduction .................................................................................................................................... 11
1.1 Benefits of urban green space .................................................................................................... 12
1.1.1 Health and wellbeing ........................................................................................................... 12
1.2 Ecosystem services framework ................................................................................................... 14
1.2.1 Ecosystem services............................................................................................................... 14
1.2.2 Ecosystem services and human wellbeing ........................................................................... 15
1.2.3 Ecosystem services and urban environments ...................................................................... 16
1.3 Amount and accessibility of green space for diverse populations ............................................. 17
1.3.1 Provision of green space in urban areas .............................................................................. 17
1.3.2 Green space accessibility and disability ............................................................................... 17
1.3.3 Green space accessibility and socio-economic status ......................................................... 18
1.4 Critical types of green space ....................................................................................................... 19
1.5 Background to this report ........................................................................................................... 20
1.6 Aims of study............................................................................................................................... 22
1.7 Methods ...................................................................................................................................... 23
2.0 Provision of Green Space ................................................................................................................ 24
2.1 The Central City area................................................................................................................... 24
2.1.1 Thorndon-Tinakori Road CAU .............................................................................................. 24
2.1.2 Lambton CAU ....................................................................................................................... 24
2.1.3 Willis Street-Cambridge Terrace CAU .................................................................................. 26
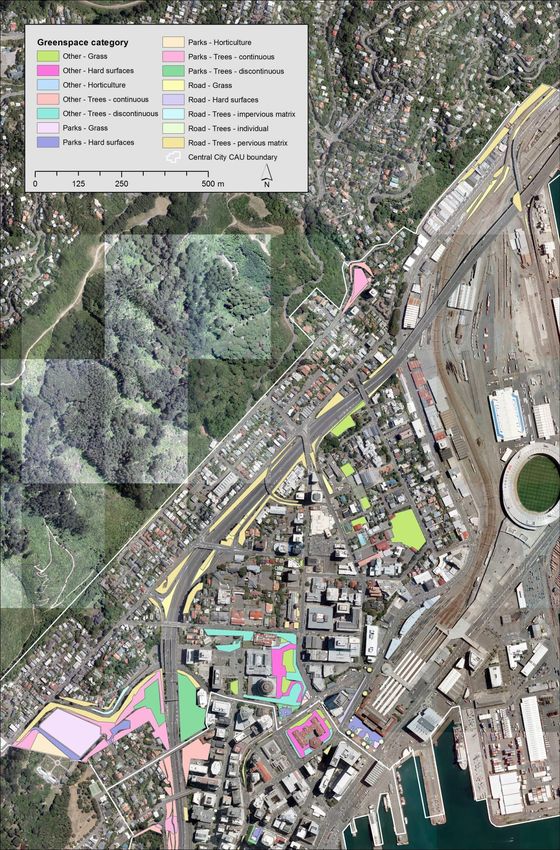
2.2 Green space classification ........................................................................................................... 26
2.2.1 Parks and Gardens Zone ...................................................................................................... 30
2.2.2 Road Reserve Zone............................................................................................................... 30
Green Space in Wellington’s Central City October 2019 Page 2
2.2.3 Other Zoned Areas ............................................................................................................... 31
      2.2.4 Land cover categories .......................................................................................................... 32
      2.2.5 Green space area totals ....................................................................................................... 34

3.0 Current demographic and needs analysis ....................................................................................... 36
   3.1 Overall population ...................................................................................................................... 36
   3.2 Future population levels ............................................................................................................. 37
   3.3 The counting of students in student accommodation ................................................................ 39
   3.4 Commuters into the Central City ................................................................................................ 39

4.0 Supply and demand synthesis......................................................................................................... 41
   4.1 Current total and per capita amount of green space ................................................................. 41
   4.2 Future green space amount ........................................................................................................ 41
   4.3 Green Space amount and buffer analysis ................................................................................... 42
      4.3.1 Overall Central City area ...................................................................................................... 42
      4.3.2 Central City CAUs ................................................................................................................. 45
      4.3.3 Discussion............................................................................................................................. 47

5.0 Constraints to maintaining/increasing green space provision ....................................................... 50
   5.1 Introduction ................................................................................................................................ 50
   5.2 Optimising green space provision ............................................................................................... 50
      5.2.1 Density and the costs of green space .................................................................................. 52
      5.2.3 Transport and parking .......................................................................................................... 52
   5.3 Technical constraints .................................................................................................................. 54
      5.3.1 Vegetation maintenance ...................................................................................................... 54
      5.3.2 Water amount and climate limitations ................................................................................ 54
      5.3.3 Resilience to natural disasters ............................................................................................. 54
      5.3.4 Plant growth form (roots, soil requirements) ...................................................................... 55
      5.3.5 Plant or animal characteristics ............................................................................................. 56
   5.4 Cost and policy constraints ......................................................................................................... 56

6.0 Potential to increase green space provision ................................................................................... 58
   6.1 Current situation ......................................................................................................................... 58
   6.2 Ecosystem services design process for urban green spaces in Wellington ................................ 59

Green Space in Wellington’s Central City                                         October 2019                                                Page 3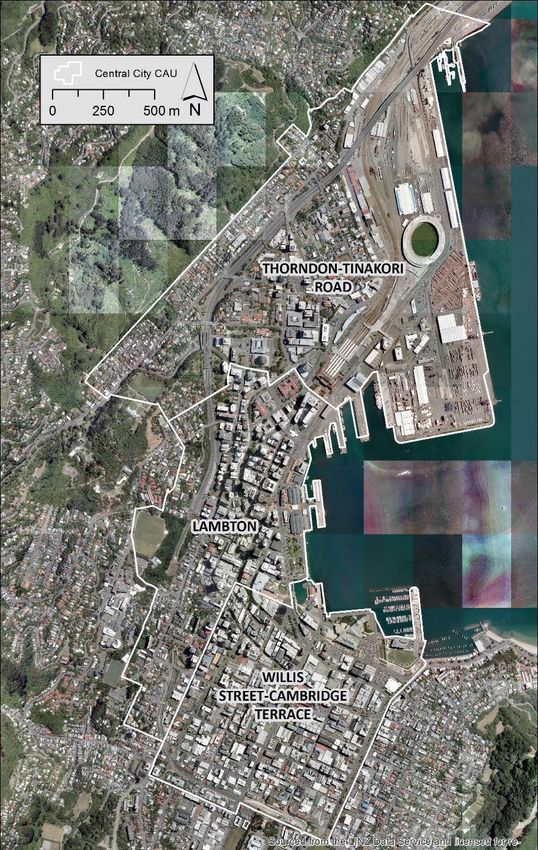
6.3 Central Wellington green space regeneration: potential places to start ................................... 61
       6.3.1 Cuba Quarter Green Nexus .................................................................................................. 62
       6.3.2 Kent and Cambridge Terraces Linear Park ........................................................................... 66
       6.3.3 Terrace Gardens Flagstaff Hill .............................................................................................. 71

7.0 Conclusions and recommendations ................................................................................................ 76
   7.1 Conclusions ................................................................................................................................. 76
       7.1.1 State of green space in central Wellington .......................................................................... 76
       7.1.2 Future of central Wellington green space ........................................................................... 77
       7.1.3 Green space and other land uses......................................................................................... 77
   7.2 Recommendations ...................................................................................................................... 78

Appendix One: Disability and accessibility............................................................................................ 80
   Accessibility, usability and universal design ..................................................................................... 80
   Accessibility for older people, children and people with disabilities ............................................... 81
   Park accessibility ............................................................................................................................... 81
   Older adults with and without disability........................................................................................... 82
   Children with disability ..................................................................................................................... 83
   Summary ........................................................................................................................................... 84
Appendix Two: Ecosystem Services ...................................................................................................... 85
   Benefits and disadvantages to an ecosystem services approach to urban green/blue space ......... 85
Appendix Four: Buffer analysis details.................................................................................................. 87

Glossary ................................................................................................................................................. 89
References ............................................................................................................................................ 90

Green Space in Wellington’s Central City                                             October 2019                                                 Page 4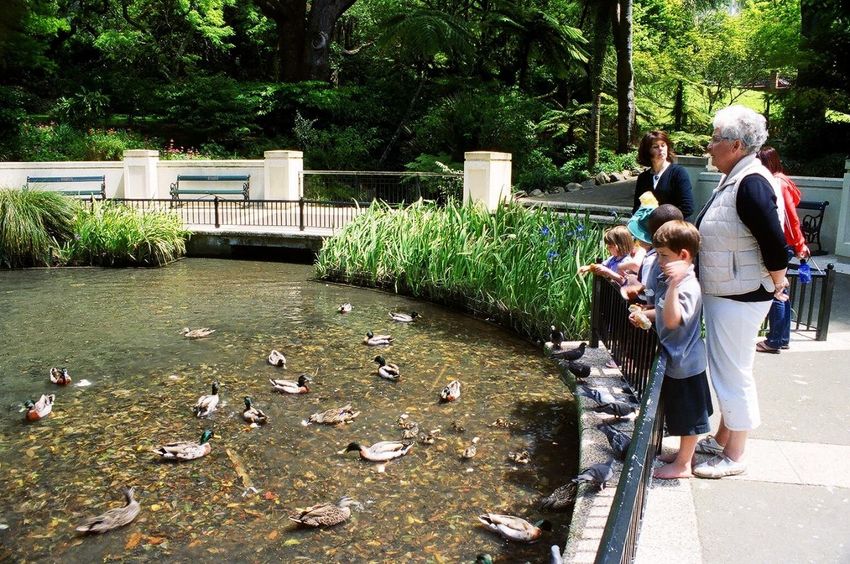
Executive Summary

Introduction
Urban green spaces are an essential part of Wellington City, for the wellbeing of residents and the
local environment, and for city resilience. We need green space in cities, and particularly in central
Wellington City, for the following benefits:
    • recognised health and wellbeing benefits for present and future residents, commuters and
        visitors;
    • amenity, liveability and economic benefits for Wellington City and its residents;
    • other ecosystem and resilience benefits to mitigate and adapt to climate change and other
        environmental shocks.

This report looks at the current provision of public urban green space in central Wellington, and makes
recommendations for future strategic design and provision of urban green spaces in relation to
current and projected future population levels. It was commissioned by Wellington City Council to
complement a context of recent and current planning work relevant to the central city, including the
Central City Framework Plan, “Our City Tomorrow”, “Let’s Get Wellington Moving”, “Planning for
Growth” and revision of the District Plan. The study was undertaken by urban researchers at
University of Otago, Wellington, and Victoria University of Wellington, who are members of the New
Zealand Centre for Sustainable Cities.

A combination of desk-top review, desk-top analysis and field inspection methods were used for this
study. We used a combination of approaches at the level of the New Zealand Census Area Unit (CAU),
linking the distribution of urban green space within three central city CAUs (Thorndon-Tinakori Road,
Lambton, and Willis Street-Cambridge Terrace) to census population data. We also provided measures
of accessibility of available urban green spaces within a threshold distance from a “typical” CAU
inhabitant’s residence.

We were primarily interested in three questions:
• Can urban councils and housing providers, especially Wellington City Council, with its vision of a
   ‘compact, liveable city’, ensure the provision of enough of the right types of green space to
   support intensification, without eroding residents’ wellbeing and quality of life?
• Are all residents of all parts of central Wellington able to access and enjoy green space at a level
   that adequately provides for their health and wellbeing?
• Could the resilience of the central city be increased by increasing the quantity or quality of green
   spaces?

Our analysis was undertaken within a framework of ecosystem services (also known as ‘nature’s
services’ and ‘ecosystem benefits’), which are the benefits that people derive either directly or
indirectly from ecosystems that support human physical, psychological, social and economic
wellbeing. Urban green spaces are some of the most important locations and providers of ecosystem
services in urban areas. There is clear evidence that losses of urban biodiversity and urban ecosystem
services can have significant impacts on the wellbeing of urban populations.

Green Space in Wellington’s Central City               October 2019                             Page 5
There is a wide range of different urban green and associated open space types, with varying degrees
of “greenness”. Correspondingly, there is no universally accepted definition of urban green space,
and these spaces vary with regard to their health and well-being impacts. In this study, the emphasis
is on publicly accessible green space which has a significant degree of vegetation cover. Given that
some significant green spaces are on or very close to the waterfront of Te Whanganui a Tara
(Wellington Harbour), the provision of green spaces cannot be entirely divorced from that of “blue
spaces” (figure 2). There is also a significant amount of private green space within residential lots in
the central city, but this was not quantified in this study.

               Figure 2. Waterfront and Frank Kitts Park, Wellington (photographer: P. Blaschke)

Green space planning and provision should embrace a systems view of cities. This means thinking
about the linkages between the central city and surrounding areas when considering green space
needs and ecosystem services, as well as considering connected and interdependent urban processes.

Current state of green space in central Wellington
For this study public green and open spaces (henceforth ‘green space’) were classified into three broad
land use categories related to tenure, and five land cover categories. The three land use categories
are:
     • “City parks and gardens” are areas that are owned by Wellington City Council and zoned and
         managed as parks and gardens;
     • “Road reserves” are the green or associated open areas within the legal boundaries of the
         designated road corridor, other than the actual road and footpath;
     • “Other non-council areas” are other categories of publicly-owned and accessible green or
         associated open space, not necessarily owned by Wellington City Council.

Green Space in Wellington’s Central City                    October 2019                           Page 6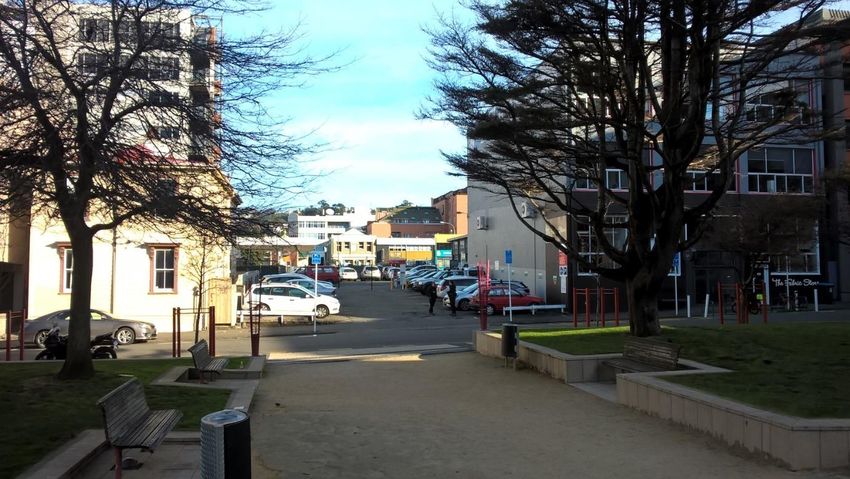
Central Wellington (as defined by the three
CAUs mentioned) has a total of 41.25 ha of
public green space. A significant proportion of
the central city’s public green space is located
not in City parks and gardens (which are 43%
of public green space), but in road reserves
(24%) or in other non-council areas (33%)
(figure 3).

A significant area categorised as green space
within all land use categories, consists of
impervious and largely non-green surfaces
such as paved areas and single trees within
paved areas. Such areas (26% of green space
overall), while important given the small areas
of green space, cannot fulfil all the ecosystem
service benefits expected from green space.

The population of these three CAUs was
17,076 in 2013 and estimated at
approximately 24,000 in 2018. Under the
Council’s high and medium growth scenarios,
there will be a significant population increase
in the central city by 2043, particularly in the
Lambton and Willis St-Cambridge Terrace
CAUs. Current average amount of public green
space per person in the central city is 20m2
(based on the 2013 population and excluding         Figure 3. Road reserve vegetation in Victoria Street,
impervious surfaces). The per capita amount of                          Wellington
                                                                 (photographer: P. Blaschke)
green space in each CAU is highest at 41m2 in
Thorndon-Tinakori Road, close to average at 23m2 in Lambton, and lowest at 6m2 in Willis St-
Cambridge Terrace. Thorndon-Tinakori Road CAU has a lower socio-economic deprivation index than
the other two CAUs. There is and will continue to be a significant additional demand for green-space-
based recreation and wellbeing benefits from non-resident city workers and visitors to Wellington City
(a total of nearly 80,000 people working in the three CAUs).

The amount of green space within 300 metres of the population-weighted centroid in the central city
and in each CAU accentuates the differences in available green space between the CAUs. There is a
significant lack of green space within 300m of the population-weighted centre of the Willis St–
Cambridge Terrace CAU; the per capita amount of any green space in this CAU is relatively very low,
and what green space is available is dominated by impervious (hard) surfaces.

Green Space in Wellington’s Central City                 October 2019                             Page 7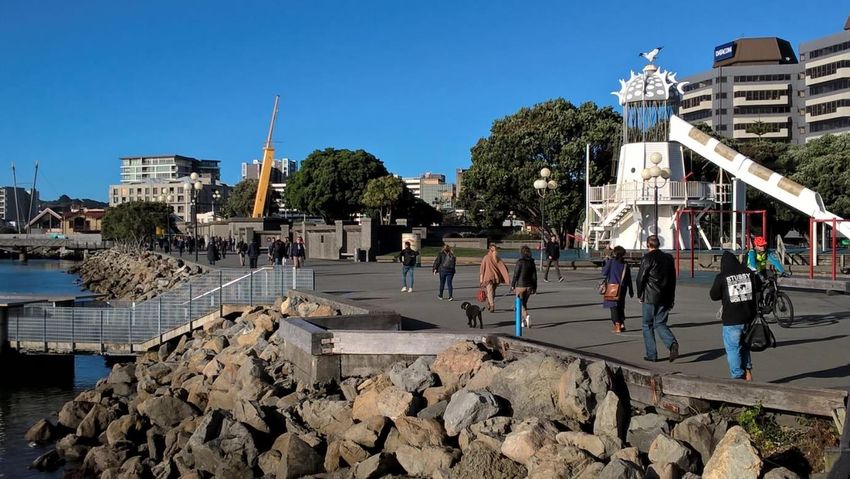
Future of central Wellington green space
Green space amount per capita in central Wellington City declines substantially - by half on average -
when projected population growth to 2043 for the three CAUs is considered. The average amount of
green space per capita in the central city in 2043 would decrease to 10m2. The per capita amount of
green space in each CAU would decrease to 27m2 in Thorndon-Tinakori Road, 11m2 in Lambton and
only 3m2 in Willis St - Cambridge Terrace.

There are likely to be more older adults and dependent children living in the central city in future. The
prevalence of mobility impairments and other types of disability will increase as the population ages.
Accessibility of green space (amount qualified by the ability to access it) will become more difficult for
most people in these less mobile groups.

      Figure 4. Children and elderly visitors at the Botanic Gardens, Wellington (photographer: ‘Wanderer’)

Environmental constraints such as sea-level rise, and more intense storms, floods and dry periods are
likely to further limit green space amount or accessibility, especially on the harbour edge and in low-
lying areas such as along Kent/Cambridge Terraces. This would be especially important given the
importance of central city green space for resilience and disaster recovery.

A higher amount of green space in peri-central areas (including the Town Belt, educational institutions,
and Wellington Botanical Garden) partly compensates for a lower amount in the centre, but not
necessarily for persons with disabilities.

Green Space in Wellington’s Central City                     October 2019                                 Page 8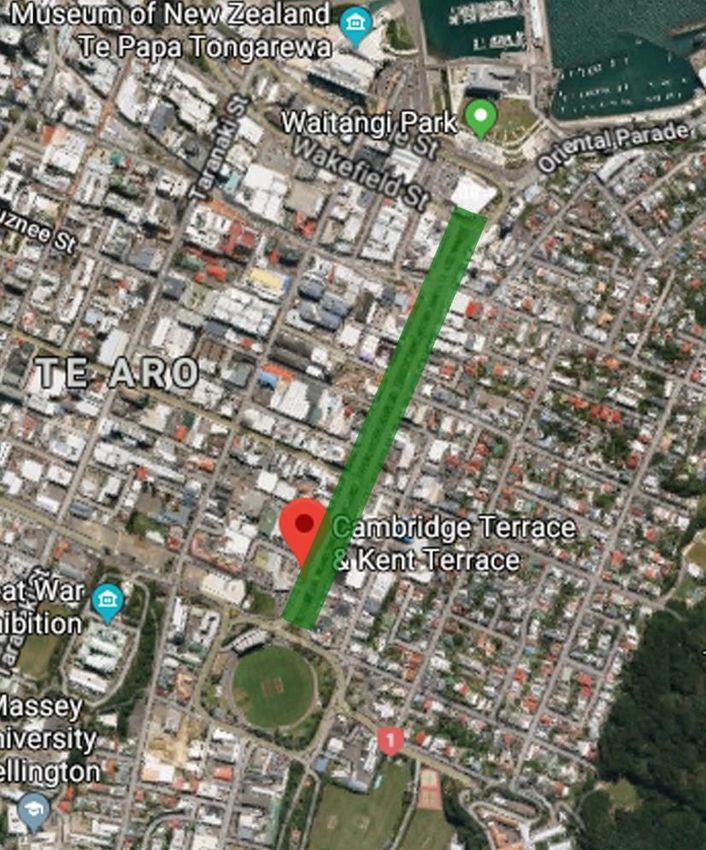
Green space and other land uses
Like other cities facing intensification, Wellington City is challenged to find creative ways to provide
green amenity and ecosystem services to avoid loss of residents’ wellbeing and quality of life. Cities
must find an acceptable balance between urban green space benefits and costs, taking both the
quantity and quality of green space into account. Competing uses of central city land for current or
additional green space include motor vehicle traffic, car parking, residences (single and multiple unit),
some commercial use, and non-green recreation and infrastructure. Some of these uses, especially
extensive on-street parking for private cars, are increasingly a poor use of land as the city intensifies.
Much of Wellington’s current green space provision is of high aesthetic quality, but sometimes this
quality appears to be at the detriment of the provision of ecosystem services from green space,
especially through excessive areas of hard impervious non-green surfaces (figure 5). There are also
technical constraints to green space provision, including water availability and climate limitations,
susceptibility of tree and other species to natural disasters, soil limitations, negative plant or animal
characteristics for urban residents’ living, and cost constraints.

          Figure 5. Victoria Street, Wellington. Large areas of imperviousness and on-street parking
                                          (photographer: P. Blaschke)

There is scope to make better use of available space and better optimise the mix of land uses so that
residents and visitors to central Wellington are satisfied with the quantity and quality of green space,
and that it is not eroded to levels which may be adverse for their health and wellbeing, and the longer-
term resilience of the central city. This requires the maximum possible protection of current green
space in all land use categories, augmented by purchase of additional land for green spaces where this
can be justified by likely population growth, particularly in the Willis Street-Cambridge Terrace CAU.

Green Space in Wellington’s Central City                    October 2019                               Page 9
Recommendations summary
Recommendations are aimed at increasing the total amount, accessibility and quality of green space
in the central city and fulfilling a vision where:
“Central city green spaces enhance community and ecosystem health”.
The overarching recommendation is to plan for and adequately resource an increased
amount, accessibility, and quality of green space in the central city, in order to provide
for the health, wellbeing, amenity, and ecosystem benefits required by the likely
significantly larger future population of the central city.
A supporting recommendation addresses the need for active collaboration on green space provision
and accessibility between public agencies, private developers and a wide range of stakeholders and
NGOs including vulnerable groups and those working with them.
A group of 12 further specific recommendations deal with:
• maximising accessibility and quality of the few relatively large public areas, together with
maximum use of opportunities for ‘pocket parks’ and small green areas;
• use of universal accessibility design principles, ensuring that all spaces meet
international/national guidelines for accessibility, and that all green spaces are of sufficient
quality to ensure they are usable by diverse groups within the population;
• making maximum practicable and creative use of opportunities for non-traditional green
space, and green spaces that provide multiple ecosystem services;
• maximising the number of trees in all central city development plans and broadening the
range of trees and other vegetation used in street and greenspace planting;
• maximising the amount of pervious surfaces in all green spaces;
• making maximum practicable use of opportunities for complementarity between green space
and other land uses, especially transport corridors, housing and commercial provision and
flood control; and
• maximising accessibility links between central city green space and peripheral central city
green space, especially through both active and motorised transport corridors.
Acknowledgements
Among the many people who have generously assisted with information and comments, we especially
thank Myfanwy Emeny and Bec Ramsay from the Parks, Sport and Recreation team, Wellington City
Council, for their constant support during the project, from commissioning to completion. We also
received very helpful support from Jasmine Jamieson at the University of Otago, Wellington, and from
Ben Fountain and Mohamed Hassan at Wellington Water.
Green Space in Wellington’s Central City October 2019 Page 101.0 Introduction
Central city areas the world over are characterised by higher population density, and the per capita
amount of land for all purposes is much usually lower (Blaschke et al., 2017). However, residents,
visitors and workers in the central city still have need of green space for their health and wellbeing.
Wellington is no exception to this pattern. Over the last two decades the population of central
Wellington has grown rapidly and is expected to continue to do so in future. The central city is strongly
structured by topography, its relation to the harbour edge, and climatic limitations to plant growth.
These factors all constrain available space so that provision of green spaces had to compete strongly
with other uses. The colonial city, planned from London before European settlement (figure 6), had to
be significantly changed to accommodate these factors. From the start, the central city was planned
to include a Town Belt to delineate the city from its then rural hinterland (Schrader, 2015; Boffa
Miskell, 2001). However, apart from the roading network there has been little consistent planning of
inner-city open space, with very few parks within the area enclosed by the Town Belt, even after
Wellington City Council started to add some new parks such as Midland Park (1983). Already in 1998
it was noted that there were notable gaps in the distribution of city parks in key central areas of high
pedestrian numbers (Wellington City Council, 1998).
Figure 6. New Zealand Company plan of the Town of Wellington, Port Nicholson, 1840
(source: Archives New Zealand)
Central Wellington faces specific environmental and resilience challenges. Its situation on the
Wellington Fault; one of New Zealand’s most active faultlines (GNS, 2019), has been long known and
to some extent planned for, but significant earthquakes in 2013 and 2015 graphically illustrated the
vulnerability of much of the city to this natural hazard. Rainfall-induced slips can be active even in the
heavily-reinforced central city (Capacity Infrastructure Services, 2013). Climate changes are almost
Green Space in Wellington’s Central City October 2019 Page 11certain to result in sea level rise that will cause major impacts in the central city as well as increased
vulnerability to flood and storm damage from increased storm magnitude and/or frequency.
Most New Zealand urban areas have relatively low population and household density, but Wellington
and Auckland central cities are the arguable exceptions. Looking across Australasia and using
population-weighted density data, Wellington City is the densest, then follows Sydney and Melbourne.
Auckland City and the Wellington urban area as a whole are denser than Brisbane, Perth, Adelaide and
Christchurch (ordered by weighted density) (Nunns, 2014). Despite their increasing densities,
Auckland and Wellington remain, like other New Zealand urban areas, well-endowed with urban green
space at the city scale (Mathieu et al., 2007; Nutsford et al., 2013; Richardson, et al., 2013; Blaschke
et al., 2017). There is debate about the effects that increased urban density could have on the available
amount and use of urban green spaces, an issue that has current resonance in New Zealand. This
report principally examines the following questions:
• Can urban councils and housing providers, especially Wellington City Council, with its vision
of a ‘compact, liveable city’, ensure the provision of enough appropriate green amenities to
support intensification without damage to residents’ wellbeing and quality of life?
• At the local (central city) scale, are residents of some parts of central Wellington experiencing
a decrease in green space to levels which are adverse for their health and wellbeing?
• Could the resilience and sustainability of the central city be increased by increasing the
quantity or quality of green spaces?
In this study we have used a combination of approaches at the level of the New Zealand Census Area
Unit (CAU), linking the distribution of urban green space within three central city CAUs to census
population data including socio-economic and health status, as well as providing measures of
accessibility in respect of available urban green spaces within a threshold distance from a “typical”
CAU’s inhabitant’s residence.
1.1 Benefits of urban green space
International research indicates that urban green spaces confer a wide range of important benefits
(de Vries et al., 2003; Lee & Maheswaran, 2011; Maas et al., 2006; Tzoulas et al., 2007; WHO Regional
Office for Europe, 2016). Roberts et al. (2015), Meurk et al. (2013) and Blaschke (2013) review benefits
of natural areas and green spaces generally for New Zealand. Residing in neighbourhoods that are
more walkable and with better access to greenspace and local transport infrastructure has been
associated with increased overall physical activity, while in a recent USA study, park quantity
(measured as the percentage of city area covered by public parks) has been identified as among the
strongest predictors of overall subjective wellbeing at a whole city level (Larson et al., 2016). Urban
green space is also crucial for ecological health and resilience.
1.1.1 Health and wellbeing
There is now an extensive scientific literature documenting the health and wellbeing benefits for
people of contact with nature or green space. Evidence of health benefits of green spaces point to
improved mental health and cognitive function, reduced cardiovascular morbidity, reduced
prevalence of type 2 diabetes, improved pregnancy outcomes, and reduced mortality. In general,
studies have demonstrated stronger evidence for mental health benefits, and for stress reduction,
compared with other potential pathways to health (de Vries, 2010; Gascon et al., 2015). The
mechanisms underlying links between green space access and health are likely to be complex,
interacting, and sometimes synergistic. Hartig et al. (2014) suggest four principal and interacting
Green Space in Wellington’s Central City October 2019 Page 12pathways through which nature or green space may contribute to health: improved air quality; enhanced physical activity; stress reduction; and greater social cohesion.1 There is strong evidence to show that physical inactivity is a global health problem which is associated with non-communicable diseases (e.g. diabetes and some cancers) (World Health Organization, 2018). Estimates suggest that the international economic burden of physical inactivity was (INT$) 53.8 billion in 2013 (Ding et al., 2016), including a cost to New Zealand’s healthcare system of over $NZ200 million (Market Economics Ltd, 2013; Ding et al., 2016). In a bid to reduce the individual and societal burden of physical inactivity the World Health Organisation recently released a Global Action Plan on Physical Activity 2018-2030 (World Health Organization, 2018). This plan recommends a systems-based approach for increasing physical activity via four key objectives, one of which is creating active and inclusive environments. The provision of good-quality green space for recreation is specifically mentioned (World Health Organization, 2018). Indeed, the parks sector is specifically discussed, alongside urban planning and transportation, as pertinent for reducing the health burden of the global physical inactivity (Sallis et al., 2016). Green spaces are important for community well-being and public health (Cohen et al., 2007), and provision of green spaces provides one solution for increasing whole population and individual health and well-being (Han et al., 2013). Greenspace enables opportunities for physical and leisure activities (Han et al., 2013) and human social connection needs (Bedimo-Rung, 2005). People in New Zealand who access greenspace are more likely to meet recommended physical activity guidelines (Fleming, 2016). However, these bio-psycho-social benefits are contingent on parks providing a safe environment (Fleming et al., 2016), which all generations and people of all abilities, including persons with disabilities, should be able to access (Bedimo-Rung et al., 2005; Springgate, 2008; World Health Organization, 2018). The extent to which the available amount of green space facilitates high quality urban intensification is unclear, as the literature is not focused on this issue. But there appears to be a positive connection. A review by Haaland et al., (2015) noted that studies of Chinese cities found that per capita GDP was important in explaining green space cover, with a positive correlation; i.e. higher income cities retained more green space as cities developed. Byrne et al., (2010) in Australia note the challenges of quality green space planning, including in some Brisbane consolidation areas where even a low green space standard (1 ha public green space per 1000 residents) had not been achieved. However, they also note that urban green spaces are ‘not an expensive luxury; rather they are a vital necessity for the wellbeing of residents…. most apparent in denser urban environments.’ (p.164). Provision of urban green spaces is, of course, not without cost for cities, mainly the opportunity value of the land, but also the potential impact of providing urban green space in enlarging the city and thus increasing travel distances and costs, and associated carbon emissions. There is concern that a trend towards compact urban settings may result in less area available for any type of green space or the provision of trees (Lin et al., 2015; McPherson et al., 2011). The challenge for cities is to find an optimal or at least acceptable balance between urban green space benefits and their costs. 1There is also some evidence of adverse effects of urban green space or neighbourhood greenery on health although this evidence is scarcer. Potential adverse effects include: increased local exposure to air pollutants, risk of allergies and asthma, exposure to pesticides and herbicides, exposure to disease vectors and zoonotic infections, accidental injuries, excessive exposure to UV radiation, and vulnerability to crime. Green Space in Wellington’s Central City October 2019 Page 13
1.2 Ecosystem services framework
Designing and evolving urban green/blue spaces from the perspective of how ecosystems function
(i.e. what they do) could work towards the creation of cities where positive integration with, and
restoration of local ecosystems could be realised (Pedersen Zari, 2018), while at the same time making
the city more liveable and attractive while providing wellbeing benefits (Taylor and Hochuli, 2015).
The ecosystem services framework is one way to understand the complexity of ecosystem processes
and human interactions with them in terms of need and use.

1.2.1 Ecosystem services
Ecosystem services (sometimes called ‘nature’s services or ‘ecosystem benefits’) are the benefits that
people derive, either directly or indirectly from ecosystems that support human physical,
psychological and economic wellbeing. In this context, ecosystem services are used as a way to
understand what it is that ecosystems actually do that is crucial to human life, so that these services
may then be supported, integrated with, or emulated in cities. Urban green and blue space is often a
crucial component of this. If cities are able to design green and blue spaces, infrastructure and possibly
even buildings so that they start to produce ecosystem services, some pressure that the city exerts on
urban and nearby ecosystem services will be lessened (Pedersen Zari, 2018). A focus on ecosystem
services has been widely adopted among ecology and policy professionals (Martín-López et al., 2014,
Potschin et al., 2016), and was formalised by the United Nations’ Millennium Ecosystem Assessment
(2005b). Ecosystem services are usually classified as belonging to regulating, supporting, provisioning,
or life-fulfilling (cultural) groups (table 1). Brief explanations and examples of what each ecosystem
service is in the context of cities is given in Pedersen Zari (2018) and is further exemplified for a
Wellington City context in table 2. Benefits and disadvantages to an ecosystem services approach to
urban green/blue space are further discussed in Appendix 2.

Table 1. Ecosystem services

 Regulation functions:                                Supporting functions:
    • Climate regulation                                  • Soil
    • Disturbance prevention                              • Fixation of solar energy
    • Decomposition                                       • Nutrient cycling
    • Purification                                        • Habitat provision
    • Pollination                                         • Species maintenance
    • Biological control

 Provisioning Functions:                              Life fulfilling functions:
     • Food                                                • Artistic inspiration
     • Raw materials                                       • Aesthetic value
     • Genetic resources                                   • Education, innovation and knowledge
     • Medicinal resources                                 • Cultural diversity and history
     • Fuel                                                • Recreation and tourism
     • Fresh water                                         • Spiritual and religious inspiration
     • Ornamental resources                                • Creation of a sense of place
                                                           • Relaxation and psychological wellbeing

Green Space in Wellington’s Central City                 October 2019                            Page 14
1.2.2 Ecosystem services and human wellbeing
Ecosystem services are fundamental to basic human survival and human well-being, and the desire
for enhanced well-being is the main driver of our demand for ecosystem services (Roberts et al., 2015).
Human use of ecosystem services is expanding; however, due to human population increases as well
as significant rises in per capita rates of consumption (Turner, 2008). The global condition of most
ecosystem services except for the provisioning of food and raw materials has declined over the past
fifty years. In fact, ecosystems have changed more in the last fifty years than in any other period of
human history (Millennium Ecosystem Assessment, 2005a). Roberts et al. (2015) describe in detail
how nature's ecosystem services contribute to the wellbeing of New Zealand and New Zealanders.
Table 2. Ecosystem services in a central Wellington City context
Design objectives/ strategies / methods / programmes
Ecosystem Service
that can enhance provision
Increased urban vegetation: green roofs, living walls, wildlife
corridors, pollinator pathways, wildlife sanctuaries, urban forests;
Supporting Services
Habitat provision regeneration of streams; built habitat analogues; avoidance of
habitat loss and fragmentation; ecological engineering; Biophilic City
policies. Important in Wellington because of proximity of large areas
of habitat.
Avoidance of non-recyclable/reusable/biodegradable wastes;
separation of waste streams; avoidance of landfilling; landfill mining;
Nutrient cycling
increased use of local materials; industrial ecology; Cradle-to-Cradle;
design for deconstruction; composting/biodegradation.
Avoidance of pollution; remediation of waterways / harbours /
aquifers/air/soil; treatment of storm water/leachates/
greywater/blackwater; urban forest regeneration; phyto / bio-
Purification remediation; Living Machines; green roofs / facades / infrastructure;
constructed wetlands; pollution remediating/ absorbing construction
Regulation Services
materials; water sensitive urban design; increased porosity of
surfaces and reduction of stormwater velocity.
Carbon sequestration/storage materials/technologies; regeneration
of protected forest; increased urban vegetation; planting for
increased evapotranspiration /shading / sound absorption/wind
Climate regulation
buffering; ecosystem-based adaptation strategies; reduction of fossil
fuel use; and car travel; renewable energy generation; non high-mass
landscaping.
Disturbance Ecosystem-based adaptation solutions; green / hybrid infrastructure
prevention and for water/flood/wave/wind/erosion control; urban forest; urban
resilience wetlands; water-sensitive urban design.
Reduction of energy use (behaviour & efficient technologies);
Provision of energy renewable energy generation; increased local distributed energy
generation.
Provisioning Services
Reduction of water demand; recycling & treating grey/black water
on-site; returning clean waste water to original source; rainwater
Provision of fresh
harvesting; rain water tanks; collection/production of ‘alternative’
water
water sources; water sensitive urban design; green infrastructure;
forest & wetland capture/ storage/filtration.
Urban agriculture & agroforestry; permaculture; edible landscaping;
community/marae/school gardens/orchards/forage; plant-based
Provision of food
diets; increased yield techniques (renewable/non-toxic/non-
petrochemical); roof top/façade/interior/vertical food growth.
Green Space in Wellington’s Central City October 2019 Page 15Interventions to enhance city character and sense of place: landscape
Beauty architecture; outdoor & environmental art; biophilic design;
environmental psychology.
Design for natural environment recreation and play, physical and
Recreation mental health and fitness: biophilic design; drainage provision,
walking / cycling paths, exercise areas, outdoor recreation
programmes.
Interventions to connect environment and landscape of the city,
enhance liveability and economic success as a place people want to
Cultural services
Culture
live in and identify with: landscape architecture; biophilic design;
environmental psychology; ecological history design; interpretation
of historical/natural/cultural heritage.
Interventions for mental and physical health and wellbeing:
landscape architecture; biophilic design; environmental psychology;
Health and recreation/relaxation/mindfulness programmes; contact with
wellbeing wildlife/vegetation/water/outdoor Green Prescription programmes;
design for liveability, play, quality of life, social cohesion, sense of
place, uniqueness based on interaction with local natural
environment.
Eco-revelatory design; biomimicry; outdoor science/matauranga
Knowledge
programmes, zoos, botanical gardens; Enviroschools programmes;
plant and animal pest management.
While the negative impacts of loss of ecosystems and biodiversity (and therefore the ecosystem
services they provide) on people in urban areas are difficult to quantify, there is clear evidence that
losses of urban biodiversity and therefore urban ecosystem services has significant adverse impacts
on:
• Human physical health (Aerts, Honnay, and Van Nieuwenhuyse 2018, Kilpatrick et al., 2017),
• Human psychological health (Frumkin et al., 2017, Beatley 2011),
• Societal and cultural health (Vierikko et al., 2016, Botzat, Fischer, and Kowarik 2016), and
• Economic health and stability (Walsh, Carpenter, and Vander Zanden 2016, Elmqvist et al.
2015).
1.2.3 Ecosystem services and urban environments
The provision of ecosystem services is claimed to generally occur at low rates in cities except for
cultural ecosystem services (Costanza et al., 2014). Despite this, important urban ecosystem services
include air purification, water flow regulation, micro climate regulation, and carbon sequestration
(Gómez-Baggethun and Barton 2013). Typically, these urban ecosystem services come from urban
green areas such as forests and parks, or blue areas such as lakes and wetlands. They represent
important opportunities for novel design interventions, particularly related to increasing adaptation
to climate change options (Elmqvist, Gomez-Baggethun, and Langemeyer 2016).
One way to reduce or to reverse the negative impact urban environments have on ecosystems may
be to create and re-design urban areas so that they more effectively provide, integrate with, or
support ecosystem services, and therefore reduce pressure on both local and distant ecosystems.
Healthier ecosystems more readily provide ecosystem services to humans that cannot be provided by
the built environment itself or within urban environments (Pedersen Zari, 2010). This is critical as
cities, including Wellington, continue to expand and as the climate continues to change (Wratt et al.,
Green Space in Wellington’s Central City October 2019 Page 162008). Such a strategy supports and works towards several of the United Nation’s Sustainable Development Goals for 2030 (UN General Assembly, 2015). Table 2 shows ecosystem services that are relevant to central Wellington City and suggests applicable design strategies, programmes or methods that could achieve or enhance the provision of those services. Enhancing cultural services is perhaps key to making ecosystem services relevant to human wellbeing in the central city. The liveability, quality of life, social cohesion, sense of place, and celebration of what is unique and special about Wellington, can all be enhanced through high quality interactions with the local natural environment. 1.3 Amount and accessibility2 of green space for diverse populations 1.3.1 Provision of green space in urban areas Urban residents prefer to live close to urban green space. Many surveys of urban park use indicate that the majority of users want to come by foot, and will only do so on a regular basis if the park is within 3 to 5 minutes’ walk of their home or workplace (Thompson, 2002; WHO Regional Office for Europe, 2016). Studies by Richardson et al. (2010, 2013) and Nutsford et al. (2013, 2016) have provided some information on urban green space distribution in relation to census area units in Auckland and Wellington, but this has been related to health outcomes and not to population measures. This was noted as a major information gap in New Zealand by Blaschke et al. (2017) who state that only when such gaps are filled can issues of accessibility and inequalities be addressed. 1.3.2 Green space accessibility and disability Disability is a significant issue in Aotearoa New Zealand. Twenty four percent of the population, or 1.1 million people, identify as disabled and are limited by a physical, sensory, learning, mental health or other impairment (Statistics New Zealand, 2014). The rate of disability differs across age groups, with the prevalence of disability in children (i.e. 65 years of age) being 60% (Statistics New Zealand, 2014). Furthermore, while prevalence rates look comparable across ethnic groups the age-adjusted rate of disability for Māori is 32% overall (Statistics New Zealand, 2014). By 2038 the forecasted prevalence of disability in New Zealand is estimated to be close to 27% of the population. While this does not at first glance look excessive, the difference in projected increase is better illustrated by comparing the rise in general population. This is projected to increase by 31% between 2013 and 2038, but in the disabled population the projected rise is 45% (McIntosh, 2017). This large projected increase in disability between 2013 and 2038 is likely to occur predominantly in two main groups; young adults (18-39 years) and older adults (65+) (Petry, 2002). Indeed, adolescents and young adult rates of disability are projected to rise by 28% (McIntosh and Leah, 2017), and the number of older adults with disability will double by 2038 (McIntosh and Leah, 2017) because this is New Zealand’s fastest growing demographic (Statistics New Zealand, 2014). 2 In this report we use the term ‘amount’ or ‘available amount’ in the sense of existential capability of being used, i.e. a simple quantitative measure of area of urban green space per capita or per household in that urban area. By contrast, ‘accessibility’ is defined in the Concise Oxford Dictionary as the “ability to be reached or entered”. Therefore ‘accessibility’ has an additional connotation (which may be expressed qualitatively or quantitatively) of an ability (physically, socially, economically and culturally) to access urban green space. In this sense, ‘accessibility’ can just be a synonym for ‘nearby’ and this is the sense in which the term is often used. However, the two terms appear to be used somewhat interchangeably and without clear distinction in much of the literature. Green Space in Wellington’s Central City October 2019 Page 17
The World Health Organization (WHO) definition considers disability to be an overarching term
covering impairments, activity limitations, and participation restrictions (World Health Organization,
2001). Importantly, this definition considers the interaction between an individual and the society
within which they live, because this aspect (environment and social barriers) can be particularly
disabling (World Health Organization, 2001). While ‘persons with disabilities’ is a large heterogenous
group, physical activity is particularly important because this population has a higher risk of physical
inactivity and associated long-term health conditions (Rimmer, 2012; Rimmer et al., 2007) compared
to those without disability (Krahn et al, 2015). Given the health risks of physical inactivity in persons
with disabilities, accessible and inclusive greenspace environments which promote physical activity
and bio-psycho-social well-being are not only warranted (Rimmer, 2012), but also a human right.

Quality and usability of green space are as important as accessibility, especially for persons with
disabilities for whom accessibility is more limited and who therefore must be able to make optimal
use of whatever green space is accessible. This is particularly important in Wellington where there is
generally thought to be a large amount of ‘green open space’ outside of the central city, but significant
parts of this space are inaccessible because of topography and are not universally useable as public
open space. Even for the general population, quality attributes of green spaces, such as safety,
aesthetics, amenities, maintenance, and proximity to home, are important for supporting physical
activity outdoors. Aspects such as concerns over safety, violence, vandalism, litter, noise, pollution,
and dog fouling have negative associations with park use and physical activity (McCormack et al.,
2010). Richardson et al. (2010) also comment that in New Zealand, green space quality may be a
better predictor of health benefits than green space quantity. Further detail on the application of
universal design to increase accessibility is available in Appendix 1.

1.3.3 Green space accessibility and socio-economic status
Some recent studies approached accessibility analysis by linking the distribution of urban green space
to population data including socio-economic and health status (Astell-Burt et al., 2014; Bertram &
Rehdanz, 2015; Nutsford et al., 2013; Shanahan et al., 2016). Several of these studies have shown
inequalities in access opportunities to urban green space, particularly in areas of lower income or
socio-economic status and higher population or household density (Astell-Burt et al., 2014; Mitchell
and Popham, 2007 and 2008; Sister et al., 2010; Wolch et al., 2014; Iverson and Cook, 2000; Lin et al.,
2015). Such higher density areas tend to have less amount per capita in any case, and Sister et al.
(2010) showed in Los Angeles that Latinos, African-Americans, and other low-income groups were
likely to live close to parks with higher actual or potential park congestion. Such findings are not,
however, universal. Ståhle (2010) for example shows that citizens in some dense inner-city districts in
Stockholm experienced higher green space accessibility than citizens in some low-density ‘green’
suburbs.

Green Space in Wellington’s Central City                 October 2019                           Page 18
1.4 Critical types of green space
There is a wide range of different urban green space types, with varying degrees of ‘greenness’ (Byrne
et al. 2010; Blaschke et al. 2017). Correspondingly, there is no universally accepted definition of urban
green space, with regard to health and well-being impacts. In this study the emphasis is on publicly
accessible green space which has a significant degree of vegetation cover (not necessarily 100%).
Public parks and gardens typically have the highest and largest range of ecosystem services and other
values (Meurk et al., 2013). We also include some other kinds of public open spaces outside public
parks and gardens, which contain or could support some green elements such as planted trees or
lawns. These types of urban green spaces include non-roadway portions of road reserves, non-council
public land controlled by public organisations other than Wellington City Council, and school and
university grounds (figure 7). In this study we do not include private green or open spaces.

                                                              Figure 7. Te Aro School grounds adjacent to
                                                                Karo Drive (Photographer: P. Blaschke).

Green and Blue space: As well as green space, “blue spaces” adjacent to water have recently received
considerable attention in the literature concerning health benefits of contact with nature in cities
(Foley and Kistemann 2015). Given central Wellington’s proximity to Wellington Harbour along much
of its length, blue spaces undoubtedly come into the ambit of relationships between people and
natural spaces in the city. Other blue spaces in the city include a lagoon directly adjacent to the
harbour (figure 8), constructed wetlands (Waitangi Park) and other constructed features such as
fountains. One study has examined the effects of visibility of blue spaces from locations in Wellington
(not specifically in the central city) (Nutsford et al., 2016). The scope of our study was specifically
centred on green not blue space. However, given that some significant green space areas are on or
very close to the waterfront, the concept of green space or at least natural space cannot be entirely
divorced from blue spaces.

Green Space in Wellington’s Central City                 October 2019                             Page 19
You can also read