Elevating Antioxidant Levels in Food through Organic Farming and Food Processing - An Organic Center State of Science Review
←
→
Page content transcription
If your browser does not render page correctly, please read the page content below
Elevating Antioxidant Levels in Food
   through Organic Farming and
          Food Processing

        An Organic Center
      State of Science Review

                   by
       Charles M. Benbrook Ph.D.
             Chief Scientist

             January 2005
ACKNOWLEDMENTS

Several members of the Organic Center’s Scientific and Technical Advisory Committee (STAC) made
important contributions to this State of Science Review. Thanks to Mark Lipson and Steve Diver for
raising critical questions regarding the reasons that plants produce polyphenols and antioxidants. Their
comments led to a much-improved discussion of this key topic.

Special thanks are due to STAC members, Alison Eldridge, Joe Montecalvo, Craig Weakley, Brian Halweil
and Kathleen Merrigan for constructive comments and valuable assistance during the review process.

Karen Lutz Benbrook did an excellent job in preparing both the Executive Summary and full State
of Science Review (SSR) for publication. The Executive Summary of this SSR has been published
separately and is accessible on the Organic Center website.
TABLE OF CONTENTS

PURPOSE AND OVERVIEW.................................................................................................................................1

TERMINOLOGY, METHODS AND SOURCES OF DATA..........................................................................4
     Terminology....................................................................................................................................................4
     Measuring Antioxidants in Foods................................................................................................................7
     Characterization and Sources of Data on Antioxidants in Foods.........................................................8
     Dietary Intake of Polyphenols and Antioxidants...................................................................................17
     Overview of Science on the Human Health Benefits of Antioxidants..............................................21

FACTORS AFFECTING SECONDARY PLANT METABOLITE LEVELS IN FOODS.....................26
     Reviews Addressing the Impacts of Organic Farming Systems..........................................................26
     Impacts of Organic Farming Methods on Antioxidant Secondary Plant Metabolites.....................28
     Impacts of Specific Farming Practices on Antioxidant Levels.............................................................33
     Impacts of Soil Quality and Weather........................................................................................................34
     Impacts of Plant Genetics..........................................................................................................................37
     Impacts of Harvest Time and Ripeness...................................................................................................37
     Impacts of Food Storage, Processing and Preparation.........................................................................39

OPTIONS AND OPPORTUNITIES TO INCREASE ANTIOXIDANT INTAKES IN THE
TYPICAL AMERICAN DIET             .................................................................................................................42
     Antioxidants in Organic and Conventional Foods.................................................................................43
     Impacts of Food Processing and Manufacturing Methods...................................................................46
     Understanding Antioxidants and Diet-Health Connections.................................................................47

ORGANIC CENTER ANTIOXIDANT RESEARCH AND POLICY RECOMMENDATIONS........50
    Research Recommendations......................................................................................................................50
           Increasing Antioxidant Intake............................................................................................................50
           Retaining Antioxidants and Nutrients in Processed Foods..................................................................52
           Understanding the Nature of Food Quality........................................................................................53
    Policy Recommendations to USDA.........................................................................................................54

REFERENCE LIST.................................................................................................................................................57

 GLOSSARY...............................................................................................................................................................69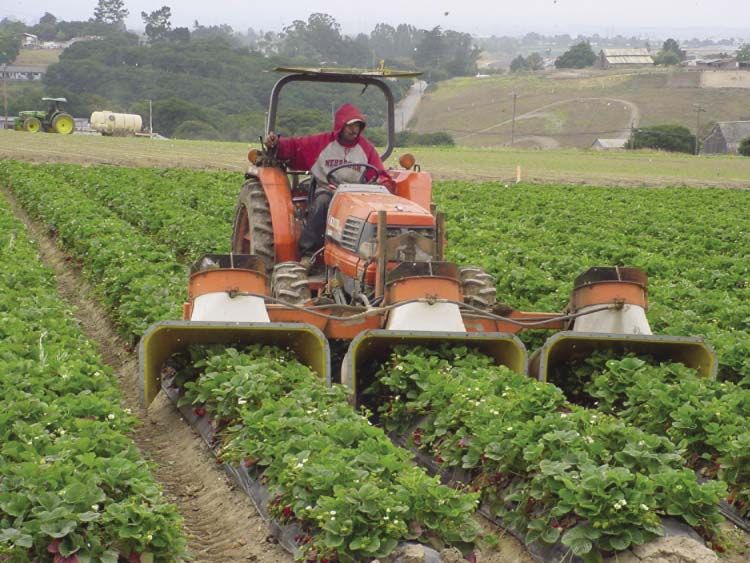
Elevating Antioxidant Levels in Food                                                    The Organic Center

PURPOSE AND OVERVIEW

        This State of Science Review (SSR) projects the potential contributions of organic farming
methods and food processing techniques on an important dimension of food quality – the polyphenol
and antioxidant content of food. This review assesses research comparing antioxidant levels in
conventional and organic foods, as well as studies analyzing the impacts of specific production practices
that are typically used by organic farmers, but are less often found on conventionally managed farms.

        Several sections are highlighted by solid lines and are included as primers for lay readers looking
to better understand the basic biology of antioxidants, data sources used in conducting research in this
area, and the types of research underway seeking to unravel the linkages between farming, food, and
human health. Readers with a background in the relevant sciences may wish to skip these sections.

        Four complex questions lie at the heart of this SSR:

            1. What roles do polyphenols and antioxidants play in promoting healthy plant growth and
               helping plants respond to environmental stress and pest attacks?

            2. Do these natural plant compounds enhance the nutritional quality of foods and promote
               animal and human health?

            3. Are the levels of polyphenols and/or antioxidants higher in foods produced on organic
               farms compared to foods grown using conventional farming methods? Are specific
               polyphenols and antioxidants present at different levels in conventional and organic
               foods?

            4. Do such differences in polyphenol and antioxidant levels enhance the health-promoting
               benefits of organic foods?

          Epidemiological evidence has confirmed that diets rich in fruits and vegetables are associated
with reduced frequency and severity of several health problems (Abeywardena et al., 2002; Afaq et al.,
2002; Bagchi et al., 2001; Barbaste et al., 2002; Craig 1997; Daniel et al., 1999; Dragsted 2003; Folts 2002;
Frei et al., 2003; Galati et al., 2000; Gee et al., 2001; Gerber 2003; Hertog et al., 1993b; Hertog 1996;
Lambert et al., 2003; Rao 2003; Reed 2002; Rodrigo et al., 2002; Rotondo
et al., 2000; Scalbert et al., 2002; Sun et al., 2002; Watanabe et al., 2002;
Willcox et al., 2003; Youdim et al., 2001; Zava et al., 1997b). Scientists
have been searching for more than two decades to identify the specific
ingredients in fruits and vegetables that account for their many health-
promoting benefits. Increasingly, that search points to secondary plant
metabolites, many of which are antioxidants, along with levels and mixtures
of vitamins, minerals, and fiber content.

       Secondary plant metabolites, including enzymes and proteins, are produced by plants to regulate
physiology and patterns of growth (Daniel et al., 1999). Some help plants deal with environmental
extremes, deter pest attacks, or respond to damage caused when insects or plant pathogens reach
damaging levels. Some play a role in repairing injured leaf or fruit tissue through the formation of
pigments. Antioxidant-driven plant defenses and wound-healing processes account for the distinctive and
                                                     1
Elevating Antioxidant Levels in Food                                                   The Organic Center

sometimes remarkably rich color and flavor of certain fruits and vegetables grown in some regions. After
harvest and during storage, fruits and vegetables with higher antioxidant levels are typically able to more
effectively slow the onset and progression of post-harvest infections. This property can help extend the
shelf life of produce and lessen mycotoxin risks (Daniel et al., 1999).

         A small but encouraging set of studies have focused on how farmers can increase average
polyphenol and antioxidant levels through management system changes, such as adoption of organic
farming methods. A much larger and rapidly growing body of research is exploring the biological
mechanisms through which secondary plant metabolites promote healthy crop growth, along with ways
to preserve antioxidant levels present in food at harvest. Genetic mapping techniques are being used to
isolate the specific genes governing the biochemical synthesize of certain antioxidants (Jones et al., 2003;
Le Gall et al., 2003; Niggeweg et al., 2004). Many research teams are trying to identify how antioxidants
in food promote animal and human health.

        Some antioxidants are remarkably potent in triggering certain biological responses in mammals.
In early 2004, one scientific team discovered a secondary plant metabolite in soybeans that is more potent
in reducing low-density lipoproteins (LDL, or “bad” cholesterol) than the most potent cholesterol-
lowering drugs on the market (Duranti et al., 2004). Other secondary plant metabolites are natural
antibiotics that help protect developing crops from certain plant pathogens and extend the shelf-life of
harvested fruits (Rauha et al., 2000).

        Plant antioxidants are vital constituents in foods, promoting both plant and human well-being.
They promote human health by neutralizing cell damage caused by free radicals and dioxygen or peroxide
molecules, also called reactive oxygen or reactive nitrogen species. Plant antioxidants should be consumed
daily. The level of antioxidants within an individual’s body on a specific day reflects that person’s diet in
the previous few days. Levels in the body tend to spike within a few hours of consuming a meal high in
total antioxidants, returning to baseline levels after a few more hours.

        Scientists measure the potential of a given food to neutralize free radicals in the body through a
number of methods. Most strive to estimate a food’s total antioxidant capacity (TAC). This is a measure
of the combined ability of all antioxidants in a given food to neutralize free radicals. Many laboratories,
including several funded by the U.S. Department of Agriculture (USDA), are working now to more
accurately calculate the TAC of common foods and typical diets, a process that will take many years of
effort.

 Average daily intake and                  More research is also needed to estimate optimal antioxidant
 absorption of antioxidants       intakes. Existing evidence, however, suggests that most Americans
 needs to double or triple        are consuming and absorbing a sub-optimal level of antioxidants, and
 for the average consumer to      that average total daily absorption would need to double or triple for
 benefit fully from the health-   people to benefit fully from the health-protective potential of plant
 protective potential of plant    antioxidants.
 antioxidants
                                          We know of four ways for people to consume and absorb higher
                                  levels of antioxidants as part of their daily diets:
             •    Consume more fruits and vegetables;
             •    Choose fruits and vegetables that contain relatively higher levels of antioxidants per
                  serving;

                                                     2
Elevating Antioxidant Levels in Food                                                     The Organic Center

            •   Improve the health of their gastrointestinal tracts in ways that improve absorption of
                ingested dietary antioxidants;
            •   Consume foods that are grown, processed and prepared in ways that increase antioxidant
                levels in foods at harvest, and then preserves those levels as food moves from the farm to
                consumers.

        USDA and the Department of Health and Human Services have just revised their Dietary
Guidelines for Americans. Since 1995, the agencies have recommended three to five servings of
vegetables and two to four servings of fruits, for a total of five to nine servings of fruits and vegetables
every day. Vegetable servings are defined as one cup of raw leafy vegetables; 1/2 cup cooked or chopped
vegetables; one ounce of vegetable chips; or 3/4 cup vegetable juice. Fruit servings are defined as
one whole fruit, such as a medium apple, banana, or orange, a grapefruit half; 1/2 cup berries, melon
or chopped raw fruit; 1/2 cup cooked or canned fruit; 1/4 cup dried fruit; or 3/4 cup fruit juice. For
children two to five years old, one serving is two-thirds of the standard size.

         The revised dietary guidelines call for two cups of fruit and 2.5 cups of vegetables for a
typically 2,000 calorie diet, or about six to nine servings. The National Cancer Institute’s “Five-A-Day”
promotional campaign supports this revision. Americans are now eating on average about 3.3 servings
of vegetables and 1.5 servings of fruit (USDA, 1997).

         Eating more servings of fruits and vegetables is among the best ways to increase antioxidant
intake; seeking out antioxidant-rich foods is another step in the right direction. The health of a person’s
gastrointestinal tract can have a big impact on antioxidant bioavailability. Most flavonoids, including many
antioxidants, are glycosylated (bound with some form of sugar),
which limits their bioavailability (Scalbert et al., 2000a). Most      Organic farming methods
flavonoids become bioavailable after enzymes strip off the sugar can increase concentrations of
in a metabolic process called deglycosylation.                         antioxidants in vegetables, fruits,
                                                                      grains, and dairy products, and
        The fourth general strategy to increase antioxidants          in this way help people elevate
in the diet is to seek out foods grown and processed in ways          their daily antioxidant intake
that maximize and retain antioxidant concentrations. Organic          without a proportional rise in
farming methods can increase concentrations of antioxidants           calories.
in vegetables, fruits, grains, and dairy products, and in this way
help people elevate their daily antioxidant intake without a
proportional rise in calories.

         This State of Science Review focuses in particular on the potential of organic farming methods
to increase average antioxidant levels in foods. By increasing concentrations of antioxidants in vegetables,
fruits, and grains, organic farming methods can help people increase their antioxidant consumption
without a proportional increase in caloric intake. Adopting food-processing technologies and cooking
methods that naturally help retain a higher percentage of the antioxidants in foods offers perhaps the
most significant near-term opportunity to increase average daily antioxidant intakes.

                                                      3
Elevating Antioxidant Levels in Food The Organic Center
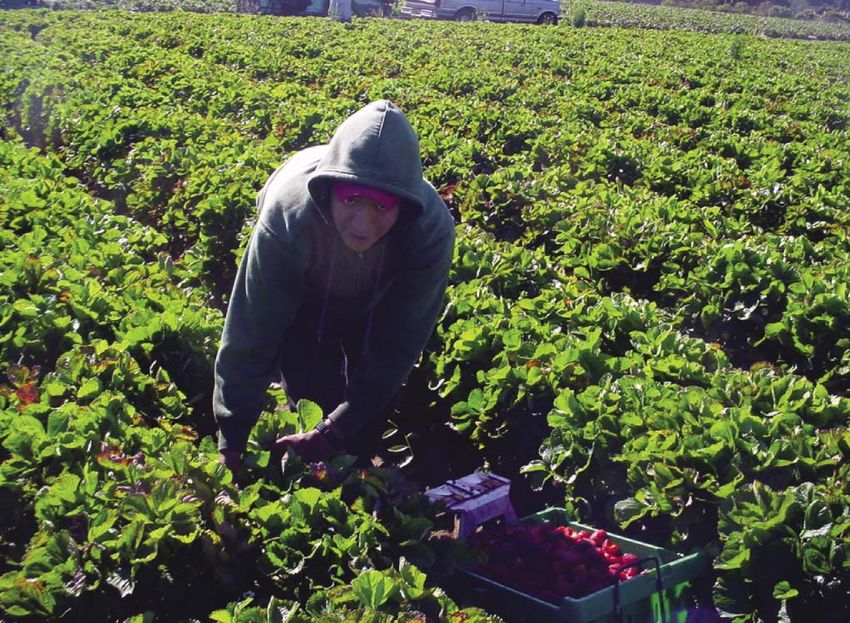
Strawberry harvest in a field of organic berries near Watsonville, CA. Ripeness at harvest is a key variable influencing
both vitamin and antioxidant levels.
TERMINOLOGY, METHODS AND SOURCES OF DATA
The tools, concepts, and insights from several fields of science are needed to unravel the role of
dietary antioxidants in improving human health. The range of disciplines essential to developing such
understanding encompasses most of the biological and agricultural sciences, the medical profession,
nutrition science, and food science and technology. An essential place to start is by reviewing the
terminology of secondary plant metabolites, polyphenols, and antioxidants.
Terminology
There are likely far more than 50,000 secondary plant metabolites and some 4,000 flavonoids
(Daniel et al., 1999), many of which are antioxidants. Scientists in dozens of disciplines are actively
researching the role of secondary plant metabolites in promoting plant and animal health. Many
different classification schemes, criteria, and terms have been developed and are encountered in the
literature describing the chemical structures, properties, and biological functions of polyphenols and
antioxidants.
The voluminous literature on secondary plant metabolites and antioxidants can be confusing.
One paper will call a given chemical an antioxidant, another might call it an antioxidant polyphenol,
4
Elevating Antioxidant Levels in Food                                                     The Organic Center

and a third will use the phrase “a flavonoid with antioxidant potential.” Others call antioxidants
“phytochemicals.” The box Antioxidant Terminology strives to help non-experts weave their way through
the diverse language used to classify and discuss antioxidants and secondary plant metabolites.

                                       Antioxidant Terminology

         Secondary plant metabolites are a diverse group of naturally produced chemicals that usually possess
no obvious primary function in plant cell growth. They are synthesized by plants in response to external
stimuli and often play some regulatory function in a cascade of physiological and metabolic reactions
to stress or pest attacks. When a biological function is discovered for a secondary plant metabolite, it is
typically relabeled as a vitamin (Brandt et al., 2001).

        Polyphenols encompass several classes of weakly acidic chemicals related to, or built upon the
phenyl ring. Polyphenols contain one or more phenolic hydroxyl groups directly attached to these
carbon-based aromatic phenyl-ring compounds. These are easily oxidized to quinones by reactive oxygen
species, a property that helps account for their free radical scavenging capacity.

        Polyphenols have diverse functions in plants and are a major class of secondary plant metabolites.
The major plant polyphenol by volume is lignin (Daniel et al., 1999). Plant polyphenols may have
beneficial and/or detriment effects on mammals. After plants die, phenolic compounds can persist for
weeks and affect decomposition. They also have an impact on the shelf life of harvested produce.

       Antioxidants are chemicals that oppose or neutralize oxidation in cells. Some of the most
important are essential vitamins for which the Food and Drug Administration has established
Recommended Dietary Allowances, or RDAs.

        Many, but not all, secondary plant metabolites are antioxidants. Normal physiological processes
synthesize most of the antioxidants in the human body at any one time, while the balance comes from
food. All dietary sources of antioxidants come from secondary plant metabolites. Some are polyphenols;
other important ones are not, like alpha- and beta-carotene and lycopene. These important carotenoid
antioxidants lack the phenolic ring structures that characterize polyphenols. Antioxidants in milk and
dairy products come from the antioxidants and polyphenols in the grass, forage, and grains consumed by
cattle.

       Antioxidants scavenge free radicals by inhibiting reactions within cells brought about by dioxygen
or peroxide molecules, also called reactive oxygen species, or ROS, as well as by reactive nitrogen species.
The total supply of antioxidants circulating in the body is the sum of antioxidant enzymes and acids
manufactured by the body plus antioxidants consumed in foods.

        The body manufactures a number of antioxidant enzymes including gluthathione, a tripeptide
consisting of glycine, cysteine, and glutamate; glutathione peroxidase; superoxide dismutase; and catalase.
A number of chemicals produced in the brain are also antioxidants. Glutathione peroxidase, together
with glutathione, neutralizes hydrogen peroxide, a common free radical, through a reaction that produces
water. The body manufactures gluthathione from the amino acid glutamate, and glutathione peroxidase is
manufactured from gluthathione. Most antioxidants are beneficial in certain ways within a defined range
of doses, yet at high doses, some can be damaging, or lead to no known biological effect. Many, and
probably most, antioxidants can also function as pro-oxidants when they exist with an unpaired electron
                                                     5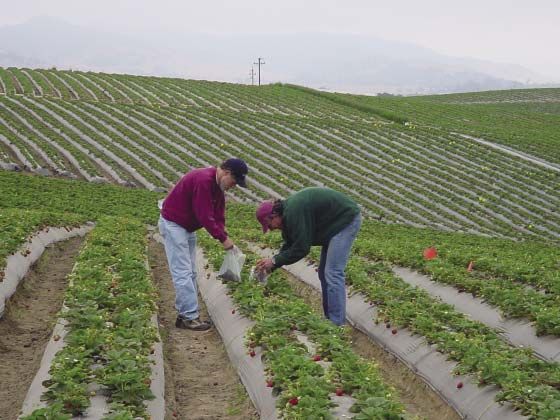
Elevating Antioxidant Levels in Food                                                   The Organic Center

after donating electrons to reactive oxygen species.

        Flavonoids, also sometimes called bioflavonoids, are secondary plant metabolites, the majority
of which function as antioxidants at the levels commonly found in foods and beverages. Flavonoids
encompass a very large and widespread array of water-soluble phenolic derivatives. Some are brightly
colored. They are found in the vacuoles of plant cells and are classified by the oxidation state of their
pyran ring (part of their chemical structure). There are about a dozen recognized classes of flavonoids.
These include flavonols and flavones (typically yellow pigments in plants), flavanones, and isoflavones (a
major flavonoid in soybeans). A flavan is the parent ring structure on which the chemical structures of
most flavonoids are based.

                                               All secondary plant metabolites and flavonoids are
 The body produces several             phytochemicals, but the reverse is not necessarily true. Some
 antioxidants that search for free     antioxidants, like resveratrol, are phytoalexins, which are low
  radicals and detoxify them by        molecular weight, lipophilic compounds that accumulate at sites
 supplying the missing electron.
                                       of pathogen infection.
 Antioxidants consumed in food
 do the same thing, reinforcing this
 vital health-promoting function.               Some secondary plant metabolites are anti-nutrients,
                                        which are compounds that make proteins or other essential
                                        nutrients less bioavailable to humans.

         How do all these terms used to describe secondary plant metabolites with antioxidant potential
relate to each other?

        One set of terms classifies chemicals produced by metabolic processes in plants according to
the biological activity or function of the chemical in the plant. Major classes of plant chemicals include
enzymes, hormones, and proteins. The term phytochemical encompasses all these classes of chemical
compounds naturally produced by plants.

        Another set of terms classifies chemicals according to their biological activity or function in
mammals. The term vitamin refers to a plant compound that serves an essential function in humans,
which may be similar to or very different from the role the chemical plays in plants. The term antioxidant
is another example – it describes a class of chemicals that share the capacity to scavenge and neutralize
free radicals in mammalian systems. Antioxidants are essential compounds in all organisms: plants,
mammals, fungi, bacteria, etc.

        Other terms classify secondary plant metabolites according to their chemical structure. These
terms include polyphenol and flavonoid. Still other terms classify chemicals based on the type of reaction
that produces them or their principle role in, or relation to, common chemical reactions. For example,
terms such as polymer, monomer, stereoisomer, glycoside, and aglycone (the non-carbohydrate portion
of a molecule that is left after the glycoside is stripped off via hydrolysis) describe chemicals that have
been involved in particular, common chemical reactions.

        So What’s a Free Radical?

        Free radicals are oxygen-based or nitrogen-based molecules with unpaired electrons that are
generated by a number of metabolic processes within the body. For example, when the body turns
foods into energy, free radicals are formed by normal oxidation reactions. Vigorous exercise increases

                                                       6
Elevating Antioxidant Levels in Food                                                     The Organic Center

free radical production, as does inflammation, exposure to certain chemicals, cigarette smoke, alcohol, air
pollutants and high-fat diets.

         As one free radical interacts with another molecule, in effect stealing part of it, a new free
radical is created. These reactions often occur in or near cell membranes and can erode the cell’s internal
integrity. Some free radicals target mitochondria inside cells, affecting their energy-producing capability.
Other free radicals attack DNA.

        To keep this cycle from spinning out of control and causing dangerous cellular damage, the body
produces several natural antioxidants, which are compounds that search for free radicals and detoxify
them by supplying the missing electron. Plant-based foods also contain antioxidants, which complement
the antioxidants produced by the body. When ingested, some portion of plant antioxidants is absorbed in
the gut lining and enters the bloodstream.

        Reactive oxygen species encompass both true free radicals and molecules with paired electrons
like hydrogen peroxide. Other important reactive oxygen species include singlet oxygen and superoxide
anions, hydroxyl, and peroxyl radicals. Free radicals and reactive oxygen species cause cell damage, trigger
inflammation, and promote abnormal cell growths, including many kinds of cancer. Antioxidants help
prevent tissue damage by combining with free radicals and neutralizing them.

        Measuring Antioxidants in Foods

        A wide range of factors can influence the mix of polyphenols and antioxidants that a plant
manufactures, as well as the levels the plant produces at any given point. These factors include soil type
and chemistry, available nitrogen and levels of other plant nutrients, moisture levels, temperature, and
pest pressure (Brandt et al., 2002; Daniel et al., 1999; Romero et al., 2004b; Wang et al., 2000; Wang et al.,
2002). In general, factors that impose stress on plants tend to trigger a plant’s innate defense mechanisms
and these mechanisms are driven by and/or entail the synthesis of antioxidants.

         Phenolic antioxidants are present in plants at concentrations up to several grams per kilogram
(Daniel et al., 1999). In general, levels are higher in the rinds and skins of produce compared to levels in
the fruit. A number of chemical assays have been developed to measure different antioxidants. Others
are designed to measure total antioxidant capacity, or TAC. In vitro assays are designed to test antioxidant
levels in foods, while other assays measure levels in blood (Erlund et al., 2001; Noroozi et al., 2000),
lymphocytes (Anderson et al., 2001), or urine (Atkinson et al., 2002; Karr et al., 1997; Milbury et al.,
2002; Nielsen et al., 2002).

          A number of thorough reviews have compared the strengths and weaknesses of different
assays, each of which is uniquely suited to detect and accurately measure certain polyphenols, or
certain derivatives of phenolics in certain tissues or media, but no assay is universally accurate (Boxin
et al., 2004; Cao et al., 1998; Frankel 1989; Sanchez-Moreno 2002). Many authors report results on
polyphenol and antioxidant activity in foods compared to the findings of other teams using different
methods. Sometimes correlation coefficients are reported. These reflect the degree of agreement across
assays when testing the same food for a given polyphenol or total antioxidant activity. For example, a
Norwegian team calculated total antioxidant capacity of a wide range of foods in the typical Norwegian
diet using the FRAP (ferric reducing ability of plasma) assay (Halvorsen et al., 2002). They reported
a 0.951 correlation coefficient with the results of Wang et al. (1996) on 12 fruits, and correlation

                                                     7
Elevating Antioxidant Levels in Food The Organic Center
coefficients ranging from 0.79 to 0.13 for ORAC (Oxygen-
Because the biochemistry of Radical Absorbance Capacity) values based on three different
antioxidants is so complex and free radicals (ROO’, OH’, and CU++).
dynamic, it is hard to calculate
the portion of total antioxidants The measurement of antioxidants is complicated because
in a person that is manufactured
the biochemistry of antioxidants is so complex. Plants have
by the body (endogenous
antioxidants) in contrast to
multiple mechanisms to produce and metabolize antioxidants,
the share from dietary sources just as mammals do. The diversity of polyphenolic secondary
(exogenous antioxidants). plant metabolites reflects the many differences in the carbon
skeletal structure of phenolic molecules, as well as differences
in their oxidative state (Scalbert and Williamson, 2000). In
addition, antioxidants in foods and in people are continuously
changing form and even function as a result of glycosylation (reactions with sugar molecules),
hydroxylation of aromatic phenolic rings, through polymerization, and as a result of the biosynthesis of
various stereoisomers.
Because there are so many sources of antioxidants — both from inside the body and from foods
— and because antioxidants are continuously reacting with other molecules and tissues and changing
form, it is hard to sort out the portion of total antioxidants in a person’s body that is manufactured
by the body (endogenous antioxidants) in contrast to the share from dietary sources (exogenous
antioxidants). However, much is known about the relative roles and importance of endogenous and
exogenous sources of antioxidants:
• Despite our endogenous antioxidant defense system, two dietary antioxidants (vitamins C and
E) are essential for life, and several dietary minerals (iron, copper, selenium, zinc) are required
as antioxidant enzyme cofactors.
• The effectiveness of endogenous defenses (especially the antioxidant enzymes) declines with
age, increasing the importance of dietary sources of antioxidants in older adults.
• All dietary antioxidants, including the polyphenols, have other mechanisms of action besides
and beyond the quenching of free radicals; some of these mechanisms appear important in
their health-promoting biological activities.
• Dietary antioxidants cannot substitute for one another, e.g., consuming more vitamin C will
not displace the need for vitamin E or replace the action of quercetin.
• The bioavailability of antioxidants is critical for systemic defenses throughout the body, but
being bioavailable is not the only way that antioxidants can promote health. Antioxidants
in the gut lumen and those that become attached to the gut wall may be important for
gastrointestinal defenses and detoxification, and in this way help prevent colorectal cancer
and inflammatory bowel diseases.
Characterization and Sources of Data on Antioxidants in Foods
A thorough review article on polyphenols appears in the May 2004 issue of the American Journal
of Clinical Nutrition (Manach et al., 2004). The authors review both sources and levels in the diet by major
class of polyphenols, as well as factors having an impact on bioavailability. The authors point out that, in
addition to their beneficial activity as antioxidants, polyphenols also can regulate biological processes in a
number of other ways, many of which are just beginning to be studied.
The article describes polyphenols as secondary plant metabolites containing several hydroxyl
groups arranged on aromatic rings. The authors note that several thousand polyphenols have been
8Elevating Antioxidant Levels in Food The Organic Center
identified and several hundred are known to appear in edible portions of foods. Common classes are
phenolic acids, stilbenes, lignans, and flavonoids,.
Phenolic acids occur in two classes: derivatives of benzoic acid or cinnamic acid.
Benzoic Acid Derivatives Cinnamic Acid Derivatives
Protocatechuic acid Coumaric acid
Gallic acid Caffeic acid
Ferulic acid
These phenolic acid derivatives in turn combine with sugars to become glycosylated. Caffeic
and quinic acids, for example, combine to form chlorogenic acid, a compound that is found in many
fruits and in coffee (Manach et al., 2004). Caffeic acid is generally the most abundant phenolic acid and
accounts for between 75 percent and 100 percent of the total hydroxycinnamic acid content of most
fruits, with the highest concentrations typically in the outer parts of ripe fruits. Since these chemicals play
a role in plant defense mechanisms, it makes sense that plants generally express the highest levels at the
point of initial attack by both insects and fungal or bacterial pathogens — that is, the skin of fruits.
Ferulic acid is the most common phenolic acid in cereal
Plants are thrifty and generally grains, which account for most dietary intake of this phenolic
express the highest levels of acid and as much as 90 percent of total polyphenol content
polyphenols and antioxidants at of wheat (Manach et al., 2004). Wheat bran is a particular rich
the point of initial attack by both
source of ferulic acid (Scalbert and Williamson, 2000), where it
insects and fungal or bacterial
pathogens — on or in the skins of
is found mostly in the outer parts of the grain. Hence, ferulic
fruits and vegetables. acid levels are far lower in baked foods derived from highly
processed flour. The health benefits of wheat germ and bran are
likely in part due to their relatively high concentrations of ferulic
acid.
Linseed is the major source of lignans in the diet, although several other cereals, legumes and
vegetables contain low levels.
Stilbenes are found in only low quantities in the human diet. Resveratrol is the most widely studied
stilbene and may have anticarcinogenic activity (Manach et al., 2004).
Flavonoids share a common chemical structure – two aromatic rings that are bound together by
three carbon atoms that form an oxygenated heterocycle. Flavonoids are further divided into six classes:
Flavonols
Flavones
Isoflavones
Flavonols (catechins and proanthocyanidins).
Flavanones
Anthocyanidins
Flavonols are the most common flavonoids in foods, with quercetin and kaempferol being by far
the most abundant (Manach et al., 2004). They are generally present at relatively low concentrations on
the order of 15 to 30 mg/kg of fresh weight. The richest sources of flavonols are onions, kale, leeks,
broccoli, and blueberries. These polyphenols are almost always present in glycosylated forms. Fruits often
9Elevating Antioxidant Levels in Food The Organic Center
contain five to 10 different glycosylated forms of a given flavonol.
Flavonol concentrations are highest in or near the peel of fruits since their biosynthesis is
stimulated by light. Levels of flavonols in fruits from the same tree or shrub can vary significantly and
reflect the intensity of light energy reaching the fruits; levels are often higher on an exposed side of an
individual fruit than on its shaded side. In green leafy vegetables, the outer leaves often contain flavonol
concentrations more than 10 times the concentrations found in inner leaves. As a result of this pattern
of concentration in fruits and vegetables, consuming the outer portions of produce is a key strategy in
increasing flavonol intake.
Smaller fruits of the same species, compared to larger fruits, tend to have higher concentrations
of flavonols in part because of the relationship between surface area and fresh weight. The larger the
fruit, the less skin area there is per gram of fruit weight.
Parsley and celery are the only two known important sources of flavones in fruits and vegetables.
Citrus rind contains significant flavones, but is generally not consumed. Some grains contain low levels
of flavones.
Isoflavones are found almost exclusively in legumes, with soybeans and processed soybean
products being the major dietary source. Isoflavones are phytoestrogens which can mimic the function
of hormones in the human body (Manach et al., 2004). The three most common molecules forming
isoflavones are genistein, daidzein, and glycitein, each of which can appear in one or more of four
forms. Processing has a major impact on the relative concentration of the different forms of isoflavones.
Isoflavone levels vary widely, from 580 mg/kg fresh weight in whole beans, to 30 to 175 mg/liter in
soymilk.
Flavonols exist in both the monomer form (catechins) and polymer form (proanthocyanidins).
The highest concentrations of catechins are present in green tea and chocolate. Apricots are the richest
source of catechins among fruits, containing 250 mg/kg of fresh weight. Red wine is another major
source. Catechins are not glycosylated and are remarkably stable in most foods (Scalbert et al., 2000b).
Proanthocyanidins are also known as condensed tannins. There are different chemical forms
of catechins (dimeric, oligomeric, and polymeric), which react with salivary proteins and produce
the astringent taste of many fruits and beverages. As fruit ripens, the degree of astringency declines
proportional to changes in proanthocyanidin levels. Because proanthocyanidins appear in so many forms,
and their degree and form of polymerization change continuously as fruits ripen, it is hard to measure
total levels in many foods.
Flavanones are found mostly in citrus fruits and tomatoes. Mint is also a source. Orange juice is a
major dietary source of the flavanone hesperidin. A single glass may contain between 40 and 140 mg of
flavanone glycosides, but consuming the same amount of whole fruit will deliver as much as five times
more total flavanone because of the relatively higher concentrations in the pulp of the fruit compared to
juice.
Anthocyanins are pigments that give fruits and vegetables their color, although some are colorless.
Anthocyanins can change color as a function of pH. Food concentrations of cyanidin, the most
abundant anthocyanin, is generally proportional to intensity of color and can occur at 24 mg/kg of fresh
10Elevating Antioxidant Levels in Food The Organic Center
weight. Levels increase as fruits ripen and are highest in the skins and peels of produce.
In general, most foods contain multiple flavonoids and their characterization is incomplete
(Manach et al., 2004). In addition, their chemical form, glycosylation status, and degree of polymerization
are often in a state of flux. Hence, measuring levels of
specific flavonoids, or total flavonoid, phenolic or antioxidant
content, is like taking a snapshot of a rapidly moving target Measuring levels of specific
that is also changing form and function. flavonoids or total antioxidant
content in food or the human body
In general, according to Manach et al. (2004), phenolic is like taking a snapshot of a
acid concentrations decline with ripeness, while anthocyanin rapidly moving target that is also
levels increase. Phenolic acids are directly involved in changing form and function.
responses to external stress, like pests, and they contribute to
healing by lignification of wounded plant tissues. Manach et
al. say:
“Although very few studies directly addressed the issue, the polyphenol
content of vegetables produced by organic or sustainable agriculture is
certainly higher than that of vegetables grown without stress, such as
those grown in conventional or hydroponic conditions.”
A Primer on Accessing Information on Antioxidants in Specific Foods
There are several databases that include the levels of selected and total antioxidants in a variety
of foods. USDA has been funding work to establish a national baseline of antioxidant levels in common
foods, as part of the National Food and Nutrient Analysis Program (NFNAP). A comprehensive study
of antioxidants in common foods by a team of USDA scientists has been published (Wu et al., 2004).
The data have also become a part of NFNAP and is accessible through the USDA Nutrients Data
Laboratory http:www.nal.usda.gov/fnic/foodcomp.
The “USDA Database for the Flavonoid Content of Selected Foods – 2003” contains
information on five subclasses of flavonoids (accessible at http://www.nal.usda.gov/fnic/foodcomp/
Data/Flav/flav.html):
• Flavonols: quercetin, kaempferol, myricetin, isorhamnetin
• Flavones: luteolin, apigenin
• Flavanones: hesperetin, naringenin, eriodictyol
• Flavan-3-ols: (+)-catechin, (+)-gallocatechin, (-)-epicatechin, (-)-epigallocatechin, (-)-epicatechin 3-
gallate, (-)-epigallocatechin 3-gallate, theaflavin, theaflavin 3-gallate, theaflavin 3’-gallate, theaflavin
3,3’ digallate, thearubigins
• Anthocyanidins: cyanidin, delphinidin, malvidin, pelargonidin, peonidin, petunidin
USDA’s flavonoid website contains a March 2003 report in Adobe Acrobat format that reports
the levels of the above flavonoids in hundreds of foods (http://www.nal.usda.gov/fnic/foodcomp/
Data/Flav/flav.pdf). The same data are also accessible in a Microsoft Access database (http://
www.nal.usda.gov/fnic/foodcomp/Data/Flav/flav.mdb), allowing users the ability to create their own
tables and input additional values. Table 1 presents information on major antioxidant flavonoids and total
antioxidant potential in typical servings of a sample of foods, and draws on this USDA database and Wu
et al. (2004)
11Elevating Antioxidant Levels in Food The Organic Center
Table 1. Levels of Common Flavonoids in Selected Foods (mg/100 grams, edible
portion) and Total Antioxidant Content of Food per Typical Serving (see notes)
Total Antioxi-
Fresh Food Quercitin Kaempferol Epicatechin Catechin dant Capacity
per Serving
Apples 4.42 0 8.14 0.95 5,900
Beets 0.13 0 0 0 1,886
Blackberries 1.03 0.08 18.08 0.66 7,701
Blueberries 3.11 0 1.11 0 13,247
Broccoli 3.21 6.16 0 0 982
Celery 0.07 0 0 0 741
Carrots 3.50 0 0 0 344
Cranberries 14.02 0.09 4.2 0 8,983
Cucumbers 0.04 0.06 0 0 60
Green Peppers 0.65 0 0 0 664
Lettuce 2.47 0.07 0 0 1,213
Onions 19.93 0.89 0 0 1,281
Peaches 0 0 0 2.33 1,826
Pears 0.42 0 3.17 0.26 3,172
Plums 1.20 0 2.84 3.35 4,844
Potatoes 0.01 0.05 0 0 4,882
Raspberries 0.83 0 8.26 0.97 6,058
Red Grapes 3.54 0 1.95 0 2,016
Spinach 4.86 0.01 0 0 1,056
Strawberries 0.65 0.79 0 4.47 5,938
Sweet Cherries 1.25 0 9.53 2.17 4,873
Tomatoes 0.57 0.07 0 0 552
Notes: Flavonoid levels are from the “USDA Database for the Flavonoid Content of Selected Foods.” “Total
Antioxidant Capacity per Serving” is from Table 1 (Wu et al., 2004). The highest value reported for a food was
selected in cases where multiple values appear in the table.
An Internet resource, “Dr. Duke’s Phytochemical and Ethnobotanical Databases,” provides easy
access to a list of the chemicals found in nearly all agronomic plants, the biological activities of each
chemical, and the amounts of various chemicals typically found in a given plant. It is compiled by James
Duke, Ph.D., a botanist and former chief of the National Germplasm Resources Laboratory at USDA.
The database is freely accessible at http://www.ars-grin.gov/duke/.
Duke’s databases are searchable by chemical name, plant species, and biological activity. A search
on “tomato” yields a list of hundreds of chemicals. Clicking on any chemical in the list leads to more
detailed information on that chemical’s biological activities and concentrations in various other plants.
For example, under lycopene, the database lists 16 categories of biological activities associated with
lycopene intake. More than two-dozen plants with relatively high levels of lycopene are listed, from
highest concentration to least (or unknown concentration).
12Elevating Antioxidant Levels in Food The Organic Center
Variability in Polyphenol and Antioxidant Levels in Food
Steady progress has been made in developing more accurate methods to measure polyphenol
and antioxidant content as it fluctuates up and down. Polyphenol/antioxidant content and dynamics
are relatively well known in several key crops, including apples, strawberries, spinach, soy products and
tomatoes. Several foods that are major sources of a particular polyphenolic compound have also been
extensively studied. Examples of well-studied food-polyphenol combinations include resveratrol in red
wine grapes, catechins in tea, naringenin in citrus products, lycopene in tomatoes, and isoflavones in soya
products.
Still, major analytical challenges remain. The authors of a comprehensive review of polyphenol
sources and bioavailability conclude that, “With the current state of knowledge, it is extremely difficult to
determine for each family of plant products the key variables that are responsible for the variability in the
content of each polyphenol and the relative weight of those variables” (Manach et al 2004).
It is clear that, across the U.S. population, a relatively small number of foods account for
a significant portion of the typical person’s dietary intake of total polyphenols, flavonoids, and
antioxidants. Scientists developing food-antioxidant data for USDA’s National Food and Nutrient
Analysis Program recently published an article with up-to-date results on more than a hundred foods.
They broke the foods tested into four categories based on hydrophilic Oxygen-Radical Absorbance
Capacity (H-ORAC) values per serving, using USDA’s standard reference guide to define a serving size
(Wu et al., 2004). The four groups of foods had H-ORAC scores per serving as follows:
Very High — between 2,000 and 14,000 H-ORAC units (umol of Trolox Equivalent [TE]/
serving);
High — 1,000 to 1,999 H-ORAC units/serving;
Moderate — 500 to 999 H-ORAC units/serving; and
Low — Zero to 499 H-ORAC units/serving.
Common foods in each of these four groups are noted in Table 2 (“Very High” and “High”
group foods) and Table 3 (“Moderate” and “Low” group foods), based on the data provided in Wu et al.
(2004). The foods within each group are ranked from highest to lowest H-ORAC units within the group.
The table also contains the average serving size in grams, calories per serving, and H-ORAC units per
calorie. The last column reports the ranking across all foods of H-ORAC units per calorie. This measure
of “antioxidant bang per calorie” can be used to help guide the selection of high antioxidant foods for
people also working to reduce caloric intake.
13Elevating Antioxidant Levels in Food The Organic Center
Table 2. Common Foods in the “Very High” and “High” Categories or Antioxidant Capacity Ranked by H-
ORAC Units per Serving: Average Serving Size, Calories per Serving, and ORAC per Calorie (see Notes)
Ranking of
Serv- H-ORAC H-ORAC H-ORAC
Antioxidant Category Typical Calories Foods by H-
ing Size Units per Units per Units per
and Fresh Food Serving per Serving ORAC Units
(grams) gram Serving Calorie
per Calorie
Very High
Blueberry, wild 145 1 cup 92.09 13,353 54 247 1
Artichoke, cooked 84 1 cup hearts 92.77 7,793 42 186 2
Black Plums 88 1 fruit 73.01 4,819 30 161 3
Broccoli Raab, raw 85 1/5 bunch 28.10 2,389 19 126 5
Blackberry 144 1 cup 52.45 7,553 62 122 6
Strawberry 166 1 cup 35.41 5,878 53 111 7
Blueberry, cultivated 145 1 cup 61.84 8,967 83 108 8
Cabbage, Red, cooked 75 1/2 cup 31.46 2,360 22 107 9
Raspberry 123 1 cup 47.65 5,861 64 92 13
Apple (Red Delicious) 138 1 med. fruit 42.34 5,843 72 81 14
Apple (Granny Smith) 138 1 med fruit 38.60 5,327 72 74 15
Sweet Cherry 145 1 cup 33.44 4,849 91 53 19
Bean, Red Kidney 92 1/2 cup 144.04 13,252 310 43 23
Navel Orange 140 1 fruit 17.85 2,499 69 36 24
Prune 85 1/2 cup 83.99 7,139 204 35 28
Bean, Pinto 96 1/2 cup 119.37 11,460 333 34 29
Pear, Red Anjou 166 1 med fruit 17.38 2,885 96 30 31
Grape, Red 160 1 cup 12.60 2,016 110 18 38
Potato, Russett, cooked 299 1 potato 15.27 4,566 290 16 45
Raisin 82 1/2 cup 30.02 2,462 243 10 48
Averages 53.5 6,063 116 84.5
High
Asparagus, raw 67 1/2 cup 29.15 1,953 13 150 4
Lettuce, Red Leaf 68 4 outer leaves 16.5 1,122 11 102 10
Asparagus, cooked 90 1/2 cup 16.44 1,480 20 74 16
Beet 68 1/2 cup 27.65 1,880 29 65 17
Grapefruit, Red 123 Half 15.13 1,861 37 50 20
Peach 98 1 med fruit 18.13 1,777 38 47 22
Pepper, Yellow 186 1 large pepper 9.56 1,778 50 36 25
Tangerine 84 1 med fruit 16.13 1,355 45 30 30
Onion, Yellow, cooked 105 1/2 cup 12.20 1,281 46 28 33
Apricot 105 3 fruits 13.09 1,374 50 27 34
Grape, Green 160 1 cup 11.18 1,789 110 16 41
Pineapple 155 1 cup diced 7.64 1,184 74 16 43
Potato, White, cooked 173 1 potato 10.41 1,801 114 16 44
Blackeyed Pea 52 1/2 cup 37.07 1,928 175 11 47
Almond 28 1 ounce 42.82 1,216 164 7 53
Low-fat Granola/raisins 60 2/3 cup 21.68 1,301 234 6 57
Toasted Oatmeal Cereal 49 1 cup 20.86 1,022 186 5 58
Averages 19.2 1,535 82.1 40.4
Notes: Serving size and H-ORAC units per gram from (Wu et al., 2004). Calories per serving from the USDA database on the nutrient composition of foods.
14Elevating Antioxidant Levels in Food The Organic Center
Table 3. Common Foods in the “Moderate” and “Low” Categories or Antioxidant Capacity Ranked by H-
ORAC Units per Serving: Average Serving Size, Calories per Serving, and ORAC per Calorie (see Notes)
Ranking of
Serv- H-ORAC H-ORAC H-ORAC Foods by
Antioxidant Catego- Typical Calories
ing Size Units per Units per Units per H-ORAC
ry and Fresh Food Serving per Serving
(grams) gram Serving Calorie Units per
Calorie
Moderate
Spinach, raw 40 4 leaves 22.2 888 9 99 11
Lettuce, Green Leaf 40 4 leaves 14.1 564 6 94 12
Broccoli, ccooked 78 1/2 cup 12.3 956 27 35 27
Carrot, raw 61 1 medium 11.6 705 25 28 32
Pepper, Green, raw 119 1 med pepper 5.4 647 24 27 35
Tomato, cooked 120 1/2 cup 4.3 511 22 23 37
Nectarine 136 1 fruit 7.2 979 60 16 40
Banana 118 1 fruit 8.1 959 105 9 51
Corn Flakes 30 1.5 cups 23 691 101 7 54
Oats, Quick (oatmeal) 40 1/2 cup 17.6 705 156 5 60
Oatmeal Raisin Cookie 31 1 Cookie 17.2 532 130 4 61
All Grain Butternut 28 1 slice 19.9 556 Unknown Unknown
Bread
Averages 13.6 724.5 60.5 31.6
Low
Cabbage, Common, raw 35 1/2 cup 13.4 469 8 59 18
Lettuce, Romaine 40 4 inner leaves 8.3 331 7 47 21
Celery 60 1/2 cup diced 5.3 320 9 36 26
Cauliflower 50 1/2 cup 6.1 305 12 25 36
Tomato, raw 123 1 med fruit 3.1 385 22 17 39
Pumpkin 116 1 cup cubed 4.1 480 30 16 42
Bean, Snap, canned 68 1/2 cup 2.1 140 10 14 46
Cucumber, no peel 60 1/2 cup 1.1 67 7 10 49
Peach, canned 98 1/2 can 4.2 411 43 10 50
Cantaloupe 160 1 cup cubed 3.0 475 54 9 52
Pea, Green, frozen 80 1/2 cup 5.1 404 62 7 55
Cucumber, with peel 52 1/2 cup sliced 0.9 45 8 6 56
Corn, canned 105 1/2 cup 3.6 379 83 5 59
Watermelon 152 1 cup cubed 1.2 187 46 4 62
Life Cereal 32 3/4 cup 14.2 455 120 4 63
Low-fat Chewy Granola 28 1 bar 14.7 410 109 4 64
Bar
Bean, Lima, canned 124 1/2 cup 2.2 267 190 1 65
Averages 5.4 325 48.2 16
Notes: Serving size and H-ORAC units per gram from (Wu et al., 2004). Calories per serving from the USDA database on the nutrient composition of foods.
15Elevating Antioxidant Levels in Food The Organic Center
Note the significant differences between the average H-ORAC units per serving and per calorie
across the four food groups:
Food Group Average H-ORAC Average H-ORAC
Units per Serving Units per Calorie
Very High 6,063 84.5
High 1,535 40.4
Moderate 724 31.6
Low 325 16
Clearly, increasing the average antioxidant capacity of foods in the “Very High” category of
foods by 10 percent will make a much larger contribution to rising antioxidant intakes than a 10 percent
increase in levels in foods in the “Moderate” or “Low” groups. A 10 percent increase in antioxidant
capacity in a serving of food in the “Very High” category would, on average, add about 600 H-ORAC
units to a person’s daily diet. It would take almost two additional servings of food in the “Low” category
to comparably increase daily antioxidant intake.
One additional serving of a food in the “Very High” category would deliver on average 18.6
times more antioxidant intake than an additional serving of food in the “Low” group of foods.
When foods are ranked by H-ORAC units per calorie, rather than in accord with the USDA’s
classification system used in Tables 2 and 3, the difference between the most antioxidant dense foods and
foods low in antioxidant content is even more pronounced. Table 4 presents such a comparison of the
top 10 foods ranked by H-ORAC units per calorie, along with the 10 foods at the bottom of this ranking.
The antioxidant-dense foods, ranked per calorie, deliver on average 34.5 times more antioxidants per
calorie than the average low-density antioxidant foods.
Table 4. Foods High in H-ORAC Units per Calorie Deliver Thirty-Five
More ORAC Units per Calorie Than Foods Low in ORAC Units
H-ORAC H-ORAC
Antioxidant Category Antiocidant Category
Units per Units per
and Fresh Food and Fresh Food
Calorie Calorie
VERY HIGH LOW
Blueberry, Wild 247 Cucumber, with peel 6
Artichoke, Cooked 186 Granola, Low-fat 6
Plums, Black 161 Toasted Oatmeal Cereal 5
Asparagus, Raw 150 Oats, Quick (Oatmeal) 5
Broccoli Raab, Raw 126 Corn, Canned 5
Blackberry 122 Oatmeal Raisin Cookie 4
Strawberry 111 Watermelon 4
Blueberry, Cultivated 108 Life Cereal 4
Cabbage, Red, Cooked 107 Low-fat Chewy Granola Bar 4
Lettuce, Red Leaf 102 Lima Bean, Canned 1
Average Top 10 Foods 142 Average Bottom 10 Foods 4
16Elevating Antioxidant Levels in Food The Organic Center
Dietary Intake of Polyphenols and Antioxidants
The average daily dietary intake of flavonoids in the United States has been estimated at about
one gram per person (Formica et al., 1995; Kuhnau 1976), with almost half coming from cola, cocoa,
beer, and wine. Fruits contributed a little less than one-third of daily consumption (Daniel et al., 1999).
Flavonol consumption has been studied more intensively than other types of flavonoids. A
detailed review article published in 2000 in the Journal of Nutrition estimated daily flavonoid and phenolic
intake at approximately one gram per day, with flavonols (catechins and proanthocyanidins) accounting
for the largest share (Scalbert et al., 2000a).
The authors note that fruits and beverages, including beer, wine, fruit juices, tea, and coffee,
are the major sources of antioxidants in the diet, with vegetables contributing important amounts of
certain specific flavonoids. The plasma concentration of antioxidants rarely exceeds 1 µmols (µmols, one
millionth of a mole) after consumption of 10 to100 milligrams (milligram, one thousandth of a gram)
of a single antioxidant (Scalbert et al., 2000a). This reflects the relatively tight regulation of plasma
antioxidant levels in the human body and helps explain why there is not a corresponding percentage
increase in plasma antioxidant concentrations as a function of percentage changes in intake, regardless of
the source (Manach et al., 2004).
Foods and beverages contribute roughly equally to total phenolic intake, with phenolic acids
accounting for about one-third and flavonoids for two-thirds, although the degree of coffee and/or tea
consumption by an individual significantly affects the relative contribution from foods and beverages
(Scalbert and Williamson, 2000). Vegetables were estimated to provide 218 milligrams (mg) of total
phenols per day in the U.S. diet (Vinson et al., 1998), an estimate regarded as probably high because of
the analytical methods used (Scalbert and Williamson, 2000). Fruits are universally regarded as a richer
source of phenolics in the diet than vegetables and other foods. Fruits often contain 1 to 2 grams of
phenolic compounds per 100 grams of fresh weight (Macheix et al., 1990).
A team of USDA scientists measured concentrations of proanthocyanidins in a wide range of
common foods, as part of a coordinated effort to establish a national baseline dataset on polyphenols in
foods. They used data from the 1994-1996 Continuing Survey of Food Intakes by Individuals (CSFII) to
estimate that average daily intake of proanthocyanidins is 57.7 mg per person (two years or older) (Gu
et al., 2004). Major sources in the diet are apples (32 percent), chocolate (18 percent), and grapes (18
percent).
A team of Norwegian scientists carried out a detailed study of total antioxidants in foods of
plant origin using the FRAP assay. Results are reported as µmols (one-millionth of a mole) per day. Total
dietary antioxidant intake in Norway was estimated as about 0.2 µmol per day. The following food groups
accounted for decreasing shares of this estimated total intake:
Fruits, 43.6 percent
Berries, 27.1 percent
Cereals, 11.7 percent
Vegetables, 8.9 percent
Root crops, 7 percent
Dried fruits, 1.5 percent
Pulses (i.e., legumes), 0.2 percent.
17Elevating Antioxidant Levels in Food The Organic Center
Consumption can vary greatly across the population. A study of Dutch dietary intake of
quercetin showed more than a 10-fold difference in average daily intake between the 10th and 90th
percentile cohorts (Hertog et al., 1993b). Consumption in the United States, Denmark, and Holland has
been estimated at 20 to 25 mg per day (Manach et al., 2004). Phenolic acid intake in Germany was found
to vary from 6 to 987 mg/day (Radtke et al., 1998). For people eating several servings of fresh fruits and
vegetables per day, Manach and co-authors (2004) project total polyphenol intake of at least 1 gram per
day.
Accurate estimates are now available for many distinct polyphenols in certain foods and
beverages in terms of concentrations per gram of food or liter of beverage, and overall dietary intake.
Tea polyphenols have, for example, been studied extensively (Beecher 2003). But given the difficulty of
quantifying polyphenol and antioxidant content in foods and the fact that many foods have not been
thoroughly tested, it is impossible to project accurately the average total polyphenol and antioxidant
intake in the U.S. diet. Bioavailability within the human digestive systems is even more complex to trace
and quantify.
The methods used to process fresh produce can have a significant impact on antioxidant
levels. By processing food at moderate temperatures and low pressure the loss of
antioxidants can be minimized.
Direct Measures of Antioxidants in the Human Body
When animals consume plant foods containing antioxidants, a whole host of factors influence
the bioavailability of these antioxidants, and another set determines the biological impact of that portion
of antioxidants that is absorbed into the body. Many other factors then influence the degree to which
antioxidants deliver health benefits. For example, antioxidants can interact with medicines; the health of a
person’s gut has an impact on uptake and biological response; and, metabolic or immune-system diseases
can either increase or decrease the impact of antioxidants.
Several studies point out that the polyphenols and antioxidants appearing at the highest
18You can also read