The global food system: Identifying sustainable solutions - June 2021
←
→
Page content transcription
If your browser does not render page correctly, please read the page content below

June 2021

Research
Institute
The global food system:
Identifying sustainable solutions

Thought leadership from Credit Suisse and the world’s foremost experts
Introduction

In my new role as Chairman of Credit Suisse,
I am delighted to introduce the first study from
the Credit Suisse Research Institute under my
tenure, with its accent firmly on sustainability.

Sustainability is, rightly so, a key component
of Credit Suisse’s strategy and culture, which
importantly shapes solutions we provide for our
clients.

“Investing with purpose” is the underlying
theme of our recently published investment
Supertrends. Aligned with such thinking, the
Credit Suisse Research Institute has been
tackling topics such as energy transition and
the consequences of growing water scarcity
in its recent studies. This report now throws a
spotlight on the global food system.

I hope you find our insights in this study valuable
and wish you a stimulating read.

António Horta-Osório
Chairman of the Board of Directors
Credit Suisse Group AG

2
02    Editorial

                                                                                       04    The investor view

                                                                                       05    The food system impacts all SDGs

                                                                                       06    The double burden of malnutrition

                                                                                       17    The environmental impact of food

                                                                                       33    Food loss and waste

                                                                                       43    Solutions
                                                                                             43 A change in diet
                                                                                             56 Company feature: Solar Foods
                                                                                             61 Company feature: Meatable
                                                                                             67 Smart agriculture
                                                                                             75 Company feature: Apeel
                                                                                             77 Circular economy, packaging and cooling
                                                                                             81 Company feature: Footprint
                                                                                             83 Regulation and support for farmers

                                                                                       90    Appendix 1: Assessing the economic
                                                                                             costs of malnutrition

                                                                                       92    Appendix 2: Alternative food companies

                                                                                       95    About the author

                                                                                       96    General disclaimer / important information

                                                                                       Author
                                                                                       Eugène Klerk
                                                                                       Global Head of ESG Securities Research
                                                                                       Credit Suisse International
                                                                                       eugene.klerk@credit-suisse.com
Cover photo: Getty Images, Sompong Sriphet EyeEm; photo right: Getty Images, alvarez

                                                                                       Contributors
                                                                                       Sara Carnazzi Weber
                                                                                       Daniel Rupli
                                                                                       Bahar Sezer Longworth
                                                                                       Pascal Zumbühl

                                                                                       For more information, contact:
                                                                                       Richard Kersley
                                                                                       Head of Global Research Product,
                                                                                       Credit Suisse Securities Research
                                                                                       richard.kersley@credit-suisse.com

                                                                                       Nannette Hechler-Fayd’herbe
                                                                                       CIO International Wealth Management and
                                                                                       Global Head of Economics & Research, Credit Suisse
                                                                                       nannette.hechler-fayd’herbe@credit-suisse.com

                                                                                       Credit Suisse Research Institute
                                                                                       research.institute@credit-suisse.com
                                                                                       credit-suisse.com/researchinstitute

                                                                                                The global food system: Identifying sustainable solutions   3
The investor view
This Credit Suisse Research Institute report on I expect governments and regulators to focus on
sustainable food provides a deep dive into the food and health to the same extent as on climate
challenges associated with the need to make change, inevitably triggering a new major trend.
the global food supply system more sustainable.
With the world’s population set to increase to Sustainability, now much more than a buzzword
about ten billion by 2050, it is clear to me that for many sectors, is a risk that companies must
a change in what we eat, how much we eat, adequately manage. And, as other sectors before
and how we produce food is paramount. For it, the food industry is going to be increasingly
businesses and investments, this will give rise to scrutinized by investors, consumers and regulators,
both opportunities and disruption. pushing it to focus more on sustainable food.
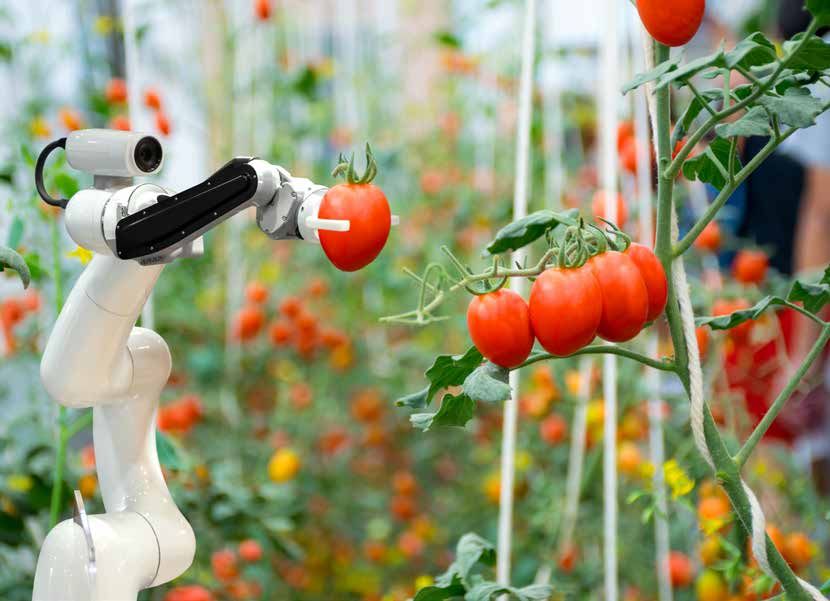
Changing diets Digital agriculture and circular solutions to
Our health is the single biggest driver of human address food loss and waste
longevity and productivity, as well as total labor As this report highlights, there are likely
input. Or, as I like to put it, it is our most valuable beneficiaries, too, including technology companies
asset. Yet the sad truth is that too many people, providing “smart-agricultural” solutions, for example.
though aware that they may not live healthily, Vertical farming could provide 80% of food demand
do not know how to begin the change. I have in urban areas, while precision farming through the
experienced first-hand the strong impact that use of artificial intelligence, drones, autonomous
a healthier diet can have by adhering to a few machinery and smart irrigation systems could yield
simple principles that are also highlighted in this productivity increases of 70% by 2050. Companies
report: avoid consuming sugary foods, processed that help address food waste and loss, for instance
foods, refined grains and trans fats, reduce using circular-based solutions, are likely to multiply.
consumption of meat and dairy, and increase the Moreover, smart-packaging solutions are being
intake of vegetables, natural vegetable fats and developed that not only improve production yields,
fibers. Adherence to these principles has been a but also help reduce food loss and waste across
game-changer in terms of my overall well-being. the entire supply chain, from farm to home. The
development and introduction of cooling and
Applying these principles on a broad scale is storage solutions would help extend the lifespan of
arguably a substantial challenge given people’s food even more.
lifestyle and eating habits and requires being
equipped and supported to do so. However, as The role of investors
this report outlines, it is a challenge that must be I am convinced that investors play a significant role
tackled given that the authors estimate the total in catalyzing these likely trends in how they deploy
cost of malnutrition to the global economy at their capital. This report provides an important
USD 13.6 trillion annually. starting point and reference with regard to the
different aspects that need to be considered. The
Food and the sustainability revolution rewards are ours to reap.
Addressing the challenges of feeding the planet
better and more sustainably first requires access
to better dietary education. Importantly, it also Michael Strobaek
means that healthy food must become more Global Chief Investment Officer
available and more affordable, as more than Credit Suisse
three billion people around the world are not
even able to afford a healthy diet. For this to
succeed, powerful lobbying groups must also be
challenged, in my view.
Unhealthy diets and eating habits are the root
cause of the unspoken pandemic of our day and
age, leading to various chronic diseases that cause
substantial human suffering and economic costs.
4
The food system
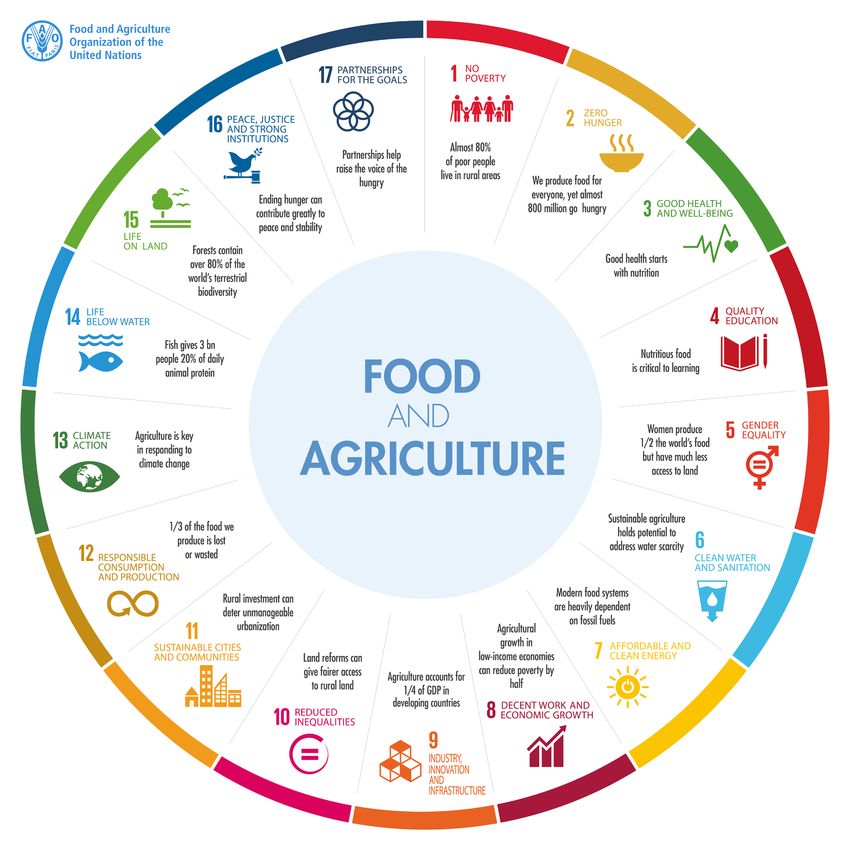
impacts all SDGs
The relevance of a sustainable food system to the UN Sustainable Development Goals
Source: The Food and Agriculture Organization of the United Nations (FAO)
The global food system covers all activities related to food production and consumption from “farm to fork.” A sustainable
food system is highly relevant in relation to the 17 Sustainable Development Goals as introduced by the United Nations in
2015. In fact, we agree with analysis done by the UN that all of its 17 SDGs benefit from a more sustainable food system.
To put it another way, meeting the 2030 targets associated with the SDGs appears highly unlikely in our view unless action
is taken to make the global food system more sustainable.
The global food system: Identifying sustainable solutions 5
The double burden
of malnutrition

A sustainable global food system benefits human health as well as the
global ecosystem. However, this is far from the reality at present as
almost 700 million people are undernourished, while at the same time
around 1.8 billion people globally are overweight or obese. The need to
change appears obvious to us as the impact of malnutrition alone costs
the global economy USD 13.6 trillion annually.

Demographics add pressure to the                        Figure 1: Population growth estimates (m)
challenge                                               12,000
                                                                                                                                                      491
                                                        10,000                                                                      425               680
We will highlight the current reasons why a shift
                                                                                                                                    762               630
in food production and consumption toward a                   8,000                                                369              710
more sustainable system is needed; however, it                                                   312               654                               4720
is important to understand that, if unaddressed,              6,000                                                748
                                                                                                 522                                5290
these challenges will significantly worsen in                                                    726
                                                              4,000                                                4641
the future, partly because of the potential                                                    3741
demographic changes that the world is likely to               2,000                                                                                  4280
                                                                                                                                    2489
experience this century.                                                                         811               1341
                                                                                   0
                                                                                               2000                2020             2050             2100
Estimates from the United Nations indicate that
                                                                    Africa                Asia     Europe     Latin America and the Caribbean   Northern America
the world’s population may increase from around
7.8 billion this year to almost ten billion by 2050,    Source: United Nations, Credit Suisse Research

and close to 11 billion by 2100. Figure 1 shows
how expected population growth is unevenly              Figure 2: Total calorie consumption globally
distributed around the world, with 93% of growth                                   25,000
                                                       Crop production (trillion

expected in the next three decades occurring in
                                                         calories per year)

lesser-developed Africa (59%) and Asia (34%).                                      20,000
The implications for food production cannot be                                                                             56% food gap
overstated, in our view.                                                           15,000
                                                                                                                                                   20,500
Estimates from the World Resource Institute                                        10,000                                                           trillion
                                                                                                       13,100                                      calories
(WRI) indicate that total food production (in                                                           trillion
terms of calories) needs to increase 56%                                               5,000           calories
between 2010 and 2050 in order to feed the
expected population. We note, however, that                                               0
these estimates are conservative given that they                                                  2010 (base year)                              2050 (baseline)
do not assume the calorie intake of consumers            Note: Includes all crops intended for direct human consumption, animal feed, industrial uses, seeds,
                                                         and biofuels. Source: WRI analysis based on FAO (2019a); UNDESA (2017); and Alexandratos and
across developing countries will converge fully          Bruinsma (2012)

6
Table 1: Scenario for animal food intake by region, 2010–50
Population (m) Total animal-based foods Ruminant meat (beef, sheep, goat)
Region 2010 2050 kcal/ kcal/ % change % of global kcal/ kcal/capita/ % % of global
capita/day capita/day per capita consumption capita/day day (2050) change consumption
(2010) (2050) (2010–50) – 2050 (2010) per capita – 2050
(2010–50)
European Union 528 528 772 858 11 10 68 71 4 7
USA and Canada 344 433 774 794 3 7 92 82 –10 6
Brazil 197 233 629 748 19 4 140 153 9 6
China 1,390 1,396 551 716 30 21 33 62 87 15
Former Soviet Union 288 298 575 704 22 4 93 119 28 6
OECD (other) 205 198 489 615 26 3 55 77 41 3
Latin America (excl. 400 547 462 605 31 7 87 110 27 11
Brazil)
Asia (excl. China 1,035 1,476 263 418 59 13 23 37 62 9
and India)
India 1,231 1,659 195 419 114 15 9 24 181 7
Middle East and 460 751 308 402 30 6 50 70 40 9
North Africa
Sub-Saharan Africa 880 2,248 155 201 29 10 39 53 38 21
World 6,958 9,772 403 481 19 100 44 59 34 100
Note: Regions are listed in order of projected daily per capita consumption of total animal-based foods in 2050.
Source: GlobAgri-WRR model with source data from FAO (2019a); UNDESA (2017); FAO (2011c); and Alexandratos and Bruinsma (2012).
Figure 3: Undernourishment is worsening with that seen in developed markets (see Table
Percentage (l.h.s.) and number (r.h.s.) of undernourished people in 1). Full convergence could create a substantially
the world, 2005–19 larger food gap than the WRI’s base case of an
already challenging 56%. Later in this report, we
14 850
provide our own estimates for food requirements
13 800 if the convergence of diets and population
12
750
growth were to occur.
11
700
10
650 Undernourishment
9
8 600 Undernourishment is a significant challenge
2005
2006
2007
2008
2009
2010
2011
2012
2013
2014
2015
2016
2017
2018
2019
for the world. The need of addressing this
was recognized by the UN in 2015 when it
Prevelance of undernourishment (%)
introduced the 17 Sustainable Development
Number of people undernourished (m)
Goals. Among them SDG1: No poverty, SDG2:
Zero hunger and SDG3: Good health and well-
Figure 4: Two billion people globally face food insecurity being are all directly associated with the need
Number of people facing food insecurity, in billions, 2019 to address undernourishment and food security
more broadly.
However, progress to date has been poor. In
fact, data from the FAO suggest that both
5.7 the share of undernourished people globally
2.0
as well as the absolute number has increased
since the SDGs were introduced in 2015
Not food insecure (Figure 3). Data from the FAO also suggest
Food insecure that the increase since 2015 has been due to
worsening conditions in Sub-Saharan Africa,
Western Asia, Northern Africa, Latin America
and the Caribbean. Furthermore, the FAO also
Source Figures 3 and 4: FAO, Credit Suisse Research estimates that the COVID-19 crisis may add
The global food system: Identifying sustainable solutions 7
between 83 and 132 million people to the total          Figure 5: World population facing food insecurity
number of undernourished worldwide in 2020              Share of world population facing food insecurity, in %, 2014–19
and that, if recent trends continue, the number         %
of undernourished people would surpass 840              30
million by 2030.
                                                        25
Undernourishment is related to a number of
factors, one of which is connected to food              20
insecurity. The lack of access to (healthy)                                                                     16.2            16.4           16.2
                                                                   14.1                            15.1
food is a clear headwind for addressing                 15                         14.5
undernourishment. Progress in reducing food
insecurity has been slow to even negative               10
during the past few years. Data from the FAO
                                                         5                                                       8.6            9.4             9.7
suggest that 25.9% of the world’s population                        8.3             7.9            8.1
faced moderate or severe food insecurity in              0
2019. This share is up from 22.4% in 2015                         2014             2015            2016         2017           2018            2019
(Figure 5). On a regional basis, we find that
almost 60% of people living in Sub-Saharan                     Severe food insecurity          Moderate food insecurity
Africa are facing food insecurity (Figure 6).           Source; FAO, Credit Suisse Research

                                                        Figure 6: Food insecurity by region
                                                        Prevalence of severe and moderate food insecurity by region in 2019 (%)

                                                                                       World
                                                                       Sub-Saharan Africa
                                                              Central Asia and South Asia
Progress in reducing                                    Latin America and the Caribbean

food insecurity has                                       Western Asia and North Africa
                                                                                    Oceania
been slow to even                                            East Asia and Southeast Asia

negative                                                       North America and Europe
                                                        Landlocked developing countries
                                                                Least developed countries

                                                                                               0                20                40                  60
                                                              Severe           Moderate

                                                        Source; FAO, Credit Suisse Research
In addition to a lack of access to food, we
find that consumers across lesser-developed
countries and regions face additional challenges.       Figure 7: Food affordability
First, we note that consumers across lower-             Number of people who cannot afford a healthy diet, in millions, 2017
income regions do not have the same food
available to them as consumers across wealthier
                                                                  World
regions. Second, and partly related, is the
fact that not all consumers have the financial
                                                                  Africa
means to afford a healthy diet. In fact, research
suggests that more than three billion people
                                                                    Asia
around the world were not able to afford a
healthy diet in 2017.                                   Latin America
                                                         & Caribbean
More than 1.5 billion people were unable to
afford a diet that was adequate from a nutrition                Oceania
standpoint (Figure 7). Addressing the food
                                                        North America
challenge across developing countries therefore           & Europe
not only requires an increase in overall food
production, but also importantly needs to ensure                           0              1000              2000              3000               4000
that the right food is available at affordable prices         Energy sufficient diet       Nutrient adequate diet          Healthy diet
globally.                                               Source: Herforth, A., Bai, Y., Venkat, A., Mahrt, K., Ebel, A. & Masters, W.A. 2020. “Cost and
                                                        affordability of healthy diets across and within countries”

8
Figure 8: 40% of world population considered overweight Overweight and obesity
Share of adults that are overweight (BMI ≥ 25), in % Undernourishment is not the only reason why a
change toward a more sustainable food system
70
% of adults is required, in our view. The growing number
60 of people globally who are either overweight
or obese presents additional challenges.
50 However, these challenges can be met if the
40
world switches toward more sustainable and
healthy food production and consumption. To
30 put the growing concerns related to overweight
and obesity into context, we note that the
20
share of the global population considered to be
10 overweight doubled between 1975 and 2016 to
close to 40% (Figure 8). Even more worrying
0 is the rise in the number of people who are
1975
1977
1979
1981
1983
1985
1987
1989
1991
1993
1995
1997
1999
2001
2003
2005
2007
2009
2011
2013
2015
obese. The share of the global population that
has a Body Mass Index (BMI) of 30 or higher
Americas Europe South East Asia Africa World has risen almost threefold since 1975 to almost
Source: WHO, Credit Suisse Research 15% in 2016 (Figure 9). We will discuss the
implications associated with malnutrition in terms
of health and economic costs later in this report.
Figure 9: Global share of obese adults almost tripled since 1975
Share of adults that are obese (BMI ≥ 30), in %
35
% of adults
30
25
20
Even more worrying
is the rise in the
15
10
5 number of people
0 who are obese
1975
1977
1979
1981
1983
1985
1987
1989
1991
1993
1995
1997
1999
2001
2003
2005
2007
2009
2011
2013
2015
Americas Europe South East Asia Africa World
Source: WHO, Credit Suisse Research
Figure 10: Average daily calorie intake only below required Causes of malnutrition
level in Sub-Saharan Africa
Average daily calorie intake per person, in kcal The rise in the number of people that are
overweight or obese is due to a combination of
3,600 factors.
3,400
3,200 How much we eat is an issue
3,000 While greater urbanization and less physically active
2,800
lifestyles suggest that people need less food to
“fuel their engines,” the opposite has happened.
2,600
Average calorie intake per person has increased
2,400
globally over the past few decades as can be seen
2,200
in Figure 10. Estimates from the FAO indicate that
2,000 the rising intake of calories is not just a developed-
1,800 country phenomenon, but effectively extends to
1964/66 1974/76 1984/86 1997/99 2015 2030 all regions. It has been estimated that the required
World Developing countries average daily energy intake per person can be
Sub-Saharan Africa Near East/North Africa
Latin America and the Caribbean South Asia 2,100 kcal assuming a BMI target of 22 kg/m2.
East Asia Industrial countries Some of the more prominent studies on healthy
diets such as the EAT-Lancet study from 2019
Source: FAO assume an average required energy intake of
The global food system: Identifying sustainable solutions 9
2,500 kcal/day. Based on that assumption Figure       Figure 11: What should we eat?
10 shows that, except for Sub-Saharan Africa,         Harvard’s healthy eating plate model
consumers in all other regions in the world already
consume more calories per day than the required
daily energy intake.

What we eat is an issue                                                                           17%
Creating a more sustainable food system not                                                                                   Meat & alternatives
                                                                   26%
only means that people who eat too much should
reduce their intake. Of equal importance is to                                                               4%
                                                                                                                              Milk & milk products
address what people eat. Health professionals
often note that consumers eat too much                                                                         4%
                                                                                                                              Oil & fats
unhealthy high-calorie processed food and too
little healthy nutritious organic food. We address
                                                                                                                              Fruit & vegetables
this topic in more detail later in this report, but
note here that what we eat is not necessarily
what we should eat (see Figures 11 and 12).                                                                                   Cereals & starches
For example, a healthy balanced diet suggests
that 50% of our daily intake should be made up                                        50%
of fruit and vegetables; however, young people in
Europe do not reach half of that amount. Some
of our previous research at the Credit Suisse
Research Institute supports the academic view
on desired food consumption as it highlighted         Source: Harvard University, KB, KC (2018)
the need to reduce sugar intake (see “Sugar:
Consumption at a crossroad”).

                                                      Figure 12: What adolescents in Europe eat (2011)

                                                                                                                              Meat & alternatives
                                                                                             11%
                                                                         16%
                                                                                                        4%
                                                                                                                              Milk & milk products

Studies have
shown that obesity
                                                                                                             11%              Oil & fats

and food insecurity                                                                                                           Fruit & vegetables

often go hand in                                                  41%
                                                                                                          17%                 Cereals & starches

hand                                                                                                                          Sugar

                                                      Source: Dethelm, Jankovic et al (2011) “Food intake of European adolescents”
Poverty and lack of education matter too
Poverty and lack of education are two of the
root causes of malnutrition even in wealthy
and developed nations. Studies have shown
that obesity and food insecurity often go hand
in hand. In the United States, for instance,
some 10.5% of all households were food
insecure in 2019, having insufficient money
or other resources for food. In that year,
the US Supplemental Nutrition Assistance
Program (SNAP), the country’s most important
food assistance program, reached 38 million

10
people – food assistance has become a way pandemic, which has shed light on the economic
of supplementing low wages or making up for and social struggles of America’s poor, may bring
insufficient unemployment benefits. this trend to a halt.
Dave and Kelly (2012) find further evidence that
higher unemployment rates are associated with Health implications associated with
lower consumption of fruit and vegetables, and malnutrition
higher consumption of unhealthy foods such as
snacks and fast food. However, unemployment The health implications of an increasingly large
is not the only issue. Many poor Americans portion of the nation that is overweight or obese
have a job, but their wages are too low for their is another factor that cannot be overestimated
families to live comfortably. They often have in our view. For example, the Global Burden of
long working hours and are therefore forced to Disease Study 2019 (GBD 2019) estimated
eat what is convenient along the way. Adding years of life lost (YLL) associated with 87 risk
to the problem, they mostly lack the know-how factors and combinations of risk factors. The
necessary to eat healthily on little money. Many study’s conclusions suggested that many of
of the USA’s working poor (people who spend the factors that have shown an increase in risk
27 weeks or more in a year either working or exposure between 1990 and 2019 are metabolic
looking for work, but whose incomes fall below risks including high fasting plasma glucose
the poverty level) are low-educated, which often (FPG), which is often an indicator of diabetes,
correlates with a higher prevalence of obesity high LDL cholesterol and a high body mass
(Ogden et al. (2017)). index (BMI). The risk factors that contributed
most to YLL and that are increasing by more
For many poor households, the extra weight than 1% per annum in 2019 were FPG and a
resulting from an unhealthy diet is collateral high BMI. The study estimated that around 35
damage – an unintended side effect of hunger million years of life were lost in 2019 due to
itself (McMillan (2014)). Over the past decade, metabolic risks, largely due to a combination of
food insecurity in the United States has been eating too much, eating the wrong food and not
declining. However, the ongoing COVID-19 exercising enough.
Figure 13: Key leading risk factors attributable to deaths
Global attributable deaths from Level 2 risk factors in 2019
High systolic blood pressure
Tobacco
Dietary risks
Air pollution Cardiovascular diseases
High fasting plasma glucose Chronic respiratory diseases
High body-mass index Diabetes and kidney diseases
High LDL cholestrol Digestive diseases
Kidney dysfunction Enteric infections
HIV/AIDS and sexually transmitted infections
Child and maternal malnutrition
Maternal and neonatal disorders
Alcohol use
Musculoskeletal disorders
Non-optimal temperature Neoplasms
Unsafe water and sanitation Neurological disorders
Occupational risks Nutritional deficiencies
Other environmental risks Other infectious diseases
Unsafe sex Other non-communicable diseases
Low physical activity Respiratory infections and tuberculosis
Self harm and interpersonal violence
Drug use
Substance use disorders
Low bone mineral density
Transport injuries
Intimate partner violence Unintentional injuries
Childhood abuse and bullying
0 1,000 2,000 3,000 4,000 5,000 6,000 7,000 8,000 9,000 10,000 11,000 12,000
Number of deaths (in 1000s)
Source: “Global burden of 87 risk factors in 204 countries and territories, 1990–2019; a systematic analysis for the Global Burden of Disease Study 2019,” GBD 2019 Risk
Factors Collaborators, Credit Suisse Research
The global food system: Identifying sustainable solutions 11Figure 14: Leading risk factors by percentage of disability-adjusted life years lost
High systolic blood pressure
Smoking
High FPG
High BMI
Low birthweight
Short gestation
Ambient particulate matter
High LDL cholesterol
Alcohol use
Household air pollution
Child wasting
Unsafe water
Unsafe sanitation
Handwashing
Child underweight
0.0% 2.0% 4.0% 6.0% 8.0% 10.0% 12.0%
2019 1990
Source: “Global burden of 87 risk factors in 204 countries and territories, 1990–2019; a systematic analysis for the Global Burden of Disease Study 2019,” GBD 2019 Risk
Factors Collaborators, Credit Suisse Research
In Figure 13, we show the leading risk factors diets, there is also an indirect impact of
as identified by the GBD 2019. Figure 14 undernourishment on human capital that may
shows the share of life years lost that, according take years to emerge: poor nutrition during
to the GBD 2019 analysis, can be attributed to infancy affects cognitive skills and impedes
various risk factors and how this has changed school achievement, with long-term effects on
from data collected in 1990. The metabolic- labor-market prospects later in life.
related factors dominate and have increased very
substantially since 1990.
In 2017, collaborators with the GBD 2019
released an article in which they estimated
that, on average, more than 20% of total
deaths among adults aged 25 and older can be
attributed to dietary risks.
Undernutrition has
The economic cost of malnutrition severe consequences
Both undernourishment and overweight for economic
or obesity have negative economic
consequences. As part of our report, we have productivity and
estimated the annual cost of malnutrition.
Undernutrition has severe consequences for
ultimately economic
economic productivity and ultimately economic development
development. Undernourished adults have
lower stamina and subsequently lower work
output. While this productivity loss may
manifest very quickly in lower incomes and
eventually in lower affordability of healthy
12There is thus a two-way link between nutrition The FAO has stated that the total financial
and income. Low-income families have less cost associated with the “double burden of
variation in their diet. Moreover, lower income malnutrition” can be estimated at about 5% of
is associated with worse sanitation and health, GDP. This estimate was partly based on 2010
such that there is a higher loss of nutrients data and did not provide a fully comprehensive
associated with infection. Last but not least, global estimate for the overall economic losses
less maternal education (associated with lower associated with all types of malnutrition and
income) leads to less-favorable infant feeding related diseases, in our view. In this report, we
practices and mothers who are less able to attempt to fill this gap, drawing on the available
obtain care for themselves during pregnancy literature about the implications of malnutrition
(Horton and Steckel (2013)). for the economy and the environment. For
a better understanding of the contributing
It is not just undernourishment that causes factors, we have disaggregated the total costs
enormous economic costs. So do overweight and of malnutrition into three components: the
obesity. The impacts on population health also economic costs of undernutrition, the economic
translate into an increase in health expenditure. costs of overweight and obesity, and the social
Nortoft et al. (2018) found that obese people costs in conjunction with a higher carbon
have higher healthcare resource utilization rates footprint. We explain our methodology in greater
than individuals with normal weight, resulting in detail in Appendix 1 of this report.
considerable excess healthcare costs. Bad eating
habits also affect the labor market: overweight
and obesity reduce the employment rate, increase
absenteeism (absence from work, sick leave) and
“presenteeism” (reduction in productivity while
at work), and are also one reason why people
retire earlier (Fitzgerald et al. (2016), Kudel et
al. (2018)). As a result, the global workforce
and total work output are reduced, generating
additional economic costs.
Finally, malnutrition not only impacts people’s The FAO has stated
health, but also the health of the planet and
therefore causes costs for the whole of society.
that the total financial
cost associated with
the “double burden of
malnutrition” can be
estimated at about 5%
Figure 15: Undernourishment causes yearly economic costs of of GDP
almost USD 7 trillion in Asia alone
Estimated yearly GDP loss due to undernourishment, average 2020–35
9.0 12.0%
Trillions
8.0
10.0%
7.0
6.0 8.0%
According to our estimates, malnutrition in all
5.0
6.0% its forms may impose an average yearly cost
4.0 of USD 13.6 trillion (in USD PPP 2010) to
3.0 4.0% the global economy over the period 2020–35.
2.0 The biggest contributor to these costs is
2.0%
1.0 undernourishment at approximately USD 8.4
0.0 0.0% trillion worldwide, with Asia alone recording
Africa Asia Europe Latin North World
a yearly loss of almost USD 7 trillion due to
America America
and the undernourishment (Figure 15). While in Europe
Caribbean and North America undernourishment is a
Estimated yearly GDP loss due to undernourishment (in USD PPP 2010, l.h.s.)
negligible problem, it is a major obstacle for the
Estimated percentage loss in GDP due to undernourishment (in %, r.h.s.) development of African countries, on average
causing a yearly loss in GDP of 11.2% in
2020–35.
Source: Credit Suisse analyses based on Horton and Steckel (2013)
The global food system: Identifying sustainable solutions 13Figure 16: Overweight is a major problem in both developed
and developing countries
Estimated yearly GDP loss due to overweight, average 2020–35
Overweight is a 6.0 6.0%
Trillions
burden for both
5.0 5.0%
4.0 4.0%
the developing and 3.0 3.0%
developed world 2.0
1.0
2.0%
1.0%
0.0 0.0%
Africa Asia Europe Latin North World
America America
and the
Caribbean
Estimated yearly GDP loss due to overweight (in USD PPP 2010, l.h.s.)
Estimated percentage loss in GDP due to overweight (in %, r.h.s.)
Unlike undernourishment, which mostly
concerns poor countries, overweight is a burden Source: Credit Suisse analyses based on Cecchini and Vuik (2019)
for both the developing and developed world.
We estimate that overweight costs the global
community USD 4.8 trillion each year, with the
highest percentage of losses recorded in Latin
America and the Caribbean (–4.8%) and North
America (–4.3%, Figure 16). On a country
level and in absolute terms, the highest losses
due to overweight are documented in the
United States (USD 922 billion), followed by
China, India and Brazil.
Moreover, malnutrition in all its forms may
result in extra emissions of approximately
1,762 megatons of CO2 equivalents per year
globally. Putting a price tag on these extra
CO2 emissions of USD 186.8 per ton of CO2
equivalents results in additional yearly costs of
USD 329.1 billion between 2020 and 2035 (in
2010 US dollars).
14The global food system: Identifying sustainable solutions 15
16
     Photo: Credit Suisse
The environmental impact
of food
Malnutrition is not the only reason why the global food system needs to
change. Food production and consumption already contribute well over
20% to global greenhouse gas emissions and account for more than 90%
of the world’s freshwater consumption. After reviewing the environmental
footprint of all major food groups, we conclude that the current situation
is likely to worsen significantly unless action is taken. The likely growth in
the world’s population to around ten billion people by 2050 coupled with
a further shift in diets, especially across the growing emerging middle
class, could increase emissions by a further 46%, while demand for
agricultural land could increase by 49%.
Figure 1: Food-related GHG emissions by source globally The carbon footprint of the global food system
The global food supply chain plays a significant
Land use for livestock, 16% role in the climate change debate given that
estimates put the share of greenhouse gas
Food 26%
(GHG) emissions generated by the entire food
Land use for human food, 8% system at well over 20% (Figure 1). Various
reports have assessed which activities are
mostly responsible for these emissions. Work
Crops for human food, 21% from Poore and Nemecek in 2018 showed
that, on a global level, more than 50% of
emissions generated by the food system was
Crops for animal feed, 6%
related to livestock, either through land use,
Non-food 74%
animal feed, land conversions or methane
production. Their analysis also showed that
roughly 15% of food-related emissions were
generated by activities after the production
Livestock & fish farms, 30%
phase, including processing, transport,
packaging and retail.
Wild catch fish, 1% Work from Sandstrom et al. in 2018 reviewing
Food processing, 4%
food-related emissions in the EU (Figure 2)
Transport, 6% suggested that more than 80% of food
Packaging, 5% emissions could be traced back to the
Retail, 3% production of animal-related food such as
meat, dairy and eggs.
Source: Poore and Nemecek (2018), Credit Suisse Research
The global food system: Identifying sustainable solutions 17Analysis of emission generation by individual Figure 2: Food-related GHG emissions by food type and
food types clearly suggests that beef-related source in the EU
products are most intense from a GHG By food type By source
perspective (Figure 3). The main reason is
that beef production requires a lot of land and
generates high levels of methane. Other food Dairy, 27% Synthetic nitrogen
products that are emission-intense include dark fertilizer, 14.0%
chocolate (mainly due to the change in land
use) and coffee (land conversion). Products that Organic nitrogen fertilizer, 3.0%
Rice cultuvation, 1.0%
appear most aligned with climate-change targets Manure left on pasture, 2.0%
from a GHG-emission perspective are plant-
based, including fruit, vegetables and nuts. The
need to reduce GHG emissions in order to meet
long-term climate-change targets thus suggests Meat & eggs, Manure management, 22.0%
that a reduction in meat consumption should be 56.0%
a key priority.
Methane from cattle, 2.0%
Transport, 6.0%
Water intensity of the global food system
The footprint of the current food system not only
consists of GHG emissions. Another significant
factor is that food production can be very water
intense. Over 90% of global annual freshwater Land use change, 30.0%
consumption is currently driven by agricultural Roots, 1.5%
Fruit, veg & nuts, 4%
production, which also accounts for close to
Cereal, 4%
70% of total freshwater withdrawal (Figure 4).
Drinks, stimulants, 3.5%
This is a serious problem as water stress is Veg oils & oilseeds, 4%
a significant issue for most regions globally,
Source: Sandstrom et al (2018), Credit Suisse Research
Figure 3: GHG emissions by food type and broken down by source (kg CO2 equivalent per kg of product)
Beef (beef herd)
Lamb & mutton
Cheese
Beef (dairy herd)
Dark chocolate
Coffee
Shrimps (farmed)
Palm oil
Pork
Poultry
Olive oil
Soybean oil
Fish (farmed)
Eggs
Rice
Rapeseed oil
Sunflower oil
Milk
Groundnuts
Wheat & rye (bread)
Tomatoes
Beet sugar
Wine
Maize (meal)
Barley (beer)
Berries & grapes
Soymilk
Peas
Bananas
Potatoes
Onions & leeks
Apples
Citrus fruit
Nuts
-10 0 10 20 30 40 50 60 70
Land use change Animal feed Farm Processing Transport Packaging Retail
Source: Poore and Nemecek (2018), Credit Suisse Research
18Figure 4: Agriculture is a key driver of water scarcity especially developing ones. Without changes to
the food system, we see food-induced water
Freshwater withdrawals stress worsening for two reasons:
ȷ First, we note that the World Bank estimates
the global population will reach close to ten
10%
Freshwater consumption billion people by 2050, which will increase
total water demand as well.
ȷ Second, we believe that per-capita food
4%
4% consumption is likely to increase due to the
22%
3,565 expanding middle class across emerging
km3/year markets, which in turn increases water
demand (see also Figure 14).
1,025
km3/year These two factors combined not only put significant
68%
further pressure on food-related GHG emissions,
but will also increase agriculture-related water
92% consumption unless changes are made to what we
eat, how much we eat and how it is produced.
Agricultural production Industrial production Domestic water supply A review of water intensity by food product
yields similar conclusions to those drawn from
our assessment in relation to GHG emissions.
Note: Figures measure only “blue water” demand and do not consider rainfed agriculture (“green
water”). Consumption figures are averaged for the years 1996–2005; withdrawal figures are for Meat production requires some of the highest
the year 2000. Source: Hoekstra and Mekonnen (2012) (consumption); OECD (2012) output from freshwater consumption per calorie of product.
IMAGE model (withdrawals)
Interestingly, however, and indicative of the fact
that solving the sustainable food question is not
as easy as switching to a full non-meat diet is
the fact that nut and fish production are also very
water intense (Figure 5).
Figure 5: Water footprint per kilogram of food product
Cheese
Nuts
Fish (farmed)
Prawns (farmed)
Beef (dairy herd)
Rice
Olive oil
Groundnuts
Lamb & mutton
Pork
Beef (beef herd)
Sunflower oil
Poultry
Wheat & rye
Milk
Cane sugar
Eggs
Dark chocolate
Oatmeal
Other pulses
Berries & grapes
Soybean oil
Peas
Tomatoes
Rapeseed oil
Beet sugar
Maize
Apples
Other fruit
Tofu (soybeans)
Brassicas
Bananas
Other vegetables
Citrus fruit
Wine
Potatoes
Root vegetables
Soymilk
Coffee
Barley
Onions & leeks
Palm oil
Cassava
0 1000 2000 3000 4000 5000 6000
Source: Poore and Nemecek (2018)
The global food system: Identifying sustainable solutions 19The impact of food production on land use …might not continue
The fact that the total amount of agricultural
The fact that the current food system forms a land has increased during the past few hundred
crucial element of the climate change agenda years has helped in meeting the growth in food
is not only driven by the emissions generated demand seen during that period. However, we
by food production and consumption or the are not convinced that growth in arable land
water usage associated with it. The amount of mass will be sufficient to meet the potential
land that is needed for the production of food growth in food demand going forward. Two
is equally relevant. Data from the FAO indicate observations are worth making here:
that 71% of the world’s land mass is habitable, ȷ First, it is important to note that, despite the
which equates to around 104 million km2. Of growth in total arable land during the past
this, roughly 50% is already used for agriculture, few hundred years, the amount of agricultural
with 77% of that used for keeping livestock. land available per capita has actually declined.
The question is whether the continued increase Over the past 50 years, the reduction in land
in food demand driven by rising middle-class available per person has been strongest in
incomes across emerging markets or population Africa and South America (Figure 7).
growth might require an amount of agricultural ȷ Second, we note that the growth in
land that is simply not available. agricultural land seen to date has come at
the cost of greater deforestation. Data from
The expansion of arable land historically… Globalforestwatch suggest that annual tree
Some might argue that the potential increase loss cover has increased from around 14
in agricultural land needed to meet future million hectares in 2001 to around 25 million
food demand should not be impossible given hectares in 2019 (Figure 8). The FAO
how successful we have been in increasing indicates that some 420 million hectares of
arable land mass historically. For example, data forest has been lost since 1990, which is
from the Historical Database of the Global the same as roughly eight times the size of
Environment show that the amount of agricultural France or 50% of the USA. Deforestation
land globally has increased from around 0.5 not only releases stored carbon dioxide, but
billion hectares in the year zero to close to five also reduces the ability to capture future
billion hectares in 2016 (Figure 6). Since 1900, carbon releases. Furthermore, it contributes
the expansion of agricultural land has been to a loss in biodiversity and puts pressure
particularly strong in Asia (+167%) and Latin on soil quality, which in turn is seen as
America (+210%). In Africa, the total amount of contributing to the risk of drought and
agricultural land has doubled since 1900. floods.
Figure 6: Total agricultural land use over time (billion hectares)
5.0
Billion
4.5
4.0
3.5
3.0
2.5
2.0
1.5
1.0
0.5
0.0
0 182 366 547 731 912 1096 1277 1461 1643 1827 2008
Africa Brazil China
Europe (excl. Russia) India Latin America and the Caribbean (excl. Brazil)
Middle East Oceania Rest of Asia (excl. India & China)
Source: HYDE, 2017
20Figure 7: Agricultural land per capita (hectares)
4.0
3.5
3.0
2.5
2.0
1.5
1.0
0.5
0.0
1961 1964 1967 1970 1973 1976 1979 1982 1985 1988 1991 1994 1997 2000 2003 2006 2009 2012 2015 2018
Africa China Eastern Asia India Northern America South America Southeast Asia Western Europe
Source: FAO, Credit Suisse Research
Figure 8: Annual tree cover loss (million hectares)
35
30
25
20
15
10
5
0
2001 2003 2005 2007 2009 2011 2013 2015 2017 2019
Other Russia Brazil Canada United States Indonesia
Source: Globalforestwatch.org, Credit Suisse Research
The global food system: Identifying sustainable solutions 21The strong decline in agricultural land available has indicated that, once again, a move away
per capita in some of the lesser-developed from a meat-based diet toward a plant-based
regions and the need to limit deforestation diet would be helpful here as well.
suggest that a “business-as-usual” approach ȷ Second, and importantly, significant progress
where simply more land is used for agricultural in productivity has been achieved during the
purposes is unlikely to be successful in improving past 50 years. Data from the FAO indicate
the sustainability of the world’s food system. We that the amount of arable land needed
see two potential solutions here: to produce a fixed number of crops has
ȷ First, we note that the land footprint differs declined very significantly between 1961
between food groups (Figure 9). In other and 2014 (Figure 10). Later in this report,
words, one can reduce agricultural land we will highlight a number of technologies
demand by shifting diets toward a mix of that we believe should help to achieve
products with a lower land use requirement further gains in agricultural productivity
per kilogram of product. The previously and in turn help reduce the need for more
mentioned research by Poore and Nemecek agricultural land.
Figure 9: Land use (m2) per kilogram of produced product
Lamb & mutton
Bovine meat (beef herd)
Cheese
Dark chocolate
Bovine meat (dairy herd)
Olive oil
Coffee
Sunflower oil
Pork
Nuts
Poultry
Rapeseed oil
Soybean oil
Groundnuts
Milk
Fish (farmed)
Oatmeal
Peas
Eggs
Wheat & rye (bread)
Tofu
Maize (meal)
Rice
Palm oil
Berries & grapes
Bananas
Beet sugar
Cassava
Wine
Barley (beer)
0.0 50.0 100.0 150.0 200.0 250.0 300.0 350.0 400.0
Source: Poore and Nemecek (2018)
Figure 10: Arable land needed per unit of crop production
1.2
1.0
0.8
0.6
0.4
0.2
0.0
1961 1964 1967 1970 1973 1976 1979 1982 1985 1988 1991 1994 1997 2000 2003 2006 2009 2012
Western Europe South America Africa Northern America India China Asia
Source: FAO, Credit Suisse Research
22Table 1: Environmental intensity of individual food groups
Emissions Freshwater
Average Land use GHG Acidifying Eutrophying withdrawals
rank m2/kg kg CO2eq/kg g SO2eq/kg g PO43-eq/kg l/kg
Root vegetables 3 1 2 2 4 7
Soymilk 5 6 10 1 2 6
Onions & leeks 5 3 6 5 9 3
Apples 6 5 2 4 3 16
Citrus fruit 6 8 1 7 5 10
Cassava 6 13 14 3 1 1
Other vegetables 7 2 8 10 6 11
Potatoes 8 9 5 6 11 8
Barley (beer) 9 11 13 11 7 4
Brassicas 10 4 7 13 14 13
Other fruit 11 10 12 8 8 15
Bananas 11 15 9 9 10 12
Wine 14 12 18 19 13 9
Maize (meal) 16 20 17 16 12 17
Beet sugar 17 14 20 18 15 18
Berries & grapes 18 17 15 17 16 23
Tofu 18 22 24 12 17 14
Tomatoes 18 7 21 22 19 20
Peas 18 25 10 14 20 21
Palm oil 20 18 33 23 22 2
Wheat & rye (bread) 21 23 16 20 18 30
Oatmeal 22 26 22 15 23 25
Cane sugar 24 16 25 24 26 28
Milk 25 28 23 25 21 29
Other pulses 26 34 18 26 27 24
Soybean oil 26 30 32 21 24 22
Nuts 27 33 2 32 28 42
Rapeseed oil 27 31 28 30 29 19
Groundnuts 29 29 26 27 25 36
Rice 29 19 29 28 31 38
Eggs 29 24 30 34 30 27
Coffee 31 37 39 36 39 5
Sunflower oil 32 36 27 29 34 32
Poultry meat 33 32 34 37 33 31
Olive oil 34 38 31 31 32 37
Dark chocolate 35 40 42 33 36 26
Crustaceans (farmed) 35 21 38 38 40 40
Pork 36 35 35 40 35 34
Fish (farmed) 36 27 36 35 41 41
Lamb & mutton 39 43 41 39 37 35
Cheese 40 41 37 41 38 43
Bovine meat (beef herd) 40 42 43 42 42 33
Bovine meat (dairy herd) 41 39 40 43 43 39
Source: Poore and Nemecek (2018), Credit Suisse Research
The global food system: Identifying sustainable solutions 23Food’s future environmental footprint Figure 11: Projected food-related GHG emissions
if G20 consumption patterns are adopted globally
As the previous section indicates, different food
300%
groups have different environmental footprints, 263%
including land use requirements, fresh water 250%
needs and emission intensity. With the population 178%
growth that the world is likely to experience 200%
during the next few decades, the question is
150%
therefore what types of food the world should
be focusing upon to balance feeding a growing 100%
global population with the need to minimize the
environmental impact. 50%
0%
In Table 1, we rank a range of food products
-1%
based on their environmental intensity. The -50%
table clearly suggests that animal-based Current Consumption If NDGs were followed If the Planetary Health
protein scores worst across all five categories Diet was followed
considered. It requires the most land and water Source: Springmann et al (2020)
per kilogram of any product and generates the
most GHG emissions as well as acidifying and
eutrophying pollutants, which originate primarily Figure 12: Agricultural production emissions could reach
from anthropogenic emissions of sulfur dioxide, 9–11 gigatons/year by 2050
nitrogen oxides and ammonia. On the other 14,000
hand, vegetables, fruits and wheat have the 11,251
12,000
lowest environmental impact.
10,000 1,696
Two products are worth highlighting here. 9,024
1,298
First, we note that rice is among the less- 8,000 1,266
environmentally friendly food products. This is 6,769 1,274 1,982
relevant, especially given the role that rice plays 6,000 1,120
1,642 972
853
in Asian diets. Second, as mentioned earlier, 770 871
4,000 1,502 653
while scoring well on GHG intensity, we find that 588
the production and consumption of nuts ranks 2,000
446 4,432
3,419
poorly in regard to all other factors. Therefore, 2,260
a complete switch away from animal-based to 0
plant-based foods might not have as much of 2010 (base year) 2050 (baseline) 2050 (no productivity
a positive environmental impact if nuts were to gains after 2010)
represent a significant portion of a plant-based Ruminant enteric fermentation Ruminant waste of pastures
diet. Various academic papers have made Manure management Energy use
projections related to future food consumption Source: Global Agro-WRR model
and what this could mean for GHG emissions.
For example, Springmann et al. estimated last
year that future food consumption would be 2.6 Figure 13: The impact of a no-change scenario is significant
times the maximum sustainable level if current for all relevant ecological variables
consumption patterns did not change (Figure
11). Analysis by the World Resources Institute 250%
suggests that emissions associated with food 187%
production alone could rise by 66% between 200%
2010 and 2050 (Figure 12). 167% 165%
151% 154%
150%
However, Springmann’s analysis also showed
that the potential negative impact from the global 100%
food system in a no-change scenario is not
restricted to GHG emissions alone. A no-change 50%
scenario suggests that the use of nitrogen and
phosphorus may rise by more than 50%, which 0%
would likely result in greater contamination of soil 2010 2050 2010 2050 2010 2050 2010 2050 2010 2050
and waterways. Furthermore, such a scenario Greenhouse Cropland use Blue water use Nitrogen Phosphorus
would increase blue water use (i.e. freshwater gas emissions application application
excluding rain water) by 65%, whereas the Staples Legumes Nuts and seeds
amount of land needed for crops would increase Fruits and vegetables Vegetable oils Sugar
by 67% (Figure 13). Other crops Animal products
Source: Springmann et al (2020)
24Figure 14: Animal-based protein consumption increases with income
10.0
Share of calorie intake from animal food (2013)
9.0
Spain Finland
Argentina Portugal France
8.0
Israel
Greece Japan
Kazakhstan Germany
7.0
Italy United Kingdom
Russia Uruguay Czechia
Austria
Brazil Malaysia New Zealand
Serbia Poland Oman Belgium
6.0 Croatia
Ukraine Romania Hungary
Chile
Mexico South Korea United Arab Emirates
Turkmenistan
5.0 China
Vietnam Slovakia Saudi Arabia
Colombia
Pakistan South Africa
4.0 Uzbekistan
Philippines Peru
Congo Jordan Cuba
Kenya Thailand Turkey
3.0 Cambodia
Iran
Uganda
Indonesia
Afghanistan
2.0 India
Tanzania
Ethiopia Iraq
Bangladesh
Nigeria
Malawi
1.0
Mozambique
0.0
0 5,000 10,000 15,000 20,000 25,000 30,000 35,000 40,000 45,000 50,000
GDP per capita (2013, USD)
Source: FAO, World Bank, Credit Suisse Research
The environmental impact of By multiplying per-capita food consumption for
population growth individual items with the average environmental
footprint of those items together with the total
In order to assess how individual countries population size of countries, we can calculate
contribute to the environmental challenges posed current consumption patterns by country and
by the food system, we have created our own their implications for the environment. This also
simulations. In doing so, we have combined allows us to assess which food groups currently
food consumption data for 155 countries from dominate the environmental footprint either
the FAO, with population growth forecasts from globally or by country.
the World Bank and environmental footprint
data for around 40 food groups. This allows Using constant consumption patterns, our
us to estimate the total current environmental calculations suggest that future food demand is
footprint of food consumption by country. likely to result in an 18% increase in total land
Furthermore, we can run scenarios that take use, a 17% increase in GHG emissions and
population growth and potential changes in a 15% increase in freshwater demand. The
future food consumption in certain countries into incremental challenges are largely associated
consideration depending on lifestyle changes. with developing countries, not least China and
This latter point is not trivial, as Figure 14 India. In fact, we note that a number of countries
shows. Rising income levels as measured in currently account for around 750 million people
terms of per-capita GDP, are positively correlated and are likely to see around 100% growth in
with animal-based food consumption, which, as GHG emissions in the next 30 years based on
we showed earlier, have some of the highest population growth alone (Figure 18). Such a
readings on emission intensity, water usage and scenario is clearly not helpful given that global
land requirements. GHG emissions need to decline sharply over the
next few decades in order to meet longer-term
climate change targets.
The global food system: Identifying sustainable solutions 25Some might argue that overall growth rates Figure 15: Land use to rise 18% owing to population growth
are relatively positive given that they are lower (m km2)
than the estimated 24% growth in the world’s 45.0
population expected by the World Bank by 2050.
However, we note that this is because most of 40.0
the population growth is set to take place across 35.0
developing countries where food consumption,
30.0
especially of more environmentally intense food
items, is currently substantially below levels 25.0
seen across developed regions. The question 20.0
is therefore what could happen if population
growth is combined with consumption changes 15.0
that converge toward diets seen in areas such as 10.0
Europe or the United States.
5.0
0.0
2020 2030 2050
Red meat Fish Fruit Nuts/seeds Vegetables Whole grains
Source: FAO, World Bank, Poore and Nemecek (2018), Credit Suisse Research
Figure 16: Meat drives a 15% potential rise in food-related
GHG emissions (Gt CO2 equivalent)
What could happen 16.0
if population growth
14.0
12.0
is combined with 10.0
consumption changes 8.0
that converge toward 6.0
4.0
diets seen in areas 2.0
such as Europe or the 0.0
2020 2030 2050
United States? Red meat Fish Fruit Nuts/seeds Vegetables Whole grains
Source: FAO, World Bank, Poore and Nemecek (2018), Credit Suisse Research
Figure 17: Food-related GHG emissions by country
China 19%
Rest 28%
What if global food consumption converges?
To better understand what might happen to the
environmental footprint of food consumption if
consumption patterns change, we have run a USA 13%
Canada 1%
base case and a worst case scenario.
Nigeria 1%
Base case scenario South Africa 1%
Our base case scenario assumes a gradual Italy 1%
increase in food consumption globally, but not a UK 1%
Brazil 8%
full convergence. We have made the following Turkey 1%
assumptions: Japan 1%
France 2% India 4%
ȷ First, we assume that countries with a lower Vietnam 2%
Indonesia 2% Argentina 3% Russia 3%
GDP/capita will have a higher GDP growth Germany 2%
Egypt 2% Pakistan 2% Mexico 3%
rate over time than those with higher levels of
per capita wealth. For this purpose, we group Source: FAO, World Bank, Poore and Nemecek (2018), Credit Suisse Research
26Figure 18: Food-related GHG emissions growing at around countries into five different categories ranging
100% or more for a range of developing countries from per capita GDP of USD 0–2,500 to
USD 20,000 and above. The reason for
Potental increase in food related GHG emissions
180%
taking USD 20,000 and above as the upper
Niger
limit relates to Figure 14, which shows that
160% animal protein consumption appears to stop
increasing after that.
Second, for the sake of simplicity, we assume
(2020-2050)
ȷ
140%
Angola that countries within a certain band of GDP
per capita have similar consumption patterns.
120% Based on food consumption statistics for
Mali Congo, Dem. Rep.
Zambia Tanzania
Mozambique over 150 countries from the FAO’s database,
Chad Burkina Faso
100% we can calculate what the average diets
Madagascar Uganda Nigeria are for countries in each of the five income
Togo Cameroon
Liberia Sudan categories.
80% Guinea-Bissau
Rwanda
Iraq
Ethiopia
ȷ Using population estimates from the World
Central African Republic Bank, we can estimate how many people
60% will be in each of the five wealth categories
0 50 100 150 200 250 in 2020, 2030 and 2050. Together with
Population (2020, m) average diets consumed for each of these
five categories, this allows us to estimate total
Source: FAO, World Bank, Poore and Nemecek (2018), Credit Suisse Research
food consumption for around 40 food groups
in these years.
Figure 19: Population (m) by GDP/capita bracket (USD) ȷ Finally, using environmental intensity data
for these food groups, we can estimate the
10000
potential change in land use, GHG emissions
9000 and freshwater consumption associated with
1386
8000 the combination of population growth and
1168
7000 1039
changing dietary patterns.
2503
6000 2303
1706 Based on our estimates, we predict that the
5000 number of people living in countries with a GDP
4000 918 969 per capita of less than USD 2,500 will decline
853 3464
3000 from around 2.9 billion in 2020 to around 1.15
2546 billion by 2030, and 652 million by 2050. We
2000
2926 1234
expect the share of people living in countries
1000
1154 with income of USD 5,000–10,000 to increase
652
0 from 12% last year to 37% by 2050, and we
2020 2030 2050 expect this to have significant food-driven climate
20,000
implications. For example, Figure 20 shows
only a few of the food items that have a positive
Source: World Bank, Credit Suisse estimates correlation between per-capita consumption and
wealth. We make the following observations
based on our calculations:
Figure 20: Per capita consumption (kg) of certain food items ȷ Land use requirements: Based on our
grouped by average GDP/capita (USD)
assumptions, we believe a slow convergence
180 of food-consumption patterns over time
160 may result in a 49% increase in demand
for land needed to grow the products that
140
consumers want to eat. In our scenario, land
120 requirements related to growing the required
100 beef, poultry and pork would increase by
80 between 53% and 67%, while increased
milk consumption would need 61% more
60
land. On the other hand, total land use
40 associated with rice consumption would
20 remain largely the same as rising incomes
typically do not correlate with increased rice
0
Pork Beef Milk Wheat Potatoes Sugar Rice Fruit consumption.
ȷ GHG emissions: Our calculations regarding
emissions show similar dramatic increases
20,000
in the event that the world’s growing
Source: World Bank, Credit Suisse estimates, Poore and Nemecek (2018) population becomes wealthier and starts to
The global food system: Identifying sustainable solutions 27You can also read