WORLD LNG REPORT 2020 - Sponsored by - International Gas Union
←
→
Page content transcription
If your browser does not render page correctly, please read the page content below
2020
WORLD LNG REPORT

        Sponsored by
IGU World LNG report - 2020 Edition

                                                4

                                           C

                                           M

                                           Y

                                          CM

                                          MY

                                          CY

                                          CMY

                                           K

2                                                   3
IGU World LNG report - 2020 Edition

        Table Of Contents                                                                  Message from the
                                                                                           President of the
                                                                                                                                                   Chapter 1: State of the
                                                                                                                                                   LNG Industry
                                                                                           International Gas Union

                                                                                                                                               7                                                    8

        Chapter 2 : LNG Trade                               Chapter 3 : LNG and Gas         Chapter 4 : Liquefaction                               Chapter 5 : Shipping
                                                            Pricing                         Plants
        2.1 Overview                                                                        4.1 Overview                                           5.1 Overview
        2.2 LNG Exports by Market                                                           4.2 Global Liquefaction Capacity and Utilisation       5.2 LNG Carriers
        2.3 LNG Imports by Market                                                           4.3 Liquefaction Capacity by Market                    5.3 Floating Storage and Regasification Unit
        2.4 LNG Interregional Trade                                                         4.4 Liquefaction Technologies                              Ownership (FSRUs)
                                                                                            4.5 Floating Liquefaction                              5.4 2020 LNG Orderbook
                                                                                                Map: Global LNG Liquefaction Terminals             5.5 Vessel Costs and Delivery Schedule
                                                                                            4.6 Risks to Project Development                       5.6 Charter Market
                                                                                            4.7 Update on New Liquefaction Plays                   5.7 Fleet Voyages and Vessel Utilisation
                                                                                            4.8 Refrigeration Compressor Driver                        Map: Major LNG Shipping Routes
                                                                                                Developments                                       5.8 Near Term Shipping Developments

                                                      10                              22                                                   28                                                     52

       Chapter 6 : LNG Receiving                            Chapter 7 : The LNG            Chapter 8 : References                                  Appendices
       Terminals                                            Industry in Years Ahead
       6.1 Overview                                                                        8.1 Data Collection for Chapters 3, 4, 5 and 6          1. Table of Global Liquefaction Plants
       6.2 Receiving Terminal Capacity and Global 		                                       8.2 Data Collection for Chapter 2                       2. Table of Liquefaction Plants Sanctioned or
           Utilisation                                                                     8.3 Preparation and Publication of the 2020 IGU            Under Construction
       6.3 Receiving Terminal Capacity and Utilisation by                                      World LNG Report                                    3. Table of Global Active LNG Fleet, Year-End 2019
           Market                                                                          8.4 Definitions                                         4. Table of Global LNG Vessel Orderbook, Year-
       6.4 Receiving Terminal LNG Storage Capacity                                         8.5 Regions and Basins                                     End 2019
       6.5 Receiving Terminal Berthing Capacity                                            8.6 Acronyms                                            5. Table of Global LNG Receiving Terminals
       6.6 Floating and Offshore Regasification                                            8.7 Units                                               6. Table of LNG Receiving Terminals Under
       6.7 Receiving Terminals with Reloading and                                          8.8 Conversion Factors                                     Construction
           Transshipment Capabilities                                                      8.9 Discrepancies in Data vs. Previous IGU World
           Map: Global LNG Receiving Terminals                                                 LNG Reports
       6.8 Risks to Project Development
                                                     72                               90                                                   96                                                     98

4                                                                                                                                                                                                       5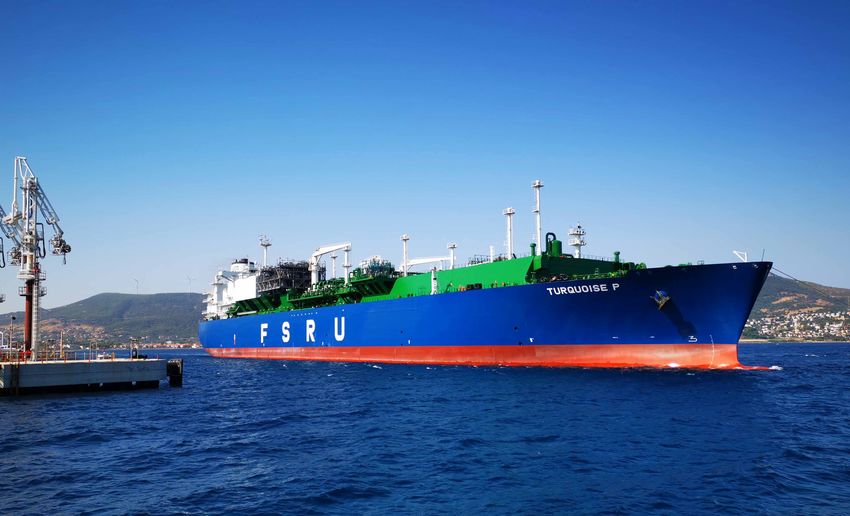
CLEANER ENERGY
IGU World LNG report - 2020 Edition President’s Message
MESSAGE FROM THE PRESIDENT
SOLUTIONS IN A OF THE INTERNATIONAL GAS UNION
CHANGING Dear colleagues,
I write this message with a heavy heart at a time when the world
MTPA, while India added 7.5 MTPA. A total of 37 markets are now
equipped to import LNG. A further 120.4 MTPA of regas capacity is
currently under construction (as of Feb 2020), of which 12 are FSRUs,
ENVIRONMENT
is struggling to manage the growing global impact of the COVID-19 and of which 47.1 MTPA is expected to be onstream by end 2020,
virus. These are difficult times and I hope we emerge stronger and potentially adding 3 new importing markets: Bahrain, Ghana and
more united. Access to energy remains a critical enabler to keeping the Philippines. 2019 also showed significant growth specifically for
people safe, connected and informed in such times and our industry floating regas terminals with FSRUs being added in Jamaica, Turkey
plays a critical role in making sure that the lights are on, homes are and Bangladesh
heated, hospitals and industry keep running and essential goods are
transported without disruption. Interest in LNG as a marine fuel increased with the IMO 2020
regulations coming into force at the start of 2020, which will help
I present to you the 2020 IGU World LNG Report, a comprehensive reduce emissions, improve efficiency and trigger cost benefits.
overview of physical and market developments in the global LNG While the industry has invested in infrastructure ahead of demand,
industry in 2019. continued investment in the coming years will aid the adoption of
LNG as a marine fuel. Gas continued to deliver security of electricity
Gas continues to play a vital role towards an economically and supply critical to the growing share of renewable energies. This is
environmentally sustainable energy future. LNG in 2019 continued not just supporting renewables on the days wind does not blow or
to play a key role in improving air quality in markets such as China. the sun does not shine, but also supports hydro-electric generation
It produces less than 10% of the particulates1 and 50% less GHG during extended dry seasons in, for example, Brazil and Colombia.
than coal when used in power2, 21% less than fuel oil in transport3 Argentina demonstrated how flexible the LNG supply chain can be
and above 95% efficiency4 when used to heat homes. The industry to respond to changing gas monetisation strategies – from signing
continues to improve measurement and reduction of emissions of the charter agreement for the FLNG unit to export of the first LNG
across the full LNG value chain. cargo took a mere 12 months.
Global LNG trade increased to 354.7 MT, an increase of 40.9 MT since Almost a billion people today have no access to electricity5 and nearly
2018 and the sixth year of consecutive growth in LNG trade. This was three billion have to cook with fuels that produce toxic fumes in
on the back of increased exports from the USA, Russia and Australia their homes6. Indoor air quality still represents a large part of the
as well as Algeria and Egypt. Asia Pacific and Asia again imported the premature deaths attributable to air pollution (3.8 million deaths in
most volumes in 2018, together accounting for almost 70% of global 20167) – proof of the urgent need to tackle this issue. As the cleanest-
LNG imports. However, the largest change in imports was observed burning fossil fuel, natural gas has a key role in providing reliable
in Europe, where the UK, France, Spain, the Netherlands, Italy and and cleaner energy to all. Even in the most developed markets,
Belgium together imported 32 MT more than in 2018. affordability and reliability of clean energy is a key issue and switching
to natural gas offers an enormous opportunity. The IGU will continue
Furthermore, 70.8 MTPA of liquefaction capacity was sanctioned, and to demonstrate the vital environmental and economic role of gas in
41.8 MTPA in capacity was brought on-stream in 2019, mostly from the sustainable energy future and encourage collaboration between
Russia, Australia and the US. A huge wave of liquefaction capacity industry and communities towards achieving this future.
is currently still in pre-Final Investment Decision stages, totalling
907.4 MTPA with most of this capacity in the US and Canada, and a
Photograph copyrights of CPC Corporation, Taiwan
significant proportion in Africa and the Middle East (93.3 MTPA each).
The LNG shipping industry kept pace with this growth, adding 42 new
THIRD CARBON NEUTRAL LNG CARGO DELIVERED AT THE CPC YUNG-AN LNG TERMINAL vessels to a total of 541 active vessels by the end of 2019. The active
fleet includes 34 FSRUs and 4 FSUs, demonstrating the continued
Shell now offers carbon neutral* LNG and has delivered cargoes to customers in Asia. Nature-based interest in flexible solutions to enable markets to start importing LNG
or increase their LNG imports as energy demand grows.
carbon credits were used to compensate the full carbon dioxide (CO₂) emissions generated across the
Regasification capacity continued to absorb the increase in supply
LNG value chain. and meet demand growth, adding 23.4 MTPA in 2019, reaching 821
MTPA by February 2020. Six new terminals began importing cargoes
Credits used are purchased from Shell’s global portfolio of nature-based projects that protect, transform in 2019, and three expansion projects were completed. Asia Pacific
took the lion’s share of regas capacity additions with a total of 14.2
or restore land and enable nature to add oxygen and absorb CO₂ emissions from the atmosphere. Each
carbon credit is subject to a third-party verification process and represents the avoidance or removal of Yours faithfully,
1 tonne of CO₂.
CONTACT SHELL LNG
gmselng@shell.com
Joe M. Kang
President of the International Gas Union
1
US DoE National Energy Technology Laboratory, Cost and Performance Baseline for Fossil Energy Plants Volume 1a, Rev 3, 2015 (https://www.netl.doe.gov/projects/files/
CostandPerformanceBaselineforFossilEnergyPlantsVolume1aBitCoalPCandNaturalGastoElectRev3_070615.pdf)
2
IEA, The Role of Gas in Today’s Energy Transitions (https://www.iea.org/reports/the-role-of-gas-in-todays-energy-transitions)
3
Thinkstep, Life Cycle GHG Emission Study on the Use of LNG as Marine Fuel (https://www.thinkstep.com/content/life-cycle-ghg-emission-study-use-lng-marine-fuel-0)
4
IEA, Tracking Buildings (https://www.iea.org/reports/tracking-buildings/heat-pumps)
5
IEA, Population without access to electricity falls below 1 billion (https://www.iea.org/commentaries/population-without-access-to-electricity-falls-below-1-billion)
* The terms “carbon neutral”, “carbon off-set” or “carbon off-set compensation” indicate that Shell has engaged in a transaction to ensure that an amount of 6
WHO, Household air pollution and health (https://www.who.int/news-room/fact-sheets/detail/household-air-pollution-and-health)
carbon dioxide equivalent to that associated with the production, delivery and usage of the fuel has been removed from the atmosphere through a nature-based 7
WHO, Household air pollution and health (https://www.who.int/news-room/fact-sheets/detail/household-air-pollution-and-health)
6 process or emissions saved through avoided deforestation. Further information available on www.shell.com/naturebasedsolutions 7
IGU World LNG report - 2020 Edition State of the LNG Industry
Proposed New Liquefaction Plants Shipping
1.0 Currently, 907.4 MTPA of
liquefaction capacity is in pre-
FID stage, with the majority
Storage Units (FSUs). Overall, the
global LNG fleet grew by 8.4%
year-on-year (YoY) in 2019, with a
State of the LNG Industry
of the proposed capacity total addition of 42 new vessels,
coming from the United States out of which three were FSRUs.
and Canada. Africa has 93.3 By comparison, annual growth
MTPA of liquefaction capacity of LNG trade in 2019 stands at
proposed and could emerge as
a key LNG production region if
those projects materialise. The
541 13%2, showing a good balance
between growth in the LNG
shipping market and LNG trade.
Qatar LNG expansion plan is
Vessels Charter costs in 2019 began
907.4 progressing towards FID and
those capacity additions could
re-position Qatar as the market
LNG Fleet,
strong at approximately $70,000
per day for steam turbine vessels
and $100,000 per day for TFDE/
MTPA with the largest liquefaction
capacity globally.
End-2019 DFDE. Rates decreased to level
off at approximately $30,000
for steam turbine vessels and
Proposed Liquefaction The record volume of sanctioned about $40,000 for TFDE/DFDE
Capacity, 2020 liquefaction projects is vessels, varying as expected with
underpinned by the expectation summer months impacting LNG
of growing LNG demand shipment volumes. Sanctions on
globally, creating the need for COSCO followed by a European
additional liquefaction capacity. storage buildup and sustained
This will also lead to competition The global LNG fleet consisted increases in US production
to secure EPC capacity, as project of 541 active vessels at the end caused an acute increase in
developers aim to enter the of 2019, including 34 Floating charter prices, peaking in late
market by the mid-2020s in order Storage Regasification Units October 2019 before declining
to capture growing demand. (FSRUs) and four Floating towards the end of the year.
Samcheok LNG Terminal - Courtesy of KOGAS
LNG Trade1 Liquefaction Plants LNG Receiving Terminals Floating Regasification
followed by Australia (75.4 MT). LNG T1-2 (8.9 MTPA) and were successfully completed. A offshore regasification capacity
The USA (33.8 MT) overtook Yamal LNG T3 (5.5 MTPA) were significant share of regasification at 24 operational terminals
Malaysia (26.2 MT) as the third commissioned in late 2018 and capacity additions occurred in rose to reach 101.2 MTPA. As
largest exporter, and added began commercial deliveries the Asia and Asia Pacific regions, of February 2020, 12 offshore
record export volumes. Russia is in 2019. Corpus Christi LNG contributing a total of 14.2 terminals, adding up to 36.6
101.2 MTPA
now the fourth largest exporter T1-2 (9 MTPA), Cameron LNG MTPA in receiving capabilities, MTPA of regasification capacity,
40.93 MT
of LNG (29.3 MT). Asia Pacific
continued it’s growth trajectory
as the largest export region
T1 (4.0 MTPA), Freeport LNG T1
(5.1 MTPA), Sabine Pass T5 (4.5
MTPA) and Elba Island T1-3 (0.75
826 MTPA reaffirming the regions’ status
as a source of demand growth.
In particular, India added the Regasification Capacity,
were under construction. Eight
terminals have announced
plans to come online by end-
Global Nominal
Increase in Global LNG (131.7 MT). MTPA) commenced commercial most regasification capacity February 2020 2020, including new importers
operations in 2019, contributing Regasification through terminal construction such as Ghana. Beyond 2020,
Trade, Since 2018 Only three markets saw a drop to more than half of the capacity Capacity, and expansion, amounting to other new importers, such as El
in export levels versus 2018: additions. Prelude FLNG (3.6 7.5 MTPA of commissioned Salvador, Croatia and Cyprus,
Indonesia saw the largest drop MTPA) and Tango FLNG (0.5 February 2020 capacity. As of February 2020, are anticipated to add their
in export (-2.7 MT), followed
by Equatorial Guinea (-0.65 42.5 MTPA MTPA) achieved commercial
exports in June 2019, becoming
37 markets are equipped with
LNG receiving capabilities. Regasification capacity at
first regasification terminals
through offshore facilities.
MT) and Norway (-0.45 MT). No the third and fourth operational Accompanying the rise of operational offshore terminals Mature markets are also
new importers were added to Global Liquefaction FLNG developments in the global LNG trade, regasification experienced an increase of expanding floating regasification
the list in 2019. However, most Capacity Added, 2019 world after Cameroon FLNG capacity expansion is anticipated 13.0 MTPA in 2019 through capabilities, a prime example
recent new importers increased (2.4 MTPA) and Petronas FLNG to follow in established regions the construction of three new- being India, which is anticipated
Global LNG trade increased imports further in 2019, such Satu (1.2 MTPA). As of December as well as a number of new built floating terminals at ports to commission its first FSRU-
further in 2019, reaching 354.73 as Bangladesh, Pakistan, Poland 2019, 123.3 MTPA of liquefaction Global regasification capacity markets, both of which are in Brazil (Sergipe), Jamaica based terminal in early
MT, an increase of 40.93 MT since and Panama. The largest capacity was under construction grew during the past year, experiencing surges in gas (Old Harbour) and Bangladesh 2020, equipping India with
the end of 2018. This constitutes increases in imports were seen or sanctioned for development. reaching a total of 821 MTPA as demand. As of February 2020, (Moheshkhali (Summit)) as both onshore and floating
an increase of 13%, a sixth year in Europe, with the UK, France, 24.35 MTPA out of the 123.3 of February 2020. With a total 120.4 MTPA of new regasification well as the chartering of a regasification terminals. As of
of consecutive growth. Spain, the Netherlands, Italy and MTPA capacity is expected regasification capacity expansion capacity was under construction, replacement FSRU with larger February 2020, there were about
Belgium accounting for most of to come online in 2020. In of 23.4 MTPA, 2019 marked including 14 new onshore receiving capabilities in an 10 FSRUs (including conversions)
Most of the additional exported the additional imports (+32 MT). addition, 2019 also saw a record the second consecutive year in terminals, 12 floating storage existing market – Turkey (Etki). on the order book of shipbuilding
volumes in 2019 were from Asian and Asian Pacific markets in sanctioned liquefaction which regasification capacity and regasification units (FSRUs), Kuwait’s Mina al-Ahmadi yards. The FSRU market for
existing exporting markets: that contributed to global trade capacity, totaling 70.8 MTPA. additions were outpaced and seven expansion projects terminal has signed a new two- offshore terminals experienced
the US (+13.1 MT), Australia were China, India and Malaysia. The FIDs were largely driven by by increases in liquefaction at existing receiving terminals. year charter contract beginning a surplus in 2019, with a number
(+8.7 MT) and Russia (+11 MT). The largest importing regions, Global liquefaction capacity the expectation of growing LNG capacity. Six new terminals By year-end 2020, 47.1 MTPA of March 2020 with its existing of vessels temporarily utilised as
Qatar managed to maintain its consistent with 2018, were Asia continued to grow significantly demand globally, creating the began importing LNG cargoes regasification capacity is set to FSRU – Golar Igloo, after its first conventional LNG carriers while
position as the largest exporter Pacific (131.7 MT) and Asia (114.5 in 2019, totaling 42.5 MTPA need for additional liquefaction in 2019 and expansion projects come online and could include charter contract concluded at others were open for charter.
in the world (77.8 MT), closely MT). in capacity additions. Ichthys capacity. at three existing terminals new importers such as Ghana. the end of 2019. By early 2020,
1
LNG trade data for 2019 in this report has been supplied by GIIGNL, and is compared against GIIGNL data from 2018, from the GIIGNL Annual Report 2019 (https://giignl. 2
GIIGNL
org/publications/giignl-2019-annual-report). Other data in this report is supplied by Rystad Energy.
8 9
2
 IGU World LNG report - 2020 Edition

                 LNG
                 Trade

                                                                                                         Japan imported
     Global LNG trade increased to 354.7 MT in 2019,                                                     76.9 MT
     an increase of 40.9 MT or 13% vs. 2018. This is the                                                 (-5.6 MT vs. 2018)

     sixth year of consecutive growth in global LNG trade.

                                                                                                         China imported
       Australia is the second                                                                           61.7 MT
       largest exporter with a                              Australia                                    (+7.7 MT vs. 2018)
       total of 75.4      MT                                             Japan

                                       2
                                       nd

                                                          Malaysia
                                                                                                        The largest global LNG
                                                                           China                        trade flow route continues
       Qatar managed to                                   Indonesia                                     to be intra-Asia Pacific
       maintain its position as                                                                         trade 77.3         MT
       the largest exporter in                            Oman
       the world, exporting
       77.8 MT
                                       1   st
                                                                        South Korea

                                                     Qatar                                               The largest importing
                                                                        Chinese Taipei                   regions, consistent
                                                                                                         with 2018, were

       Russia is now the                                                                                 • Asia Pacific 131.7             MT
                                                                                   India
       fourth largest exporter                                                                           • Asia 114.5          MT
                                                   Russia
       of LNG, with 29.3         MT
       of export in 2019
                                       4   th                                         UK

                                                  USA                                 Italy              European imports surged
                                                                                                         on the back of low prices,
                                                                                                         almost doubling to
                                                                                      Spain
       The USA overtook                          Nigeria                                                 85.9 MT
       Malaysia as the third
       largest exporter, and                                                           France
                                                Trinidad & Tobago
       added a record of
       +13.1 MT
                                       3   rd

                                                Algeria                                  Turkey

                                                                                                  *The diagram only represents trade flows between
10                                                                                                                                              11
                                                                                                          the top 10 exporters and top 10 importers.
IGU World LNG report - 2020 Edition                                                    LNG Trade

        2.0 LNG Trade
        Global LNG trade increased further in 2019, reaching 354.7 MT, an increase of
        40.9 MT since the end of 2018. This constitutes an increase of approximately
        13%, a sixth year of consecutive growth.

 Shell LNG Station - Courtesy of Shell

12                                                                                              13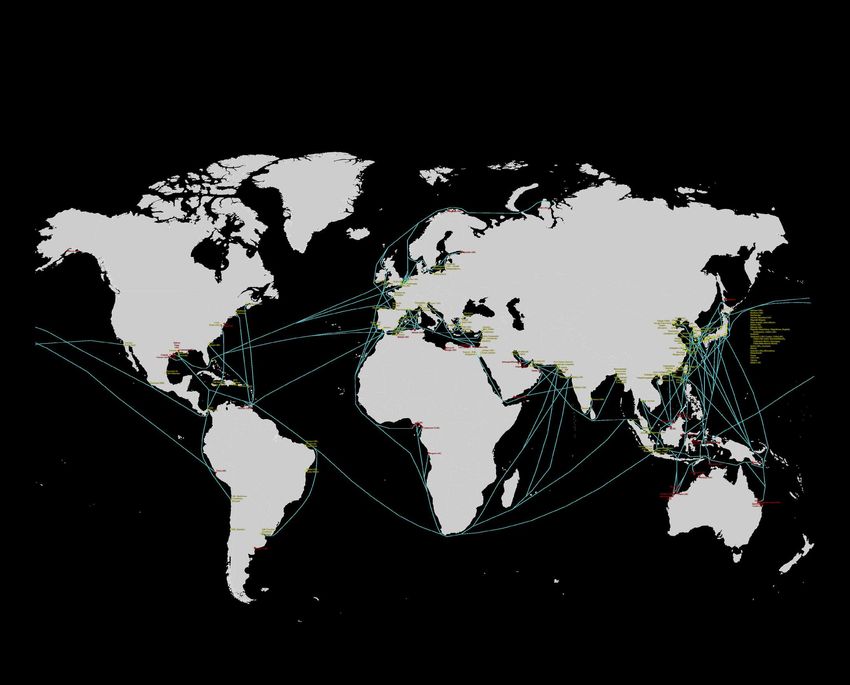
IGU World LNG report - 2020 Edition LNG Trade
2.1 2.2
OVERVIEW LNG EXPORTS BY MARKET
Global LNG trade increased further in 2019, reaching 354.7 MT, Only three markets saw a drop in export levels versus 2018: Indonesia Most of the liquefaction capacity added in 2019 was from existing exporting markets: the US, Australia and Russia. Argentina’s 0.5 MTPA Tango
an increase of 40.9 MT since the end of 2018. This constitutes an saw the largest drop in export (-2.7 MT), followed by Equatorial FLNG came on-stream and that made Argentina the 20th global exporter of LNG in the world.
increase of approximately 13%, a sixth year of consecutive growth. Guinea (-0.7 MT) and Norway (-0.5 MT). Gibraltar was the only new 2.1
importing market in 2019, but has been excluded from this report as
Most of the additional exported volumes in 2019 were from existing the capacity is below 0.5 MTPA. Most recent new importers increased Figure 2.1: 2019 LNG Exports and Market Share by Market (in MT)
exporting markets: the US (+13.1 MT), Australia (+8.7 MT) and Russia imports further in 2019, such as Bangladesh, Pakistan, Poland and
(+11 MT). Qatar managed to maintain its position as the largest Panama. The largest increases in imports were seen in Europe, with
exporter in the world (77.8 MT), closely followed by Australia (75.4 the UK, France, Spain, the Netherlands, Italy and Belgium accounting
MT). The USA (33.8 MT) overtook Malaysia (26.2 MT) as the third for most of the additional imports (+32 MT) in this order. The largest
Qatar , 77.8 , 22% Australia , 75.4 , 21%
largest exporter, and added record export volumes. Russia is now importing regions, consistent with 2018, were Asia Pacific (131.7
the fourth largest exporter of LNG (29.3 MT) and Malaysia the fifth MT) and Asia (114.5 MT). Key Asian and Asian Pacific markets that
largest exporter. Asia Pacific continued its growth trajectory as the contributed to these regions’ high imports continue to be Japan (76.9 USA , 33.8 , 10% Russia , 29.3 , 8%
largest export region (131.7 MT). MT), China (61.7 MT), India (24 MT) and Chinese Taipei (16.7 MT).
Malaysia , 26.2 , 7% Nigeria , 20.8 , 6%
Global LNG Trade LNG Exporters & Importers LNG Re-Exports
Indonesia , 15.5 , 4% Trinidad & Tobago , 12.5 , 4%
+40.9 MT No new LNG importers in 20191 -2.2 MT
Growth of global LNG trade Re-exported volumes decreased by 59% Algeria , 12.2 , 3% Oman , 10.3 , 3%
YOY in 2019
Papua New Guinea , 8.2 , 2% Brunei , 6.4 , 2%
Global LNG trade reached an all-time high Bangladesh, Brazil, China, India, and Jamaica Re-export activity dropped in 2019 to 1.6
of 354.7 MT in 2019, setting a new annual increased imports through new-built MT (3.8 MT in 2018). UAE , 5.8 , 2% Norway , 4.7 , 1%
record. terminals.
Re-exports received dropped in all markets. Angola , 4.4 , 1% Peru , 3.8 , 1%
China provided 7.7 MT in new import While most liquefaction capacity was Asia received the largest volume of re-
demand, and Europe increased imports by added in markets already exporting LNG, a exports (0.9 MT), while Europe re-exported
37 MT. floating liquefaction project came online in the highest volumes (0.9 MT). Egypt , 3.5 , 1% Equatorial Guinea , 2.8 , 1%
Argentina, raising the number of exporters
Contractions were largest in Japan (-5.6 MT), to 20.
South Korea (-3.8 MT) and Egypt (-1.9 MT). Cameroon , 1.3 , 0% Argentina , 0.1 , 0%
Source : GIIGNL
Qatar2.2
managed to maintain its position as the largest exporter in the LNG project in June 2019, subsequently exporting a first cargo in
world, exporting 77.8 MT in 2019, closely followed by Australia who November, thus adding Argentina to the list of global LNG exporters.
exported a total of 75.4 MT, an increase of 13% year-on-year, driven
by the start-ups of Ichthys LNG T1-2 (8.9 MTPA) and Prelude FLNG Only three markets saw a drop in export levels versus 2018. Indonesia
(3.6 MTPA). The USA overtook Malaysia as the third largest exporter, saw the largest drop in export (-2.7 MT) in 2019, mainly driven by
and added a record of 13.1 MT, an increase of 63% as Corpus Christi declining gas resources feeding into Bontang LNG and turndowns
LNG T1-2
14 (9 MTPA), Cameron LNG T1 (4.0 MTPA), Freeport LNG T1 (5.1 in the lower price environment. Equatorial Guinea has also started
MTPA), Sabine Pass T5 (4.5 MTPA) and Elba Island T1-3 (0.75 MTPA) to see gas supply declining, triggering a drop in export of 0.7 MT.
started12
up. Russia is now the fourth largest exporter of LNG, with 29.3 Lastly, Norway saw a decrease in export (-0.5 MT) due to accelerated
MT of export in 2019 as Yamal LNG T3 (5.5 MTPA) and Vysotsk LNG maintenance in the lower price environment.
10
(0.66 MTPA) were commissioned and started exporting cargoes, an
increase of 60% compared to 2018. Asia Pacific continued it’s growth trajectory as the largest export
8 region, exporting a total of 131.7 MT in 2019, an increase of 7%,
Another large shift in export volumes was observed in Algeria (+2.1 driven by the aforementioned increases in production from Australia
6
MT), which managed to recover some of the drop in export observed as well as from Papua New Guinea (+1.2 MT). The largest regional
MT
in 2018 (-2.2 MT) due to the drop in gas and LNG prices, making LNG increases came from North America (63%, driven by the USA) and
4
more competitive versus pipeline options into Europe. Egypt also the FSU (Russia, 60%). Africa also added significant exports (+5.7 MT)
increased
2 LNG exports significantly, exporting an additional 2 MT through increases from Algeria, Egypt and Cameroon as they ramped
compared to 2018, driven by Idku LNG reaching full export capacity up production and exports in 2019. The Middle East only increased
at end 02019. Lastly, Argentina commissioned the Tango floating exports by 2% with small increases from Qatar, the UAE and Oman.
Kogas Jeju LNG Terminal – Courtesy of Kogas
-2
-4
1
This report excludes those with only small-scale (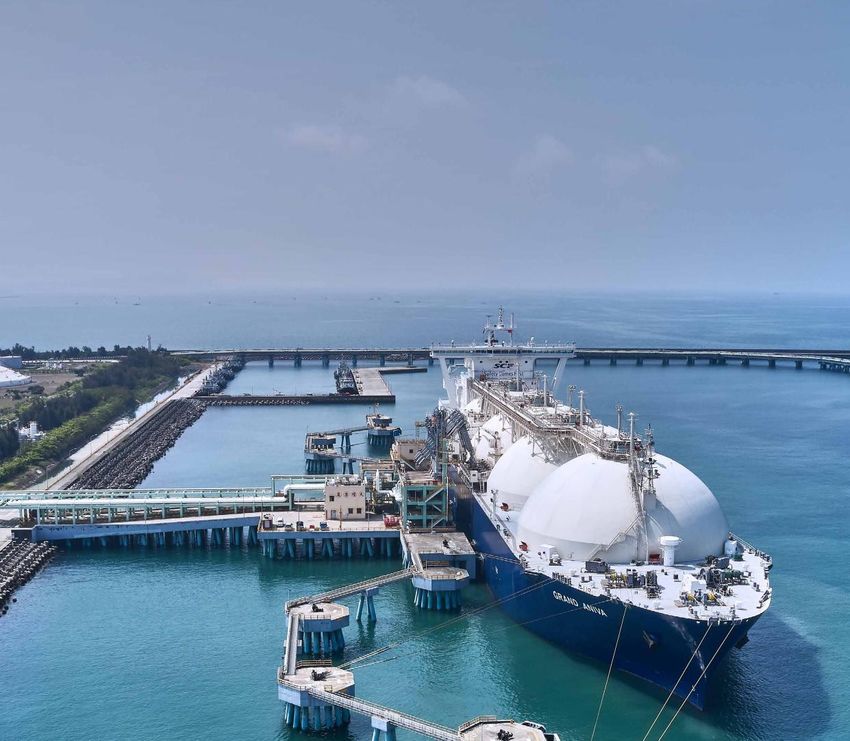
2.2
IGU World LNG report - 2020 Edition LNG Trade
2.4
Figure 2.2: 2019 Incremental LNG Exports by Market Relative to 2018 (in MT) Figure 2.4: Re-Exports Received in 2019 by Receiving Market (in MT)
14
China, 0.5, 32% India, 0.1, 9%
12
10 Japan, 0.1, 9% Sweden, 0.1, 5%
8
Chinese Taipei, 0.1, 5% Italy, 0.1, 4%
6
MT
Malaysia, 0.1, 4% UAE, 0.1, 4%
4
2 Bangladesh, 0.1, 4% Pakistan, 0.1, 4%
0
South Korea, 0.1, 4% Lithuania, 0.1, 4%
-2
-4 Gibraltar, 0.1, 4% Jamaica, 0.0, 2%
Puerto Rico (US) , 0.0, 1% Greece, 0.0, 1%
Panama, 0.0, 1% Finland, 0.0, 1%
Middle East Asia-Pacific Africa Latin America FSU Europe North America Norway, 0.0, 0%
Source : GIIGNL
Source : GIIGNL
Re-exported trade dropped in 2019 by 59% from 3.8 MT to 1.6 MT – equal to roughly 0.4% of global trade in 2019. 12 Markets re-exported
volumes, with some marked shifts from 2018. For example, China, Malaysia, Lithuania and Jamaica loaded re-export volumes, whereas they did
not do so in 2018. The Dominican Republic was the only market that re-exported volumes both in 2018 and 2019, and also increased their re- As already forecasted in the 2019 IGU World LNG Report, a lower price environment was likely to trigger a drop in re-exports, as the
exports, although only marginally (+0.01 MT). Europe re-exported 58% of global re-exports in 2019, and France and Singapore had the highest opportunities
2.5 for inter-basin arbitrage plays decreased. This was clearly observed in 2019, as despite a continued ramp-up of Yamal volumes
re-export loadings in 2019, re-exporting 0.6 MT and 0.4 MT respectively. that were expected to be re-loaded at European terminals, re-exports from Europe dropped by around 70%. Even though a number of new
markets were involved in the loading of re-exports and received re-exports, the volumes were too small to offset the significant drop in re-
2.4from Europe.
exports
2.3
Figure 2.3: Re-Exports Loaded by Re-loading Market in 2019 (in MT) Japan , 76.9 , 22% China , 61.7 , 17%
South Korea , 40.1 , 11% India , 24.0 , 7%
Chinese Taipei , 16.7 , 5% Spain , 15.7 , 4%
France , 0.6 , 39% Singapore , 0.4 , 26% France , 15.6 , 4% UK , 13.5 , 4%
Italy , 9.8 , 3% Turkey , 9.4 , 3%
Pakistan , 8.1 , 2% Netherlands , 5.8 , 2%
Netherlands , 0.1 , 9% Belgium , 0.1 , 8%
Belgium , 5.1 , 1% Thailand , 5.0 , 1%
Mexico , 4.9 , 1% Portugal , 4.1 , 1%
China , 0.1 , 5% India , 0.1 , 4% Bangladesh , 4.1 , 1% Indonesia , 3.6 , 1%
Kuwait , 3.6 , 1% Singapore , 3.3 , 1%
Malaysia , 2.7 , 1% Poland , 2.5 , 1%
Puerto Rico (US) , 0.0 , 2% Dominican Rep. , 0.0 , 2%
Chile , 2.4 , 1% Brazil , 2.3 , 1%
Greece , 2.1 , 1% Jordan , 1.4 , 0%
Malaysia , 0.0 , 2% Lithuania , 0.0 , 2% Lithuania , 1.4 , 0% UAE , 1.4 , 0%
Argentina , 1.2 , 0% Dominican Rep. , 1.2 , 0%
USA (incld. Puerto Rico) , 2.4 , 1% Israel , 0.6 , 0%
Spain , 0.0 , 1% Jamaica , 0.0 , 0%
Panama , 0.4 , 0% Canada , 0.4 , 0%
Malta , 0.4 , 0% Jamaica , 0.3 , 0%
Source : GIIGNL Sweden , 0.3 , 0% Colombia , 0.2 , 0%
Finland , 0.1 , 0% Norway , 0.1 , 0%
At the same time, 19 markets received re-exported volumes, versus 22 markets in 2018. New receivers of re-exported volumes in 2019, who
did not do so in 2018, were Bangladesh, Malaysia, Gibraltar, Greece, Italy, Lithuania, Norway, Jamaica and Panama. China received the highest LNG Vessel at Shell’s Terminal at Hazira – Courtesy of Shell Egypt , 0.1 , 0% Gibraltar , 0.1 , 0%
2.4 of re-exports at 0.5 MT.
volume
China, 0.5, 32% India, 0.1, 9%
16 17
Japan, 0.1, 9% Sweden, 0.1, 5%
South Korea, 0.1, 4% Lithuania, 0.1, 4%
IGU World LNG report - 2020 Edition 2.6 LNG Trade
Gibraltar, 0.1, 4% Jamaica, 0.0, 2%
2.3
Figure 2.6: Incremental 2019 LNG Imports by Market & Incremental Change Relative to 2018 (in MT)
Puerto Rico (US) , 0.0, 1% Greece, 0.0, 1%
10
LNG IMPORTS BY MARKET
8
Panama, 0.0, 1% Finland, 0.0, 1%
6
4
MT
Norway, 0.0, 0% 2
0
While new regasification facilities were commissioned in new markets France, Spain, the Netherlands, Italy and Belgium alone adding 32 MT -2
in 2019, none imported cargoes by the end of December, and hence of imports in 2019. -4
no new importers were added to the list in 2019. However, most
Kuwait
Jamaica
Egypt
Indonesia
Malta
Gibraltar
Japan
Canada
Jordan
Chinese Taipei
Malaysia
UK
Sweden
Colombia
Brazil
Portugal
Poland
USA (incld Puerto Rico)
South Korea
UAE
Argentina
China
Italy
Mexico
Singapore
Chile
France
Spain
Dominican Rep.
Pakistan
Thailand
Israel
Norway
Lithuania
Bangladesh
India
Greece
Turkey
Panama
Finland
Netherlands
Belgium
recent new importers (that started importing between 2015 and The largest importing regions, consistent with 2018, were Asia Pacific
2018) increased imports further in 2019, such as Bangladesh (+3.4 and Asia (131.7 MT and 114.5 MT respectively), although Asia Pacific’s
MT), Pakistan (+1.2 MT), Poland (+0.5 MT) and Panama (+0.3 MT). market share of total LNG imports declined by 7% compared to 2018.
The largest increases in imports were seen in Europe, with the UK,
2.5
2.42.5: 2019 LNG Imports and Market Share by Market (in MT)
Figure
Japan , 76.9 , 22% China , 61.7 , 17%
Middle East Asia-Pacific Africa Latin America FSU Europe North America Asia
South Korea , 40.1 , 11% India , 24.0 , 7%
Source : GIIGNL
Chinese Taipei , 16.7 , 5% Spain , 15.7 , 4%
France , 15.6 , 4% UK , 13.5 , 4%
Italy , 9.8 , 3%
Pakistan , 8.1 , 2%
Turkey , 9.4 , 3%
Netherlands , 5.8 , 2%
2.4 LNG INTERREGIONAL TRADE
Belgium , 5.1 , 1% Thailand , 5.0 , 1%
Mexico , 4.9 , 1% Portugal , 4.1 , 1% The largest global LNG trade flow route continues to be intra-Asia America, an increase from last year, almost all of this went to Mexico.
Pacific trade (77.3 MT), driven mainly by continued ramp up in
Bangladesh , 4.1 , 1% Indonesia , 3.6 , 1% exports from Australia, and to a lesser extent additional exports from North American supplies were similarly globally distributed as they
Papua New Guinea and Malaysia, into the largest market of the world were in 2018 with volumes being imported into Europe, Asia Pacific,
Kuwait , 3.6 , 1% Singapore , 3.3 , 1%
– Japan, as well as a large flow into Singapore, Indonesia, Thailand Latin America, Asia, North America and the Middle East. The largest
Malaysia , 2.7 , 1% Poland , 2.5 , 1% and South Korea. Interestingly 3.6 MT was intra-Indonesian trade. flow was, predictably given 2019’s price developments, into Europe
Most of the remaining supply out of Asia Pacific ended up in Asia, (12.7 MT), but significant flows also went to Asia Pacific (9.5 MT).
Chile , 2.4 , 1% Brazil , 2.3 , 1% being the second largest LNG trade flow in 2019 – 54 MT with 28 MT
from Australia to China alone. FSU (Russia) exports topped at 29.3 MT, of which more than half was
Greece , 2.1 , 1% Jordan , 1.4 , 0% destined for Europe in 2019. A significant volume also went to Asia
Lithuania , 1.4 , 0% UAE , 1.4 , 0% The third largest trade flow is from the Middle East to Asia at 36.3 Pacific (8.8 MT), mainly Japan (6.3 MT), as the Northern Sea route
MT – with most of those supplies being exported from Qatar. There trade flow grew steadily.
Argentina , 1.2 , 0% Dominican Rep. , 1.2 , 0% were also significant flows from the Middle East to Asia Pacific, which
was the second largest trade flow last year, but has now settled at Latin American volumes showed a similar global distribution in 2018
USA (incld. Puerto Rico) , 2.4 , 1% Israel , 0.6 , 0% 31.2 MT. A lot of the trade flow that used to go to Asia instead moved and 2019 as North American volumes. Intra-Latin American trade
to Europe in 2019 as prices went down. Intra-Middle East trade was decreased, and instead more volumes went to Europe (5.9 MT) and
Panama , 0.4 , 0% Canada , 0.4 , 0%
only 3 MT. Asia (1.9 MT). Imports into North America remained similar to last
Malta , 0.4 , 0% Jamaica , 0.3 , 0% year (3.1 MT).
African exports flowed mainly to Europe and Asia (25.1 MT and
Sweden , 0.3 , 0% Colombia , 0.2 , 0% 13.6 MT respectively), supported by additional exports from Algeria Lastly, European volumes remained within Europe (4.2 MT), meaning
and Egypt, and overall demand growth in for example China and Norway’s lowered exports were mainly imported into other European
Finland , 0.1 , 0% Norway , 0.1 , 0% Bangladesh. 2.9 MT of African supply was imported into Asia Pacific, markets, with almost half destined for France (1 MT) and Lithuania
Egypt , 0.1 , 0% Gibraltar , 0.1 , 0% a drop from last year, while notably 1.5 MT was imported into North (1 MT).
Source : GIIGNL
Table 2.1: LNG Trade Between Regions, 2019 (in MT)
Exporting Region
Reexports
Reexports
Received
America
America
Loaded
Former
Europe
Middle
Demand from Asia Pacific was supported through growth in imports global increase in LNG trade in 2019. Market share wise, this meant
Pacific
Soviet
Union
North
Africa
Total
Latin
Asia-
East
into Malaysia, Singapore, Indonesia and Thailand, but was challenged an increase from 16% to 24%. This was driven also by declines in
Importing Region
by declining imports in South Korea and Japan (approximately -9% or domestic production, increased use of storage, additional gas-fired
-3.8 MT and -7% or -5.6 MT respectively), driven by milder weather, power generation and increases in LNG imports from for instance
the price environment and changes in domestic energy mixes and Algeria as LNG was competitive versus pipeline supplies. Asia-Pacific 77.3 31.2 2.9 9.5 8.8 2.1 - 0.3 0.4 131.7
2.6
demand.
Asia 54.2 36.3 13.6 3.0 4.8 1.9 0.1 0.8 0.1 114.5
Both Africa and Latin America reversed earlier growth trajectories
While Asia’s market share remained stable with support from in import, with Egypt and Argentina becoming exporters again after Europe - 23.5 25.1 12.7 15.1 5.9 4.2 0.3 0.9 85.9
China, Pakistan and Bangladesh, India’s demand growth was muted having previously imported LNG. Chile’s LNG imports also dropped as
compared
10 to the growth seen in 2018 and prior years (+1.5 MT) with Argentina supplied more pipeline gas. Latin America - - 0.8 4.2 - 2.6 0.4 0.1 - 8.1
infrastructure development slower than expected, and imports into
8 North America 0.2 - 1.5 2.9 0.1 3.1 - - - 7.7
Chinese Taipei dropped by 0.2 MT. China’s growth in LNG imports In North America, Puerto Rico was the only market to grow LNG import
6
slowed down on the back of slower coal-to-gas switching efforts, further after 2018 showed recovery following Hurricane Maria. While Middle East 0.1 3.0 1.0 1.4 0.6 0.8 - 0.1 - 6.9
4
increased domestic production and an increase of renewables in the pipeline capacity additions in Mexico continue to be delayed, LNG
MT
2
energy mix. imports into Mexico remained relatively stable at 4.9 MT. Africa - - 0.1 - - - - - - 0.1
0
Total 131.7 93.9 45.0 33.8 29.3 16.3 4.7 1.6 1.6 354.7
European
-2 imports surged on the back of low prices, almost doubling Lastly, in the Middle East, the UAE increased imports by 0.6 MT,
to -4
85.9 MT from 48.9 MT in 2018. This accounts for 90% of the but Jordan’s imports decreased by 1 MT as Jordan reduced pipeline Source : GIIGNL
exports to Egypt further.
Kuwait
Jamaica
Egypt
Indonesia
Malta
Gibraltar
Japan
Canada
Jordan
Chinese Taipei
Malaysia
UK
Sweden
Colombia
Brazil
Portugal
Poland
(incld Puerto Rico)
South Korea
UAE
Argentina
China
Italy
Mexico
Singapore
Chile
France
Spain
Dominican Rep.
Pakistan
Thailand
Israel
Norway
Lithuania
Bangladesh
India
Greece
Turkey
Panama
Finland
Netherlands
Belgium
18 19IGU World LNG report - 2020 Edition LNG Trade
Table 2.2: LNG Trade Volumes Between Markets, 2019 (in MT)
Exporting Markets Algeria Angola Argentina Australia Brunei Cameroon Egypt Equatorial Indonesia Malaysia Nigeria Norway Oman Papua Peru Qatar Russia Trinidad UAE USA Re-exports Re-exports 2019 IMPORTS 2018 IMPORTS
Guinea New & Received Loaded
Importing Markets Guinea Tobago
Bangladesh 0.3 - - - - - 0.1 - 0.1 0.1 0.4 - 0.1 - - 2.8 0.3 - - - 0.1 - 4.1 0.7
China 0.1 0.1 - 28.2 0.6 0.5 0.2 0.4 4.5 7.5 2.0 0.1 1.1 2.8 0.7 8.5 2.8 0.8 0.1 0.3 0.5 0.1 61.7 54.0
Chinese Taipei - - - 4.4 0.2 0.1 0.1 0.1 0.4 2.5 0.2 - 0.1 1.5 0.1 4.7 1.5 0.2 0.1 0.5 0.1 - 16.7 16.8
India 0.2 2.9 - 1.0 - 0.4 0.2 0.5 - 0.4 2.7 0.1 1.0 - - 9.7 0.2 0.1 2.6 1.8 0.1 0.1 24.0 22.4
Pakistan 0.3 - - - - - 0.6 0.2 - 0.1 1.0 - 0.3 - - 4.8 - - 0.4 0.5 0.1 - 8.1 6.9
ASIA 0.8 3.0 - 33.6 0.8 1.0 1.2 1.3 5.0 10.6 6.2 0.1 2.6 4.2 0.8 30.4 4.8 1.1 3.2 3.0 0.8 0.1 114.5 100.8
Indonesia - - - 0.1 - - - - 3.6 - - - - - - 0.0 - - - - - - 3.6 3.0
Japan 0.1 - - 29.8 4.3 - 0.1 0.1 4.0 9.4 0.8 - 2.9 3.7 0.7 8.7 6.3 - 2.2 3.6 0.1 - 76.9 82.5
Malaysia - - - 1.5 0.7 - - 0.1 - 0.3 0.1 - - - - - - - - 0.1 0.1 - 2.7 1.4
Singapore - 0.1 - 1.9 - - 0.4 0.3 0.1 - 0.1 - - - - 0.1 - 0.1 - 0.6 - 0.4 3.3 2.6
South Korea - - - 7.6 0.6 - 0.1 0.1 2.3 4.7 0.6 - 3.9 0.3 1.1 11.1 2.4 0.1 0.2 5.0 0.1 - 40.1 43.9
Thailand - 0.1 - 0.8 - - 0.1 - 0.3 1.3 0.0 - 0.1 - 0.1 2.0 0.1 0.1 - 0.1 - - 5.0 4.4
ASIA-PACIFIC 0.1 0.1 - 41.8 5.6 - 0.7 0.5 10.3 15.7 1.5 - 6.9 4.0 1.9 21.9 8.8 0.2 2.4 9.5 0.3 0.4 131.7 137.8
Belgium - 0.1 - - - - 0.1 - - - - - - - - 3.3 1.4 - - 0.3 - 0.1 5.1 1.9
Finland - - - - - - - - - - - - - - - - 0.1 - - - - - 0.1 0.1
France 2.7 0.3 - - - - 0.3 - - - 3.0 1.1 - - 0.3 1.3 5.0 0.2 - 2.0 - 0.6 15.6 7.8
Gibraltar - - - - - - - - - - - - - - - 0.0 - - - - 0.1 - 0.1 -
Greece 0.4 0.1 - - - - 0.2 - - - 0.3 0.4 - - - 0.4 0.1 - - 0.2 - - 2.1 0.9
Italy 2.2 - - - - - 0.3 0.1 - - 0.1 0.1 - - - 4.7 0.1 1.1 - 1.2 0.1 - 9.8 6.1
Lithuania - - - - - - - - - - - 1.0 - - - - 0.3 - - 0.1 0.1 - 1.4 0.6
Malta - - - - - - - - - - - 0.1 - - - - - 0.3 - - - - 0.4 0.3
Netherlands 0.1 0.2 - - - - - - - - 0.2 0.3 - - 0.3 0.1 3.1 0.1 - 1.4 - 0.1 5.8 2.0
Norway - - - - - - - - - - - 0.1 - - - - - - - - - - 0.1 0.1
Poland - - - - - - - - - - - 0.1 - - - 1.7 - - - 0.7 - - 2.5 2.0
Portugal 0.1 - - - - - - - - - 2.4 - - - - 0.5 0.1 0.1 - 1.0 - - 4.1 2.9
Spain 0.8 0.2 - - - 0.1 - 0.1 - - 3.1 0.5 - - 0.3 3.2 2.3 2.1 - 3.1 - - 15.7 10.7
Sweden - - - - - - - - - - - 0.1 - - - - 0.1 - - - 0.1 - 0.3 0.2
Turkey 4.3 - - - - - 0.3 0.1 - - 1.8 0.1 - - - 1.8 0.1 0.3 - 0.7 - - 9.4 8.3
UK 0.7 0.1 - - - 0.1 - 0.2 - - 0.3 0.3 - - 0.2 6.6 2.4 0.7 - 2.1 - - 13.5 5.0
EUROPE 11.3 0.9 - - - 0.1 1.3 0.4 - - 11.2 4.2 - - 1.2 23.5 15.1 4.7 - 12.7 0.3 0.9 85.9 48.9
Argentina - - - - - - - - - - - - - - - - - 0.4 - 0.7 - - 1.2 2.6
Brazil - 0.1 0.1 - - 0.1 - 0.1 - - 0.2 0.2 - - - - - 0.4 - 1.1 - - 2.3 1.9
Chile - - - - - - - 0.1 - - - - - - - - - 0.6 - 1.7 - - 2.4 3.1
Colombia - - - - - - - - - - 0.1 - - - - - - - - 0.1 - - 0.2 0.3
Panama - - - - - - - - - - - 0.1 - - - - - 0.1 - 0.2 - - 0.4 0.2
Dominican Rep. - - - - - - - - - - 0.1 0.1 - - - - - 0.9 - 0.2 - - 1.2 0.9
Jamaica - - - - - - - - - - - - - - - - - 0.1 - 0.2 - - 0.3 0.2
LATIN AMERICA - 0.1 0.1 - - 0.1 - 0.3 - - 0.3 0.4 - - - - - 2.5 - 4.2 0.1 - 8.1 9.0
Canada - 0.1 - - - - - - - - - - - - - - - 0.3 - - - - 0.4 0.4
Mexico - - - - - - - 0.3 0.2 - 1.0 - - - - - - 0.4 - 2.9 - - 4.9 5.0
USA (incld. Puerto - - - - - - - - - - 0.1 - - - - - 0.1 2.3 - - - - 2.4 2.8
Rico)
NORTH AMERICA - 0.1 - - - - - 0.3 0.2 - 1.1 - - - - - 0.1 3.1 - 2.9 - - 7.7 8.2
Egypt - - - - - - 0.1 - - - - - - - - - - - - - - - 0.1 1.9
AFRICA - - - - - - 0.1 - - - - - - - - - - - - - - - 0.1 1.9
Israel - - - - - - - - - - - - - - - - 0.1 0.4 - - - - 0.6 0.5
Jordan - - - - - - - - - - - - - - - 0.1 0.4 0.2 - 0.8 - - 1.4 2.5
Kuwait 0.1 0.1 - - - - 0.1 - - - 0.4 - 0.7 - - 1.8 - 0.1 - 0.2 - - 3.6 3.4
UAE - 0.1 - 0.1 - - 0.1 - - - 0.1 - 0.1 - - - 0.1 0.1 0.3 0.4 0.1 - 1.4 0.8
MIDDLE EAST 0.1 0.3 - 0.1 - - 0.1 - - - 0.5 - 0.8 - - 1.9 0.6 0.8 0.3 1.4 0.1 - 6.9 7.2
2019 EXPORTS 12.2 4.4 0.1 75.4 6.4 1.3 3.5 2.8 15.5 26.2 20.8 4.7 10.3 8.2 3.8 77.8 29.3 12.5 5.8 33.8 1.6 1.6 354.7 -
2018 EXPORTS 10.1 4.0 - 66.7 6.4 0.6 1.4 3.4 18.2 24.7 19.7 5.2 10.0 7.0 3.5 76.8 18.3 11.6 5.5 20.6 3.8 3.8 - 313.8
Source : GIIGNL
20 213
IGU World LNG report - 2020 Edition
LNG and
Gas Pricing NBP front month contract Asian spot average
trading reached lowest
level in 10 years -
US$5.49/MMBtu,
lowest in 10 years
US$3.15/MMBtu
International gas prices in July
hit a record low in 2019. Asian spot reached a low of
NBP front month contract US$4.10/MMBtu
average in August
US$4.85/MMBtu
Henry Hub front month
prices averaged
US$2.53/MMBtu
Waha gas prices averaged
US$0.90/MMBtu
22 23IGU World LNG report - 2020 Edition LNG and Gas Pricing
3.0 LNG and Gas Pricing
International gas prices reached record low levels in 2019 driven by increasing
natural gas production, the commissioning of new export infrastructure and
limited demand response from Asian markets.
Turquoise P FSRU - Courtesy of Pardus Energy
24 2520
18
IGU World LNG report - 2020 Edition LNG and Gas Pricing
16
3.1
Given that LNG demand in Asia was flat year-on-year throughout the
14 by the oil price as a consequence of the large amount of Russian
summer of 2019, more and more volumes headed to Europe due imported volumes that are traded via long-term contracts indexed
12
to the region’s liquid markets and the slightly higher netback. This to Brent. Hence, the average landed price of natural gas imported to
OVERVIEW
resulted in a very loose European balance as pipeline exports from
10 Germany traded at a premium compared to NBP in 2019, as the oil
US$/MMBtu
Russia
8
and Norway remained steady. As a result, European prices price traded at a stable level compared to the NBP, which plummeted
also reached a historical low with the NBP front month contract during the same period. The drop in European and Asian spot prices
6
trading as low as US$3.15 per MMBtu in July 20191, the lowest level has resulted in wider spreads between oil-indexed contracts and
3.1 in4 ten years. The NBP front month contract averaged US$4.85 per spot prices. Asian spot prices tend to reach oil-indexed levels during
Figure 3.1: Monthly Average Regional Gas Prices 2010-2020 MMBtu in 20191. winters to attract flexible cargoes during periods of market tightness.
2
In September 2018, the spread between the JCC oil-indexed price
At0 the start of the winter, Northwest European prices jumped to a and the Asia Spot price was only US$0.30 per MMBtu, but widened to
20 level above US$5 per MMBtu, an increase of more than 25% driven by reach a maximum spread of US$6.71 per MMBtu in August 2019 and
Jan/ 2019
Jan/ 2015
Jan/ 2016
Jan/ 2017
Jan/ 2018
Jan/ 2012
Jan/ 2013
Jan/ 2014
Jan/ 2010
Jan/ 2011
Jul/ 2017
Jul/ 2018
Jul/ 2019
Jul/ 2014
Jul/ 2015
Jul/ 2016
Jul/ 2010
Jul/ 2011
Jul/ 2012
Jul/ 2013
-2
18 normal winter seasonality and some uncertainty regarding Russian ended the year at a level of US$4.80 per MMBtu.
exports through Ukraine. Despite the slight bump, winter prices
16
remained at the lowest level in ten years. Asian prices also increased With spot gas prices reaching record low levels, recent market
14 in line with winter demand, but prices
NE Asian spot LNG
remained atNBP
JCC Indexed
a historical
(UK)
lowBAFA
fundaments
(Germany) have also
Henrychanged
Hub (US) and have
Wahabeen
(US) reflected in LNG
level for the winter period, ending 2019 at only US$5.10 per MMBtu. contractual terms. Historically, most LNG contracts have been
12
Netbacks remained in favour of Europe, signalling the continued indexed to oil. The Fukushima disaster in 2011 drove up global gas
10 looseness in the international market. The German Border Price prices and pushed the average oil indexation level to above 14%, but
US$/MMBtu
8 (BAFA) averaged US$5.26 per MMBtu in 2019. This reflects an average that indexation has gradually declined again over the past years. First,
premium of US$0.4 compared to NBP during 2019, in contrast to the collapse in oil prices in 2015 brought the average slope down to
6 2018 when BAFA traded US$1.14 below NBP on average. As opposed 12% in 2016. Subsequently, lower gas spot prices drove down the oil
4 to the NBP, the price formation at BAFA is still heavily influenced indexation to an average level of 11% starting from late 2018.
2 3.2
Figure 3.2: LNG Sales and Purchase Agreements (SPAs) Average Oil Indexation by Signature Year, Percent
0
Jan/ 2015
Jan/ 2016
Jan/ 2017
Jan/ 2018
Jan/ 2019
Jan/ 2013
Jan/ 2014
Jan/ 2010
Jan/ 2011
Jan/ 2012
Jul/ 2015
Jul/ 2016
Jul/ 2017
Jul/ 2018
Jul/ 2019
Jul/ 2012
Jul/ 2013
Jul/ 2014
Jul/ 2010
Jul/ 2011
-2 15 %
NE Asian spot LNG JCC Indexed NBP (UK) BAFA (Germany) Henry Hub (US) Waha (US) 14 %
Average Oil Indexation %
Source: Rystad Energy, Bloomberg, Refinitiv
13 %
As a result of the increase in production and local oversupply in
Permian, Waha gas prices averaged US$0.9 per MMBtu in 2019,
down from US$2.01 per MMBtu in 2018. The Waha spot price turned 12 %
negative for a two-week period in April 2019. This deflated price
3.2
US$2.53/MMBtu
was triggered by a depression in local gas prices over the last few
quarters as well as a bottleneck created by a mismatch in production
growth and infrastructure to send volumes to market. A seasonal 11 %
Average Henry Hub gas demand decline was aggravated further by the failure of two
15 %
Front Month Prices, 2019 compressor stations within the El Paso Natural Gas Pipeline System.
Even though the capacity reduction was relatively small, the impact
10 %
on prices was dramatic, with the elasticity of local spot prices taking
14 % 2010 2011 2012 2013 2014 2015 2016 2017 2018 2019
an especially hard hit.
Average Oil Indexation %
After the summer of 2019, Waha prices recovered as new infrastructure Source: Rystad Energy
International gas prices reached record low levels in 2019 driven by helped debottleneck the Permian Basin. The Gulf Coast Express
13 % gas production, the commissioning of new export
increasing natural pipeline commenced operations in September 2019 and is capable of
infrastructure and limited demand response from Asian markets. transporting about 20 Bcm of natural gas eastward to the Agua Dulce The abundance of shale volumes being produced and exported for flexible supply and demand is challenging traditional business
receipt point near the Texas Gulf Coast. Since the commissioning of from the US has made Henry Hub a global gas price reference. US models in the LNG industry. A total of 36.8 MTPA of SPAs was
In the US, Henry Hub front month prices averaged US$2.53 per the pipeline, Waha prices averaged US$1.21 per MMBtu up to the end LNG exporters have created new business models and tend to sell signed in 2019, out of which 43% (15.8 MTPA) did not specify final
12 %
MMBtu in 2019 compared to US$3.07 per MMBtu in 2018, dented of 2019. However, there has been no material increase in West Texas their gas indexed to Henry Hub. While oil indexation is still common destinations. The trend of portfolio allocation has been well observed
by robust production growth from shale plays. Despite seeing a exports to Mexico due to ongoing infrastructure build-out delays in in Sales and Purchase Agreements (SPAs), there is an increasing on the demand side as well. LNG buyers are diversifying LNG sources,
significant amount of coal-to-gas switching and an increase in LNG Mexico. trend to tie LNG contracts to European gas prices (NBP and TTF), the allocating volumes to whichever destination that offers the best
exports during
11 2019,
% these developments have not been significant Japan/Korea Marker (JKM) and other hybrid pricing models involving economics.
enough to absorb the gas supply growth, leading to an overall decline Demand response across the US helped absorb some of the multiple commodities. In April 2019, Shell and Tokyo Gas grabbed
in prices. additional supplies coming into the market but this was not enough the entire world’s attention by signing the world’s first LNG contract The first quarter of 2020 has proven to be very challenging for natural
to prevent prices from falling. US natural gas demand increased from indexed to coal. In 2019, around 68% of volumes sold through long- gas and LNG producers, as historically low gas prices have prevailed
10 %gas supply increased from 850 Bcm in 2018 to 935
Total US natural 851 Bcm in 2018 to 875 Bcm in 2019, mostly driven by the power term contracts were indexed to oil while 24% were indexed to Henry throughout the winter season. First, the increase in LNG exports
Bcm in 2019, an increase2010 2011
of 10% year-on-year.2012 2013and
The Marcellus 2014 as it became
sector 2015 cheaper 2016to generate
2017power with
2018gas than2019
coal Hub. combined with a mild winter across the Northern Hemisphere lead to
Utica shales (in the Appalachia Basin) accounted for 45 Bcm of the in most states. US LNG exports also increased from 30 Bcm in 2018 a counter-cyclical drop in international gas prices. The bearish tone
growth in supply as new pipeline capacity supported sending the to about 50 Bcm in 2019 while net pipeline imports declined slightly Long-term contracts continue to play an important role in securing continued throughout February and March as markets around the
low cost gas out of the region. Another 27 Bcm was added from the by about 5 Bcm per annum. Despite the higher demand, gas flaring financing for the development of the liquefaction projects and world started to announce lockdowns in order to control the spread
Haynesville/Bossier Basin, which was made possible by improved increased in 2019 as infrastructure bottlenecks prevented delivery of supplies to importing markets. Out of the 362 MTPA sold through of the COVID-19 virus. The first to announce a lockdown was China,
well parameters for US shale wells. Longer laterals and higher all volumes into the market. SPAs during the past 10 years, 271 MTPA was sold with a contract resulting in a drastic drop in LNG imports as a result of the lower
proppant intensity contributed to lowered costs and improved well duration of more than 10 years. As an example, the 12.88 MTPA industrial and commercial activity. As the epicenter moved from
performance. In Asia, spot LNG prices averaged US$5.49 per MMBtu in 20191, the Mozambique LNG Area 1 recently managed to lock 11.18 MTPA, China to Europe, markets across the continent have started to take
lowest level in the last ten years. After reaching a peak of US$11.6 or 87% of its nameplate capacity, into long-term contracts before measures to control the spread of the virus. As of March 2020, it
Associated gas supplies from oil fields have also flooded the US per MMBtu at the end of September 2018 driven by Asian buyers re- reaching FID in June 2019. The typical new LNG SPA contract duration seems likely that more markets will decide on lockdowns. This will
market. The Permian Delaware and Permian Midland tight oil plays stocking ahead of the winter, prices had a prolonged slide throughout is now 11-20 years, rather than 20+ years which was a common lead to depressed commercial and industrial activity around the
increased natural gas supply from 2018 to 2019 by about 23 Bcm 2019, reaching a low of US$4.1 per MMBtu in August. The decline practice in the past. world, which will have a negative impact on gas demand throughout
combined. These volumes are considered as zero cost gas as they in prices was caused by a mild winter in both Asia and Europe and this crisis. The current market environment lowers the expectations
are driven by oil activity and oil prices. This has put Western Texas gas a continuous increase in LNG supplies mainly from the US but also The global LNG market is becoming more financially liquid, transparent of seeing a recovery in prices any time before the coming winter.
prices under pressure during 2019. from Russia, Australia and others. and competitive, and requires improved risk management. The need
1
Source: Refinitiv
26 274
IGU World LNG report - 2020 Edition Liquefaction Plants
FIDs and Under Construction
Liquefaction
Plants
Record FIDs of liquefaction
projects, totalling
70.8MTPA
Global liquefaction capacity reached FIDs were taken in USA,
Mozambique, Russia
430.5 MTPA in 2019. and Nigeria
Capacity Additions for 2019 Global liquefaction capacity
forecasted to reach
42.5MTPA 454.8MTPA
of liquefaction capacity by end 2020
brought online
Liquefaction capacity
11% forecasted to be added in
2020 in USA, Indonesia,
year-on-year
Malaysia and Russia
growth vs 2018
Australia Qatar
87.6MTPA overtook
77.1MTPA Pre-FID
as the market with the highest
liquefaction capacity
907.4 MTPA
of liquefaction capacity
Capacity added in currently in pre-FID stage
Australia, Russia,
USA and Argentina
350.5MTPA 50.0MTPA 42.2MTPA
from USA from Australia from Russia
221.8MTPA 49.0MTPA
from Canada from Qatar
28 29IGU World LNG report - 2020 Edition Liquefaction Plants
4.0 Liquefaction Plants
In 2019, around 42.5 MTPA of liquefaction capacity was brought online, increasing global
liquefaction capacity to 430.5 MTPA1. This represents 11% year-on-year growth from 2018,
well above the growth rate from 2017 to 2018. Ichthys LNG T1-2 (8.9 MTPA) and Yamal
LNG T3 (5.5 MTPA) started up in late 2018, and began delivery of commercial cargoes
in 2019. Corpus Christi LNG T1-2 (9 MTPA), Cameron LNG T1 (4.0 MTPA), Freeport LNG
T1 (5.1 MTPA), Sabine Pass T5 (4.5 MTPA) and Elba Island T1-3 (0.75 MTPA) commenced
commissioning activities in 2019 and began commercial operations later in the year,
contributing to more than half of the capacity additions from North America alone.
Prelude FLNG (3.6 MTPA) and Tango FLNG (0.5 MTPA) achieved commercial exports in
June 2019, becoming the third and fourth operational FLNG developments in the world,
after Petronas FLNG Satu (1.2 MTPA) and Cameroon FLNG (2.4 MTPA). Besides, Vysotsk
LNG (0.66 MTPA) in Russia also commenced commercial operation in the year. Freeport
T2 (5.1 MTPA) started commercial operation at the beginning of 2020, increasing global
liquefaction capacity to 435.6 MTPA as of January 2020.
Tango FLNG - Courtesy of Exmar
1
The number includes liquefaction capacity of Marsa El Brega LNG, Bontang LNG Train C-D, Yemen LNG and Damietta LNG, which have currently suspended operations. The
number excludes liquefaction capacity of Kenai LNG, as parts of the LNG plant may be converted to an import terminal.
30 31IGU World LNG report - 2020 Edition Liquefaction Plants
with a capacity of 0.25 MTPA per train. The required volume of long-
4.1
Currently, 907.4 MTPA of liquefaction capacity is in the pre-FID
term offtake to secure project financing is therefore significantly lower stage. Global liquefaction capacity could almost triple if all proposed
as compared to traditional large-scale LNG plants. Some projects also projects materialise. The majority of the proposed capacity additions
employ the concept of small- to mid-scale LNG trains and develop come from North America (599.6 MTPA), with 350.5 MTPA located in
OVERVIEW
them in phases, depending on offtake sales. This method significantly the United States, 221.8 MTPA in Canada and 27.4 MTPA in Mexico.
reduces project investment risk. It also enables later phases to be Africa (93.3 MTPA), Asia Pacific (72.4 MTPA) and the Middle East (93.3
financed by cash flow from earlier phases. MTPA) follow North America, with significant proposed liquefaction
capacity in the pipeline as well. 48.8 MTPA of liquefaction capacity is
Portfolio contracts3 offer flexibility for both suppliers and consumers. proposed in the rest of the world. However, not all of this planned
4.1 Under portfolio contracts, suppliers can send LNG cargoes to capacity is needed and only the most competitive projects will move
customers that bring the highest revenue while the buyers can ahead.
Figure 4.1: Global Liquefaction Capacity by Region and Status, as of December 2019
4.1 LNG sources, allocating volumes to destinations that offer
diversify
the best economics. On the sell side, the percentage of portfolio Due to the low LNG prices in 2019, and into 2020 amid a global LNG
volumes out of total contracted volumes globally has been on the supply surplus and uncertainties in the trade environment, some of
rise. Portfolio volumes totaled 26% out of the volumes contracted the proposed projects are seeing slower progress towards FID. With
1000 between 2016 and 2019, compared to 20% between 2011 and 2015, the additional effect of COVID-19 on stock markets, many companies,
and 10% between 2006 and 2010. On the buyer side, Shell, BP, Total, including those in the energy industry, are struggling financially,
900 10004 have purchased the largest portfolio volumes without
and Engie further delaying progress of projects. However, the current LNG
specifying the destinations of purchases. Japanese buyers have supply surplus situation could change if global LNG demand growth
800 900 interest in becoming portfolio players, as evidenced by
also shown outpaces supply growth, which in turn would trigger new FIDs.
redirecting excess volumes to other markets during periods of low
700 800demand.
domestic
600 700
500
4.2. 600
MTPA
400 500
GLOBAL LIQUEFACTION CAPACITY
MTPA
300 400
200 300
100
0
AND UTILISATION 200
100
Europe Latin America Former Soviet Africa Middle East Asia Pacific North America Total
0 Global liquefaction capacity reached 430.5 MTPA at the end of 2019
Union
Africa and the utilisation
East rateAsia
wasPacific
on average 81.4% .
5
Europe Latin America Former Soviet Middle North America Total
430.5 MTPA
Existing FID Pre-FID Union
Source: Rystad Energy
Existing FID Pre-FID
10 out of 22 LNG exporting countries achieved utilisation rates
Global Liquefaction Capacity, End of 2019 of more than 90% in 2019, including Norway, Russia, Papua New
4.2 Guinea, Qatar, Oman, the United States, Brunei, UAE, Trinidad and
Liquefaction capacity expansion is set to continue in 2020 and is the market has no operational LNG facilities, but the sanctioning of Tobago, and Nigeria.
expected to reach 24.35 MTPA in capacity additions. Freeport T2 Mozambique LNG (Area 1) in 2019 and Coral South FLNG in 2017, 4.2
(5.1 MTPA) started commercial deliveries in January 2020. Cameron followed by a potential FID on Rovuma LNG (Area 4) in 2020 would
LNG T2 (4.0 MTPA) produced its first LNG cargoes in late 2019, and allow Mozambique to emerge as the largest African LNG exporter. In
the facilities Figure 4.2: Global Liquefaction Capacity Utilisation in 2019 ( Capacity is Prorated )
140%are scheduled to start commercial deliveries in 2020. West Africa, the 8 MTPA expansion project at NLNG reached FID at
The ongoing site construction activities at Freeport LNG T3 (5.1 the end of 2019, after securing a 20-year gas supply deal, increasing
MTPA), Cameron LNG T3 (4 MTPA), Elba Island T4-T10 (1.75 MTPA) NLNG’s liquefaction capacity to 30 MTPA and reaffirming Nigeria’s 140%
120% LNG T1 (0.5 MTPA)2 are about to be completed and
and Sengkang position as an important LNG hub. The sanctioning of Arctic LNG
commercial operations can be expected by the end of 2020. In 2 shows growing interest in developing liquefaction facilities in the 120%
addition,100%
Petronas FLNG Dua (1.5 MTPA) sailed away to the Rotan Arctic region, where projects are able to leverage abundant gas
field in Malaysia in February 2020 and will start commercial deliveries resources, geographic flexibility in exporting toAverage
both 81.4%
Europe and
9 months later. In Russia, two mid-scale LNG plants, including Asia, as well as take advantage of the climate for improved cooling 100%
Portovaya80%LNG T1 (1.5 MTPA) and Yamal LNG T4 (0.9 MTPA), are also efficiencies in the Arctic environment. Average 81.4%
aiming for commercial operation by the end of 2020. With those
Utilisation (%)
80%
projects coming
60% online, global liquefaction capacity is forecasted to Long-term Sales and Purchase Agreements (SPAs) continued to
further expand to 454.85 MTPA by the end of 2020. play a key role in securing financing for certain LNG projects, as
Utilisation (%)
demonstrated by some of the new projects sanctioned in 2019. 60%
2019 saw40% a record volume of sanctioned liquefaction projects, Mozambique LNG (Area 1) had close to 90% of its nameplate capacity
totaling 70.8 MTPA, compared to 21.5 MTPA in the previous year. under long-term SPAs at the time of FID. Calcasieu Pass LNG had 40%
Golden Pass
20% LNG (15.6 MTPA) was sanctioned in February 2019, signed 20-year SPAs with Shell, BP, Repsol, Edison, and a few other
followed by the 12.9 MTPA Mozambique LNG (Area 1) FID in June companies ahead of FID. The FID of Sabine Pass Train 6 was also
2019. Calcasieu Pass LNG (10 MTPA) and Arctic LNG 2 (19.8 MTPA) underpinned by long-term offtake agreements with Petronas and 20%
0%
FIDs were announced in August and September 2019, respectively. Vitol, covering more than 40% of the new train’s liquefaction capacity
Also, a few brownfield expansion plans received the greenlight for at the time of sanctioning. 0%
investment in 2019. Sabine Pass LNG, the first LNG export plant in
service in the continental United States, took FID on its sixth train with However, as the global LNG market gets increasingly competitive
a 4.5 MTPA capacity and NLNG reached FID on its 8 MTPA expansion and shorter-term contracts or spot deliveries become more common
plan in December 2019. The project includes a new 4.2 MTPA train over time, LNG projects are taking more investment risks, taking FIDs
and debottlenecking of existing facilities. without securing a significant number of long-term SPAs. Golden
Pass LNG moved forward with FID in 2019, without announcing any
The record volume of sanctioned liquefaction projects is underpinned long-term offtake contracts. Ocean LNG, a joint venture established
by the expectation of growing LNG demand globally, creating the need by Qatar Petroleum and ExxonMobil, the two project owners, is
for additional liquefaction capacity. This will also lead to competition responsible for marketing the produced LNG. The sanctioning of
to secure EPC capacity, as project developers aim to enter the market LNG Canada in 2018 was on a similar basis and the project was fully
by the mid-2020s in order to capture growing demand. equity financed, rather than debt financing backed by long-term
offtake agreements. Arctic LNG 2 reached FID with an expectation Source: Rystad Energy, Refinitiv
The United States continued to contribute significantly to LNG project of equity partners offtaking LNG production proportionate to their
sanctions in 2019, totaling 30.1 MTPA, thanks to the availability of ownership stakes, and the project may market a significant portion of
4.3 shale gas in the region. The African continent had 20.9
abundant production via spot deliveries. The incremental supply of liquefaction capacity in 2019 was largely contributed by projects in the United States. Corpus Christi LNG T1-2 (9
MTPA of liquefaction capacity sanctioned in 2019, driven by growing MTPA),
4.3Cameron LNG T1 (4.0 MTPA), Freeport LNG T1 (5.1 MTPA), Sabine Pass T5 (4.5 MTPA) and Elba Island T1-3 (0.75 MTPA) collectively
interest in commercialising the continent’s rich gas resources. In Competition to secure long-term offtake contracts is also driving the
East Africa, contributed 55% of the global capacity additions.
700 the sanctioning of Mozambique LNG (Area 1) is starting development of small- to mid-scale LNG projects. Elba Island LNG
to change the role of Mozambique in global LNG supply. Currently, bases its design on Moveable Modular Liquefaction System (MMLS)
700
600 3
Portfolio contracts are contracts that don’t specify origins of supply or destinations of delivery. Thus, the seller can decide on where to supply each cargo from, and the
buyer can decide where each cargo will be delivered.
600
4
Engie’s LNG portfolio was subsequently acquired by Total in 2018 (the deal was announced in 2017).
2
Site construction at Sengkang LNG is close to completion. However, the project may face delays, subject to local authorities’ approval on land use.
500 5
The average utilisation excludes Yemen and Libya, which did not produce any LNG in 2019. Utilisation is calculated on a prorated basis, depending on when the plants are
commissioned. Only operational capacity (including liquefaction capacity of Marsa El Brega LNG, Bontang LNG Train C-D, Yemen LNG and Damietta LNG) is included.
500
32 33
400
AYou can also read