The dilemma of gas importing and exporting countries - Oxford ...
←
→
Page content transcription
If your browser does not render page correctly, please read the page content below

August 2020

    The dilemma of gas importing and
           exporting countries

OIES Paper: NG 161   Ieda Gomes, Visiting Research Fellow, OIES

                                                                  i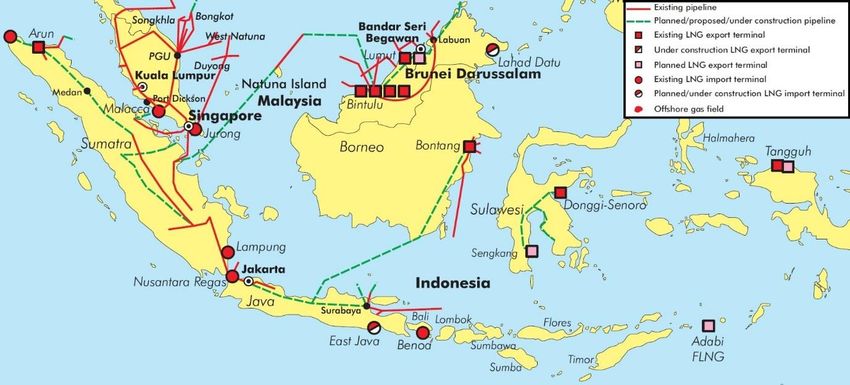
The contents of this paper are the author’s sole responsibility. They do not
         necessarily represent the views of the Oxford Institute for Energy Studies or any of
                                            its members.

                                          Copyright © 2020
                               Oxford Institute for Energy Studies
                                  (Registered Charity, No. 286084)

This publication may be reproduced in part for educational or non-profit purposes without special
permission from the copyright holder, provided acknowledgment of the source is made. No use of this
publication may be made for resale or for any other commercial purpose whatsoever without prior
permission in writing from the Oxford Institute for Energy Studies.

                                      ISBN 978-1-78467-162-4

                           DOI: https://doi.org/10.26889/9781784671624

                                                                                                      i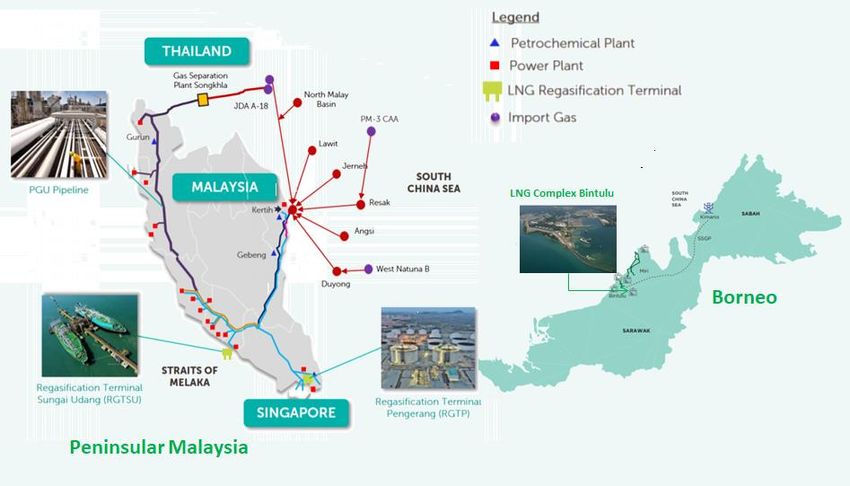
Contents
Contents ................................................................................................................................................. ii
Figure ..................................................................................................................................................... ii
Preface ................................................................................................................................................... 1
Acknowledgements .............................................................................................................................. 2
Introduction ........................................................................................................................................... 3
Malaysia ................................................................................................................................................. 4
     Context and evolution ...................................................................................................................... 4
     The dynamics of natural gas exports and imports .......................................................................... 7
     Natural gas prices: subsidies and reforms .................................................................................. 10
     The outlook for supply and demand .............................................................................................. 13
     Key insights ................................................................................................................................... 15
Indonesia.............................................................................................................................................. 16
     Context and evolution .................................................................................................................... 16
     The dynamics of natural gas exports and imports ........................................................................ 17
     LNG supplies to domestic market ................................................................................................. 21
     Gas supply and demand outlook ................................................................................................... 23
     Natural Gas Prices and Subsidies................................................................................................. 25
     Key insights ................................................................................................................................... 27
Argentina.............................................................................................................................................. 28
     Context and evolution .................................................................................................................... 28
     The dynamics of natural gas imports and exports ........................................................................ 30
     Argentina natural gas prices and subsidies .................................................................................. 32
     Natural gas demand scenarios ...................................................................................................... 36
     Key insights ................................................................................................................................... 39
Conclusions ......................................................................................................................................... 40
Glossary/Acronyms ............................................................................................................................ 43
Bibliography ........................................................................................................................................ 44

Tables
Table 1: Impact of forgone revenue and implied opportunity gas price for Petronas ........................... 11
Table 2: Malaysia: Potential LNG imports forecast (2019-2040) .......................................................... 15
Table 3: Indonesia: existing LNG receiving terminals ........................................................................... 22
Table 4: Indonesia natural gas supply/demand forecast ..................................................................... 24
Table 5: Argentina: LNG and pipeline netback prices to Vaca Muerta (Neuquén) ............................... 39

Figure

Figure 1: Malaysia natural gas and LNG infrastructure .......................................................................... 6
Figure 2: Malaysia: natural gas supply and demand evolution ............................................................... 7
Figure 3: Malaysia: revenue forgone by Petronas due to subsidies to end-users ................................ 10
Figure 4: Malaysia: Discounted LNG-based gas prices for domestic users (as of January 2014) ....... 11
Figure 5: Malaysia: Natural gas prices for regulated and LNG indexed consumers (2014-2019)........ 12
Figure 6: Malaysia: Gas prices for large end-users compared to domestic supply and LNG .............. 13
Figure 7: Malaysia: Peninsular Malaysia power generation capacity mix forecast (2020-2030) .......... 14
Figure 8: Malaysia: LNG expiring contracts and volumes .................................................................... 15
Figure 9: Indonesia: Natural gas consumption by sector (2018) .......................................................... 18
Figure 10: Indonesia: Evolution of natural gas supply, demand and exports 1976-2019 ..................... 19
Figure 11: Indonesia: Natural gas and LNG infrastructure ................................................................... 20
Figure 12: Indonesia: Pipeline gas and LNG exports vs domestic demand ......................................... 21
Figure 13: Indonesia: LNG export cargoes vs LNG to domestic market allocation (2019) .................. 23
Figure 14: Indonesia: Natural gas balance (2016-2050) ...................................................................... 23

                                                                                                                                                             ii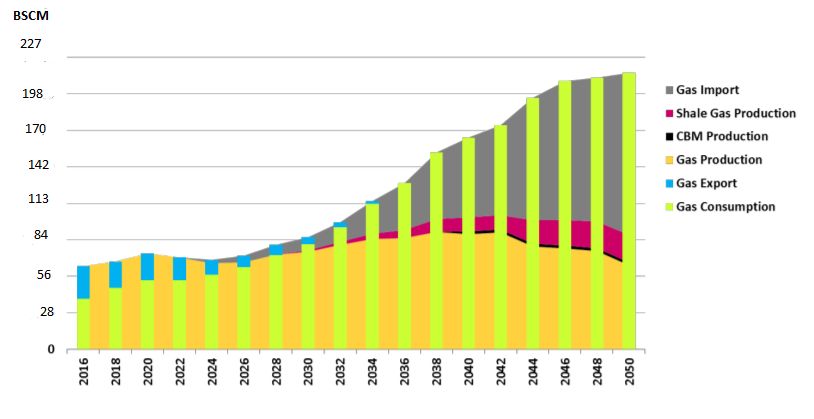
Figure 15: Indonesia: LNG export contracts expiry dates and volumes ............................................... 25
Figure 16: Indonesia: natural gas price composition (2016) ................................................................. 26
Figure 17: Indonesia natural gas price subsidy implemented in 2020 .................................................. 27
Figure 18: Argentina: natural gas consumption by segment – 2019 (BCM) ......................................... 29
Figure 18: Argentina: Configuration of the Argentine gas market after 90’s restructuring ................... 30
Figure 19: Argentina: Evolution of natural gas supply, demand, imports and exports (1992-2019) ..... 30
Figure 20: Argentina: Evolution of the energy import and export balance ............................................ 33
Figure 21: Argentina: natural gas producers’ wellhead prices and incentives (2012-2019) ................. 34
Figure 22: Argentina: natural gas subsidies to end-users (2015-2019) ................................................ 34
Figure 23: Argentina: Average cost of supply and end-user prices (2015) USD/MMBtu ..................... 35
Figure 24: Argentina: Natural gas price for power plants vs Weighted Average Cost of Supply ......... 36
Figure 25: Argentina: Natural gas import profile and seasonality ......................................................... 38
Figure 26: LNG plant capacity utilization factors in 2018 ...................................................................... 38
Figure 27: Natural gas subsidies and the broken cycle of supply and demand .................................. 40

                                                                                                                                 iii
Preface
At a time of low prices and an apparent surplus of supply in the global gas market it is important to try
and identify new sources of demand, especially for LNG. In this respect, one interesting theme is how
some countries are switching from their traditional role as LNG exporters to becoming importers of gas
as their indigenous demand grows. Ieda Gomes explores this concept using the case studies of
Malaysia and Indonesia, and she attempts to identify the key drivers behind the shifts in the gas
economies of both countries.
Significantly, though, there are a few countries where gas has an existing role in the domestic energy
economy, and which have historically imported gas, which have now found new gas resources and are
starting to export. A prime example of this is Argentina, where the discovery of large shale gas
resources has led to a gas surplus and the opportunity to generate export revenues. This paper
analyses this example as a contrast to the first two and examines whether it is a sustainable situation.
Overall, we believe that this paper can provide some important insights into the factors which can
influence the position of gas in a country’s energy balance, especially if the prevalence of hydrocarbons
has created a dependency via subsidies prices or other politically-driven strategies. There are a number
of other examples around the world (Algeria could become a prime instance) where the demands of
the domestic market can undermine a country’s ability to export its energy resources, and as a result
we hope that this analysis can provide a greater understanding of the key drivers and consequences of
this outcome.
James Henderson
Director, Natural Gas Programme
Oxford Institute for Energy Studies
1Acknowledgements
This paper results of a comprehensive research on official documents and press materials as well as
interactions with gas industry players in Argentina, Indonesia and Malaysia.
I am very grateful for the insights and country information from industry colleagues in Argentina,
Malaysia, and Indonesia for their helpful comments and information.
I would like to thank Dr. James Henderson, Director of the Natural Gas Programme, Mr. Michael
Fulwood and Prof. Jonathan Stern, who have read and commented on the paper.
My special thanks to Mr. John Elkins for his excellent editing and to Kate Teasdale for her administrative
support.
The responsibility for all the views expressed and all the conclusions reached is solely mine.
2Introduction
Over the last 5-10 years a growing number of erstwhile natural gas exporting countries started to import
either LNG or pipeline gas, or both to meet growing supply demand imbalances. Amongst these
countries we can count Malaysia, Indonesia, Argentina, Egypt, Oman, the UAE, Myanmar and even the
United Kingdom. In some cases, such as Argentina and Egypt, as imports ramped up there was a
moratorium on exports. In others, such as Malaysia and the UAE, high value LNG exports were
maintained whilst imported LNG and pipeline gas satisfied the demand in the power and industrial
sectors. In Oman, there was a continuity of exports, but the LNG plants had to curtail production so that
feed gas could be diverted to the domestic market. In Indonesia, besides reducing and even shutting
LNG production, part of the LNG output was reserved to the growing domestic market. In the United
Kingdom, the decline in production from the North Sea fields, lack of seasonal storage availability and
pipeline connectivity with Europe prompted pipeline imports followed by LNG imports in 20051.
Such dynamics are a result of, among other factors:
the initial availability of low cost domestic gas 2 spurring fast growth in domestic demand,
followed by depletion of domestic resources;
lack of gas transportation infrastructure connecting remote producing regions with key
consuming markets, which in turn fosters either the development of local LNG receiving
terminals or chokes natural gas production; and
Governments’ goals to promote industrialisation through the availability of cheap gas, resulting
in falling investment in exploration and development of gas resources, as producers are not
remunerated in line with cost of supply.
The availability of lower-CAPEX fast track floating regas schemes has facilitated the development of
LNG receiving terminals, allowing the supply of gas to regional markets within 2-3 years from project
concept to implementation. The willingness of suppliers to sell on spot and short-term LNG contracts
and the support of the host government have also been instrumental in the implementation of such
schemes.
This paper will look at three countries: Malaysia, Indonesia, and Argentina, where natural gas plays a
leading role in the energy mix and where the government exerts heavy influence on pricing and
regulation. There are two main distinctive categories of LNG/gas importing/exporting countries, as
exemplified below:
1. Countries with an established gas market which resorted to imported LNG when domestic production
started to fall due to fast demand growth and disincentives to domestic gas exploration resulting in
gas/energy shortages, for example Argentina.
Argentina: In the first half of the 2000s Argentina exported gas via eight pipelines supplying
Chile, Brazil and Uruguay. Government intervention and subsidies to end-user prices led to a
halt in exploration investment and accelerated growth in gas consumption. In 2005 Argentina
started to curtail and finally interrupted all gas exports and in 2008 it started importing LNG. In
2016 it started to import LNG delivered to Chile’s terminals and transported through the reversal
of flow of the existing gas export pipelines. Argentina also increased the amount of pipeline
imports from Bolivia. More recently, Argentina’s fortunes have changed as domestic gas
production, mostly from higher cost, incentivised unconventional resources, jumped to the point
where Argentina is gradually reducing imports and has started to export to Chile again during
summer months. In 2019 Argentina imported 1.7 BCM of LNG vs 3.5 Bcm in 2018 and became
an LNG exporter (0.08 BCM).
1
The UK started importing LNG in 1959 at Canvey Island but the terminal was closed in 1994. (Canvey Island, 2010)
2
Often Associated Gas or Government entitlement to profit gas from Production Sharing Contracts
32. Countries where the LNG producing facilities are located in remote regions and the gas fields feeding
these plants are not connected to regional demand markets due to technical and economic reasons.
This is the case of Indonesia and Malaysia.
Malaysia, currently the world’s 5th largest LNG exporter, it started importing LNG in 2012, via
a FSU3 scheme located in peninsular Malaysia (Melaka LNG). In 2019 Malaysia exported 32.8
BCM and imported 3.74 BCM of LNG. The LNG export facilities are located on the island of
Borneo and there is no pipeline connection between the island and Peninsular Malaysia. A
second import terminal (shore based), Pengerang LNG, was commissioned in 2017 to serve
the petrochemical and refinery complex being developed currently by Petronas and partners.
Also in 2017 Malaysia’s first floating LNG production plant (Satu) offloaded its first cargo
offshore at the Kanowit field. Malaysia also imports pipeline gas from Indonesia and exports
pipeline gas to Singapore. In 2019 it exported 1.5 BCM and imported 6.0 BCM of pipeline gas.
There is a continuous decline in production from the gas fields around Peninsular Malaysia.
Indonesia, whilst dropping to the position as 7th LNG exporter, with three liquefaction plants
(Bontang, Tangguh and Donggi Senoro), it started to develop small LNG importing facilities in
2012, initially aimed to supply isolated island markets. There are now four operating LNG regas
facilities in operation with a 5th under construction. In 2019 Indonesia exported 19.1 BCM of
LNG and supplied 4.3 BCM of domestic LNG to its internal market whilst exporting 14.5 BCM
of pipeline gas to Malaysia and Singapore 4 . The Government imposes a domestic market
supply obligation (at least 25%) as a condition for the approval of the expansion or construction
of LNG projects.
This paper looks at the circumstances leading to the development of gas importing projects in exporting
countries; reviewed market fundamentals, pricing policy and regulation; assesses the sustainability of
such import/exporting schemes; and focuses on key lessons learned.
Malaysia
Context and evolution
The economy of Malaysia is heavily dependent on hydrocarbons. The oil and gas industry is currently
the second-highest export earner, accounting for 15.5% of the country exports in 2018. LNG represents
nearly 5% of the Malaysia export earnings5.
The Malaysian natural gas industry was first established in the early 60s’ in the wake of significant
discoveries offshore Borneo and in the shallow waters of Peninsular Malaysia. In the early days,
International Oil Companies (IOC’s) dominated the oil and gas sector in the country, operating under a
royalty and tax fiscal regime. In the wake of the first oil price shock of 1973, the Government of Malaysia
decided to create its own national oil company in order to exert control over the country’s oil and gas
resources. The Malaysian Petroleum Development Act of 1974 allowed for the creation of PETRONAS,
which was granted the exclusive rights to explore, develop and produce petroleum resources within
Malaysia and to regulate the upstream sector6. Petronas changed the oil & gas concession contracts
into production share contract agreements, with rights granted by Petronas to private players.
Petronas commissioned a Gas Master Plan in 1981, in line with the government Import Substitution
Industrial Strategy II, based upon the implementation of heavy industries and large-scale production for
export, which in turn required cheap and available energy. This set the scene for the development of a
comprehensive gas transportation and gas utilization infrastructure.
3
FSU: Floating Storage Unit
4
(IEA, 2019)
5
http://www.worldstopexports.com/malaysias-top-10-exports/
6
https://malaysiangas.com/wp-content/uploads/2019/03/Natural_Gas_Industry_Review-2017.pdf
4In 1983 PETRONAS Gas Berhad (PGB) was incorporated as a wholly owned subsidiary of PETRONAS
with the mission to build the backbone of Malaysia’s transportation system, the Peninsular Gas
Utilization (PGU) project. PGB operates the midstream gas infrastructure, including processing and
transporting natural gas produced in the offshore fields to the markets in Malaysia and Singapore and
LNG regasification plants. The 2,613 km PGU system was completed in 1998 and delivers gas to power
plants and large industrial consumers, with current capacity of 36 BCM/year.
Gas Malaysia Berhad (GMB), an affiliate of Petronas, was incorporated in 1992 and is the regulated
downstream business, in charge of distribution services and gas marketing for 38,000 retail customers,
including small industries, and the commercial and residential sectors. 7 Meanwhile in Malaysian
Borneo, Sarawak Gas Distribution Company serves Sarawak gas consumers whereas Sabah Energy
Corporation serves natural gas consumers in the state of Sabah.
PGB transports and supplies gas to customers using more than 0.05 BCM/year of gas while GMB
serves customers using less than 0.05 BCM of gas (previously below 0.02 BCM/year).
LNG is produced in Sarawak, at the Bintulu complex, on the island of Borneo. Malaysia started to export
LNG in 1983 (MLNG Satu, three trains), followed by MLNG Dua (three trains) in 1995, MLNG Tiga, two
trains in 2003 and Petronas LNG Train 9 (PL9SB), with first LNG delivered in 2016. The Bintulu LNG
complex comprises nine LNG trains, with capacity totalling 29.3 mtpa. Petronas has also commissioned
a floating 1.2 mtpa liquefaction plant (PFLNG Satu), with first LNG delivered in April 2017. A second
floating liquefaction plant (PFLNG Dua) is expected to start operations in 2020.
In 2013 PGB commissioned the first LNG import terminal in Malaysia (RGTSU), located in Melaka,
which consists of two moored FSUs and a jetty-based LNG vaporiser (5.5 Bcm); in 2017 PGB
commissioned a second import terminal, the onshore LNG import facility in Pengerang, Johor (RGTP),
with 5.1 Bcm capacity. 8 The second terminal aims to supply the Pengerang Integrated Complex,
consisting of petrochemical plants, a 300,000 bbl/day refinery and a 1,220 MW power plant.
Figure 1 depicts key parts of the gas and LNG infrastructure in Peninsular Malaysia and Borneo
(Sarawak and Sabah states).9
7
https://www.gasmalaysia.com/images/download/corporate-presentation/Analyst%20Briefing_%2025March2016.pdf
8
https://www.petronasgas.com/OurBusiness/Pages/Regasification.aspx
9
Not to scale
5Figure 1: Malaysia natural gas and LNG infrastructure
Source: Adapted by the Author from (Petronas Gas Berhad (PGB), 2019) and (Saim, 2019)10
Natural gas plays an important role in Malaysia’s energy mix, accounting for 35.8% of the primary
energy supply in 2018.11 Successive government plans have been put in place, aiming at diversifying
Malaysia’s energy mix by increasing the share of natural gas, which was only 16% in 1990.
As of December 2018, Malaysia stood as the second largest producer and consumer of natural gas in
Southeast Asia. In 2019 it dropped from 3rd to 5th largest LNG exporter in the world (34.8 BCM), after
Qatar, Australia, USA and Russia.12
Malaysia has two distinctive gas consuming/producing regions with the following features:
Borneo (states of Sarawak and Sabah)
o The key gas consuming facility is the LNG liquefaction complex in Bintulu (Sarawak),
supplied with gas produced from offshore Sarawak and Sabah’s gas fields. A 512 km
pipeline transports gas from Sabah to Bintulu.
o Power and non-power consumers in Sarawak and Sabah
Peninsular Malaysia
o Gas supplies from
Peninsular Malaysia offshore fields
Imported gas from Indonesia offshore, Natuna Block B
Offshore gas from the Malaysia-Thailand Joint Development Area (JDA) and Malaysia-
Vietnam PM3 Commercial Arrangement Area (CAA)
10
Map not on scale
11
(BP plc, 2019)
12
(BP plc, 2019), (International Gas Union, 2020)
6 Imported LNG through two terminals in Melaka and Johor – in 2018 Malaysia imported
1.69 Bcma from Australia and Brunei
o Key gas consumers: power, petrochemicals, refinery, and other industries
o Gas exports by pipeline to Singapore
The dynamics of natural gas exports and imports
Malaysia displays distinctive features when compared to other emerging gas markets, because it has
a large, albeit declining, domestic gas production and, at the same time, the country exports and imports
pipeline gas and imports and exports LNG. In addition, Petronas has developed a large and
comprehensive international oil and gas business, with investments in the Americas, Europe, Australia,
Africa and the Middle East.
The evolving dynamics of gas exports and imports in Malaysia can be explained by the following factors:
Government encouragement for the use of natural gas to underpin Malaysia’s industrialisation.
Geographical disconnection between gas production regions in the island of Borneo (Sarawak
and Sabah) and gas consuming regions in Peninsular Malaysia. The latter have been
historically supplied by neighbouring maturing fields whereas Borneo’s production was
channelled to LNG export projects, underpinned by long term SPAs.
Decades-long gas price control by the government, fostering demand and inefficient use of
energy, burdening Petronas investment capacity and discouraging the development of more
expensive domestic production.
Ageing and depleting gas fields in Peninsular Malaysia, without price support to develop more
expensive marginal and deeper prospects, leading to the implementation of LNG import
terminals.
Figure 2: Malaysia: natural gas supply and demand evolution
100
80
60
40
BCM
20
-
1980 1983 1986 1989 1992 1995 1998 2001 2004 2007 2010 2013 2016
(20)
(40)
(60)
Production Pipeline Imports LNG Imports
LNG Exports Pipeline Exports Consumption
Source: (IEA, 2019)
Malaysia’s export/import dynamics can be characterized by four phases (see also Figure 2) above.
1. 1983-1996: Balanced supply/demand in Peninsular Malaysia and start of exports from Bintulu
(Sarawak province)
7This period was characterized by a steady production growth, which allowed meeting a growing
domestic demand as well as the start of pipeline exports to Singapore (1992) and LNG from Bintulu
(1983).
The then modest country demand was concentrated in Peninsular Malaysia, which was supplied by
eastern Malaysia offshore gas fields, mostly associated and in shallow water, whereas Sarawak
offshore fields supplied the LNG plants and the local market. Due to the distance from Sarawak to
Peninsular Malaysia it was not economical to build pipelines linking the two regions.
During the period 1983-1992 domestic demand grew 13.82%/year on average as a result of the
government’s goal to diversify the Malaysian economy from commodity-exporter into an export-
orientated manufacturing Asian Tiger. Such ambition was enabled by the construction of the
countrywide transmission pipeline (the Pipeline Gas Utilization - PGU) and by the availability of low cost
shallow water gas. In addition there was a small surplus: in 1992 Malaysia started pipeline exports to
Singapore and, in 1995, Petronas commissioned new trains for MLNG. It was a period of accelerated
economic growth with GDP expansion peaking at 10% in 1996.
2. 1997-2002: The Asian crisis of 1997-1998 and government intervention on gas prices
The economic crisis in Asia resulted in slower growth of domestic consumption (1999-2002), and short-
term stagnation in LNG exports and domestic production.
Until 1997, gas prices to domestic consumers were based on cost of supply plus a margin for Petronas,
and linked to international prices of oil products (Marine Fuel Oil). With the sharp devaluation of the
domestic currency, the government intervened, and implemented a policy of controlled gas prices
denominated in Ringgit, mostly below cost of supply. The new policy was, initially applied to power
consumers (1997) and afterwards to industrial consumers (2002). The fixed price policy was aimed to
last for 3 years but remained in place for more than 20 years. 13
The Malaysian Government’s decision to regulate gas prices for the power sector in Peninsular
Malaysia and Borneo resulted in electricity tariffs amongst the lowest in Southeast Asia 14. Demand for
natural gas in the power sector grew and reached a peak in 2000 when it accounted for 74 15 percent of
the electricity generation mix for the country.
3. 2002-2012: demand growth in Peninsular Malaysia and exports to Singapore met by imports
from Indonesia and new production from the Joint Development/Commercial Areas with
Thailand and Vietnam
After the end of the 1997-1998 crisis, the economy started to grow again. In the period 2002-2007
domestic gas demand increased on average by 8.37% per annum, led by growth in manufactured goods
exports, particularly electronics and electrical products, and massive government spend, which fostered
power, industry and integrated petrochemical projects. Those energy intensive projects also benefited
from heavily regulated gas prices.
Domestic gas fields around Peninsular Malaysia entered on rapid decline due to accelerated extraction
rates, which in turn led to frequent supply interruptions.
In order to meet continued demand growth, Malaysia started importing pipeline gas from Indonesia in
2003 (Block B – West Natuna field). Thereafter, the country started to bring gas from the offshore
Malaysia-Vietnam PM3 CAA in 2003, and from 2005 onwards from the Malaysia-Thailand JDA16.
13
(Kumar, 2020)
14
(Zainuddin, 2017)
15
(Malaysia Energy Commission , 2018)
16
Not accounted as importation, because the production is split between Malaysia, Thailand and Vietnam
8In addition to export obligations to LNG customers, Malaysia continued to serve pipeline export
contracts with Singapore’s, Keppel Gas (1.2 BCM/year) and Senoko Energy (0.41 BCM/year) with
expiry dates between 2022 and 2031.17
According to industry sources, in 2011 37% of Peninsular Malaysia demand was met by imports from
Indonesia and the shared areas with Thailand and Vietnam 18. Domestic production and pipeline imports
from Indonesia were not enough to meet export obligations and to also supply the domestic market in
Peninsular Malaysia. The successive gas outages from 2004 to 2011, due to operational problems,
ageing facilities and declining production caused a national outcry.
In addition, the increasing subsidy burden due to the government intervention on prices weighed down
on Petronas’ finances and discouraged investment in more expensive exploration areas.
In order to assure security of supply and reduce the subsidies burden the Government undertook the
following actions:
Enact a gas price reform in 2010 (the Subsidy Rationalisation Programme), aiming to gradually
increase regulated prices by RM 3.0/MMBtu every six months until they reached LNG export
parity. However, the government only allowed for one price increment in June 2011 and froze
further increases ahead of the 2013 national elections.
Deployment of new tax and investment incentives as well as risk sharing contracts, starting in
2010, for exploration and development of deepwater and marginal fields.
PGB started to develop a floating LNG import terminal in Melaka.
4. 2013-present: start of LNG imports, price and market reforms
The Melaka RGTSU terminal started commercial operations in 2013. In order to meet domestic demand
and export commitments, Petronas signed a 2mtpa, 20-year LNG import agreement with Australia’s
Gladstone LNG (GLNG), starting in 2014, with an option for an additional 1mtpa. Petronas holds a 40%
stake in GLNG. Singapore has lean gas grid specifications; therefore, the import of lean LNG from
GLNG also supports meeting Singapore quality requirements. In 2019 Malaysia exported a total of 1.50
BCM/year to Singapore19.
A second LNG import terminal was commissioned in Johor, east Malaysia in 2017 to supply a large
integrated petrochemical, refinery and power complex (RAPID).
The Subsidy Rationalisation Programme resumed in 2014 but price increases were watered down to
RM 1.5/MMBtu every six months; the increases were implemented until December 2019.
The price reform contributed to stabilise domestic demand, however LNG imports continued to grow,
due to lower domestic production in Peninsular Malaysia and a decrease in pipeline imports from
Indonesia, which had its own production problems. In 2019 LNG imports reached 3.59 BCM. 20
In order to create a more competitive gas market, attract new investment in exploration and production
and diversify supplies the government decided to push for further regulatory reform. The Gas Supply
(Amendment) Act 2016 establishes the conditions for the implementation of Third-Party Access (TPA)
for pipelines and LNG terminals.
In addition, in 2017 the government started to roll over an Incentive Based Regulation (IBR) framework
which sets the base tariff for a regulatory period of three years starting in January 2017 and allowing
changes in the gas costs to be passed through to the end users every 6 months via a Gas Cost Pass-
17
https://www.businesstimes.com.sg/top-stories/gas-swap-sees-spore-bound-png-re-routed-to-indonesia
18
https://www.thestar.com.my/business/business-news/2011/11/01/letter-to-the-pm-on-gas-shortage
19
IEA Gas Database
20
(International Gas Union, 2020)
9Through (GCPT) mechanism. The Act came into force in January 2017 and it has been implemented
by the Energy Commission.
Natural gas prices: subsidies and reforms
Malaysia has historically focused on maintaining a steady hydrocarbons reserves base, in order to meet
its supply commitments internally and abroad and, at the same time providing affordable gas supplies
to the domestic market.
Before the 1997 Asian crisis, gas prices for power plants and industrial customers were set in
equivalence to Marine Fuel Oil (MFO) international prices and would remunerate Petronas cost of
supply. After the intervention of the government, domestic gas prices were frozen below well-head
prices and LNG import parity prices. 21
From 2003 onwards the growth in domestic demand coupled with increased subsidies in gas and
electricity prices resulted in substantial deficits for the government and Petronas.
The so-called “forgone revenue” accumulated by Petronas reached RM254.7 billion (USD 62bn) in the
period 1997-2018 (Figure 3). In FY2018 alone, the revenue forgone in respect of the regulated pricing
mechanism imposed on the supply of gas to Peninsular Malaysia reached RM6.9bn (USD 1.69bn) of
which RM 3.3 bn for power (USD 0.81bn) and RM3.6bn (USD 0.88bn) for the non-power sector. The
revenue forgone is the difference between domestic end-user prices and Petronas LNG FOB price
and/or the cost of the opportunity lost to sell domestic gas at the equivalent export price. 22 23. The
gradual implementation of the Subsidy Rationalization Programme (SRP), further detailed in this
section, effectively contributed to reduce Petronas’ losses through subsidies.
Figure 3: Malaysia: revenue forgone by Petronas due to subsidies to end-users
30
Total: RM254Bn (USD62Bn)
25
20
RM Bn
15
10
5
0
Power Non-Power
Source: (Petronas Gas Berhad (PGB), 2019)
A rough estimate of the subsidies for the power sector is shown in Table 1 below, which compares the
opportunity price for Petronas when the SRP started to roll again in 2014 with 2017. Due to lack of data
for gas consumption and forgone revenue in 2019, it was not possible to provide a more updated figure.
The calculated impact of the prices charged to industrial consumers would be similar to the power sector
21
(The Lantau Group, 2014)
22
https://www.petronas.com/ws/sites/default/files/downloads/PETRONAS%20Annual%20Report%202018.pdf
23
https://www.iisd.org/gsi/sites/default/files/ffs_malaysia_czguide.pdf
10in 2014 but slightly better afterwards because gas prices for industries received a smaller discount
(10%) when compared to 15% for power consumers.
Table 1: Impact of forgone revenue and implied opportunity gas price for Petronas
2014 2017
Regulated gas price power (USD/MMBtu) 4.64 5.10
Forgone revenue power sector USD billion 3.79 0.837
Gas consumption power ( Bcf) 589 486
Forgone price (USD/MMBtu) 6.43 1.72
Implied opportunity price Petronas (USD/MMBtu) 11.07 6.82
Source: Author, adapted from Petronas and IEA data
The SRP determined that the gas price should increase by MYR 3/MMBtu every 6 months, starting in
2011, to allow for a gradual alignment of domestic regulated gas prices with Malaysia’s LNG FOB
prices. The initial objective was to achieve market parity prices by 2016.
Initially there was little traction for the programme, as LNG prices were quite high in 2011 and there
was political pressure to postpone the price hike until the national elections of 2013. Effective 1 st
January 2014, a restructured SRP established two categories of consumers and respective gas
prices24:
Tier 1, regulated prices: for consumers with pre-existing contracts. Prices would be increased
by RM1.5/MMBtu every 6 months25, until reaching parity with Tier 2 consumers;
Tier 2, market-based, LNG-indexed prices: for new consumers and additional volumes sold to
consumers with pre-existing contracts. Prices would follow LNG WAP26 parity ex-Bintulu plus
delivery costs, minus a discount of 10-15% for large off-takers.
Figure 4: Malaysia: Discounted LNG-based gas prices for domestic users (as of January 2014)
•LNG FOB: RM42.92/MMBtu (USD13.1/MMBtu)
LNG •Discount power consumers 15%
•Discount non-power consumers: 10%
FOB
Bintulu
•RM6.25/MMBtu (USD1.90/MMBtu), of which
•Shipping: RM0.50-0.69/MMBtu
Delivery • Regas: RM3.37/MMBtu
Cost • Transportation: RM1.35-2.3/MMBtu
• Power: RM41.68/MMBtu (USD12.70/MMBtu)
End-user • Non-Power:44.88/MMBtu (USD13.7/MMBtu)
price
Source: Adapted from (Energy Commission, 2014)
24
(Malaysia Energy Commission, 2014)
25
The original objective was to increase prices by RM3 /MMBtu every 6 months
26
WAP is the weighted average price of LNG at Bintulu, published by the Department of Statistics of Malaysia
11Since then LNG prices have gone down considerably. For example, in December 2019 the average
FOB ex-Bintulu price was around USD 7.50/MMBtu; as a consequence Tier 2 end-user LNG-indexed
prices were USD 7.80/MMBtu and USD 8.16/MMBtu, respectively for power and non-power consumers.
The regulated prices were at USD 7.07 for power and 8.58/MMBtu for non-power consumers.
In the period 2014-2019 regulated gas prices increased by nearly 90 % for power consumers and now-
power consumers in local currency.
Figure 5 depicts the evolution of prices charged to power and large industrial consumers outside the
GMB concession franchise. As of December 2019, the Tier 1 regulated price for industrial consumers
was 5% above the Tier 2 LNG-indexed prices for the same category. Regulated prices for power
consumers were 10% lower than the LNG indexed prices.
Figure 5: Malaysia: Natural gas prices for regulated and LNG indexed consumers (2014-2019)
60
50
40
RM/MMBtu
30
20
10
JKM (May 2020) plus regas and transportation costs
0
Apr-14
Apr-15
Apr-16
Apr-17
Apr-18
Apr-19
Jul-14
Oct-14
Jul-15
Oct-15
Jul-16
Oct-16
Jul-17
Oct-17
Jul-18
Oct-18
Jul-19
Oct-19
Jan-14
Jan-15
Jan-16
Jan-17
Jan-18
Jan-19
Power reg Power LNG indx
Ind reg Ind LNG indx
Regasified JKM May 2020
Source: Author estimate and https://www.st.gov.my/
Considering JKM forward prices of USD 2.0 – 4.24/MMBtu (Jun-Dec 2020)27, large energy consumers
could benefit from accessing regulated pipelines and LNG terminals to import spot LNG into Malaysia,
resulting in regasified LNG prices below regulated gas prices as shown on Figure 5.
When translated into US dollars the domestic price increases do not seem so evident, due to currency
fluctuations (Figure 6). In 2018 end-user prices were above wellhead prices (USD5.01/MMBtu).
However, if Malaysia continues to increase LNG imports on long term oil indexed contracts - for example
at 12%Brent - domestic end user regulated prices would be significantly below LNG import parity prices
as shown on Figure 6.28 This would deter further LNG imports by third parties on medium/long term oil
indexed prices.
27
https://www.cmegroup.com/trading/energy/natural-gas/lng-japan-korea-marker-platts-swap.html
28
Note: domestic upstream prices refer to JDA/Peninsular Malaysia prices published by Hess in their Annual Reports:
https://investors.hess.com/static-files/f0375fc7-bcbb-4b34-a984-c17c26cde53a
12Figure 6: Malaysia: Gas prices for large end-users compared to domestic supply and LNG
14
12
10
USD/MmBtu
8
6
4
2
0
2014 2015 2016 2017 2018
Singapore exp Power
Non-Power (GMB) Non-Power (PGB)
Dom gas wellhead Imp LNG 12% Brent
Source: Author adapted from Energy Commission and Hess data
In parallel with the new price policy, the Government of Malaysia has also decided to open the
midstream infrastructure to third party access (TPA), which came into force in January 2017. This
includes access to the two LNG regasification facilities. According to the Malaysian Gas Association,
seven import licenses have been issued by the Energy Commission as of 1Q2020.
In October 2019 Shell Malaysia Trading (SMTSB) delivered the first TPA cargo at the Melaka terminal
to supply two power plants owned by TNB in Port Dickson and Klang. SMTSB signed a Gas
Transportation Agreement with PGB and a Terminal Usage Agreement with Regas Terminal (Sg.
Udang), a subsidiary of PGB29.
The outlook for supply and demand
As discussed in previous sections, Malaysian domestic production has not been sufficient to meet LNG
and pipeline exports plus domestic demand. One could ask why Petronas does not divert LNG from
Bintulu to supply the Malaysia market via the Melaka and Johor LNG import terminals?
This might not be possible due to long term pipeline and LNG supply agreements currently in place.
The supply agreement with Singapore expires in 2023, whereas Malaysia LNG’s long and medium term
SPAs with a string of Asian buyers expire between 2021 and 2031 30. Petronas has also medium and
long term SPAs in place with Asian buyers with volumes in excess of 5 BCM/year. The contracts are
denominated in USD and mostly oil-indexed.
In the absence of significant domestic discoveries, future growth in power consumption will be
increasingly met by coal and possibly by renewable energy. In the period 2014-2019 coal consumption
for power increased on average by 5% and for the country overall by 7.1% per annum.31
29
https://www.thestar.com.my/business/business-news/2019/10/03/tnb-in-deal-with-shell-to-buy-cheaper-gas
30
(GIIGNL, 2020)
31
(BP , 2020)
13Although coal represented 31% of the 33.7GW installed capacity in 2018 vs 43.6% of gas, coal already
accounted for 42% of the generation output, compared to gas at 16.5% in 2017 due to lower coal prices
and decreased gas availability. 32,33
According to Malaysia Energy Commission projections, coal-fired capacity is expected to rise to 42%
in 2020, then decline to 35% and 29% by 2025 and 2030, respectively (Figure 7). But coal might still
account for 55% of the generation output, up from 43% in 2016. As of March 2020, TNB commissioned
a brand new 2,000 MW coal-fired power plant employing ultra-supercritical (USC) technology.34
At the 21st Conference of Parties (COP21) in 2015, Malaysia pledged to reduce its carbon emission
intensity per Gross Domestic Product (GDP) by 35% in 2030 relative to the 2005 level, or 45% with
support from developed countries. In order to achieve this goal, the Government foresees a mix of 20%
of renewable energy installed capacity by 2025 (6,000 MW), meaning an added RE capacity of 3,750
MW.
Figure 7: Malaysia: Peninsular Malaysia power generation capacity mix forecast (2020-2030)
120
100
35 35 34 35 34 29
80 42 37 37 38 36
%
60
37 36 34 36 41
39 36
40 45 44 40
40
20 23 23 23 24 23 23
9 10 12 16 19
8 7 7 7 6 6 6 7 7 7 7
0
2020 2021 2022 2023 2024 2025 2026 2027 2028 2029 2030
Interconnection Hydro Renewable Gas Coal
Source: (Malaysia Energy Commission, 2020)
With the addition of distributed renewable energy, peak demand from conventional power plants is
expected to grow to respectively 18,431 MW in 2025 and 20,265 MW by 2030, a modest growth of
0.7% per annum.
Assuming that domestic production is maintained at a level which ensures the continuity of LNG exports
from Bintulu, a decline in production from Peninsular Malaysia and the end of the pipeline imports from
Indonesia in 2022, LNG imports are expected to rise significantly by 2030.
According to projections from the OIES, this would entail LNG imports of 17 BCM/year by 2030,
increasing to 26.5 BCM/year by 2040. If these projections materialise, this might raise a question about
whether some LNG from Bintulu should be diverted to the internal market as and when the LNG SPAs
32
https://www.statista.com/statistics/865614/malaysia-total-electricity-generation-capacity-by-source/
33
(Malaysia Energy Commission , 2018)
34
https://www.tnb.com.my/assets/press_releases/20200321eng.pdf
14start to expire. Regional neighbour Indonesia is already diverting growing volumes of domestically
produced LNG to meet domestic demand, as explained further in this paper.
Table 2: Malaysia: Potential LNG imports forecast (2019-2040)
BCM/year 2019 2030 2040
Dom Production 67.8 64.2 62.0
Pipeline Imports 6.0 0 0
LNG Imports 3.7 17.0 26.5
Pipeline Exports 1.5 0.9 0
LNG Exports 32.8 38.7 38.7
Dom Consumption 41.3 41.6 49.8
Source: Adapted from (Fulwood, Gas in South Asia, OIES Internal Seminar, 2020)
By 2030 there are 19.1 BCM of LNG export contracts expiring, growing to 20.3 BCM by 2031 as shown
in Figure 8 below, whereas the OIES predicts imports of 17 BCM by 2030. This might create political
pressure to divert some of the uncontracted LNG into the domestic market, as is happening currently
in Indonesia.
Figure 8: Malaysia: LNG expiring contracts and volumes
5.0
4.5
4.0
3.5
3.0
BCM
2.5
2.0
1.5
1.0
0.5
0.0
2020 2021 2023 2024 2025 2026 2027 2028 2029 2031
Source: Adapted from (GIIGNL, 2020)
Key insights
New domestic supplies to Peninsular Malaysia are becoming more expensive, requiring gas prices
above USD 5/MMBtu as demonstrated by the prices agreed with Hess Carigali. The continuity of market
orientated prices reforms is essential to allow for Petronas to ramp-up investment in domestic
production.
The implementation of the price revision mechanism has suffered hiccups and amendments but
progressed well from 2014 onwards. Under the current LNG international prices, regulated and LNG
indexed prices are fairly well aligned, albeit still below full LNG export parity prices. If LNG export parity
prices continue going down, as a result of decreasing oil prices, domestic gas prices based on LNG
FOB might be too low to encourage domestic gas development on marginal and deep-water fields.
Taking into account the softness of LNG international prices, there have been discussions on whether
Malaysia should adopt a weighted average cost of supply, including marginal domestic production – for
15the calculation of price pass-through to Tier 2 customers. This might open some space for the
development of more expensive gas fields.
Long and mid-term contract obligations with LNG and Singapore buyers and competitive pressure
require that Petronas should prioritize exports rather than divert volumes to the domestic market. In
the past supply cuts to Singapore dented Malaysia and Indonesia reliability as international gas
exporters.
Going forward one should expect a decrease in gas to power consumption until 2030 due to the
increasing role of coal and renewable energy. Post 2023, gas demand in Peninsular Malaysia will be
boosted by the commissioning of the RAPID industrial complex in Johor with most of the demand met
by imported LNG. Demand growth in Sabah and Sarawak looks stronger compared with that of
Peninsular Malaysia. In Sabah, new energy-intensive industrial projects in Kimanis and Sipitang (such
as SAMUR – Ammonia Urea Complex) are being developed, with several others in the pipeline. In
Sarawak, gas demand growth will be driven more by the power generation sector.
Despite the stated objective of enhancing competition, progress in the implementation of the TPA policy
has been slow. As of early 2020 there have been no other LNG deliveries from third parties, possibly
due to softer power demand and the increase in coal generation, aggravated by the impacts of
COVD19.
It is worthy of note that although significantly closing the gap, LNG indexed prices are not fully LNG
export parity prices, because industrial and power consumers receive discounts of 10% and 15%
respectively vis-à-vis Malaysia LNG WAP. This would disadvantage 3rd party sellers competing with
Petronas for medium/long term oil indexed contracts.
The LNG plants in Bintulu require feed gas in excess of 40 Bcm at peak; however domestic gas
production is expected to drop continuously until 2040. If demand is not curbed and domestic
production is not sufficiently ramped up, by 2040 Malaysia could become a net gas importer. By 2030,
imported LNG volumes could exceed the Melaka and Johor LNG terminal capacity, raising the need for
capacity expansion or even a third terminal.
As LNG export contracts expire in the next decade, Malaysia could divert erstwhile export volumes into
the domestic market, ending up a 5-decade tradition of gas exports.
Indonesia
Context and evolution
The oil industry in Indonesia dates from the 19th century, with first oil discovered in north Sumatra in
1885. The gas industry started operations in 1863, with the introduction of town gas, manufactured from
coal, to light the streets of Jakarta. Indonesia was one of the first producers of LNG, with the first project
commissioned in 1977. It maintained the position of top world producer until 2005 35.
PT Pertamina (Persero36), the national oil company, was created in 1968 but it is not the only upstream
producer, co-existing with several international and domestic companies. PT Perusahaan Gas Negara
(PGN) operates the gas transmission and distribution grid. In 2018 the government combined the two
companies under the umbrella of a holding enterprise. The government-owned corporation PT
Perusahaan Listrik Negara (PLN) is responsible for the majority of Indonesia’s power generation with
exclusive powers over the transmission, distribution and supply of electricity.
SKK MIGAS manages upstream oil and gas activities through Joint Cooperation Contracts, under the
umbrella of the Ministry of Energy and Mineral Resources (MEMR), replacing the previous regulator BP
MIGAS. BPH MIGAS is the downstream regulator for oil and gas and retail fuel distribution and supply.
35
https://www.igu.org/sites/default/files/node-document-field_file/igu-oct2019_layout_lo-res-web.pdf
36
Persero is a state-owned limited liability company
16Indonesia was an early adopter of Production Sharing Contracts which were signed by Pertamina and
international oil companies. The discovery of the Arun field, by Pertamina in association with Mobil Oil
and the Badak field, in association with Huffington, prompted the development of LNG projects,
respectively Badak LNG (Bontang LNG) 37 (1977) and Arun LNG (1978). The discovery of additional
gas fields and the diversion of associated gas to the LNG plants led to successive debottlenecking and
capacity expansion allowing Arun LNG to reach nameplate capacity of 12.5 mtpa, whereas Bontang
reached 22.5 mtpa. In 2009 the 7.6 mtpa BP-led Tangguh LNG (West Papua) started operations and
the Donggi Senoro 2.5 mtpa project in Sulawesi delivered its first cargo in 2015. Tangguh LNG is
building a third train expected to start-up in late 2021.
Two other LNG projects are currently under development: INPEX’s Abadi LNG (Masela block, Timor
Sea), slated for 9.5 mtpa and start-up by 2024/2025 and the much delayed 2 mtpa EWC-led Sengkang
LNG (South Sulawesi), consisting of 4 modular trains of 0.5 mtpa each.
According to BP, Indonesia’s gas reserves amounted to 97.5 Tcf in 2018 38. The country is the 12th
largest gas producer in the world, and together with the USA it ranks as the 5 th largest LNG exporter.
Approximately 53% of Indonesia’s gas production is consumed in the internal market; the balance is
exported as LNG and pipeline gas to Malaysia and Singapore. Domestic production has decreased
from a peak of 85.7 Bcm in 2010 to 67.1 Bcm in 2019 39 as a consequence of maturing gas fields.
In spite of uncertainties introduced by changes in the fiscal regime, Indonesia has seen some positive
developments on the domestic production front. In 2016 BP and its partners announced the decision to
invest in Tangguh LNG train 3 (3.8 mtpa.40 In 2017 the ENI-led offshore Jangkrik Development Project,
in East Kalimantan, provided additional gas supplies into Bontang LNG. In early 2019 Repsol and its
partners announced a large gas discovery in the Sakakemang block in South Sumatra, with a
preliminary estimate of 2 Tcf of recoverable resources 41 which should supply the domestic market.
Pertamina’s Jambaran Tiung Biru project in eastern Java is slated to start supplies in 2021, to power
plants.
SKK Migas is also expecting that Chevron’s Indonesia Deepwater Development (IDD) project will start
operations in 2024 despite Chevron’s recent announcements on investment cuts and reductions in gas
production.42,43
Despite the geographic obstacle of being a country composed of thousands of islands and the fact that
demand centres are remarkably distant from production areas, Indonesia has succeeded in building
16,500 km of pipelines, three major LNG export projects, four regasification terminals and offshore
pipelines connecting fields in Sumatra and the Natuna Sea to domestic markets and to Singapore and
Malaysia.
The dynamics of natural gas exports and imports
Nearly 80% of Indonesia’s gas demand arises from industry and power plants. The relatively incipient
distribution infrastructure inhibits the development of the residential and commercial sectors, as shown
in figure 9 below.
37
(Dewanto, 2019)
38
(BP plc, 2019)
39
BP Statistical Review of World Energy, 2019
40
https://uk.reuters.com/article/uk-lng-indonesia-bp/bps-tangguh-lng-plant-train-3-to-be-delayed-by-a-year-regulator-
idUKKCN1UE1BV
41
https://www.repsol.com/en/press-room/press-releases/2019/repsol-makes-largest-gas-discovery-indonesia-past-eighteen-
years.cshtml
42
https://www.reuters.com/article/us-indonesia-gas/indonesia-is-unlikely-to-begin-natural-gas-imports-in-2025-minister-
idUSKCN1UQ0F7
43
https://www.reuters.com/article/us-indonesia-chevron/chevrons-new-design-for-indonesian-gas-project-to-cut-output-
regulator-idUSKCN1VQ0YX
17Although the power sector accounts for a large share of gas consumption, coal is still dominant in
power generation. In 2017 coal accounted for 38% of the installed capacity, versus gas at 25%; and
coal accounted for 62% of the generation mix, against gas at 21%. 44
Figure 9: Indonesia: Natural gas consumption by sector (2018)
0.5% 0.1%
0.1%
9.7%
39.7%
27.4%
22.6%
Power Generation Energy Industry including losses
Industry Transport
Commercial Residential
Source: (IEA, 2019)
Until 2010, when it reached a peak production of 85 BCM/year, Indonesia was a net gas exporter with
domestic production comfortably meeting the needs of the domestic market as well as pipeline exports
to Malaysia and Singapore and LNG exports to Asian markets. Since then, domestic production has
dropped by 18 BCM/year to 67.1 BCM/year in 2019. And although domestic demand has quintupled in
the period 1985-2010, reaching 43.5 BCM, it has since then stagnated at 40-41 BCM in the last decade,
due mostly to diminishing gas supplies (Figure 10 below).
The continuous decrease in domestic production has affected both the supply to the domestic market
and LNG projects. Arun LNG was shut down whereas Bontang LNG’s output has been severely
reduced.
Gas shortages have led Indonesia to build four LNG import terminals at large gas demand regions and
to impose a domestic gas obligation (DMO) whereby gas producers and LNG plants must divert at least
25% of their production or supplies to the domestic market.
Indonesia is now in a peculiar situation where it “imports” domestically produced LNG, but still exports
pipeline gas and decreasing LNG volumes. But the odds are that actual LNG imports should start in a
few years, coupled to the phase-out of pipeline and LNG exports.
The key factors leading to such dynamics are summarized below:
Remoteness of the larger gas fields in the west did not allow for pipeline connections to demand
centres in the east, enabling gas export schemes from those regions.
Decreasing domestic supply, as a result of a slow-down in upstream investment; this seems to
be a consequence of continuously changing regulations in the Production Sharing Contract
44
(PwC, 2019)
18(PSC) regime, including a recently introduced gross-split methodology which will replace the
traditional PSC cost-recovery system, as well as Government’s alleged preference to transfer
operatorship to Indonesian companies. 45 46
Government’s decision to allocate 25% of field production to the domestic market, including
LNG produced by existing projects, with growing interference on end-user prices which were
once freely negotiated. A recently announced price cap of USD 6.0/MMBtu for power plants
and large industrial consumers added to regulatory uncertainty.
Availability of fast-tracking FSRU terminals allowed for the connection of the LNG plants with
domestic demand centres.
Figure 10: Indonesia: Evolution of natural gas supply, demand and exports 1976-2019
100
80
60
40
BCM
20
0
1976 1979 1982 1985 1988 1991 1994 1997 2000 2003 2006 2009 2012 2015 2018
-20
-40
-60
Production LNG dom mkt Pipeline Exports
LNG Exports Consumption
Source: (IEA, 2019), (BP , 2020)
Figure 10 illustrates the historic evolution of the gas supply/demand, which can be detailed in the two
phases below:
1. 1976-2010: From export-orientated to domestic market-orientated
In the 1970s, 1980s and 1990s most of Indonesia’s natural gas was produced under long-term export
contracts with a large share of production concentrated in remote regions in East Kalimantan and North
Sumatra (Figure 11, below).
From the late 1970s Indonesia’s economy benefited from higher oil prices for its exports and
accelerated economic growth, due to a gradual process of urbanisation and industrialisation. After a
few blips in the early 1980s caused by the collapse of oil prices, the government re-orientated the
economy towards manufactured exports with the country benefiting from economic growth in other
countries.
45
https://www.pwc.com/id/en/energy-utilities-mining/assets/oil-and-gas/oil-gas-guide-2019.pdf
46
Under this methodology, gross production of natural gas is split 52%:48% between Government and Contractor, without a
cost recovery mechanism.
19You can also read