Children Without A study of urban child poverty and deprivation in low-cost flats in Kuala Lumpur - Unicef
←
→
Page content transcription
If your browser does not render page correctly, please read the page content below
Children
Without
A study of urban child poverty and
deprivation in low-cost flats
in Kuala Lumpur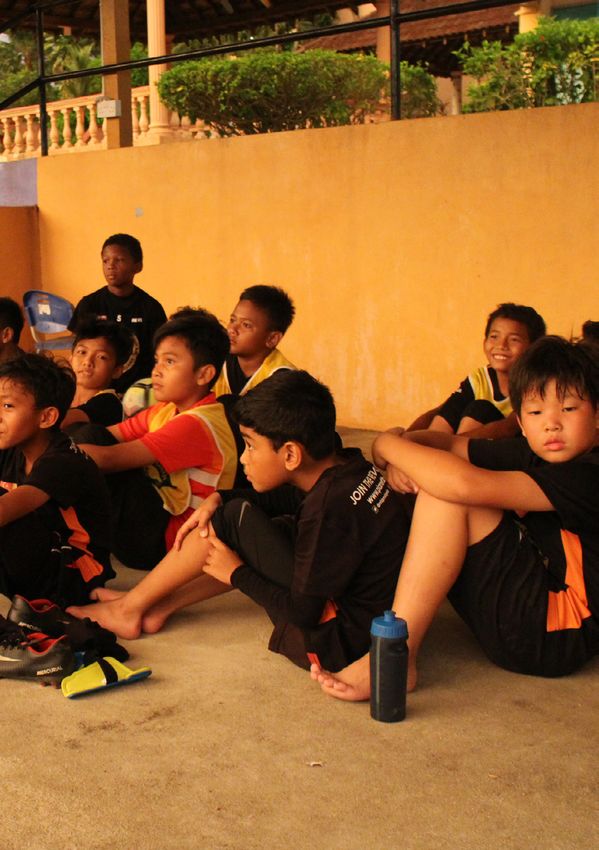
Published by the United Nations Childrens' Fund, Malaysia.
© UNICEF Malaysia 2018. All rights reserved.
First published in February 2018.

ISBN 978-967-12284-7-0

United Nations Childrens' Fund
Menara PJH
Level 10, No. 2
Jalan Tun Abdul Razak
Precinct 2, 62100
Putrajaya, Malaysia

www.unicef.org/malaysia

Any part of this publication may be quoted, copied, or translated by indicating the source. No part of this publication may
be stored for commercial purposes without prior written permission.

The views expressed in this publication are those of the authors and do not necessarily represent those of the United
Nations, including UNICEF, the UN Member States or the Government of Malaysia.

Cover photo of 'Baby Brother' by Ika (15 years old).
© UNICEF Malaysia/2017/Ika
Children
Without
A study of urban child poverty and
       deprivation in low-cost flats
                  in Kuala Lumpur
© UNICEF Malaysia/2017/Puteri Nur Syuhada Abdul Rahman
UNICEF     5
                                                                                         Urban Child Poverty Report

Acknowledgements

We would like to thank the 15 amazing children who participated in the project's
photography workshop and provided almost all of the photographs featured in this report:
Ika (15 years old), Muhammad Amerol Afiq Mohd Dzon Akhirom (16), Nur Atikah Mohd
Shaidi (17), Badrul Amin (16), Kimi (16), Muhammad Haiqal Mohd Hazrari (15), Kisshen
Raj R Muthiah (15), Hanisah (16), Erin (16), Nurin Jazlina Mat Ropi (17), Raja Shah
Ikhmal Raja Remi (17), Falah Syukran Adenan (17), Muhamad Adam Fitri Azrul Azlam
(17), Puteri Nur Syuhada Abdul Rahman (17) and Syahirah (17).

This study benefited tremendously from the expertise and insights of Professor Tan
Sri Dr Kamal Salih, Datuk Akbar Ali, Prof Dr Selamah Yusoff, Dr Mohd Ikmal Mohd
Said, Dr Shaufique Fahmi Sidique and Dr Ahmad Zaid Fattah Azman. We would like
to thank the participants of the roundtable discussion on Urban Child Poverty for their
valuable inputs and suggestions, in particular, United Nations Development Programme,
Employees Provident Fund, World Bank, Bank Negara Malaysia, Institute of Strategic and
International Studies, Ministry of Health, Yayasan Hasanah, the Centre for Poverty and
Development Studies Universiti Malaya, Universiti Putra Malaysia, Teach For The Needs,
Syed Azmi Al Habshi, Pusat Zakat WP Kuala Lumpur, Ministry of Women, Family and
Community Development, Institute of Public Health, Implementation Coordination Unit of
the Prime Minister's Department, Ministry of Education and the Economic Planning Unit.
The roundtable discussion hosted by UNICEF Malaysia, DM Analytics and ISIS Malaysia
was held on 17th January 2018 in Kuala Lumpur.

We would also like to extend our appreciation to the various parties that collaborated with
us in this project, in particular Datuk A Kadir Jasin, Zainal Alam Kadir, Haresh Deol, Pearl
Lee; Vignesh Balasingam, Ryan Moon, and Mark Joshua Morriss of OBSCURA Festival
of Photography; Mereka Makerspace, Yayasan Axiata, Yayasan Khazanah, Chua Choon
Hwa from the Ministry of Women, Family, and Community Development, Ilham Gallery
and Zaini Zainuddin.

Special thanks to the enumerators led by Dr Mohd Yusof Sa'ari, Umi Zakiah and her
team from Universiti Putra Malaysia and our interns: Wan Abdul Rahman, Shazrul Ariff
Suhaimi, Mikhail Rosli, Sharifah Sarah Syed Abdul Rahman and Nurliyana Nadhirah Nor
Izham.

Our gratitude goes to all our respondents.

This report was written by Dr Muhammed Abdul Khalid, Zouhair Rosli, Siti Nur Fatimahtul
Maryam Abdul Halim and Endie Shazlie Akbar. All remaining errors and weaknesses in
this report are our responsibility.

                  DMAnalytics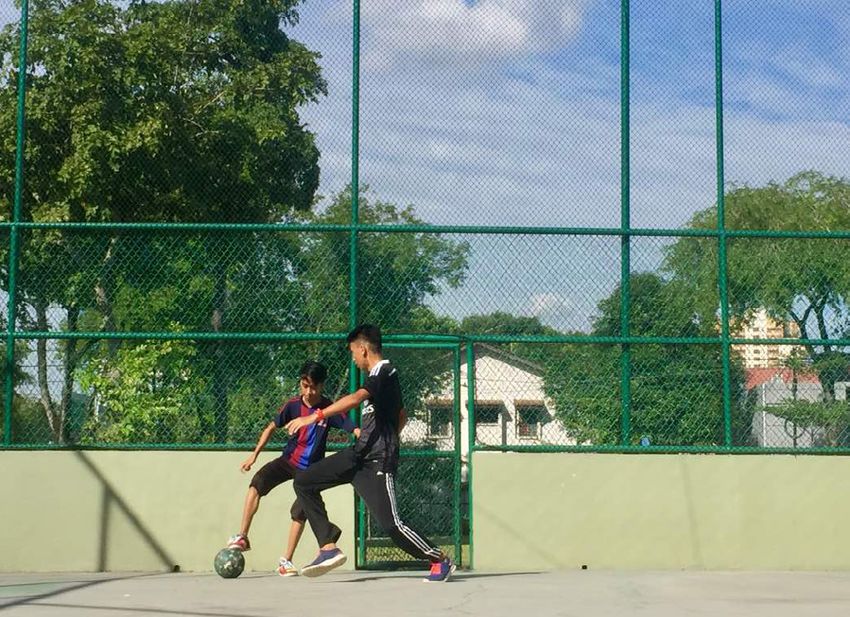
6     UNICEF
      Urban Child Poverty Report

Table of contents
                                           Contents    Page
Summary                                                 9
Introduction                                            11
The UNICEF Urban Child Poverty and Deprivation Study    14
       Key characteristics                              16
       Income, transfers and savings                    22
       Living standards                                 27
       Education and nutrition                          32
       Poverty and deprivation                          40
       Malnutrition                                     48

Policy recommendations                                  59
Programme reports                                       63
Appendices and references                               70
UNICEF              7
                                                                                          Urban Child Poverty Report

List of figures
                                                          Page                                                            Page

1.1   Malaysian GDP, 1970-2016 (RM million)                12           Sufficiency to purchase food and frequency of
                                                                 5.9                                                       37
                                                                        the incident (%)
1.2   Poverty rate in Malaysia, 1970-2016 (%)              12
                                                                 6.1    Absolute poverty by income profile (%)             43
2.1   Location of the respondents in Kuala Lumpur          15
                                                                 6.2    Relative poverty by income profile (%)             43
      Head of households by educational attainment
2.2                                                        18
      (%)                                                        6.3    Household income per capita (RM)                   43
      Head of households by employment status and                       Percentage of children, by household income
2.3                                                        18    6.4                                                       44
      occupational groups (%)                                           profile (%)
      Head of households by employment sector and                6.5    Child poverty, absolute and relative terms (%)     44
2.4                                                        18
      form of employment (%)
                                                                 7.1    Snapsnot of malnutrition in children (%)           49
2.5   Social safety net by types of coverage (%)           19    7.2    Level of stunting by state, 2016 (%)               49
                                                                        Percentage of malnutrition among children aged
      Average working hours (per week) and hourly
2.6                                                        19    7.3    below 5 between Malaysia, KL and low-cost flats    51
      wages (RM) for employees
                                                                        (sample) (%)
3.1   Household distribution, by income class (%)          23
                                                                        Weight-for-age status among children aged
                                                                 7.4                                                       52
      Percentage of household income, by ethnicity                      below 5 (%)
3.2                                                        23
      (%)
                                                                        Height-for-age status among children aged
                                                                 7.5                                                       52
      Percentage of household transfers, by types of                    below 5 (%)
3.3                                                        24
      transfers (%)
                                                                        Weight-for-height status among children aged
                                                                 7.6                                                       52
      Percentage of heads of household receiving                        below 5 (%)
3.4                                                        24
      BR1M, by income class (%)
                                                                        Height-for-age status among children aged 2
                                                                 7.7                                                       53
      Household distribution, by total amount of                        and 4 (%)
3.5                                                        24
      savings (%)
                                                                        Weight for age status among children aged 2
                                                                 7.8                                                       53
      Residents' perception of cleanliness of public                    and 4 (%)
4.1   areas and the effectiveness of drainage systems      28
                                                                        Weight-for-height status among children aged 2
      (%)                                                        7.9                                                       54
                                                                        and 4 (%)
      Relationship with other ethnic groups and
4.2                                                        29    7.10   Percentage of malnutrition, by ethnicity (%)       54
      neighbours, by status (%)
      Time spent with mothers and fathers, for
4.3                                                        29
      children (%)
      Safety of the neighbourhood for children, by time
4.4                                                        30
      of day (%)
      Observation of students in the residential area
4.5   and involvement of household children, by social     30
      issues (%)
      Percentage of children not enrolled in school, by
5.1                                                        33
      age cohorts (%)
      Average number of toys for children aged
5.2   below 5 and number of books for children per         33
      household (%)
      Average number of books for children, by
5.3                                                        34
      parents' educational attainment (%)
5.4   Study area for children (%)                          34
      Academic performance of children in school,
5.5                                                        35
      according to parents (%)
      Breakdown of grades received, by PMR
5.6                                                        35
      subjects, Mathematics, Science and English (%)
      Average number of meals consumed per day, for
5.7                                                        36
      children 5-17 years old (%)
      Challenges to prepare healthy food for children
5.8                                                        37
      (%)
8       UNICEF
        Urban Child Poverty Report

List of tables
                                                             Page                                                                  Page

3.1      Average and median income per month, by                       8.1    Current government interventions to address
                                                                  23                                                                60
         ethnicity (RM)                                                       child poverty in Malaysia
7.1      Percentage      of     wasting,      stunting,                8.2    Policy recommendations on tackling child
                                                                                                                                    61
         underweight,and overweight for children                              poverty and deprivation
         aged below 5, and obesity for children and               50
                                                                       9.1    Outcome of the Policython                             67
         adolescents aged 5 to 19 for Malaysia and the
         Southeast Asian region                                        9.2    Abstracts from the Student Research Award
                                                                                                                                    69
                                                                              competition
7.2      Statistics of malnutrition for children aged
         below 5 and pregnant women aged 15-49,                   51   10.1   Descriptive statistics                                72
         2006 and 2016 (%)
7.3      Key determinants of malnourishment
                                                                  56
         according to WHO

List of abbreviations
    Acronym                                                             Acronym

ASEAN          Association of Southeast Asian Nations                  PPR          Program Perumahan Rakyat (People's Housing
                                                                                    Programme)
B40            Bottom 40 income group
                                                                       PT3          Pentaksiran Tingkatan Tiga (Form 3 Assessment)
BR1M           Bantuan Rakyat 1Malaysia (1Malaysia People's
               Assistance)                                             RM           Ringgit Malaysia
CSO            Community services organisations                        SOCSO        Social Security Organisation
DOS            Department of Statistics, Malaysia                      STEM         Science, technology, engineering and
                                                                                    mathematics
EIU            Economist Intelligence Unit
                                                                       UIA          Universiti Islam Antarabangsa (International
EPF            Employees Provident Fund
                                                                                    Islamic University, Malaysia)
EPU            Economic Planning Unit
                                                                       UKM          Universiti Kebangsaan Malaysia
F&B            Food and beverages
                                                                       UNDP         United Nations Development Programme
GDP            Gross domestic product
                                                                       UNICEF       United Nations Children's Fund
HHI            Household income
                                                                       UPM          Universiti Putra Malaysia
Inter HH       Inter-household
                                                                       USM          Universiti Sains Malaysia
HoH            Head of household
                                                                       UVG          Urban Vulnerable Group
IPH            Institute of Public Health
                                                                       WASH         Water, Sanitation, and Hygiene
ISIS           Institute of Strategic and International Studies
                                                                       WB           World Bank
JKM            Jabatan Kebajikan Masyarakat (Department of
                                                                       WHO          World Health Organization
               Social Welfare)
KL             Kuala Lumpur

M40            Middle 40 income group
MOE            Ministry of Education
MOH            Ministry of Health
N/A            Not available
NGO            Non-government organisation
NSTP           New Straits Times Press
PLI            Poverty Line Income
PMR            Penilaian Menengah Rendah
UNICEF           9
                                                                                            Urban Child Poverty Report

Summary
While Malaysia has done remarkably well in uplifting the standard of living of its citizens, there are emerging
areas of concern that require urgent attention, particularly on the wellbeing of the children. The country is facing
simultaneous crises of over- and under-nutrition, with some children suffering from undernourishment while
their peers are obese or overweight. In fact, while the prevalence of stunting globally has been on the decline, it
is rising in Malaysia, even when compared to other countries that have comparable levels of income per capita.
Children in Malaysia are also among the most overweight and obese in the region.

This study, based on the sample of urban poor in low-cost flats in Kuala Lumpur revealed some findings on multi-
dimensional child poverty. In particular, it highlights the impact on malnourishment that needs to be addressed. This study
presage an emerging national crisis that has medium and long-term implications for the future well-being and productivity
of the economy, as we approach developed status in 2020 and beyond.

While the national poverty rate is less than one percent, and almost eradicated in Kuala Lumpur, these indicators
unfortunately mask the rich information content of empirical case studies based on the reality of the situation on the
ground. While Kuala Lumpur has an income per capita equal to developed countries, the children residing in its low-cost
flats are not doing well. The study finds that about 15 per cent of children below the age of five are stunted, 22 per cent are
underweight and 23 per cent are either overweight or obese. They have no conducive place to study and their surrounding
environment is unsafe. While almost all children aged 7 to 17 are in school, only 1 in 2 of those aged 5 and 6 are in
preschool. Adjusted for household size, the relative poverty rate of these children is almost 100 per cent.

It is hoped that the findings of the study will shed light on living conditions of children in urban cities that otherwise live in
a data 'blind spot'. The findings should contribute to focused policy interventions to ensure children in poor urban settings
are included in wider urban opportunities. The analysis of factors that contribute to malnutrition among children aged
below five highlights the importance of nutritional and preschool education. The elevated proportion of anaemia among
pregnant women also suggests the need for some form of nutritional intervention in urban households as this will affect
their children at birth.

Moving forward, one of the optimal ways in ensuring that every child in Malaysia has an equal head start is by providing
a social protection floor for all. In recent years, social protection has emerged as a major new focus in efforts to reduce
poverty around the world. Through income support and programmes designed to increase access to services (such as
health, education and nutrition), social protection helps realise the human rights of children and families. Social protection
strategies are also a crucial element of effective policy responses to adverse economic conditions, addressing not only
vulnerabilities caused by current conditions but also strengthens preparedness to future uncertainty. Child- sensitive social
protection systems mitigate the effects of poverty on families, strengthen families in their child care role, and enhance
access to basic services for the poorest and most marginalised. Since many at-risk children also live outside family care,
child-sensitive social protection systems must be responsive to this vulnerable group, as well as to children facing abuse
or discrimination at home.

Possible recommendations to address the issues of urban child poverty arising from this study and to achieve better
targeting and impact, include:

1) Providing a universal child care allowance.

2) Ensuring proper exclusive breastfeeding for mothers for at least six months.

3) Implementing taxes on sugar-sweetened beverages (SSB).

4) Providing safe social spaces for school-aged children.

5) Revisiting poverty indicators, namely the Poverty Line Income (PLI) and using multidimensional indicators that include
the nutritional status of children and relative income poverty.

Hopefully, the findings of this study can spark a wider national debate and galvanise policy changes on this important
issue. It is a clarion call for all stakeholders to accelerate efforts to protect our children, who are the most vulnerable
members of the community. The study is a stark reminder that the clock is ticking, and the wellbeing of the children needs
to be urgently addressed.
© UNICEF Malaysia/2017/ Nurin Jazlina Mat Ropi
Introduction

                                Introduction
                                   The Study
               Income, Transfers and Savings
                            Living Standards
                      Education and Nutrition
                     Poverty and Deprivation
                                  Malnutrition
                    Policy Recommendations
                         Programme Reports
                  Appendices and References
12 UNICEF Introduction
Urban Child Poverty Report GDP and Wellbeing
Malaysia has done well to improve the wellbeing of its citizens.
Malaysia has experienced steady economic growth in the past five decades, where the GDP has expanded by 10 per cent
per annum since 1970s (Figure 1.1). On average, the GDP growth has led to higher income for households, and that has
been a major driving force behind poverty reduction. The poverty level has reduced significantly from 50 per cent in 1970
to 0.4 per cent in 2016 (Figure 1.2).
Figure 1.1: Malaysia GDP, 1970-2016 1 (RM million) Figure 1.2: Poverty rate in Malaysia, 1970-2016 2 (%)
GDP Value (RM million) Poverty rate (%)
1500000 50
1200000 40
900000 30
600000 20
300000 10
0 0
19 0
19 2
19 4
19 6
19 8
19 0
19 2
19 4
19 6
19 8
19 0
19 2
19 4
19 6
20 8
20 0
20 2
20 4
20 6
20 8
20 0
20 2
20 4
16
70
76
79
84
87
89
92
95
97
99
02
04
07
09
12
14
16
7
7
7
7
7
8
8
8
8
8
9
9
9
9
9
0
0
0
0
0
1
1
1
19
19
19
19
19
19
19
19
19
19
19
20
20
20
20
20
20
20
While the national poverty rate is 0.4%, pockets of poverty still exist.
34% 1 DOS (2017).
20.2% 7.3%
Orang Asli in Bumiputera in Bumiputera in
Peninsular Sabah Sarawak
Malaysia live in poverty3. live in poverty4. live in poverty5.
© UNICEF Malaysia © UNICEF Malaysia/2014/Pirozzi © UNICEF Malaysia
The success of economic development can be measured by the
degree to which the most disadvantaged children benefit from it. For
if development is to be truly sustainable, it must be truly equitable –
and seek to reach every child.
1 Economic Planning Unit, ‘Published Time-Series Economic Statistics: National account’, 2017, , accessed 11 November 2017.
2 Department of Statistics Malaysia, ‘Household Income & Basic Amenities Survey Report 2016’, Putrajaya, October 2017, pp. 129.
3 Economic Planning Unit, ‘Strategy Paper 02: Elevating B40 households towards a middle-class society’, Eleventh Malaysia Plan, Putrajaya, May
2015, p. 8, < www.epu.gov.my/sites/default/files/Strategy%20Paper%2002.pdf>, accessed 15 June 2017. Poverty rate is for year 2014.
4 Ibid., p. 8. Poverty rate is for year 2014.
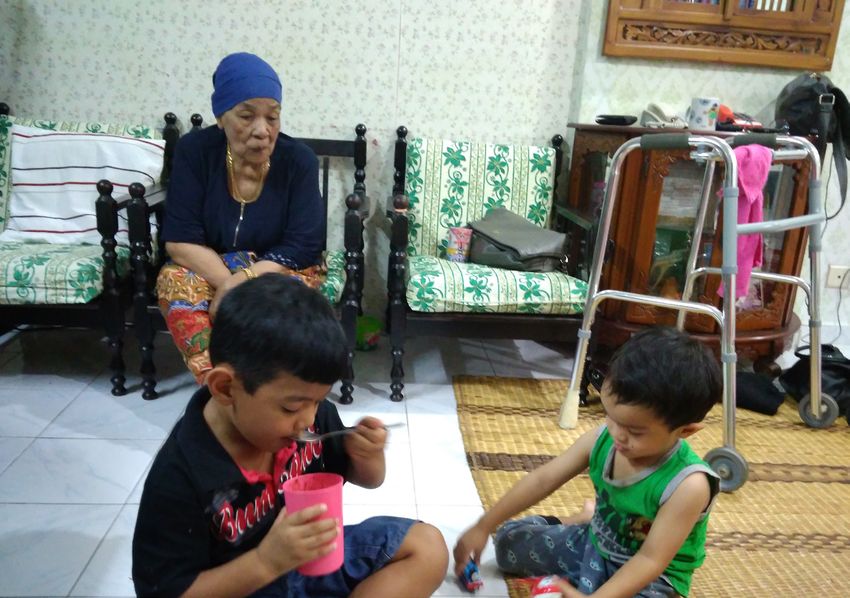
5 Ibid., p. 8. Poverty rate is for year 2014.More than one in five households have three generations living in the same
residence. The grandmother in this family also suffers from chronic disease, and
these factors place considerable strain on the income earners.
© UNICEF Malaysia/2017/HanisahThe UNICEF Urban
Child Poverty and
Deprivation Study
Introduction
The Study
Income, Transfers and Savings
Living Standards
Education and Nutrition
Poverty and Deprivation
Malnutrition
Policy Recommendations
Programme Reports
Appendices and ReferencesThe Study UNICEF 15
Scope Urban Child Poverty Report
Scope of the study
This study features a multidimensional approach to poverty by measuring income, living standards, education, nutrition,
and safety. We collected data from 966 heads of household and 2,142 children from 17 different locations throughout
Kuala Lumpur and Petaling Jaya (Figure 2.1). For a detailed explanation of the methodology, please refer to Appendix A
(page 71).
966 2142
Heads of household Number of children
Figure 2.1: Location of the respondents in Kuala Lumpur
PPR Intan Baiduri
PPR Taman Wahyu
PPR Beringin
PA Setapak Jaya
PPR Batu Muda
PPR Seri Semarak
PPR Desa Rejang
PPR Kg Baru Air Panas
PPR Seri Alam
PPR Seri Sabah
Flat Sri Johor
PPR Pantai
PPR Seri Kota
PPR Pantai Ria
PPR Desa Mentari
PPR Desa Tun Razak
PPR Kg Muhibbah
0 (km) 5
0 (mi) 316 UNICEF The Study
Urban Child Poverty Report Key characteristics
Key characteristics of
On average, one household has
5
household members.
17%
have more than 7 members.
The household
58%
42%
42%
of the household members are
children (below 18 years of age).
Adults Children
The children
79% 21% 21%
of the children are below 5 years
old.
Children Children
(5-17 years) (Under 5)
36%
2
28%
22%
The average number of children
14%
in one household; the same as
1 2 3 4 and the national average.
aboveThe Study UNICEF 17
Key characteristics Urban Child Poverty Report
f the respondents
35%
35%
25% 24%
7% 8% of the heads of household aged
1% between 40-49 years old.
20-29 30-39 40-49 50-59 60-69 70-79
Head of household
82%
18% 82%
male.
Male Female
68%
68%
27%
5% Malay.
Malay Indian Chinese
82%
7% 10%
82%
1% married.
Married Separated/ Single Single
Divorced Parent
22%
of households have three
generations (grandparents,
parents and children).18 UNICEF The Study
Urban Child Poverty Report Key characteristics
The majority Figure 2.2: Heads of household by educational attainment (%)
of household
heads have low 5%
2%
educational 3% 1%
Secondary school (4-5)
attainment. 5%
Secondary school (1-3)
8%
Primary school
60%
15% University
College Never been to school
Form 6 No information
9 in 10 Figure 2.3: Heads of household by employment status and occupational groups (%)
have semi- Percentage of heads of household (%)
skilled or low- 100
skilled jobs. 80
60
40 88%
72%
20 17%
10% 11%
2%
0
Working Not working Retired Skilled Semi-skilled Low skilled
Employment status Occupational groups
Among the Figure 2.4: Head of households by employment sector and form of employment (%)
employed,
3 in 5
Percentage of heads of household (%)
100
work in the 80
private sector. 62%
60
90% 40
90%
work full time.
23%
20 8% 7%
6%
1%
3%
0
Employer Public Private Own Other Full time Part time Uncertain
employee Employee Account
Worker
Employment sector Form of employmentThe Study UNICEF 19
Key characteristics Urban Child Poverty Report
1 in 3 Figure 2.5: Social safety net by types of coverage (%)
has no social
safety net,
60
leaving them
vulnerable 50
to economic
shocks. 40
30 62% 59% 58%
20 33%
10
9%
0
EPF SOCSO EPF and Without EPF, Life and
SOCSO SOCSO, Medical, Medical
and Life Insurance Insurance
They work harder but earn much less than the average worker.
Figure 2.6: Average working hours (per week) and hourly wages (RM) for employees6
60
50
40
30
48 47
20 12
10
9
0
Low-cost flats National6 Low-cost flats National7
Working hours (per week) Hourly wages (RM)
6 Department of Statistics Malaysia, ‘Labour Force Survey Report 2016’, Putrajaya, April 2017, p. 134;
7 'Labour Force Survey Report 2016', p. 134; Department of Statistics Malaysia, ‘Salaries & Wages Survey Report 2016’,
Putrajaya, May 2017, p. 23.20 UNICEF Di Sebalik Tabir
Urban Child Poverty Report Enumerator's Experiences
Di Sebalik Tabir
'Di Sebalik Tabir' means "Behind the Scene". In this report, each section break will feature
description of the enumerators' experiences during data collection, along with selected
photographs taken by the participants of the Youth Photography Course, organised by
OBSCURA Festival of Photography in collaboration with DM Analytics for UNICEF. For
details, please refer to page 65. The articles have been slightly edited from the original
for clarity.
Written by Noor Syafiqah binti Norrashid, enumerator
Bukan disebabkan mereka bercerai ataupun berpisah, tapi majoritinya kerana
Kebanyakan ditinggalkan tanpa berita. Kasihan tengok mereka terpaksa membesarkan dan sara
anak-anak seorang diri. Dengan gaji yang mereka dapat setiap bulan memang banyak
rumah yang saya dihabiskan hanya untuk memenuhi keperluan anak-anak. Saya teringat ada sebuah
pergi banyak ibu rumah yang didiami oleh seorang ibu tunggal bersama lima orang anak yang semuanya
masih bersekolah. Bila ditanya perbelanjaan bulanannya cukup atau tidak untuk seisi
menetap bersama rumah, dia jawab tidak cukup sebab sumber pendapatan dia hanya bergantung kepada
anak-anak tetapi duit jualan kuih setiap hari. Lebih-lebih lagi apabila sesi persekolahan bermula, memang
dia terpaksa mencari kerja sampingan untuk membayar yuran anak-anak dan membeli
tanpa suami. pakaian sekolah.
Pengalaman yang paling menyayat hati saya adalah apabila hampir semua responden
beritahu mereka tidak dapat membuat simpanan langsung kerana duit yang mereka
peroleh semuanya habis dibelanjakan untuk keperluan asasi seisi rumah setiap bulan.
Ada antara mereka meluahkan keinginan hendak menyimpan wang macam orang lain,
tapi kalau buat begitu, kata mereka, akan kebulur lah satu rumah. Setiap masa kehendak
mereka terpaksa diabaikan bagi memenuhi keperluan seharian. Pada mulanya saya
tidak percaya keadaan begini masih berlaku di kawasan yang membangun dan maju,
terutama sekitar Kuala Lumpur, tetapi itulah hakikat kehidupan masyarakat di situ. Di
sebalik kemajuan yang dicapai, masih ramai lagi yang terpaksa berjuang untuk hidup dan
mencari rezeki kais pagi makan pagi untuk membesarkan anak-anak mereka.Di Sebalik Tabir UNICEF 21
Photography Course Urban Child Poverty Report
© UNICEF Malaysia/2017/Hanisah
Kekurangan Bukanlah Penghalang
Written by Hanisah (15 years old), photography workshop participant
Tidak semua kanak-kanak itu sempurna. Gambar ini menceritakan tentang Na'il, Bilal dan Harezz yang mempunyai ikatan
kekeluargaan sangat erat. Keriangan Na'il dan Harezz di sisi Bilal mencetuskan suasana riuh. Walaupun mereka sukar
untuk berkomunikasi kerana umur Na'il yang masih muda dan Harezz pula mempunyai masalah jantung sejak bayi, itu
tidak sedikitpun menghalang kemesraan antara mereka. Kesukaran mereka untuk bercakap dengan lancar menyebabkan
saya cuba memahami bahasa mereka dan kadangkala saya akan bertanya kepada ibu bapa mereka jika ada perkataan
yang saya tidak faham. Siapa sangka, dalam ketidaksempurnaan tetap dapat bermain seperti kanak-kanak lain. Jadi
melalui gambar ini saya ingin mengatakan bahawa kekurangan bukanlah penghalang kepada sesuatu hubungan atau
ikatan malah ia juga memberi banyak pengalaman kepada kita.Income, Transfers
and Savings
Introduction
The Study
Income, Transfers and Savings
Living Standards
Education and Nutrition
Poverty and Deprivation
Malnutrition
Policy Recommendations
Programme Reports
Appendices and ReferencesThe Study UNICEF 23
Income, transfers, and savings Urban Child Poverty Report
Income
1 in 3 earns less than RM2,000 per month and 7% of households live
below the poverty line.
Table 3.1: Average and median income per month, by
Figure 3.1: Households distribution, by income class (%)
ethnicity (RM)
Percentage of households (%)
40
30
Total Malay Chinese Indian 20
27%
26%
Average RM2,933 RM3,074 RM2,664 RM2,631
10 7% 18%
12%
11%
Median RM2,500 RM2,700 RM2,350 RM2,100
0
Below RM1,000- RM2,000- RM3,000- RM4,000- RM5,000
RM1,000 1,999 2,999 RM3,999 4,999 & above
Income class
43% of Indian, 34% of Chinese and 30% of Malay households have a
monthly household income below RM2,000.
Figure 3.2: Percentage of household income, by ethnicity (%)
Percentage of households (%)
40
35%
30%
30 28%
26%
24% 25%
20% 20%
20
14%
12% 11%
10% 9% 9%
10 6% 8% 8% Malay
4% Chinese
Indian
0
Below RM1,000 RM1,000-1,999 RM2,000-2,999 RM3,000-RM3,999 RM4,000-4,999 RM5,000 & above
Income class24 UNICEF The Study
Urban Child Poverty Report Income, transfers, and savings
Transfers and Savings
Less than Figure 3.3: Percentage of household transfers, by type of transfers (%)
4% 80
70
of households 60
received either 50
zakat or JKM 40
68% 65%
assistance.... 30
20 10%
10 1% 3% 3%
0
At least one BR1M Inter HH Zakat JKM Others
assistance
received
Types of transfers
... and Figure 3.4: Percentage of heads of household receiving BR1M, by income class (%)
34% 80
of those with 70
household 60
50
incomes below
40
RM4,000 did not 30
67% 72%
66% 55%
receive BR1M. 20 46%
35%
10
0
Below RM1,000- RM2,000- RM3,000- RM4,000- RM5,000
RM1,000 1,999 2,999 RM3,999 4,999 & above
Income class
77% Figure 3.5: Household distribution, by total amount of savings (%)
of households 100
have no 80
savings. 60
77%
40
20 12% 9%
1% 0% 1% 0%
0
RM0 RM1- RM1,000- RM2,000- RM3,000- RM4,000- RM5,000
RM999 1,999 2,999 3,999 4,999 & aboveDi Sebalik Tabir UNICEF 25
Enumerator's Experiences Urban Child Poverty Report
Written by Zaitun Othman, enumerator
Dengan keadaan
Sewaktu kami menjalankan kaji selidik dari rumah ke rumah, rata-rata mereka
yang agak sunyi menerima kami dengan baik. Ada yang menjemput masuk, ada yang memberi makan
dan gelap akan dan minum, ada yang memberi nasihat, tetapi ada juga yang menutup pintu. Mereka
akan memberitahu masalah jenayah yang berlaku di kawasan itu agar kami berhati-hati.
menggalakkan Masalah dadah, bagi mereka, adalah masalah yang biasa berlaku di sini. Mereka tidak
tokan dadah akan membiarkan anak-anak mereka bermain diluar rumah tanpa pengawasan. Awal
pagi dan lewat petang adalah masa yang ditakuti oleh penduduk PPR.
mengedarkan
© UNICEF Malaysia/2017/Falah Syukran Adenan
barangan mereka
di tangga-tangga
dan lif.26 UNICEF Di Sebalik Tabir
Urban Child Poverty Report Photography Course
Photographs in this page are by: © UNICEF Malaysia/2017/Kisshen Raj R. Muthiah
Our New Little Neighbour
Written by Kisshen (15 years old), photography course participant
This is our neighbour’s son, Darshan. He is only a year old. This little man comes to visit us always. Even though he is not
from our family, he has already captured our attention and affection. I think he is closer to us compared to his own family.
Our bond with him is very strong and our home is a lot quieter when he is not around. He is like a light that brightens our
family’s joy.Living Standards
Introduction
The Study
Income, Transfers and Savings
Living Standards
Education and Nutrition
Poverty and Deprivation
Malnutrition
Policy Recommendations
Programme Reports
Appendices and References28 UNICEF The Study
Urban Child Poverty Report Living standards
Living Standards
More than 1 in 5 feel that public areas in their community are not
clean.
Figure 4.1: Resident's perception of cleanliness of public areas and the effectiveness of drainage systems (%)
1% 3%
20% Clean
33% Very clean
8%
Dirty
70% 60%
Very dirty
3%
Cleanliness of public areas Effectiveness of drainage system
© UNICEF Malaysia/2017/Hanisah
Kuala Lumpur experiences heavy rain frequently and this causes the drainage
systems around low-cost housing to clog up.The Study UNICEF 29
Living standards Urban Child Poverty Report
"We have to take care of each other."
- Puan Devi (45 years old), resident of PPR
The respondents maintain good relationship with their neighbours, irrespective of ethnicity (Figure 4.2). They also have
close relationship with their children (Figure 4.3). Over half of mothers of children aged below five are always with their
children, and only 5% of fathers did not spend time with their children.
Figure 4.2: Relationship with other ethnic groups and neighbours, by status (%)
4%
15%
15%
9%
Close
76% 81% Really close
Not close
Relationship with other ethnic groups Relationship with neighbours
Figure 4.3: Time spent with mothers and fathers, for children (%)
Percentage of households (%)
60
50
40
30 58%
51%
19%
20
11% 27% 12%
10 6% 5%
3% 3% 2%
1% 1% 1%
0
Don't Morning Morning Evening Evening Night All the Don't Morning Morning Evening Evening Night All the
have time and night and night time have time and night and night time
Time spent with mother Time spent with father30 UNICEF The Study
Urban Child Poverty Report Living standards
Safety and Social Issues
3 out of 4 respondents feel that the area is unsafe for their children at night.
A majority of the respondents have reported witnessing school students smoking or drinking alcohol in the
neighbourhood.
Figure 4.4: Safety of the neighbourhood for children, by time of day (%)
Percentage of households (%)
100
80
25%
61%
60
64%
40
75%
20 39% 36% Safe
Not safe
0
Morning Afternoon Early night
Time of the day
Figure 4.5: Observation of students in the residential area and involvement of household children, by social issues (%)
Q: Are there any schoolchildren in this Q: Have your children been involved in
community involved in these activities? any of these activities?
6% 4%
6%
12%
9%
19%
80% 65%
Smoking and drinking alcohol Sexual relationship Smoking Drinking alcohol
Stealing Drugs Drugs StealingDi Sebalik Tabir UNICEF 31
Enumerator's Experiences Urban Child Poverty Report
It's all about
perception.
Perceptions of cleanliness and safety are different from person to person. The enumerators
tell a different story from what was surveyed in regards to cleanliness. However, there
is a general consensus between enumerators and respondents when it comes to feeling
unsafe.
"Kebanyakan ibu tidak akan membiarkan anak-anak mereka yang berumur bawah
9 tahun turun atau naik ke rumah menggunakan lif jika berseorangan. Pernah juga
berlaku kes rogol dalam lif."
– Nur Zaslin Binti Zailani, enumerator
"Mungkin sebab inilah mereka berwaspada apabila terdapat orang yang tidak dikenali
melawat mereka. Saya juga mendengar cerita daripada salah seorang responden
bahawa terdapat kes jiran merompak rumah jiran lain dan ini mungkin menambahkan
perasaan takut mereka terhadap orang luar."
- Hamy Asraf bin Hamidi, enumerator
"Kebersihan di kawasan PPR sangat tidak memuaskan. Keadaannya kotor dan agak
berbau. Air bertakung di lantai aras dan sampah berterabur. Lif berbau hancing dan
tangga dipenuhi sampah. Tahap kebersihan berbeza di setiap aras. Lagi tinggi aras lagi
bersih dan aras yang di bawah lebih kotor dan busuk."
- Zaitun Othman, enumerator
© UNICEF Malaysia/2017/KimiEducation and
Nutrition
Introduction
The Study
Income, Transfers and Savings
Living Standards
Education and Nutrition
Poverty and Deprivation
Malnutrition
Policy Recommendations
Programme Reports
Appendices and ReferencesThe Study UNICEF 33
Education Urban Child Poverty Report
Education
51% of children who are 5 and 6 years old are not attending preschool and
2% of those who are 7 to 17 years old are not in school.
Out of the 2 per cent, 84 per cent are 13 to 17 years old, while 16 per cent are 7 to 12 years old.
Figure 5.1: Percentage of children not enrolled in school, by age cohorts (%)
Percentage of children (%)
60
50
40
30
20
51%
10
2%
0
5-6 years old 7-17 years old
Age cohort
About 4 in 10 households have no toys for the children aged below 5
and 31% of households have no books for children aged below 18.
Figure 5.2: Average number of toys for children aged below 5 and number of books for children per household (%)
100
7% 15%
13%
80
21%
60 41%
33%
40 None
Less than 5
20 39% 31% 6 to 10
More than 11
0
Number of toys Number of books34 UNICEF The Study
Urban Child Poverty Report Education
There is no Figure 5.3: Average number of books for children, by parents' educational attainment (%)
correlation
between the 100
10% 15% 15% 11%
possession 20% 17%
80 14%
of reading 22%
materials and 60
33%
29%
40%
33%
the parents' 40 No books
education level.
Less than 5
20 37% 42%
30% 31% 6 until 10
More than 11
0
No Formal Primary Secondary Tertiary
Education Education Education Education
Parents' level of education
8 in 10 Figure 5.4: Study area for children (%)
children study 100
in the living
room. 80
60
40 81%
20 15%
2% 1%
0
Living room None Dining room Others
© UNICEF Malaysia/2017/Nur Atikah Mohd Shaidi
Studying in the living room can bring many distractions, since the space is small. In
Nur's case, the television is right next to her and this would mean that she needs to
study elsewhere if her family members would like to watch TV.The Study UNICEF 35
Education Urban Child Poverty Report
14% Figure 5.5: Academic performance of children in school, according to parents (%)
of children have 80
moderate to 60
weak academic
performances. 40
63%
20 13%
23%
1%
0
Very good Good Moderate Weak
Despite their Figure 5.6: Breakdown of grades received, by PMR subjects Mathematics, Science and
English8 (%)
challenges, the
children still Percentage of students (%)
2%
perform on par
1% 1%
100 5% 5%
3% 7% 6%
with the national 18%
average. 80 36% 31%
21%
27%
60
47% 19%
16% 42% A
40% B
40 13% C
19%
D
E
20 31% 30% 30%
26% 26%
0
Math: National Math: Sample Science: National Science: Sample English: Sample
Average, 2013 Average, 2013
Subject taken
Policy recommendation: Safe, shared spaces for children
Part of the reason why books and toys are not available is the lack of space in low-cost housing. There have been
multiple cases of families having to return boxes of toys provided to them by NGOs and other agencies because
they do not have enough space. The winning policy proposal for the 'Policython' programme is the establishment
of a community center acting as a safe space for children that can store books and toys to be shared amongst
themselves. Details of the Policython can be found in page 66.
8 United Nations Malaysia, Malaysia Millennium Development Goals Report 2015, Kuala Lumpur, January 2016, p. 6136 UNICEF The Study
Urban Child Poverty Report Nutrition
Nutrition
More than 1 in 10 children have less than three meals a day.
Figure 5.7: Average number of meals consumed per day, for children 5-17 years old (%)
12%
Less than three times a day
Three to five times a day
88%
© UNICEF Malaysia/2017/Falah Syukran Adenan
Roti canai is very much loved by Malaysians from all walks of life. Dipped in dhal
curry, this flatbread is a culinary delight. This meal, served with iced sweetened tea,
can be found in the food court near PPR Desa Rejang.The Study UNICEF 37
Nutrition Urban Child Poverty Report
97% Figure 5.8: Challenges to prepare healthy food for children (%)
of households
say that high
food prices 2% 1%
1%
prevent them
from preparing
healthy meals
for their
High prices and insufficient income
children.
Fast food is easier to prepare and cheaper
97% Limited time
Others
1 in 2 Figure 5.9: Sufficiency to purchase food and frequency of the incident
do not have
enough money Percentage of households (%)
to buy food in
100
recent months
48%
80
and
15% 60
85%
experience this 40
frequently.
52%
20
15%
0
Not enough money Rarely or
to buy food frequently?
Not enough Frequently
Enough money Rarely38 UNICEF Di Sebalik Tabir
Urban Child Poverty Report Enumerator's Experiences
© UNICEF Malaysia/2017/Raja Shah Ikhmal Raja Remi
Written by Iwani Khairiah binti Che Jamaluddin, enumerator
Inilah kata-kata yang diucapkan oleh salah seorang responden ketika ditemu bual.
"Percaya atau Beliau adalah seorang ibu kepada tiga orang anak lelaki dan tidak bekerja kerana
menjaga anak bongsunya yang berumur 7 tahun. Beliau telah berkahwin lain setelah
tak, sekarang ni kematian suami, tetapi malangnya suami baru pula tidak dapat bekerja kerana sakit.
ada sekilo beras Perbelanjaan rumah mereka bergantung kepada BR1M dan sumbangan yang tidak
seberapa daripada dua orang anaknya. Bayaran sewa rumah dan bil-bil lain telah lama
saja di rumah tertunggak malahan perbelanjaan makanan juga tidak mencukupi. Rumah yang diduduki
sekarang merupakan rumah PPR kedua mereka kerana rumah sebelum ini terlibat
saya." dalam kebakaran. Beliau meluahkan rasa tidak puas hati terhadap sesetengah pihak
yang sering memberi sumbangan kepada ibu-ibu tunggal. Menurut beliau, bukan semua
ibu tunggal memerlukan bantuan, sebaliknya bantuan harus diberikan kepada golongan
yang lebih memerlukan seperti keluarga beliau. Beliau berharap kemasukan BR1M
secepat mungkin untuk membeli keperluan dapur.© UNICEF Malaysia/2017/Raja Shah Ikhmal Raja Remi
© UNICEF Malaysia/2017/Raja Shah Ikhmal Raja Remi
© UNICEF Malaysia/2017/Muhammad Haiqal Mohd HazrariPoverty and
Deprivation
Introduction
The Study
Income, Transfers and Savings
Living Standards
Education and Nutrition
Poverty and Deprivation
Malnutrition
Policy Recommendations
Programme Reports
Appendices and ReferencesThe Study UNICEF 41
The Role of Journalism in Eradicating Urban Child Poverty Report
Poverty
Winning essay of the Journalism Essay Competition.
Further details of this programme can be found in page 68.
The Role of Journalism in
Eradicating Poverty
Written by Dewi Seribayu Nordin Selat, 2nd year student,
Faculty of Mass Communication and Media Studies, UITM
Shah Alam
© UNICEF Malaysia/2017/Falah Syukran Adenan
If you have ever been to Jakarta, you would know that it is a highly populated city filled
with skyscrapers, luxury condominiums and numerous shopping malls. Then there are
the densely-built shacks, informal settlements, squatters and slums - all within one city.
The contrast between the rich and the poor are jarring but the people seemed unbothered
by it. It was at a traffic light when a girl tapped on the window of our taxi. She looked to
be about the same age as I was at that time, around 10 or 11, wearing tattered clothing
with mismatched slippers that were too big for her. She asked for money and before my
parents could give her some, our taxi driver waved her away. “They are a nuisance,”
he said. We were quiet as we watched her walk dejectedly towards a group of children
huddled together. None of them had clean clothes, they were all skinny and most
importantly, none of them looked happy. I remembered thinking, “We are lucky that we
don’t have this in Malaysia.”
It was many, But the young me was, in one very important respect, wrong.
many years ago We may not see the poor in our cities but that does not mean that we do not have it. The
when I had my poor in our urban areas live in relative poverty and that is when people lack the minimum
amount of income needed to maintain the average standard of living in the society in
first encounter which they live in. A little-known fact about poverty in Malaysia is that the poor are not
some static group of people living in poverty year after year. Like the rest of us, they have
with poverty. jobs, families and children. This is even more alarming as we are so used to thinking that
people who lives in cities are economically sound. Isn’t it disturbing to think that there
are people working two, three jobs but are still unable to live comfortably? Poverty is not
only defined monetarily. It is a matter of exclusion to basic privileges including education,
basic civil and political rights and most importantly, the lack of opportunity. Children are
more than twice as likely as adults to live in extreme poverty, according to a new analysis
from the World Bank Group and UNICEF. Children suffer the most as they are not able to
do anything to change their standard of living and as such, they grow up deprived of the
basic privileges that they should have had.
It took me about a decade to realise that poverty is prevalent in our country. This poses
the question, how is it that it took me a decade to find out that this is happening in my own
backyard? It is simple, really - matters of poverty do not sell newspapers. In a market-
driven industry, those who can afford media consumption affects the content in the media
to a certain extent. Poverty is under-reported in the media and, when it is reported, those
facing poverty are not given the space to explain what it actually means. If that is so,
how is the public going to see and hear their struggles? How can we come together
as a community and eradicate this problem if we are not presented with an accurate
representation of their life?
Media have always played a central role in shaping opinion and policy. Reports on
poverty - on the rare occasion that it is reported - are filled with statistics and jargons42 UNICEF Di Sebalik Tabir
Urban Child Poverty Report The Role of Journalism in Eradicating
Poverty
that is incomprehensible to us. Poverty has often been presented to us in a very robotic
manner, devoid of emotion and compassion. While statistics are important, it detaches
the public from this issue and in some cases, the poor are dehumanised. In order for
us to stir the public, we need to appeal to their sensibilities. How so? Well, words are
undeniably powerful but when it is accompanied by a well-placed photograph? It compels
change. Photographs are like windows that the people can peek into, windows that can
connect them to the struggles and hopelessness of poverty. Photographs show them the
harsh reality of the urban poor. Photographs tell us what words cannot. Photographs tell
stories. Photographs tap into the soul.
Poverty is unforgiving especially towards children. Growing up and living in this kind of
environment leave deep scars and shape them to be people who have a pessimistic
view of the world. Poverty not only exists externally, but it can also exist within the mind
and spirit of a person. Poor people struggle with hopelessness, anxiety, shame and
inferiority. It is undeniable that this is the result of being voiceless and powerless. It gives
an internalised worldview where many believe that they are of no value and have nothing
significant to offer. As such, children grow up without aspirations and dreams. Mix with
the wrong company and some may end up becoming predators and join criminal gangs.
The environment that they live in are not conducive nor are there positive role models for
them to build a strong moral compass. These children not only lack moral anchoring, but
they lack focus and drift through life aimlessly. But these can change if they have a voice.
Without the access to a voice, those living in poverty are unable to participate directly in
debate or to express their views on public policies that directly affect them. From such
perspective, it can be said that the poor lack information and knowledge of actions that
could be taken to improve their conditions. It’s not that they don’t want to, it’s because
they don’t know how.
It is imperative that we remember the fact that the future of our country lies in the youth.
These children are no exception to that. How are we going to move forward as a nation
if we are unable to give these children another chance at life? If this issue persists for
too long, we will create the culture of poverty, passing from generation to generation. The
problem of today is tomorrow. What we cannot fix in this generation will be the problem
of the future. And if we want people to see that, we must be very honest about what, and
who, we mean when we talk about the poor. Be their voice. Be their change.The Study UNICEF 43
Poverty and Deprivation Urban Child Poverty Report
Poverty and Deprivation
While official statistics show that poverty has been eradicated in Kuala Lumpur, 7 per cent of our respondents live below
the poverty line. In relative terms, 85 per cent are considered poor. In per capita basis, the respondent's household
income is almost 6 times lower compared to KL's.
Figure 6.1: Absolute poverty by income profile (%) Figure 6.2: Relative poverty by income profile (%)
Percentage of households %) Percentage of households %)
100 100
80 80
60 50% 60
40%
40 85%
40
54%
20 20 16%
7%
3% 5%
0% 2%
0 0
KL PLI Vulnerable Other M40 National KL* KL** Low-cost Low-cost
B40 flats* flats**
Figure 6.3: Household income per capita (RM)
Household income (RM)
3500
3000
2500
2000
1500 3,248
1000 1,697 575
500
0
National KL Low-cost flats
Note:
Poor Household = Household with HHI below urban PLI (RM970)
Vulnerable household = Household with HHI between PLI and 2.5 times PLI
Other B40 = Household with HHI between 2.5 times PLI to RM7639/month
Middle 40 = Household with HHI between RM7640-15159
*Relative Poverty – using National median income (Household Income below RM2,614)
**Relative Poverty – using KL median income (Household Income below RM4,536)44 UNICEF The Study
Urban Child Poverty Report Poverty and Deprivation
7% of children live in absolute poverty. In relative terms and
adjusting for household size, almost all of them live in poverty.
Figure 6.4: Percentage of children, by household income profile (%)
Percentage of children (%)
100
80
60 50%
40%
40
20 7%
0% 3%
0
KL PLI Vulnerable Other B40 M40
Figure 6.5: Child poverty, absolute and relative terms (%)
Percentage of children (%)
100
80
60
99.7%
40 34% 86.2%
20
7% 15%
0%
0
KL Low-cost National Low-cost Unadjusted Adjusted
flats flats household household
income income
Below PLI Twice PLI9 Relative poverty
9 National number is taken from Economic Planning Unit, Malaysia Sustainable Development Goals: Voluntary national review 2017, Putrajaya, July
2017, p. 14Di Sebalik Tabir UNICEF 45
Photography Course Urban Child Poverty Report
© UNICEF Malaysia/2017/Kisshen Raj R. Muthiah
The Muthiah family's head of household normally spends his time after work in the
living room. In the background, dining chairs were also used to hang his pants.Each child spends their free time differently. As for Amir, who had just 46
finished his PT3 examination (during this survey was conducted),
he often spends time with his friends at the local pool centre until late
in the evening. And in the morning he helps his mother with her business.
UNICEF
Urban Child Poverty Report
Di Sebalik Tabir
Photography Course
© UNICEF Malaysia/2017/KimiDi Sebalik Tabir UNICEF 47
Photography Course Urban Child Poverty Report
© UNICEF Malaysia/2017/Muhammad Amerol Afiq Mohd Dzon Akhirom
Kakak Saya
Written by Amerol (15 years old), photography course participant
Kakak saya seorang yang sabar dan tidak berputus asa. Bagaimanapun ada masanya dia kecewa juga apabila pelanggan
masih marah-marah walaupun sudah dilayan dengan baik. Kadang-kadang dia juga diperlekehkan oleh orang kaya yang
ingat dia tidak mempunyai sijil SPM sebab bekerja di kedai menjual telefon. Apabila tidak dapat menjual sebuah telefon
dalam masa dua minggu atau sebulan dia terfikir untuk berhenti kerja, tetapi tetap berusaha untuk membuat yang terbaik.
Kakak saya juga seorang yang mempunyai hubungan baik dengan majikan dan rakan sekerjanya.Malnutrition
Introduction
The Study
Income, Transfers and Savings
Living Standards
Education and Nutrition
Poverty and Deprivation
Malnutrition
Policy Recommendations
Programme Reports
Appendices and ReferencesThe Study UNICEF 49
Malnutrition Urban Child Poverty Report
Malnourishment is a major concern in Malaysia. 1 in 5 is stunted, and 1 in 10 is underweight.
Malnutrition is another form of deprivation. In this study, the prevalence of underweight, stunting and wasting among
children aged below 5 are two times higher compared to the KL average. The prevalence of overweight however is almost
six times higher (23%) compared to the KL average (4%).
Figure 7.1: Snapshot of malnutrition in children10
Normal Wasting Stunted Wasting and stunted
Normal weight and Thinner than Shorter than Thinner and shorter
height normal normal than normal
Figure 7.2: Level of stunting by state, 201611 (%)
40
30
20 34%
26% 26% 24% 24% 24% 23%
10 21% 21% 20% 19% 19% 18%
14% 12% 11%
0
Terengganu
Sabah &
Sarawak
Kelantan
Melaka
WP Putrajaya
Perlis
Labuan
Pahang
Malaysia
Perak
Selangor
Pulau
Pinang
WP Kuala
N. Sembilan
Kedah
Johor
Lumpur
Compared to countries with similar GDP per capita as Malaysia, the prevalence of obesity among Malaysian children is
relatively higher. For instance, nearly 13% of our children aged 5-19 are obese, higher than Hungary (11%), Turkey (10%),
and Poland (9%)12. In terms of stunting, Malaysian children perform worse than Ghana, despite Malaysia's GDP per capita
being six times higher13. A higher income does not mean better health. Even in the richest district in Malaysia, Putrajaya,
almost one in four is stunted, higher than national average (Figure 7.2). Children in the poorest stat, i.e. Kelantan, also
performed much worse than children in low income countries like Zimbabwe and Swaziland14.
10 Normal weight and height refers to weight-for-age, height-for-age, and weight for height with a z-score that is -2SD ≤ +2SD. Wasting: Weight-
for-height z-score < -2SD. Stunted: Height-for-age z-score < -2SD. Source: World Health Organization, ‘Interpreting Growth Indicators’, Training
Course on Child Growth Assessment: WHO child growth standards, Geneva, 2008, p. 14.
11 Institute of Public Health Malaysia, ‘The National Health and Morbidity Survey 2016: Maternal and child health’, Vol. II: Findings, Kuala Lumpur,
2016, p. 156
12 World Health Organization, 'Joint Child Malnutrition Estimates 2017 (UNICEF-WHO-WB)', May 2017, , accessed on 14 November 2017.
13 World Health Organization, 'Global Health Observatory Data Repository: Prevalence of overweight, age-standardized', n.d., , accessed on 15 January 2018.
14 Ibid.50 UNICEF The Study
Urban Child Poverty Report Malnutrition
How does Malaysia perform against other countries
in the region?
Our children perform worse than some lower-income countries in the region. Table 7.1 below are the latest available
figures from WHO.
Table 7.1: Percentage of wasting, stunting, underweight, and overweight for children aged below 515, and obese for children and
adolescents aged 5 to 1916 for Malaysia and the Southeast Asian region (%)
Wasting Stunting
Rank Country Rate Rank Country Rate
1 Brunei 2.9% 1 Singapore 4.4%
2 Singapore 3.6% 2 Thailand 16.3%
3 Laos 6.4% 3 Malaysia 17.7%
4 Vietnam 6.4% 4 Brunei 19.7%
5 Thailand 6.7% 5 Vietnam 24.6%
6 Myanmar 7.0% 6 Myanmar 29.2%
7 Philippines 7.9% 7 Philippines 30.3%
8 Malaysia 8.0% 8 Cambodia 32.4%
9 Cambodia 9.6% 9 Indonesia 36.4%
10 Indonesia 13.5% 10 Laos 43.8%
Obese
Underweight Overweight (Children and adolescents
aged 5 to 19)
Rank Country Rate Rank Country Rate Rank Country Rate
1 Singapore 3.3% 1 Myanmar 1.3% 1 Vietnam 2.6%
2 Thailand 9.2% 2 Laos 2.0% 2 Cambodia 3.2%
3 Brunei 9.6% 3 Cambodia 2.0% 3 Myanmar 3.7%
4 Malaysia 12.4% 4 Singapore 2.6% 4 Philippines 4.3%
5 Vietnam 14.1% 5 Philippines 5.0% 5 Laos 4.7%
6 Myanmar 18.9% 6 Vietnam 5.3% 6 Indonesia 6.1%
7 Philippines 19.9% 7 Malaysia 7.1% 7 Singapore 6.8%
8 Indonesia 19.9% 8 Brunei 8.3% 8 Thailand 11.3%
9 Cambodia 23.9% 9 Thailand 10.9% 9 Malaysia 12.7%
10 Laos 26.5% 10 Indonesia 11.5% 10 Brunei 14.1%
15 ‘Joint Child Malnutrition Estimates 2017 (UNICEF-WHO-WB)’
16 ‘Global Health Observatory Data Repository: Prevalence of overweight, age-standardized’The Study UNICEF 51
Malnutrition Urban Child Poverty Report
The prevalence of stunting and anaemia have also increased in a decade (Table 7.2). In the same period, wasting among
children has decreased, but it still remains high as in every ten children in Malaysia, one is wasting.
Table 7.2: Statistics of malnutrition for children aged below 5 and pregnant women aged 15-49, 2006 and 201613 (%)
Year 2006 2016
Stunting 17.0% 20.7%
Wasting 13.0% 11.5%
Anaemia (in pregnant women
28.4% 30.8%
15-49 years old)
Malnutrition for children in low-cost flats is worse than the national and KL
average.
The prevalence of malnutrition in children under 5 years old in the sample is above both the national and KL average.
Stunting and wasting is twice the KL average.
Figure 7.3: Percentage of malnutrition among children aged below 5, between Malaysia, KL and low-cost flats (sample)14 (%)
30
21% 22%
20%
20
14% 15%
12%
11%
9%
10 8%
Malaysia
Kuala Lumpur
Low-cost DBKL
0 flats (Sample)
Underweight Stunting Wasting
17 ‘Joint Child Malnutrition Estimates 2017 (UNICEF-WHO-WB)’
18 Institute of Public Health Malaysia, ‘The National Health and Morbidity Survey 2016: Maternal and child health’, Vol. II: Findings, Kuala Lumpur,
2016, pp. 154, 156, 158.52 UNICEF The Study
Urban Child Poverty Report Malnutrition
Malnutrition among children under 5 years old
Figure 7.4: Weight-for-age status among children aged below 5 (%)
15% Percentage of children (%)
are 100
20%
underweight. 80
7%
8%
60
40 Normal
65%
Underweight
20
Severly underweight
Overweight
0
Weight-for-age status
Figure 7.5: Height-for-age status among children aged below 5 (%)
22% Percentage of children (%)
are stunted. 100
16%
80
15%
7%
60
40 Normal
62%
Stunting
20
Severely stunting
Tall
0
Height-for-age status
Figure 7.6: Weight-for-height status among children aged below 5 (%)
20% Percentage of children (%)
are wasting and 100
12%
23% 80 11%
9%
60 11%
are either Normal
overweight or 40 Wasting
56%
obese. 20
Severely wasting
Overweight
Obese
0
Weight-for-age statusThe Study UNICEF 53
Malnutrition Urban Child Poverty Report
Prevalence of malnutrition is higher
among older children.
The figures below compare malnutrition between children of 2- and 4-years old in the sample. Once the children are
weaned off from breast milk and fed solid food, the prevalence of malnutrition increases.
Figure 7.7: Height-for-age status among children aged 2 & 4 (%)
23% Percentage of children (%)
of 4-year-olds 100
21% 23%
are stunted, as 80 4%
compared to 11% 15%
15%
60 8%
40 Normal
64%
of 2-year-olds. 20
55% Stunting
Severely stunting
Tall
0
2 years old 4 years old
Figure 7.8: Weight-for-age status among children aged 2 & 4 (%)
22% Percentage of children (%)
of 4-year-olds 100
17%
23%
are underweight 80
5% 11%
as compared to 11%
5%
60
40 73% Normal
62%
of 2-year-olds. 20
Underweight
Severly underweight
Overweight
0
2 years old 4 years old54 UNICEF The Study
Urban Child Poverty Report Malnutrition
Figure 7.9: Weight-for-height status among children aged 2 & 4 (%)
32% Percentage of children (%)
of 4-year-olds 100
14%
6%
3%
are wasting as 80 10% 16%
7%
compared to 10% 16%
17%
60
Normal
40 Wasting
59% 59%
of 2-year-olds.
Severely wasting
20 Overweight
Obese
0
2 years old 4 years old
Malnutrition by ethnicity
The prevalence of stunting and wasting are found to be higher among Chinese children, while Indian children are found to
be more underweight as well as overweight.
Figure 7.10: Percentage of malnutrition, by ethnicity (%)
40 38%
33%
31%
30
24% 25%
21% 21%
18% 20%
20
14% 15%
9%
10 Malay
Chinese
Indian
0
Underweight Stunting Wasting OverweightThe Study UNICEF 55
Does size matter? Urban Child Poverty Report
Does size matter? Yes, it does.19
A summary of the winning paper for the Student Research Award titled "Urban Child Poverty: Does Size Matter?" by Sudha
Sivadas and Normaz Wana Ismail from the Faculty of Economics and Management, Universiti Putra Malaysia. Details of
this programme can be found in page 69.
The objective of this paper is to investigate ‘health poverty’ among children (5-17 years old) living in an Urban Vulnerable
Group (UVG) household. Does the size of the child from UVG household matter? Do bigger and heavier children mean
they have better access to food and nutrition, or the contrary?
The Economic Planning Unit defines the UVG as a group of people who are vulnerable to crisis and economic uncertainties,
have low income, low education and are often engaged in low-skill and less productive sectors. Childhood obesity is a global
phenomenon and is becoming more prevalent in a rapidly urbanising country like Malaysia. Obesity is a physical condition
where body weight increases by consuming more energy than expending it. It impairs health and curtails longevity, leading
to severe health risks, namely non-communicable diseases like cardiovascular disease, diabetes mellitus and cancer.
The obesity prevalence in Malaysia accelerated post-1990, where Malaysians generally prefer passive modes of transport
and leisure activities that require minimal physical energy. The prevalence of obesity among Malaysian children between
the ages 5 and 19 is higher than the global prevalence. It is also found that by strata, urban areas have more overweight
and obese children at 19.1% compared to children in rural areas at 16.5-17.5%20. Corresponding with this fact is the
increasingly ubiquitous trend of food away-from-home, which is becoming a major diet component in most rapidly-
urbanising countries. The longer work hours and distance from home to work compel people to consume food outside
their homes.
The Department of Statistics reports a steady increase in the food away-from-home index, the most recent being an
increase of 3.3% in October 2016. A food away-from-home is associated with higher energy and fat intake and lower
micronutrient intake and this could lead to increased prevalence of obesity. As processed food becomes more widely
available, diet becomes more laden with high calories and sugar. Coupled with an inactive lifestyle, the modern diet is the
ideal recipe for chronic diseases especially among the poor. A survey among teenagers in Egypt revealed that more than
50% consume one or more sweet carbonated beverages daily while close to 90% did not participate in regular physical
exercise21.
This study found that the highest prevalence of overweight and obesity occurred among children of Chinese ethnicity
(17.3%), followed by Malay (17.2%), Indian (16%) and other Bumiputera (16%). When it comes to obesity, Chinese
children ranked highest at 19%, followed by Indian (18%), Malay (17%), and other Bumiputera (16%). The size of family
also matters as larger households are about 12% and 7% more likely to have overweight and obese kids. By adults
nutritional status, households with heavier adults also are approximately 5.3% and 10% more likely to have overweight
and obese kids respectively. By income, families under the UVG category are about 5% less likely to have obese kids.
By education of the parents, higher educated parents/HOHs have 3% lower possibility of having obese kids in their
households. Households led by single-parents are also more likely to have overweight and obese children.
Although the results do not explicitly specify that UVG households are likely to have overweight and obese children, this
group cannot be overlooked. Given that most single-parent led households are in the UVG category, suffice to say that the
overweight and obesity issue among the UVGs households is becoming more prevalent.
This trend is similar to the experience of developed countries during their rapid urbanisation stage. It confirms the notion
that obesity not only plagues the affluent, but pervades all levels of society. Though currently not at alarming levels, it
should be an indication of future trends if left unheeded. Especially when access to healthy fresh produce is increasingly
limited, in terms of availability and affordability, compared to mass-produced, calorie- and energy-dense
processed foods.
19 Ismail, Normaz W., Sudha Sivadas, Urban Child Poverty: Does size matter?, Universiti Putra Malaysia, November 2017, pp. 30
20 Institute of Public Health Malaysia, ‘The National Health and Morbidity Survey 2015’, Vol. II: Non-communicable diseases, risk factors & other
health problems, Kuala Lumpur, 2015, p. 78.
21 Lobstein, Tim, et al., ‘Child and Adolescent Obesity: Part of a bigger picture’, The Lancet, vol. 385, no. 9986, 20 June 2015You can also read