Trends in Absolute Income Mobility in North America and Europe - IFAU
←
→
Page content transcription
If your browser does not render page correctly, please read the page content below
WORKING PAPER 2020:11

Trends in Absolute Income
Mobility in North America and
Europe

Robert Manduca, Maximilian Hell,
Adrian Adermon, Jo Blanden,
Espen Bratberg, Anne C. Gielen,
Hans van Kipepersluis, Keun Bok Lee,
Stephen Machin, Martin D. Munk,
Martin Nybom, Yuri Ostrovsky,
Sumaiya Rahman, Outi Sirniö
The Institute for Evaluation of Labour Market and Education Policy (IFAU) is
a research institute under the Swedish Ministry of Employment, situated in
Uppsala.

IFAU’s objective is to promote, support and carry out scientific
evaluations. The assignment includes: the effects of labour market and
educational policies, studies of the functioning of the labour market and
the labour market effects of social insurance policies. IFAU shall also
disseminate its results so that they become accessible to different
interested parties in Sweden and abroad.

Papers published in the Working Paper Series should, according to the
IFAU policy, have been discussed at seminars held at IFAU and at least
one other academic forum, and have been read by one external and one
internal referee. They need not, however, have undergone the standard
scrutiny for publication in a scientific journal. The purpose of the Working
Paper Series is to provide a factual basis for public policy and the public
policy discussion.

More information about IFAU and the institute’s publications can be found
on the website www.ifau.se

ISSN 1651-1166
Trends in Absolute Income Mobility in North America and
 Europe a

 by

 Robert Manduca, Maximilian Hell, Adrian Adermon, Jo Blanden, Espen Bratberg,
 Anne C. Gielen, Hans van Kipepersluis, Keun Bok Lee, Stephen Machin, Martin D.
 Munk, Martin Nybom, Yuri Ostrovsky, Sumaiya Rahman, and Outi Sirniö b

 August 10, 2020

Abstract
We compute rates of absolute upward income mobility for the 1960-1987 birth cohorts in eight
countries in North America and Europe. Rates and trends in absolute mobility varied dramatically
across countries during this period: the US and Canada saw upward mobility rates near 50% for
recent cohorts, while countries like Norway and Finland saw sustained rates above 70%.
Decomposition analysis suggests that differences in the marginal income distributions, especially
the amount of cross-cohort income inequality, were the primary driver of differing mobility rates
across countries. We also demonstrate that absolute mobility rates can be accurately estimated
without linked parent-child data.

Keywords: Intergenerational mobility, absolute mobility, inequality
JEL-codes: J62

a We are grateful to Raj Chetty and Yonatan Berman for feedback on previous drafts of this paper. An earlier version
of this paper was presented at the ISA RC28 2019 Summer Meeting in Princeton, New Jersey. The authors gratefully
acknowledge financial support from the following sources: the Harvard Multidisciplinary Program in Inequality and
Social Policy (Manduca); the NORFACE Joint Research Programme on Dynamics of Inequality Across the Life-
course, which is co-funded by the European Commission through Horizon 2020 under grant agreement no. 724363
(Adermon, Blanden, van Kippersluis, and Machin); NWO Vidi grant no. 452-17-007 (Gielen); the Strategic Research
Council of the Academy of Finland, decision number 293103 (Sirniö); and European Research Council Consolidator
grant ERC-2013-CoG-617965 (Sirniö).
b Manduca: Department of Sociology, University of Michigan (email: rmanduca@umich.edu); Hell: Department of

Sociology, Stanford University (email: hell@stanford.edu); Adermon: Institute for Evaluation of Labor Market and
Education Policy (email: adrian.adermon@ifau.uu.se); Blanden: Department of Economics, University of Surrey
(email: j.blanden@surrey.ac.uk); Bratberg: Department of Economics, University of Bergen (email:
Espen.Bratberg@uib.no); Gielen: Erasmus School of Economics (email: gielen@ese.eur.nl); van Kippersluis: Erasmus
School of Economics (email: hvankippersluis@ese.eur.nl); Lee: California Center for Population Research, University
of California, Los Angeles (email: keunboklee@g.ucla.edu); Machin: Department of Economics, London School of
Economics (email: S.J.Machin@lse.ac.uk); Munk: The Free University, Copenhagen (email:
mdmunk@detfrieuniversitet.dk); Nybom: Institute for Evaluation of Labor Market and Education Policy (email:
martin.nybom@ifau.uu.se); Ostrovsky: Statistics Canada (email: yuri.ostrovsky@canada.ca); Rahman: Frontier
Economics (email: SumaiyaR@protonmail.com); Sirniö: Department of Sociology, University of Turku (email:
outi.sirnio@utu.fi).

IFAU - Trends in Absolute Income Mobility in North America and Europe 1
Table of contents

1 Prior Research ..................................................................................................................... 4
2 Data and Methods ............................................................................................................... 5
3 Results ................................................................................................................................. 7
3.1 Trends in Absolute Income Mobility .................................................................................. 7
3.2 Validation of the Copula and Marginals Approach .......................................................... 10
3.3 What Explains Variation in Upward Mobility? ................................................................ 12
4 Discussion ......................................................................................................................... 15
References ................................................................................................................................... 17

2 IFAU -Trends in Absolute Income Mobility in North America and Europe
The hope that standards of living rise from one generation to the next is widely shared across the
world. In the United States, this goal is often considered part of the “American Dream.” Yet the
extent to which different countries realize this goal is not well known. Recent research has shown
that in the United States, upward absolute income mobility—the likelihood of children growing
up to have higher incomes than their parents—has declined substantially over the last fifty years.
Roughly 90% of US children born in 1940 grew up to earn more than their parents at age 30,
compared to just 50% of the 1984 birth cohort (Chetty et al. 2017). But the United States is
unusual among developed countries along a number of dimensions that may impact absolute
mobility, including its low levels of relative social mobility (Corak 2006), its high levels of
inequality in market income (Piketty, Saez, and Zucman 2017), and its comparatively
underdeveloped welfare state (Esping-Andersen 2013). This raises the question: have other
countries also experienced declines in absolute income mobility, or is this an area in which the
US is exceptional?
 In this paper we present trends in absolute income mobility for a selection of North American
and European countries: Canada, Denmark, Finland, the Netherlands, Norway, Sweden, the
United Kingdom, and the United States. In doing so, we make three contributions to the literature
on intergenerational income mobility. First, we show that both levels and trends in absolute
mobility varied substantially across these countries for cohorts born in the late 20th century. The
United States appears to have been unusual but not unique in both the magnitude of its mobility
decline and the low upward mobility rate that currently pertains. Some countries, most notably
Norway and Finland, have had both higher and more stable rates of upward mobility in recent
generations, with Norway in particular maintaining a steady upward mobility rate of roughly 75%
for the 1964-1983 birth cohorts. Other countries, such as the UK and the Netherlands, have had
similarly high rates of mobility but with fluctuations, especially in recent years, that appear to
reflect the business cycle.
 Second, we provide direct validation of an increasingly common method to estimate absolute
mobility rates by combining separate datasets on the marginal income distributions of parents and
children and the parent-child income rank transition matrix, or copula. This “copula and
marginals” approximation is emerging as the most widely used method of calculating absolute
income mobility (e.g. Chetty et al. 2017; Berman 2018; Bönke, Harnack, and Luthen 2019). The
approach does not require linked parent-child records, which makes it possible to calculate
absolute mobility in the absence of high quality panel data. But it has not yet been directly tested
through comparison to linked data. We conduct such a test here in five countries where both types
of data exist, and show that the copula and marginals approach provides an accurate
approximation of the true absolute mobility rate.

IFAU - Trends in Absolute Income Mobility in North America and Europe 3
Third, we use decomposition analysis to show that differences in mobility between countries
stem largely from differences in levels of income inequality and economic growth rates, as
opposed to differences in the likelihood of children moving up or down in relative terms. While
Scandinavian countries have had higher rates of relative mobility than the US, these largely net
themselves out: anytime one child moves up the income ladder, other children necessarily move
down. Patterns of absolute mobility are determined much more by marginal income distributions
than by rank associations between children and parents (Berman 2018; Bukodi, Paskov, and
Nolan 2019). In the case of the United States, low mobility rates exist not because the US
economy has grown more slowly than the economies of other high-income countries, but because
the US is less efficient at translating economic growth into higher standards of living for its
populace.

1 Prior Research
Most previous research on intergenerational income mobility has focused on relative mobility—
the association between the adult incomes of parents and children (Jäntti and Jenkins 2015;
Torche 2015). A large literature has compared relative mobility rates across countries, generally
finding that it is high in the Nordic countries and Canada, midrange in countries like Germany
and Japan, and low in countries like Italy, the UK, and the US (Smeeding, Erikson, and Jäntti
2011; Bratberg et al. 2017; Corak 2016).
 Very recently a number of researchers have turned to absolute income mobility, motivated by
the high salience of absolute comparisons among laypeople (Ravallion 2018; Amiel and Cowell
1999) and its straightforward normative interpretation: while one person’s upward mobility in
relative terms necessarily comes at the expense of someone else’s downward mobility, upward
mobility in absolute terms does not. Individual studies have estimated absolute mobility rates for
recent cohorts of roughly 50% in the US (Chetty et al. 2017), 53% in Canada (Ostrovsky 2017),
70% in Germany (Bönke, Harnack, and Luthen 2019; Stockhausen 2018), and 77% in Sweden
(Liss, Korpi, and Wennberg 2019).
 While no prior study has compared upward mobility rates across developed countries using
comprehensive intergenerational administrative and survey data, Berman (2018) approximates
mobility rates from countries’ marginal income distributions alone. His findings suggest that
upward mobility declined over the second half of the 20th Century in 10 countries, and confirm
that absolute mobility is determined largely by the marginal income distributions of parents and
children, echoing findings for social class (Bukodi, Paskov, and Nolan 2019; Torche 2015;
Erikson and Goldthorpe 1992). These are promising initial results that call for a fuller analysis
using richer, inter-generationally linked administrative data.

4 IFAU -Trends in Absolute Income Mobility in North America and Europe
This paper makes three main contributions to the literature described here. First, we present a
comparative analysis of trends in absolute income mobility across eight high-income countries
using high quality administrative and survey data that require minimal assumptions for the
computation of income mobility rates. Second, we provide the first direct validation of the “copula
and marginals” approximation that is rapidly becoming a standard approach for estimating
absolute mobility in the presence of data limitations (Chetty et al. 2017; Berman 2018; Bönke,
Harnack, and Luthen 2019). Third, we identify drivers of variation in mobility rates across
countries, specifically noting the importance of differences in income inequality, especially the
share of total national income going to young adults.

2 Data and Methods
Because the type, time period, format, and quality of data differ across the countries in our sample,
the data and methods that we use vary somewhat from country to country. Detailed descriptions
of the exact data, methods, and specifications used in each country are provided in online
Appendix 1. The approaches that we use fall into two main categories. For countries where
register data that links children to parents and tracks incomes over time is available—Canada,
Denmark, Finland, the Netherlands, Norway, and Sweden—we calculate absolute mobility
directly. We measure the household incomes of children and their parents when each is age 30.
We then adjust for inflation using each country’s consumer price index, 3 and compute the fraction
of children whose incomes exceed their parents’.
 For the US and the UK, where linked register data are not available, we use the “copula and
marginals” approach introduced by Chetty et al. (2017). This involves constructing a copula, or
parent-child income rank transition matrix, for the subset of the data where linked income
information is available for parents and children. The marginal income distributions for parents
and children for a range of birth cohorts can then be combined with this copula to compute the
overall absolute income mobility rate. This approach does not determine whether any individual
child out-earned his or her parents, but it does provide an accurate estimation of the upward
mobility rate in total, as we show below using data from countries where both linked data and
copulas and marginals are available.

3 The proper way to measure inflation has long been debated (Abraham, Greenlees, and Moulton 1998; Boskin et al.

1997). Challenges include how to account for consumers’ substitution of goods due to changes in price, how to quantify
the benefits of technological advances, and how to create one summary index that is valid for people with a range of
income levels and purchasing habits (Jaravel 2019). While a perfect price index is impossible, governments must
construct some measure of changes in the price level for the purposes of macroeconomic policymaking. Those are the
measures that we use here. It is possible that our results may be sensitive to the use of alternative price indexes, and
scholars working in specific countries where multiple price indexes exist may wish to replicate our analysis using
alternative price indexes. Such an analysis for all eight countries is beyond the scope of this paper.

IFAU - Trends in Absolute Income Mobility in North America and Europe 5
With both approaches, we compute a main specification that compares the family incomes of
children (self plus spouse or cohabiting partner) at age 30 with those of their parents at the same
age. We measure parent age using the father in Norway; the head of household (father if available,
mother if not) in Denmark, Finland, the Netherlands, and Sweden; and the parent earning higher
income in Canada, the UK, and the US. Because all of the children in a given cohort were by
definition born in the same year, their incomes are measured in the same year as one another, 30
years later. But since parents vary in the age at which they have children, the parent incomes are
not always measured in the same year as one another.
 The measurement of incomes in one year only means that there will be noise in our results,
but because absolute mobility is evaluated by comparing income levels rather than calculating a
correlation this should not introduce a systematic bias. Additionally, by age 30 income ranks have
largely stabilized (Chetty, Hendren, Kline, and Saez 2014), but earnings have not typically
peaked. To address concerns over these two features of our analysis, in the online Appendix we
include an alternative specification where income is measured at age 40 rather than age 30,
providing a second year of income measurement closer to typical peak earnings.
 We do not normalize by family size in the main specification, but do so in an alternative
specification shown in the online Appendix. We also include a specification that compares the
individual incomes of fathers and sons. Because many countries do not have disposable (post-tax)
income for the full period under study, our primary specification uses pre-tax, post-transfer
income. For the countries where post-tax disposable income is available, we present trends in
upward mobility rates using that measure as well.
 To our knowledge, our sample contains almost all of the countries in which high quality data
on both historical income distributions and relative income mobility currently exist for a
substantial number of birth cohorts. Similar data exist for Germany, and have been used to
estimate trends in absolute income mobility there (Bönke, Harnack, and Luthen 2019;
Stockhausen 2018). Historical income data are available that would allow computation of
mobility rates for Japan for the 1970 birth cohort, but there is not linked data to create a copula,
and the marginal income distributions for parents and children in that cohort are sufficiently
overlapping that knowing the copula is necessary for precise estimation. Similarly, historical data
on income distributions by age exist for France (Garbinti, Goupille-Lebret, and Piketty 2018), but
linked parent-child records do not. Many other countries are currently creating datasets, through
longitudinal surveys or linked administrative records, that will allow this sort of analysis in the
future. These include Australia (Deutscher 2018), New Zealand (Laws, Gemmell, and Creedy
2014), and Singapore (Yip 2012). However, the great length of time necessary for a direct
comparison—roughly 30 years between children and parents to directly calculate absolute

6 IFAU -Trends in Absolute Income Mobility in North America and Europe
mobility for one cohort, and longer to establish any sort of trend across cohorts—means that such
datasets are not yet usable for the analysis we conduct here.

3 Results

3.1 Trends in Absolute Income Mobility
Figure 1 presents trends in absolute mobility in pre-tax, post-transfer income by birth cohort for
the countries included in this study. Because of data limitations, not all countries have estimates
for all cohorts. The US series goes back to the 1940 birth cohort, while most European countries
begin in the 1960s. Data for Canada only exist for the 1976-84 birth cohorts, and for the
Netherlands we focus on the 1973-84 cohorts. For ease of comparison, we show results starting
in 1960, the first year for which non-US data are available.

 Figure 1 Estimates of upward absolute income mobility by country and birth cohort

Notes: The upward mobility rate is calculated as the percentage of children in each birth cohort whose pre-tax, post-transfer family
income at age 30, adjusted for inflation, was higher than their parents’ family income at age 30. Incomes are measured using a
combination of register and survey data in each country, as described in online Appendix 1.

A few takeaways stand out in Figure 1. First, there is substantial variation across the eight
countries in the rates of upward mobility experienced by recent cohorts. At the top end, recent
cohorts of Norwegians have experienced upward mobility rates of roughly 75%, while cohorts
born before 1980 in the Netherlands saw upward mobility rates approaching 80%. Finland,

IFAU - Trends in Absolute Income Mobility in North America and Europe 7
Sweden, and the UK all have recent values over 65%, well above recent US levels. Only Canada
and Denmark have recent upward mobility rates comparable to those in the United States.
 A second pattern in Figure 1 is the different mobility trends that countries have seen over time.
The United States is not alone in seeing mobility declines for recent cohorts: Denmark, the
Netherlands, and the UK have all seen drops of 10 percentage points or more from their peak
mobility rates. However, the bulk of the mobility decline in these countries dates roughly to the
onset of the Great Recession (the 1977 cohort turned 30 and had their adult incomes measured in
2007), while the US decline began much earlier. In very recent years upward mobility in the US
has increased slightly, perhaps capturing the start of recovery after the Recession.
 The case of Denmark is particularly striking in contrast to the other Nordic countries: after a
very sharp decline over the previous five cohorts, upward mobility for the 1982 birth cohort was
only 50%, the lowest of any country in our sample. Much of this difference appears to be due to
our use of pre-tax, post-transfer income in the baseline specification. As shown in online
Appendix Figure A2.1, mobility rates for Denmark estimated using post-tax, post-transfer
disposable income remain above 65% for the entire sample period, showing only about a five
percentage point decline from their peak. Disposable income is a superior measure of true
standards of living, but is only available for a subset of the countries in our sample.
 The large difference between Danish trends using pre- and post-tax income suggests that tax
policy may be a particularly important part of the Danish welfare state. This is consistent with
results from Landersø and Heckman (2017), who found that pre-tax relative income mobility in
Denmark is comparable to that in the United States, but that post-tax relative income mobility is
much higher. Among the other countries where disposable income is available, upward mobility
in post-tax income is roughly 10 percentage points higher than in pre-tax income in Sweden, 5
percentage points higher in the UK and the US, and 2 percentage points higher in Canada,
although trends over time in these countries do not change much with the income measures. This
suggests that the tax system itself, independent of transfer programs, meaningfully increases
upward mobility in Denmark and Sweden and increases it somewhat in the UK, the US, and
Canada.
 Beyond the inclusion of taxes, we conduct several alternative specifications to explore the
drivers of our results, which are shown in online Appendix 2. Not all specifications were possible
to conduct in all countries. First, we conduct a version of the analysis where income is measured
at age 40 rather than age 30. This analysis allows for the possibility that more recent birth cohorts
may be taking longer to reach full earnings potential than previous cohorts were. Results are
shown in Figure A2.2. In Sweden and Norway, upward mobility rates measured at age 40 were
5-10 percentage points higher than mobility rates for the same cohorts at age 30, while in the US,

8 IFAU -Trends in Absolute Income Mobility in North America and Europe
the UK, and the Netherlands mobility rates were 5-15 points lower when measured at age 40. In
Denmark and Finland mobility rates were similar at both ages.
 Some of the difference between mobility rates at age 30 and age 40, particularly in Sweden
and the UK, appears to be due to different cohorts being impacted by the same macroeconomic
shocks at different ages. In Sweden, for instance, there is a drop in age-40 mobility rates for the
1953-57 cohorts that parallels that in age-30 mobility rates for the 1963-1966 cohorts. In both
cases, the adult incomes of children were measured in the early 1990s, during a major recession.
This suggests that the business cycle, and period effects in general, may have a large impact on
rates of absolute mobility. Such an impact makes sense given the importance of marginal income
distributions for absolute mobility, but differs markedly from the impact on relative mobility rates,
which have been found to be fairly stable from year to year (Chetty, Hendren, Kline, Saez, et al.
2014; Lee and Solon 2009; but see Harding and Munk 2020).
 As a second alternative specification, we analyze mobility after normalizing income by the
number of adults in each family. In practice this means dividing total income by two for couples,
while leaving income for singles unchanged. This specification accounts for the possibility that
changing total incomes may be due to changing family structures, rather than changes in the
earnings patterns of individuals. For instance, if members of younger cohorts remain single at
higher rates than older cohorts, their total family incomes may be lower simply because there are
fewer household members. As shown in Figure A2.3, in all countries and cohorts where this
normalization is possible, upward mobility using the normalized income measure is 8-17
percentage points higher than baseline. This suggests that changes in family structure do result in
lower family incomes for recent cohorts than would pertain if family structure had remained as it
was for these cohorts’ parents.
 Third, we conduct an analysis comparing the individual incomes of fathers and sons rather
than total family income. This comparison isolates the mobility patterns due to earnings trends
among men alone from those due to changes in family income from changing labor force
participation or earnings among women. Results are shown in Figure A2.4. In Canada, Denmark,
Norway, Sweden, and the UK, upward mobility rates for sons compared to fathers are similar to
those using total family income, although the dips in mobility associated with the early 1990s
recession in Sweden and the global financial crisis in the UK are steeper when looking at father-
son mobility. In the Netherlands and the US, upward mobility rates for sons alone are consistently
10-20 percentage points lower than those using total family income. In the Netherlands, this likely
reflects the massive increase in female labor force participation since the 1970s, by far the largest
in the OECD (Olivetti and Petrongolo 2017). In the US it may reflect the faster than average

IFAU - Trends in Absolute Income Mobility in North America and Europe 9
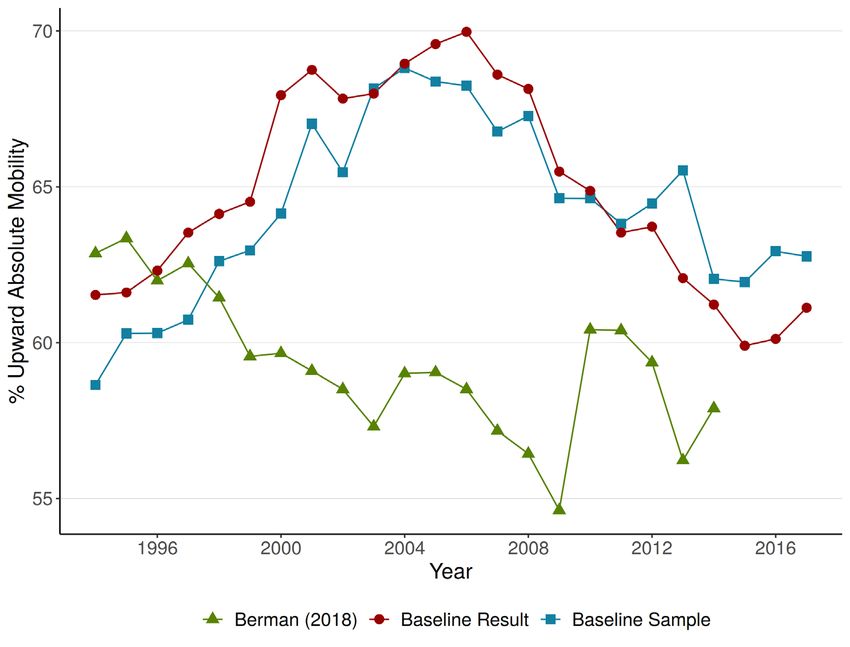
decline in male labor force participation over this same period (Krause and Sawhill 2017) or the
partial closing of the gender earnings gap (Blau and Kahn 2017).
 Taken together, the alternate specifications broadly conform to the baseline results in terms of
the relative position of the different countries and trends over time. But the variation across
specifications highlights important differences between countries in terms of political economy,
age, and gender. The results using disposable income highlight the importance of the tax code as
a means of increasing mobility in Denmark and Sweden, as opposed to Canada, the US, and the
UK. Results using incomes at age 40 suggest that changes from parents to children in the age-
earnings profile may be largest in Norway and Sweden, while results using the individual incomes
of fathers and sons suggest that earnings growth among women may be especially important in
driving the results for the Netherlands and the United States.
 In online Appendix 3 we present a detailed comparison of our results with those of Berman
(2018). The upward mobility rates we calculate for recent cohorts roughly align with Berman’s
estimates in most countries, but differ in the UK and Denmark by as much as 10 to 15 percentage
points. Additionally, we find stability in absolute mobility rates over time in several countries
where Berman reports downward trends. Where differences exist, they appear to be due to
differences in the data used rather than differences in methods—specifically, the fact that we
measure incomes for 30-year-old parents and children directly, while he uses income data for the
entire population. Because younger workers tend to be more affected by changes to the
macroeconomic climate than older workers (Hoynes, Miller, and Schaller 2012), and because
incomes of parents may differ systematically from incomes of non-parents of similar age, trends
in the full income distribution are in some cases not an accurate proxy for trends in the earnings
of young adults.

3.2 Validation of the Copula and Marginals Approach
Chetty et al. (2017) proposed that overall rates of absolute mobility can be accurately calculated
without linked panel data, by combining data on the marginal income distributions of children
and parents with the copula, or parent-child rank transition matrix. This approach draws on Sklar’s
Theorem (Sklar 1959), which showed that any multivariate distribution can be expressed in terms
of marginal distributions and a copula. Because of its much lower data requirements and its ability
to incorporate data from multiple sources, the “copula and marginals” approach is becoming
widely used in studies of absolute income mobility (e.g. Berman 2018; Bönke, Harnack, and
Luthen 2019).
 While the logic behind this approach is compelling, it has never been validated through a direct
comparison of absolute mobility rates calculated using the copula and marginals approach and
those using the true, linked records approach on the same data. We conduct such a comparison

10 IFAU -Trends in Absolute Income Mobility in North America and Europe
here. For five of the countries in our sample—Canada, Denmark, Finland, Norway, and Sweden—
we can both calculate the upward mobility rate directly from linked data and produce copulas and
marginal distributions. By comparing estimates constructed using the copula and marginals to
those constructed from linked data we are able to determine whether the former is a reasonable
approximation of the latter.
 For each country, we produce a copula for the most recent birth cohort in the data. In Norway
and Sweden we combine multiple birth cohorts to increase the observation counts within each
percentile cell. This parallels the methodology of Chetty et al. (2017), who used a copula
constructed from the 1980-82 birth cohorts for the entire analysis. Following the procedure
described by Chetty et al., when using the copula and marginals approach we calculate the upward
mobility rate for a given cohort by first comparing the mean incomes in every pair of child and
parent percentile cells and determining whether the children in that child cell had higher incomes
than the parents in that parent cell. We then take the average of upward mobility across all parent
and child cell pairs, weighting by the probability from the copula that children with parents in that
parent cell grew up to have incomes placing them in that child cell.

 Figure 2 Validation of the “copula and marginals” approach for estimating absolute income mobility

Notes: This figure compares estimates of absolute income mobility using linked records with those using the “copula and marginals”
approach introduced by Chetty et al. (2017) for the five countries in our sample where both methods are possible. Copula and marginals
estimates are constructed by computing child and parent marginal income distributions at age 30 for each birth cohort in each country,
and combining them with the parent-child income rank transition matrix constructed based on linked parent-child records for the most
recent available cohort in each country. Linked records estimates are computed as in the baseline results except for Denmark, where
non-age matched records are used (see online Appendix 1.2), resulting in a mobility trend for Denmark that differs somewhat from
that shown in Figure 1. Across all countries and birth cohorts, estimates with the two methods match within 1.4 percentage points.

IFAU - Trends in Absolute Income Mobility in North America and Europe 11
Figure 2 compares upward mobility rates calculated using the copula and marginals and linked
records approaches in each country. The results largely confirm that the copula and marginals
approach is an effective approximation of the true, linked record method of estimating absolute
income mobility. Across all cohorts in all five countries, the copula and marginals estimates are
always within 1.4 percentage points of the true value, even though upward mobility rates varied
by approximately 18 percentage points in Denmark, 14 percentage points in Sweden, 6 percentage
points in Norway, and 4 percentage points in Finland over our sample period. The largest
deviations from the true value, especially in Finland, Norway, and to a lesser extent Denmark,
occur for the cohorts most removed from those in the copula, but across all cohorts the differences
between the two methods are always small relative to the overall trends. This exercise suggests
that the copula and marginals approach is an effective way to estimate rates of absolute mobility
when linked panel data are unavailable.

3.3 What Explains Variation in Upward Mobility?
Why have countries like Norway and Finland maintained high levels of upward absolute mobility
for generations, while countries as diverse as Denmark (in pre-tax income), Canada, and the
United States have seen much lower rates? To answer this question, we conduct a series of
counterfactual exercises to decompose the differences between high- and low-mobility countries.
Here we present results comparing the low mobility countries of Canada, Denmark, and the US
to Norway, which had the highest rate of upward mobility in our sample.
 Using the copula and marginals approach, the absolute mobility rate of a given cohort in a
given country can be fully accounted for by four components: the copula, the ratio of mean income
in the child generation to mean income in the parent generation, and the shape of the income
distribution (that is, the level of inequality) in a) the parent and b) the child generations (Liss,
Korpi, and Wennberg 2019; Van Kerm 2004).
 To determine the source of differences in mobility rates between high- and low-mobility
countries, we run simulations for the 1983 birth cohort in which we substitute each of these
components from our low mobility countries with the equivalent component from Norway. For
greater interpretability, we further decompose the ratio of mean child to mean parent income into
two components: the overall growth rate of real Gross Domestic Product (GDP) per capita from
1983-2013 and the ratio of growth in mean income from parents to children in our sample to
growth in GDP. We use GDP per capita values in constant local currency units sourced from the
World Bank national accounts data (World Bank 2019). In Appendix 4, we show that the
cumulative substitution of all five of these components—the copula, GDP growth rate, sample
income growth to GDP growth ratio, inequality among parents, and inequality among children—
perfectly accounts for the difference between mobility rates in any two countries.

12 IFAU -Trends in Absolute Income Mobility in North America and Europe
We first consider differences in the rate of relative mobility, as captured by the copula. It is
well known that rates of relative income mobility are much higher in Scandinavia than in the
United States (Corak 2006; Smeeding, Erikson, and Jäntti 2011; Bratberg et al. 2017). In our
sample, 25.4% of US children born in the early 1980s ended up within 10 percentile ranks of
their parents, compared to 20.1% of Norwegian children. US children were thus 26% more likely
than their Norwegian counterparts to grow up to occupy a position in the income distribution
similar to that of their parents.
 To determine whether rates of relative mobility are an important driver of differences in
absolute mobility across countries, we run simulations replacing the US, Canadian, and Danish
copulas with that from Norway. As shown in the first column of Figure 3, doing this hardly alters
rates of absolute mobility at all. This is perhaps unsurprising in the cases of Canada and Denmark,
which have relative mobility rates comparable to Norway’s, but even in the United States there is
no difference—in fact, the higher relative mobility of the Norwegian copula actually lowers the
absolute mobility rate slightly, conforming to the result that absolute and relative mobility are
inversely correlated when other variables are held constant (Berman 2018).

 Figure 3 Decomposition of cross-country differences in absolute mobility

Notes: This figure shows results from counterfactual simulations decomposing the difference in upward mobility rates between three
low-mobility countries and Norway for the 1983 birth cohort (1982 in Denmark). As shown in Figure 1, upward mobility in Norway
for the 1983 birth cohort was roughly 20 percentage points higher than for the same cohort in the US and Canada, or for the 1982
cohort in Denmark (the most recent available). To determine the source of this difference, upward mobility is calculated using the
“copula and marginals” decomposition approach. Simulations are run replacing the copula, GDP growth rate, within-sample income
distribution, and ratio of mean sample income growth from parents to children to GDP growth of each low-mobility country with
those of Norway. Bars indicate the fraction of the total gap with Norway that is closed in each simulation.

IFAU - Trends in Absolute Income Mobility in North America and Europe 13
If differences in relative mobility do not account for national variation in upward absolute
mobility, the variation must be due to features of the marginal distributions. The remaining
columns of Figure 3 explore three aspects of the child marginal income distribution. The second
column for each country considers a scenario where that country experienced the Norwegian GDP
growth rate from 1983-2013. Real GDP per capita in Norway grew by 1.86% a year during this
period, compared to GDP growth of 1.80% annually in the US, 1.50% in Canada, and 1.49% in
Denmark. This scenario is implemented by multiplying the income for every percentile of the
child distribution in each low mobility country by the ratio of total Norwegian GDP growth from
1983-2013 to total country GDP growth over that same period. It thus simulates a scenario where
GDP grew more quickly during the children’s lives but was distributed exactly as in reality. As
shown in the figure, faster GDP growth would not make much difference for the United States,
but would close about a quarter of the gap for Canada and Denmark.
 The third column considers a scenario where the total size of the economy stays the same but
the income distribution among 30 year old children in Norway is applied to the country of interest.
This “within-cohort inequality” scenario is constructed by taking the ratio of income at each child
percentile to overall mean child income in Norway and multiplying that by the mean child income
in the country of interest. As with GDP, the importance of within-cohort inequality varies
substantially across the three countries considered. In the US, this scenario closes almost half of
the mobility gap with Norway, while in Denmark it closes just 1% of the gap.
 The final column considers a “between-cohort inequality” scenario, where the ratio of growth
in mean income from parents to children in our sample to GDP growth in Norway is applied to
observed GDP growth in each of the low-mobility countries. We interpret this primarily as a
measure of changing inequality between age groups, capturing the extent to which mean incomes
for 30-year-olds kept up with GDP. It could also reflect measurement error if the total fraction of
GDP captured by our data sources changed over time. Such a change could be due to increasing
non-response rates in survey data (for a discussion of this issue in the US context, see Bollinger
et al. 2019), or due to changes in the composition of income that affect the percentage of GDP
subject to taxation and thus inclusion in register data. 4
 For all three countries, the between-cohort inequality scenario accounts for the single largest
proportion of the gap with Norway, and for Denmark it accounts for roughly 75%. Thus the
biggest source of difference has to do with increasing inequality across cohorts: mean incomes

4 Note that to the extent that results for the “between-cohort inequality” scenario are driven by increases in nonresponse
bias rather than truly growing inequality across cohorts, the child income distribution used in the “within-cohort
inequality” scenario will likely understate the true level of within-cohort inequality, since nonresponse tends to be
concentrated at the extremes (Bollinger et al. 2019). Thus the amount of the mobility gap attributable to within- and
between-cohort inequality combined is likely to be similar to what we report, although the allocation between the two
scenarios might be affected by measurement error.

14 IFAU -Trends in Absolute Income Mobility in North America and Europe
for 30-year-olds did a much better job of keeping pace with overall economic growth in high-
mobility countries than in low-mobility ones. For example, for the 1983 cohort in the US, the
growth rate from mean parent income to mean child income in our sample was only 71% of the
GDP growth rate over the same period, while in Norway the sample income grew 95% as fast as
GDP. In the United States, the remainder of the gap is accounted for by within-cohort inequality:
the richest 30-year-olds take home a much larger share of their cohort’s total income than in
Norway. For Denmark, low GDP growth accounts for the remainder. For Canada it is some of
each. Results comparing the low mobility countries to Sweden and Finland are presented in online
Appendix 5 and are similar to those for Norway.

4 Discussion
In this paper we have directly calculated absolute income mobility rates for a selection of
countries in North America and Europe. We have shown that there is a substantial amount of
variation in upward mobility across countries, both in current levels and in trends over time. The
US pattern of sharply declining upward mobility in recent decades is by no means a universal
trend. Some countries, most notably Finland and Norway, have had high and steady rates of
upward mobility for cohorts born as far back as the mid-1960s. Other countries, notably Denmark,
the Netherlands, and the UK, maintained high mobility rates longer than the US, but have seen
declining mobility for cohorts that experienced the brunt of the Great Recession.
 For all of the countries except the US and the UK, we calculated mobility rates by directly
comparing linked parent and child income data. Our estimates thus represent a ground truth
against which other methods of inferring absolute mobility can be evaluated. For five of the
countries in our sample—Canada, Denmark, Finland, Norway, and Sweden—we have shown that
mobility rates calculated with the “copula and marginals” approach introduced by Chetty et al.
(2017) very closely track those calculated directly from linked records, suggesting that the copula
and marginals approach is in fact an accurate approximation of true absolute income mobility.
This is promising for a range of popular applications that frequently cannot be validated directly,
such as microsimulations and synthetic panels (Deaton 1985; Bourguignon and Spadaro 2006).
 Through decomposition analyses, we have shown that the higher relative mobility of
Scandinavian countries contributes very little to their high absolute mobility rates. Compared to
the United States, their success in upward mobility is due not to faster economic growth, but to
their more egalitarian income distributions, both across and within cohorts. US GDP grew almost
as fast as Norway’s, and faster than Sweden’s, during the lifetimes of our most recent cohorts.
But Norway, Sweden, and Finland were much more efficient in translating that growth in total
production into increased standards of living for their residents. Low pre-tax mobility in Denmark,

IFAU - Trends in Absolute Income Mobility in North America and Europe 15
on the other hand, is due to slower GDP growth than its neighbors and especially to the divergence
between overall GDP growth and growth in the incomes being earned by 30-year-olds. Canada
falls somewhere in the middle.
 The idea that living standards should rise from one generation to the next is a core implicit
promise of the market economy. When countries fall short of that promise, they are often beset
with frustration and instability (Friedman 2005). In this paper we have shown that developed
nations vary dramatically in the extent to which they live up to that promise, and have explored
some of the drivers of that variation. Our findings highlight the contingent nature of absolute
income mobility. To achieve and sustain high rates of upward mobility, countries need economic
institutions capable of both encouraging strong economic growth and distributing that growth to
all of their citizens. Encouragingly, there exist several examples of countries that have managed
exactly that.

16 IFAU -Trends in Absolute Income Mobility in North America and Europe
References
Abraham, Katharine G., John S. Greenlees, and Brent R. Moulton. 1998. “Working to Improve
 the Consumer Price Index.” Journal of Economic Perspectives 12 (1): 27–36.

Amiel, Yoram, and Frank Cowell. 1999. Thinking about Inequality: Personal Judgment and
 Income Distributions. Cambridge University Press.

Berman, Yonatan. 2018. “The Long Run Evolution of Absolute Intergenerational Mobility,” 58.

Blau, Francine D., and Lawrence M. Kahn. 2017. “The Gender Wage Gap: Extent, Trends, and
 Explanations.” Journal of Economic Literature 55 (3): 789–865.

Bollinger, Christopher R., Barry T. Hirsch, Charles M. Hokayem, and James P. Ziliak. 2019.
 “Trouble in the Tails? What We Know about Earnings Nonresponse 30 Years after Lillard,
 Smith, and Welch.” Journal of Political Economy 127 (5): 2143–85.
 https://doi.org/10.1086/701807.

Bönke, Timm, Astrid Harnack, and Holger Luthen. 2019. “Are Children Better off?
 Intergenerational Mobility of Living Standards,” 22.

Boskin, Michael J., Ellen R. Dulberger, Robert J. Gordon, Zvi Griliches, and Dale W. Jorgenson.
 1997. “The CPI Commission: Findings and Recommendations.” The American Economic
 Review 87 (2): 78–83.

Bourguignon, François, and Amedeo Spadaro. 2006. “Microsimulation as a Tool for Evaluating
 Redistribution Policies.” The Journal of Economic Inequality 4 (1): 77–106.

Bratberg, Espen, Jonathan Davis, Bhashkar Mazumder, Martin Nybom, Daniel D. Schnitzlein,
 and Kjell Vaage. 2017. “A Comparison of Intergenerational Mobility Curves in Germany,
 Norway, Sweden, and the US.” The Scandinavian Journal of Economics 119 (1): 72–101.

Bukodi, Erzsébet, Marii Paskov, and Brian Nolan. 2019. “Intergenerational Class Mobility in
 Europe: A New Account.” Social Forces, April. https://doi.org/10.1093/sf/soz026.

Chetty, Raj, David Grusky, Maximilian Hell, Nathaniel Hendren, Robert Manduca, and Jimmy
 Narang. 2017. “The Fading American Dream: Trends in Absolute Income Mobility since
 1940.” Science 356 (6336): 398–406. https://doi.org/10.1126/science.aal4617.

Chetty, Raj, Nathaniel Hendren, Patrick Kline, and Emmanuel Saez. 2014. “Where Is the Land
 of Opportunity? The Geography of Intergenerational Mobility in the United States.” The
 Quarterly Journal of Economics 129 (4): 1553–1623. https://doi.org/10.1093/qje/qju022.

IFAU - Trends in Absolute Income Mobility in North America and Europe 17
Chetty, Raj, Nathaniel Hendren, Patrick Kline, Emmanuel Saez, and Nicholas Turner. 2014. “Is
 the United States Still a Land of Opportunity? Recent Trends in Intergenerational Mobility.”
 American Economic Review Papers and Proceedings 104 (5): 141–47.

Corak, Miles. 2006. “Do Poor Children Become Poor Adults? Lessons from a Cross-Country
 Comparison of Generational Earnings Mobility.” In Dynamics of Inequality and Poverty, 143–
 188. Emerald Group Publishing Limited.

———. 2016. “Inequality from Generation to Generation: The United States in Comparison.”
 9929. IZA Discussion Papers. IZA. http://ftp.iza.org/dp9929.pdf.

Deaton, Angus. 1985. “Panel Data from Time Series of Cross-Sections.” Journal of Econometrics
 30 (1–2): 109–126.

Deutscher, Nathan. 2018. “Place, Jobs, Peers and the Importance of the Teenage Years: Exposure
 Effects and Intergenerational Mobility.” Canberra: Australian National University.

Erikson, Robert, and John H. Goldthorpe. 1992. The Constant Flux: A Study of Class Mobility in
 Industrial Societies. Oxford University Press, USA.

Esping-Andersen, Gosta. 2013. The Three Worlds of Welfare Capitalism. John Wiley & Sons.

Friedman, Benjamin M. 2005. The Moral Consequences of Economic Growth. Vol. 43. New
 York: Alfred A. Knopf.

Garbinti, Bertrand, Jonathan Goupille-Lebret, and Thomas Piketty. 2018. “Income Inequality in
 France, 1900–2014: Evidence from Distributional National Accounts (DINA).” Journal of
 Public Economics 162: 63–77.

Harding, David J, and Martin D Munk. 2020. “The Decline of Intergenerational Income Mobility
 in Denmark: Returns to Education, Demographic Change, and Labor Market Experience.”
 Social Forces 98 (4): 1436–64. https://doi.org/10.1093/sf/soz108.

Hoynes, Hilary, Douglas L Miller, and Jessamyn Schaller. 2012. “Who Suffers During
 Recessions?” Journal of Economic Perspectives 26 (3): 27–48.
 https://doi.org/10.1257/jep.26.3.27.

Jäntti, Markus, and Stephen P. Jenkins. 2015. “Chapter 10 - Income Mobility.” In Handbook of
 Income Distribution, edited by François Bourguignon and Anthony B. Atkinson, 2:807–935.
 Handbook of Income Distribution. Elsevier.

Jaravel, Xavier. 2019. “The Unequal Gains from Product Innovations: Evidence from the U.S.
 Retail Sector.” Quarterly Journal of Economics 134 (2): 715–83.

18 IFAU -Trends in Absolute Income Mobility in North America and Europe
Krause, Eleanor, and Isabel Sawhill. 2017. “What We Know and Don’t Know about Declining
 Labor Force Participation: A Review.” Washington DC: Brookings Institution.

Landersø, Rasmus, and James J. Heckman. 2017. “The Scandinavian Fantasy: The Sources of
 Intergenerational Mobility in Denmark and the US.” The Scandinavian Journal of Economics
 119 (1): 178–230. https://doi.org/10.1111/sjoe.12219.

Laws, Athene, Norman Gemmell, and John Creedy. 2014. “Income Mobility and Income
 Inequality in New Zealand: Trends, Patterns and Relationships.” In Annual Conference of the
 New Zealand Association of Economists (Wellington: NZAE, 2 July 2015).

Lee, Chul-In, and Gary Solon. 2009. “Trends in Intergenerational Income Mobility.” The Review
 of Economics and Statistics 91 (4): 766–772.

Liss, Erik, Martin Korpi, and Karl Wennberg. 2019. “The American Dream Lives in Sweden:
 Trends in Intergenerational Absolute Income Mobility.” 325. Ratio Working Papers. Ratio.

Olivetti, Claudia, and Barbara Petrongolo. 2017. “The Economic Consequences of Family
 Policies: Lessons from a Century of Legislation in High-Income Countries.” Journal of
 Economic Perspectives 31 (1): 205–30.

Ostrovsky, Yuri. 2017. “Doing as Well as One’s Parents? Tracking Recent Changes in Absolute
 Income Mobility in Canada.” Statistics Canada. http://www.statcan.gc.ca/pub/11-626-x/11-
 626-x2017073-eng.htm.

Piketty, Thomas, Emmanuel Saez, and Gabriel Zucman. 2017. “Distributional National Accounts:
 Methods and Estimates for the United States.” Quarterly Journal of Economics 133 (2): 553–
 609.

Ravallion, Martin. 2018. “Inequality and Globalization: A Review Essay.” Journal of Economic
 Literature 56 (2): 620–42.

Sklar, Abe. 1959. “Fonctions de repartition an dimensions et leurs marges.” Publ. inst. statist.
 univ. Paris 8: 229–231.

Smeeding, Timothy M., Robert Erikson, and Markus Jäntti, eds. 2011. Persistence, Privilege, and
 Parenting: The Comparative Study of Intergenerational Mobility. Russell Sage Foundation.

Stockhausen, Maximilian. 2018. “Like Father, Like Son?–A Comparison of Absolute and
 Relative Intergenerational Labour Income Mobility in Germany and the US.” 989. SOEP
 Papers on Multidisciplinary Panel Data Research. DIW Berlin.

IFAU - Trends in Absolute Income Mobility in North America and Europe 19
Torche, Florencia. 2015. “Analyses of Intergenerational Mobility: An Interdisciplinary Review.”
 The ANNALS of the American Academy of Political and Social Science 657 (1): 37–62.

Van Kerm, Philippe. 2004. “What Lies behind Income Mobility? Reranking and Distributional
 Change in Belgium, Western Germany and the USA.” Economica 71 (282): 223–39.

World Bank. 2019. “World Bank National Accounts Data.” 2019.
 https://data.worldbank.org/indicator/NY.GDP.MKTP.CD.

Yip, Chun Seng. 2012. “Intergenerational Income Mobility in Singapore.” Singapore: Singapore
 Ministry of Finance.

20 IFAU -Trends in Absolute Income Mobility in North America and Europe
Appendix for: “Trends in Absolute Income Mobility in North
 America and Europe”

By ROBERT MANDUCA,* MAXIMILIAN HELL, ADRIAN ADERMON, JO BLANDEN,
ESPEN BRATBERG, ANNE C. GIELEN, HANS VAN KIPPERSLUIS, KEUN BOK LEE,
 STEPHEN MACHIN, MARTIN D. MUNK, MARTIN NYBOM, YURI OSTROVSKY,
 SUMAIYA RAHMAN, AND OUTI SIRNIÖ

* Email: rmanduca@umich.edu
Appendix 1. Detailed Methodology by Country

A1.1: Canada

Intergenerational Income Database (IID).—The IID is a linked administrative
database composed of two main components. The first component is the Family
File (FF) in which children who were aged 16 to 19 in 1982, 1984, 1986, 1991,
1996 and 2001 were matched with their parents. The calendar years in which the
children were 16 to 19 (i.e., 1982, 1984, etc.) are known as IID cohort years or IID
cohorts. The birth years of children in the IID range from 1963 (19 in 1982) to 1985
(16 in 2001).
 Table A1.1.1 shows the structure of FF and several hypothetical examples. Each
observation in the Family File is uniquely identified by the child’s case number.
Different children, however, can have the same parent or both parents.

 TABLE A1.1.1 INTERGENERATIONAL INCOME DATABASE FAMILY FILE STRUCTURE, CANADA

 Observation Child’s case number Mother’s case number Father’s case number
 1 A’s case number A’s mother’s case number A’s father’s case number
 2 B’s case number … (no mother present) B’s father’s case number
 3 C’s case number C’s mother’s case number … (no father present)
 … … … …
 Notes: This table presents hypothetical examples of file structure in the Canadian Intergenerational Income
 Database.

 An important concept in the IID is the “link year.” This is the year in which
children were linked to their parents. For most children, the link year is the same as
the cohort year. However, in order to improve the IID coverage and reduce the
scope of a sample selection, establishing the link between children and their parents
was attempted in several subsequent years. For example, most children from the
1982 cohort were linked to their parents using 1982 administrative data. For
children who could not be linked to their parents in 1982, an attempt was made to
link them in 1983, 1984, 1985 or 1986. The link year in this case is the year between
1982 and 1987 in which the first successful link was established.
 The family structure in the Family File represents the family structure in the link
year. There is no information on whether the mother and the father are biological
parents. Stepparents are deemed to be parents.
 The second main component of the IID is the annual T1 files (information from
individual tax returns). 1 For the 1982, 1984 and 1986 cohorts, T1 files are available
from 1978 to 2014. 2 For the 1991, 1996 and 2001 cohorts, T1 files are available
from 1981 to 2014. Each T1 file contains unique individual identifies (case
numbers), so that each individual in the Family File—a parent or a child—can be
linked to his or her tax return records in year t if they filed a tax return in that year.
Not all variables are available for all years; changes in the variables availability
reflect primarily changes in the tax code.

Weights.—Certain criteria have to be satisfied for a child 16 to 19 to be selected
into the IID: the child had to have a Social Insurance Number, live with his or her
parents, and the parents had to file a tax return at least once during the 5-year
linkage window. In each cohort, only about two thirds of all children 16 to 19 satisfy
all three criteria; therefore the size of an IID cohort is about two thirds of the total
population of 16- to 19-year-olds. A set of weights was developed by Statistics
Canada methodologists to account for underreporting of income among low-
income individuals and to make the IID representative of the population. The
weights are used in all computations related to absolute mobility rates.

Family unit.—The family unit in the IID consists of only parents and their children.
This definition is consistent with the Census data definition of the “census family.”

 1
 The Canadian T1 form is roughly similar to the 1040 IRS form in the United States.
 2
 At the time of writing.
You can also read