Deep maxima of phytoplankton biomass, primary production and bacterial production in the Mediterranean Sea - OceanRep
←
→
Page content transcription
If your browser does not render page correctly, please read the page content below
Biogeosciences, 18, 1749–1767, 2021
https://doi.org/10.5194/bg-18-1749-2021
© Author(s) 2021. This work is distributed under
the Creative Commons Attribution 4.0 License.

Deep maxima of phytoplankton biomass, primary production
and bacterial production in the Mediterranean Sea
Emilio Marañón1 , France Van Wambeke2 , Julia Uitz3 , Emmanuel S. Boss4 , Céline Dimier3 , Julie Dinasquet5 ,
Anja Engel6 , Nils Haëntjens4 , María Pérez-Lorenzo1 , Vincent Taillandier3 , and Birthe Zäncker6,7
1 Department   of Ecology and Animal Biology, Universidade de Vigo, 36310 Vigo, Spain
2 Mediterranean   Institute of Oceanography, Aix-Marseille Université, CNRS,
Université de Toulon, CNRS, IRD, MIO UM 110, 13288 Marseille, France
3 Laboratoire d’Océanographie de Villefranche, Sorbonne Université, CNRS, 06230 Villefranche-sur-Mer, France
4 School of Marine Sciences, University of Maine, Orono, Maine, USA
5 Scripps Institution of Oceanography, University of California, San Diego, San Diego, California, USA
6 GEOMAR, Helmholtz Centre for Ocean Research Kiel, 24105 Kiel, Germany
7 The Marine Biological Association of the United Kingdom, Plymouth, PL1 2PB, United Kingdom

Correspondence: Emilio Marañón (em@uvigo.es)

Received: 7 July 2020 – Discussion started: 20 July 2020
Revised: 5 December 2020 – Accepted: 8 February 2021 – Published: 15 March 2021

Abstract. The deep chlorophyll maximum (DCM) is a ubiq-            10–15 mg C m−3 at the DCM. As a result of photoacclima-
uitous feature of phytoplankton vertical distribution in strati-   tion, there was an uncoupling between chlorophyll a-specific
fied waters that is relevant to our understanding of the mech-     and carbon-specific productivity across the euphotic layer.
anisms that underpin the variability in photoautotroph eco-        The ratio of fucoxanthin to total chlorophyll a increased
physiology across environmental gradients and has impli-           markedly with depth, suggesting an increased contribution
cations for remote sensing of aquatic productivity. During         of diatoms at the DCM. The increased biomass and carbon
the PEACETIME (Process studies at the air-sea interface af-        fixation at the base of the euphotic zone was associated with
ter dust deposition in the Mediterranean Sea) cruise, carried      enhanced rates of heterotrophic prokaryotic activity, which
out from 10 May to 11 June 2017, we obtained 23 concur-            also showed a surface peak linked with warmer temperatures.
rent vertical profiles of phytoplankton chlorophyll a, carbon      Considering the phytoplankton biomass and turnover rates
biomass and primary production, as well as heterotrophic           measured at the DCM, nutrient diffusive fluxes across the nu-
prokaryotic production, in the western and central Mediter-        tricline were able to supply only a minor fraction of the pho-
ranean basins. Our main aims were to quantify the relative         toautotroph nitrogen and phosphorus requirements. Thus the
role of photoacclimation and enhanced growth as underly-           deep maxima in biomass and primary production were not
ing mechanisms of the DCM and to assess the trophic cou-           fuelled by new nutrients but likely resulted from cell sink-
pling between phytoplankton and heterotrophic prokaryotic          ing from the upper layers in combination with the high pho-
production. We found that the DCM coincided with a max-            tosynthetic efficiency of a diatom-rich, low-light acclimated
imum in both the biomass and primary production but not            community largely sustained by regenerated nutrients. Fur-
in the growth rate of phytoplankton, which averaged 0.3 d−1        ther studies with increased temporal and spatial resolution
and was relatively constant across the euphotic layer. Pho-        will be required to ascertain if the peaks of deep primary pro-
toacclimation explained most of the increased chlorophyll a        duction associated with the DCM persist across the western
at the DCM, as the ratio of carbon to chlorophyll a (C : Chl a)    and central Mediterranean Sea throughout the stratification
decreased from ca. 90–100 (g : g) at the surface to 20–30          season.
at the base of the euphotic layer, while phytoplankton car-
bon biomass increased from ca. 6 mg C m−3 at the surface to

Published by Copernicus Publications on behalf of the European Geosciences Union.
1750                                           E. Marañón et al.: Deep maxima of phytoplankton biomass and production

1   Introduction                                                 maximum that manifests as a peak in beam attenuation or
                                                                 backscattering (Mignot et al., 2014). Both ends of this trophic
One of the most remarkable features of phytoplankton distri-     gradient can be found in the Mediterranean Sea along its
bution in lakes and oceans is the presence of a deep chloro-     well-known longitudinal trend in nutrient availability, phy-
phyll maximum (DCM), typically located at the base of the        toplankton biomass and productivity (Antoine et al., 1995;
euphotic layer and coinciding with the top of the nutricline,    D’Ortenzio and Ribera d’Alcalà, 2009; Lavigne et al., 2015).
which occurs in permanently and seasonally stratified wa-        Using data from Biogeochemical-Argo (BGC-Argo) profil-
ter columns (Herbland and Voituriez, 1979; Cullen, 2015).        ing floats deployed throughout the Mediterranean, Barbieux
Multiple mechanisms that are not mutually exclusive may          et al. (2019) established general patterns in the distribution
contribute to the development of a DCM, including pho-           and seasonal dynamics of biomass (estimated from the par-
toacclimation (the increase in cellular chlorophyll content      ticulate backscattering coefficient) and chlorophyll subsur-
as a response to low-light conditions) (Geider, 1987), en-       face maxima. They found that in the western Mediterranean
hanced growth conditions at the layer where elevated nu-         Sea, during late spring and summer, a subsurface biomass
trient diffusion from below coexists with still sufficient ir-   maximum develops that coincides with a chlorophyll max-
radiance (Beckmann and Hense, 2007), a decrease in sink-         imum and is located roughly at the same depth as the nu-
ing rates near the pycnocline (Lande and Wood, 1987), and        tricline and above the 0.3 mol quanta m−2 d−1 isolume. In
changes in buoyancy regulation or swimming behaviour of          contrast, in the Ionian and Levantine seas the DCM, which
cells (Durham and Stocker, 2012). Photoacclimation is a          has a smaller magnitude, arises solely from photoacclima-
rapid process that takes place in a matter of hours (Fisher      tion and is located well above the nutricline at a depth that
et al., 1996), and therefore part of the increased chloro-       corresponds closely with the 0.3 mol quanta m−2 d−1 isol-
phyll concentration at the DCM is always the result of a de-     ume (Barbieux et al., 2019). The presence of a subsurface
crease in the ratio of phytoplankton carbon to chlorophyll a     or deep biomass maximum may suggest that a particularly
(C : Chl a), which results mainly from decreased irradiance      favourable combination of light and nutrients occurs at that
but is also favoured by enhanced nutrient supply (Geider et      depth, leading to enhanced phytoplankton growth and new
al., 1996). Although the role of photoacclimation, particu-      production. It remains unknown, however, whether phyto-
larly in strongly oligotrophic environments, has long been       plankton growth and biomass turnover rates are actually
acknowledged (Steele, 1964), the fact that Chl a is used rou-    higher at the depth of the biomass maximum. An additional
tinely as a surrogate for photoautotrophic biomass has helped    source of uncertainty is that both the particulate attenuation
to fuel the assumption, often found in the scientific litera-    and backscattering coefficients relate not only to phytoplank-
ture and in textbooks, that the DCM is always a maximum          ton abundance but to the entire pool of particles, including
in the biomass and, by extension, the growth rate of phy-        non-algal and detrital particles, which are known to con-
toplankton. The assessment of total phytoplankton biomass        tribute significantly to total suspended matter in oligotrophic
along vertical gradients has been traditionally hindered by      regions (Claustre et al., 1999). Combining direct and specific
the time-consuming nature of microscopy techniques, but the      measurements of phytoplankton production (with the 14 C up-
increasing use of optical properties such as the particulate     take technique) and biovolume (with flow cytometry) offers
beam attenuation and backscattering coefficients to estimate     a way to determine photoautotrophic biomass turnover rates
the concentration of suspended particles in the water col-       (Kirchman, 2002; Marañón et al., 2014) and thus gain further
umn (Martinez-Vicente et al., 2013; Behrenfeld et al., 2016)     insight into the dynamics and underlying mechanisms of the
has allowed for the characterization of biogeographic and        DCM. By investigating concurrently the vertical variability
seasonal patterns in the vertical variability of phytoplankton   in heterotrophic prokaryotic production in relation to phyto-
chlorophyll and biomass in stratified environments (Fennel       plankton standing stocks and productivity, it is also possible
and Boss, 2003; Mignot et al., 2014; Cullen, 2015).              to ascertain potential implications of the DCM for trophic
   It is now established that the nature of the DCM changes      coupling within the microbial-plankton community.
fundamentally along a gradient of thermal stability and nu-         The PEACETIME (Process studies at the air-sea interface
trient availability (Cullen, 2015). In the oligotrophic ex-      after dust deposition in the Mediterranean Sea) cruise, which
treme, represented by permanently stratified regions such as     investigated atmospheric deposition fluxes and their impact
the subtropical gyres, the DCM is mostly a result of pho-        on biogeochemical cycling in the Mediterranean Sea (Guieu
toacclimation and does not constitute a biomass maximum          et al., 2020), covered the western, Tyrrhenian and Ionian re-
(Marañón et al., 2000; Pérez et al., 2006; Mignot et al.,        gions during late spring 2017, when the DCM was already
2014). However, a biomass maximum, located at a shallower        well developed. Here we describe the vertical variability in
depth than the DCM, can develop in oligotrophic conditions       chlorophyll a concentration, phytoplankton biomass and pro-
as a result of the interplay between phytoplankton growth,       duction, and heterotrophic prokaryotic production. Our main
biological losses and sinking (Fennel and Boss, 2003). In        goals are (1) to determine the extent to which photoaccli-
mesotrophic regimes, such as seasonally stratified temper-       mation, enhanced phytoplankton biomass, and enhanced pro-
ate seas during summer, the DCM is often also a biomass          ductivity and growth underlie the DCM; (2) to characterize

Biogeosciences, 18, 1749–1767, 2021                                                https://doi.org/10.5194/bg-18-1749-2021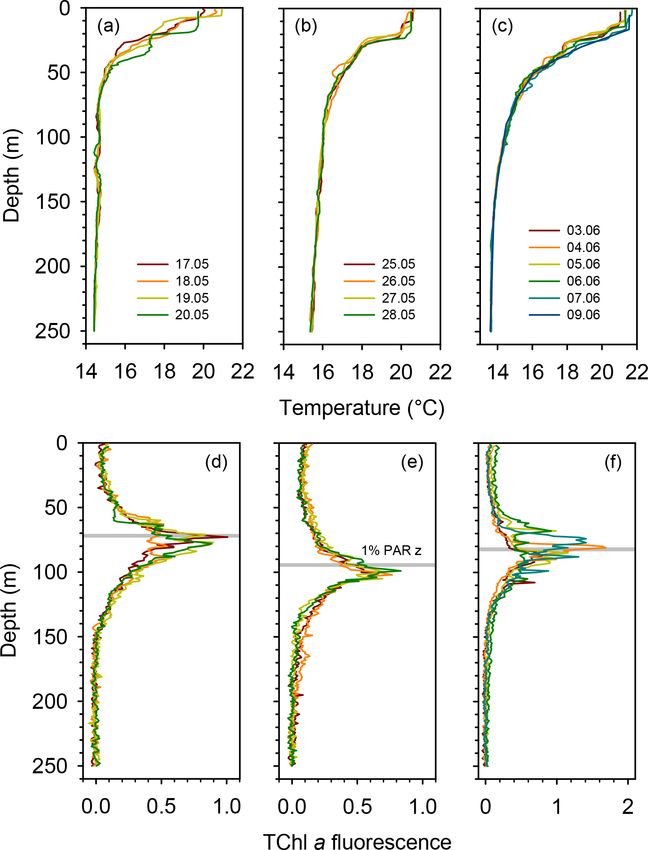
E. Marañón et al.: Deep maxima of phytoplankton biomass and production                                                     1751

the vertical variability in C : Chl a and C-biomass-specific       sampling depth, which was used to determine the incuba-
and Chl a-specific production; and (3) to assess the trophic       tion irradiance for each sample during the primary produc-
coupling between phytoplankton photosynthetic activity and         tion experiments (see Sect. 2.5 below). We compared the
heterotrophic bacterial production. The results presented pro-     daily integrated values of total solar irradiance (TSI) from
vide a context, in terms of the abundance and activity of key      the ship’s pyranometer (Young 70721) and the theoretical-
microbial-plankton groups, for other ecological and biogeo-        incident PAR above the surface (PAR(0+ )) from the model of
chemical investigations carried out during the PEACETIME           Frouin et al. (1989) and used the highest ratio (corresponding
cruise and included in this special issue.                         to the clearest-sky conditions encountered during the cruise)
                                                                   to obtain a conversion factor (0.42) that transforms TSI into
                                                                   PAR(0+ ). TSI units (W m−2 ) were converted to photon flux
2     Methods                                                      units (mol quanta m−2 s−1 ) by multiplying by 4.6, and a ratio
                                                                   of PAR (0− ) to PAR(0+ ) of 0.958 was applied (Mobley and
2.1    Oceanographic cruise                                        Boss, 2012). Using kd and PAR(0− ) values for each sampling
                                                                   day the daily irradiance reaching each sampling depth z was
A detailed description of the ensemble of atmospheric and
                                                                   calculated with Eq. (1).
oceanographic observations conducted during the PEACE-
TIME process study can be found in Guieu et al. (2020).
                                                                   2.3   Phytoplankton abundance and biomass
Here we report measurements conducted during an oceano-
graphic cruise on board RV Pourquoi Pas?, which took
                                                                   The abundance of phytoplankton cells with an equivalent
place in the western and central Mediterranean Sea dur-
                                                                   spherical diameter (ESD) below 5–6 µm was determined with
ing the period 10 May–11 June 2017 (Fig. 1). The cruise
                                                                   flow cytometry. Seawater samples (4.5 mL in volume) from 8
focused on three long-stay stations which were occupied
                                                                   to 10 depths in the euphotic zone were fixed with glutaralde-
for 4–5 d: station TYRR, located in the Tyrrhenian Sea
                                                                   hyde grade I (1 % final concentration), flash-frozen with liq-
(39◦ 20.40 N, 12◦ 35.60 E); station ION, located in the Io-
                                                                   uid nitrogen and stored at −80 ◦ C until analysis. Cell counts
nian Sea (35◦ 29.10 N, 19◦ 47.80 E); and station FAST, located
                                                                   were performed on a FACSCanto II flow cytometer (Becton
in the Balearic Sea (37◦ 56.80 N, 2◦ 54.60 E). The latter sta-
                                                                   Dickinson) with a flow rate of 145 µL min−1 and a counting
tion was occupied as part of a fast-action response to in-
                                                                   time of 5 min so that the total analysed volume for each sam-
vestigate the biogeochemical impacts of an event of atmo-
                                                                   ple was 725 µL. The separation of different autotrophic popu-
spheric wet deposition that occurred during the period 3–5
                                                                   lations (Synechococcus, picoeukaryotes and small nanophy-
June (Guieu et al., 2020). In addition, 10 short-stay stations
                                                                   toplankton) was based on their scattering and fluorescence
were occupied for 8 h. At all stations, CTD (conductivity–
                                                                   signals according to Marie et al. (2000) and Larsen et al.
pressure–temperature) casts were conducted, and seawater
                                                                   (2001). The abundance of Prochlorococcus was determined
samples were obtained for the measurement of the abun-
                                                                   on 2 mL samples, also fixed with glutaraldehyde grade I
dance, biomass and productivity of phytoplankton and bac-
                                                                   (1 % final concentration) and analysed with a FACSCal-
terioplankton.
                                                                   ibur flow cytometer (Becton Dickinson) using a flow rate
2.2    Sampling, hydrography and irradiance                        of 39–41 µL min−1 (Zäncker et al., 2020). To obtain esti-
                                                                   mates of carbon biomass, we applied different values of cel-
We used a Sea-Bird Electronics’s SBE911+ CTD underwa-              lular carbon content for each group. For Prochlorococcus and
ter unit interfaced with a sampling carousel of 24 Niskin bot-     Synechococcus, we used a cell carbon content of 0.06 and
tles, a Chelsea Acquatracka 3 fluorometer and a LI-COR Bio-        0.15 pg C per cell, respectively, which is the mean value ob-
spherical PAR (photosynthetically active radiation) sensor.        tained by Buitenhuis et al. (2012) from a compilation of mul-
At the short stations, CTD casts were conducted at 04:00–          tiple open-ocean studies. For picoeukaryotes, we assumed a
07:00 LT (with the exception of station 1, which was sam-          mean cell diameter of 2 µm and thus a volume of 4.2 µm3
pled at 08:40 LT). At the long stations, CTD casts were con-       per cell, which gives a carbon content of 0.72 pg C per cell
ducted throughout the day, but in the present report, to avoid     after applying the relationship between cell volume and cell
the effect of diel variability, we only consider plankton sam-     carbon obtained by Marañón et al. (2013) with 22 species of
ples from the pre-dawn casts (04:00–05:00 LT). Using CTD           phytoplankton spanning 6 orders of magnitude in cell vol-
casts conducted between 06:00 and 16:00 LT, we calculated          ume. For small nanophytoplankton, we assumed a mean cell
the value of the euphotic-layer vertical attenuation coefficient   diameter of 4 µm and a volume of 34 µm3 per cell, which
(kd ) after fitting the PAR data to                                gives a carbon content of 4.5 pg C per cell.
                                                                      The abundance of phytoplankton cells with an ESD above
PARz = PAR(0− )exp(−kd z),                                  (1)    5 µm was determined with an Imaging FlowCytoBot (IFCB)
                                                                   (Olson and Sosik, 2007), which quantitatively images chloro-
where PAR(0− ) is the irradiance just below the surface.           phyll a-fluorescing particles. Samples (4.7 mL) were ob-
From this model we calculated the % PAR level for each             tained from six to eight depths in the euphotic zone and

https://doi.org/10.5194/bg-18-1749-2021                                                  Biogeosciences, 18, 1749–1767, 2021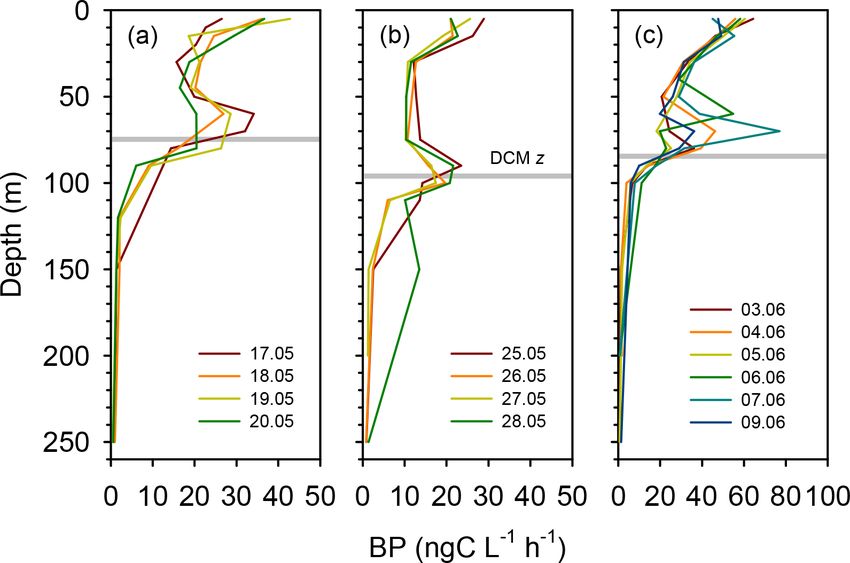
1752 E. Marañón et al.: Deep maxima of phytoplankton biomass and production
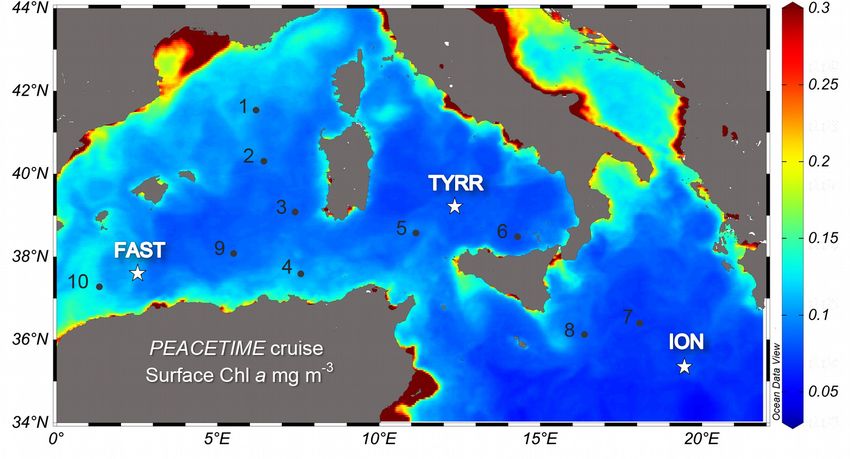
Figure 1. Location of the sampled stations superimposed on a map of ocean colour-based surface chlorophyll a concentration (mg m−3 )
averaged over the period of the PEACETIME cruise (12 May–8 June 2017). Dots and stars indicate the location of short and long stations,
respectively. Ocean colour data from MODIS/Aqua, NASA Goddard Space Flight Center.
screened through a 150 µm mesh to prevent clogging of −20 ◦ C for 1 h. The extracts were vacuum-filtered through
the instrument. Size–abundance spectra obtained with mi- GF/F filters and then analysed (within 24 h) by HPLC using
croscopy image analysis in oligotrophic waters indicate that a complete Agilent Technologies system. The pigments were
cells with a volume ≥ 10 000 µm3 (which, assuming a cylin- separated and quantified following the protocol described in
drical, elongated shape, corresponds roughly to cells with a Ras et al. (2008). Here we report the concentration of total
length of 150 µm and a diameter of 10 µm) contribute on av- chlorophyll a (TChl a), which includes chlorophyll a and
erage approximately 1 % of total biovolume (Huete-Ortega divinyl chlorophyll a. The ratio of fucoxanthin to TChl a
et al., 2012; Marañón, 2015). It is thus unlikely that pre- was multiplied by different factors to obtain estimates of
screening of IFCB samples resulted in significant under- the diatom contribution to TChl a. The factors used were
estimation of total biovolume. From each obtained image, 1.41 (Uitz et al., 2006), 1.6 (Di Cicco et al., 2017) and 1.74
phytoplankton biovolume was computed following Moberg (Di Cicco, 2014). Because fucoxanthin is also present in non-
and Sosik (2012). Processed images, metadata and derived diatom groups such as haptophytes and pelagophytes (Di Ci-
morphometric properties were uploaded to EcoTaxa (https: cco et al., 2017), which can be identified, respectively, by
//ecotaxa.obs-vlfr.fr/, last access: 9 March 2021). The biovol- the marker pigments 190 -hexanoyloxyfucoxanthin (hex-fuco)
ume concentration was converted into a carbon biomass con- and 190 -butanoyloxyfucoxanthin (but-fuco), we also calcu-
centration by applying the mean ratio of carbon to volume lated the fucoxanthin : (hex-fuco+but-fuco) ratio.
obtained by Marañón et al. (2013) for cells larger than 5 µm
in ESD (0.11 pg C µm−3 ). Total phytoplankton biomass was 2.5 Primary production
calculated as the sum of the carbon biomass of Prochloro-
coccus, Synechococcus, picoeukaryotes, nanoeukaryotes and Primary production (PP) was measured with the 14 C up-
phytoplankton of > 5 µm. take technique using simulated in situ incubations on deck.
For each sampling depth (five to six depths distributed be-
2.4 Pigments tween 5 m and the base of the euphotic layer), seawater was
transferred from the Niskin bottle to four polystyrene bot-
Samples for pigment analysis with high-performance liq- tles (three light and one dark bottles) of 70 mL in volume,
uid chromatography (HPLC) were collected from 12 depths which were amended with 20–40 µCi of NaH14 CO3 and in-
over the 0–250 m range. Depending on particle load, a vol- cubated for 24 h in on-deck incubators that were refrigerated
ume of 2–2.5 L of seawater was vacuum-filtered under low with running seawater from the ship’s continuous water sup-
pressure onto Whatman GF/F (glass microfibre filters) fil- ply. The incubators were provided with different sets of blue
ters (ca. 0.7 µm pore size, 25 mm in diameter). The filters and neutral density filters that simulated the following per-
were flash-frozen immediately after filtration in liquid nitro- centages of attenuation: 70 %, 52 %, 38 %, 25 %, 14 %, 7 %,
gen, stored at −80◦ during the cruise and shipped back to 4 %, 2 % and 1 %. We incubated the samples at an irradiance
the laboratory in cryo-shipping containers filled with liquid level (% PAR) as close as possible to the one corresponding
nitrogen. Filters were extracted in 3 mL of pure methanol at to their depth of origin. After incubation, samples were fil-
Biogeosciences, 18, 1749–1767, 2021 https://doi.org/10.5194/bg-18-1749-2021E. Marañón et al.: Deep maxima of phytoplankton biomass and production 1753
tered, using a low-pressure vacuum, through 0.2 µm polycar- trifugation technique (Smith and Azam, 1992) as detailed
bonate filters (47 mm in diameter). At three depths on each in Van Wambeke et al. (2020a). Briefly, triplicate 1.5 mL
profile (5 m, 15–30 m and the DCM), samples were filtered samples and one blank from 10 depths between the surface
sequentially through 2 µm and 0.2 µm polycarbonate filters, and 250 m were incubated in the dark in two thermostated
thus allowing for determining primary production in the pi- incubators set at 18.6 ◦ C for upper layers and 15.2 ◦ C for
cophytoplankton (< 2 µm) and the nano- plus microphyto- deeper layers. Leucine was added at 20 nM final concentra-
plankton (> 2 µm) size classes. All filters were exposed to tion, and the leucine-to-carbon conversion factor used was
concentrated HCl fumes overnight to remove non-fixed, in- 1.5 kg C mol−1 . Given that in situ temperature varied from
organic 14 C and then transferred to 4 mL plastic scintillation 13.4 to 21.6 ◦ C, temperature corrections were applied by us-
vials to which 4 mL of a scintillation cocktail (Ultima Gold ing a Q10 factor determined on two occasions during the
XR) were added. cruise when different samples were incubated simultane-
We also measured dissolved primary production at three ously in the two incubators. We obtained two values of Q10
depths on each profile (surface, base of the euphotic layer (3.9 and 3.3), from which an average value of 3.6 was used
and an intermediate depth), following the method described for the whole BP data set. The same Q10 was applied to as-
in Marañón et al. (2004) but using the same incubation bot- sess the contribution of temperature to the variability of BP
tles employed to determine particulate primary production. in the upper water column, by comparing BP at the in situ
Briefly, after incubation one 5 mL aliquot was taken from temperature and at a constant temperature of 17 ◦ C.
each incubation bottle and filtered through a 0.2 µm poly-
carbonate filter (25 mm in diameter), using a low-pressure
vacuum. Filters were processed as described above, whereas 3 Results
the filtrates were acidified with 100 µL of 5 M HCl and main-
tained in an orbital shaker for 12 h. Then, 15 mL of the liq- 3.1 Hydrographic conditions
uid scintillation cocktail were added to each sample. The
radioactivity in all filter and filtrate samples was measured All three long stations were characterized by broadly simi-
on board with a Packard 1600TR liquid scintillation counter. lar values of sea surface temperature (SST) (20–21 ◦ C) and
The percentage of extracellular release (% PER) was calcu- strong thermal stratification, with a 5–6 ◦ C thermocline ex-
lated as dissolved primary production divided by the sum of tending over the 10–70 m depth range (Fig. 2a). Compared
dissolved and particulate primary production. to TYRR, stations ION and FAST showed warmer SST
To calculate daily PP, DPM (disintegrations per minute) and a stronger stratification, and station FAST presented the
counts in the dark samples were subtracted from the DPM warmest subsurface waters. The depth of maximum vertical
counts in the light samples, and actual values of dissolved stability, as denoted by the Brunt–Väisälä frequency, took a
inorganic carbon concentration, determined during the cruise mean value of 14 m at TYRR and 22–23 m at ION and FAST.
at each sampling depth, were used. Given that all incubations The short stations covered a wider range of locations and
were conducted at SST (sea surface temperature), we applied consequently exhibited higher variability in SST and in the
a temperature correction to the measured rates, by using the strength and vertical extent of the thermocline (Fig. S1 in the
Arrhenius–van ’t Hoff equation, Supplement). Throughout the cruise, nutrient concentrations
were low (< 0.5 µmol L−1 for nitrate and < 0.03 µmol L−1
R = AeEa/KT , (2) for phosphate) in the upper 50–60 m of the water column
where R is the production rate, A is a coefficient, Ea is the (Guieu et al., 2020). The nitracline, defined as the first depth
activation energy, K is the Boltzmann’s constant (8.617 × where nitrate concentration exceeded 0.5 µmol L−1 , was lo-
10−5 eV K−1 ) and T is temperature in K. The value of pro- cated at (mean ± SD; standard deviation) 71 ± 3, 105 ± 2
duction rate obtained for each sampling depth incubated and 78 ± 8 m at stations TYRR, ION and FAST, respectively.
at SST was used to determine A, and then R was calcu- The phosphacline, defined as the first depth where phosphate
lated for the in situ temperature at each sampling depth. concentration exceeded 0.03 µmol L−1 , was deeper: 86 ± 3,
Following Wang et al. (2019), we used a value of Ea = 181 ± 7 and 90 ± 5 at TYRR, ION and FAST, respectively
0.61 eV, which corresponds approximately to a Q10 value (Table 1). At all stations, fluorescence profiles displayed a
of 2.3. The turnover rate of phytoplankton biomass (growth DCM (see Sect. 3.2) which was located approximately at the
rate, d−1 ) was calculated by dividing the rate of production 1 % PAR depth and 5–10 m above the 0.3 mol m−2 d−1 isol-
(mg C m−3 d−1 ) by the concentration of phytoplankton car- ume (Figs. 2b and S1, Table 1). Both the DCM depth and the
bon (mg C m−3 ) (Kirchman, 2002). 1 % PAR depth were shallower at station TYRR (74 ± 4 and
71±8, respectively) than at station ION (96±4 and 94±6, re-
2.6 Heterotrophic prokaryotic production spectively), with station FAST showing intermediate values
(Fig. 2b, Table 1). The depths of both the nitracline and the
Heterotrophic prokaryotic production (BP) was estimated phosphacline were strongly correlated with the DCM depth
from rates of 3 H-leucine incorporation using the microcen- throughout the cruise (Pearson’s r = 0.86, n = 23, p < 0.001
https://doi.org/10.5194/bg-18-1749-2021 Biogeosciences, 18, 1749–1767, 20211754 E. Marañón et al.: Deep maxima of phytoplankton biomass and production
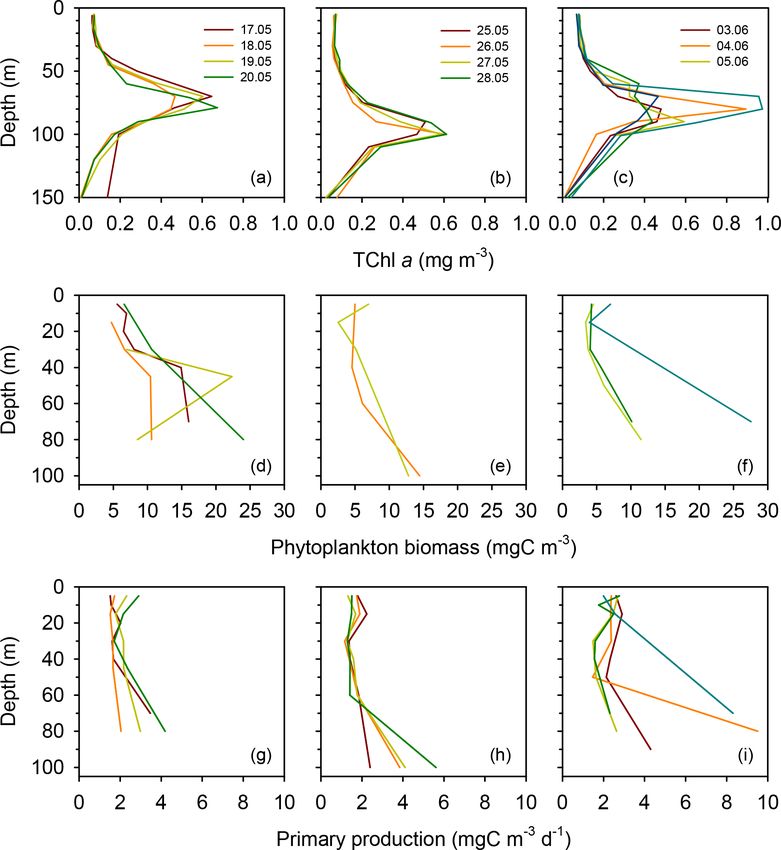
Phytoplankton carbon biomass tended to increase with
depth, exhibiting maxima at either intermediate depths (40–
50 m) or at the base of the euphotic layer (80–100 m)
(Figs. 3d–f and S2b). The concentration of phytoplankton
C in surface waters was relatively invariant at 6 mg C m−3 ,
whereas mean biomass values at the DCM at stations TYRR,
ION and FAST were 15 ± 8, 14 ± 1 and 16 ± 10 mg C m−3 ,
respectively (Table 1). Thus the increase, from the surface
to the base of the euphotic layer, in phytoplankton biomass
was ca. 2.5-fold, compared with ca. 8-fold for TChl a. Com-
paring the mean deep to surface ratios in TChl a and C
biomass at the three stations indicates that increased phy-
toplankton biomass was responsible for 29 %–41 % of the
increased TChl a at the DCM, while photoacclimation (de-
creased C : Chl a at depth) was responsible for the remaining
59 %–71 %.
Compared to surface values, the deep maxima in phyto-
plankton C biomass were of a smaller magnitude than those
of TChl a. Consequently, the mean C : Chl a ratio (g : g) was
much higher at the surface (89–97) than at the DCM (21–34)
at all long stations (Table 1). Considering together the data
from all stations, C : Chl a increased with light availability
following a saturating curve (Fig. 4a). Particulate primary
production (PP) ranged between 1 and 3 mg C m−3 d−1 in
surface waters and tended to increase with depth (Figs. 3h–j
and S2c). In most profiles (19 out of 23), the highest value
of PP (typically, 3–6 mg C m−3 d−1 ) was measured in the
Figure 2. Vertical profiles of temperature and fluorescence (0– deepest sample, corresponding to the DCM. There were only
250 m) during each sampling day at the long stations TYRR (a, c), small differences in mean integrated PP among stations,
ION (b, e) and FAST (c, f). The colour code denotes the sampling
which ranged between 170 ± 36 and 209 ± 67 mg C m−2 d−1
date in dd.mm format, and the grey bars indicate the mean value of
at TYRR and FAST, respectively (Table 1).
the 1 % PAR depth at each station. The fluorescence signal was cali-
brated against HPLC-determined total chlorophyll a concentration. The contribution of cells larger than 5 µm in diameter to
total phytoplankton biomass increased slightly with depth
and took an overall mean value of 49 ± 14 % for all samples
for the nitracline depth and r = 0.74, n = 23, p < 0.001 for pooled together (Fig. S3a). The contribution of the > 2 µm
the phosphacline depth). size class to total PP was relatively stable both among sta-
tions and with depth, taking a mean value of 73 ± 6 % at the
3.2 Phytoplankton total chlorophyll a, biomass and long stations (Fig. S3b). In contrast, the percentage of extra-
production cellular release (PER) showed a marked vertical pattern at all
stations, decreasing with depth from a mean value of 42±8 %
Surface total chlorophyll a concentration (TChl a) was low at the surface to 22 ± 4 % at the DCM (Fig. S3c).
(≤ 0.1 mg m−3 ) throughout most of the cruise (Figs. 3a–c TChl a-specific primary production (PChl ) displayed a
and S2a), with the only exception of short station 1, which marked light dependence, following a saturating func-
sampled a filament of enhanced phytoplankton abundance tion of light availability and reaching values of 20–
(Fig. 1). The mean surface TChl a was similar at all three 35 mg C mg Chl a−1 d−1 at near-surface irradiance levels
long stations (0.07–0.08 mg m−3 ). All vertical profiles dis- (Fig. 4b). In contrast, the ratio between primary production
played a marked DCM (Figs. 3a–c and S2a), with peak and phytoplankton C biomass (PC , equivalent to a biomass
TChl a values in the range 0.4–0.7 mg m−3 at stations TYRR turnover rate) was independent of irradiance (Pearson’s r =
and ION and 0.4–1.0 mg m−3 at station FAST. The mean 0.17, n = 77, p = 0.14), with most values falling within the
DCM TChl a at the three stations was similar (0.6 mg m−3 ) range 0.1–0.5 d−1 throughout the euphotic layer (Fig. 4c).
(Table 1). Vertically integrated (from surface to the euphotic Overall, the mean PC for the whole cruise was 0.3 ± 0.1 d−1 ,
layer depth) TChl a was higher and more variable at FAST and the same mean PC (0.3 d−1 ) was measured at the surface
(21 ± 9 mg m−2 ) compared with TYRR (16 ± 2 mg m−2 ) and and the DCM.
ION (18 ± 2 mg m−2 ) (Table 1).
Biogeosciences, 18, 1749–1767, 2021 https://doi.org/10.5194/bg-18-1749-2021E. Marañón et al.: Deep maxima of phytoplankton biomass and production 1755
Figure 3. Vertical profiles of total chlorophyll a concentration (a–c), phytoplankton biomass concentration (d–f) and primary production (g–
i) during each sampling day at the long stations TYRR (a, d, g), ION (b, e, h) and FAST (c, f, i).
3.3 Vertical distribution of pigment ratios were abundant at the DCM in all three long stations, whereas
they were virtually absent in the surface samples (Fig. S5).
The ratio of fucoxanthin to total chlorophyll a (fuco : TChl a)
consistently increased below the upper 40–50 m at all long 3.4 Heterotrophic prokaryotic production and
stations (Fig. 5). Mean values of fuco : TChl a at the sur- relationship with primary production
face were 0.036 ± 0.001 at TYRR, 0.040 ± 0.004 at ION
and 0.051 ± 0.005 at FAST (Table 1). Using different con- Rates of heterotrophic prokaryotic production (BP) in the
version factors (see Methods), these ratios translate into a euphotic layer fell within the range 10–50 ngC L−1 h−1 and
range of diatom contribution to TChl a of 5 %–6 %, 6 %–7 % took values < 10 ngC L−1 h−1 in the waters below (Figs. 6
and 7 %–9 % at TYRR, ION and FAST, respectively. At the and S6). Most vertical profiles of BP were characterized by
DCM, fuco : TChl a was 0.21±0.04 at TYRR, 0.29±0.03 at two peaks: one at the surface and another one in subsurface
ION and 0.24 ± 0.10 at FAST, which corresponds to diatom waters, coinciding with the DCM or slightly above it. We as-
contributions of 30 %–36 %, 41 %–51 % and 34 %–42 %, re- sessed the effect of temperature on BP rates in the upper layer
spectively. The vertical distribution of the fucoxanthin : (190 (0–50 m) by comparing the rates calculated at the in situ tem-
hex-fuco+190 but-fuco) ratio also showed a marked increase perature versus a constant temperature of 17 ◦ C (mean tem-
below 40–50 m at all stations (Fig. S4), which means that the perature for all profiles across 0–250 m). While BP rates at
high values of the fuco : TChl a ratio at depth reflect an in- the in situ temperature displayed a marked increase in the two
creased contribution of diatoms. This was confirmed by the to three most shallow sampling depths, BP at a constant tem-
images obtained with the IFCB, which show that diatoms perature of 17 ◦ C remained largely homogenous with depth
https://doi.org/10.5194/bg-18-1749-2021 Biogeosciences, 18, 1749–1767, 20211756 E. Marañón et al.: Deep maxima of phytoplankton biomass and production
Table 1. Mean and standard deviation (in brackets) for different physical, chemical and biological variables at the three long stations. N is the
Brunt–Väisälä frequency. Nitracline depth is the first depth at which nitrate concentration reached 0.5 µmol L−1 , while phosphacline depth
corresponds to the first depth at which phosphate concentration reached 0.03 µmol L−1 . Chlorophyll a concentration and particulate primary
production (PP) were integrated from the surface to the 1 % PAR depth. Heterotrophic prokaryotic production (BP) was integrated from the
surface to 200 m. IFCB: Imaging FlowCytoBot; ESD: equivalent spherical diameter. See Methods for details.
Variable TYRR ION FAST
Surface temperature (◦ C) 20.1 (0.6) 20.4 (0.1) 21.4 (0.2)
Depth of maximum N (m) 14 (8) 23 (2) 22 (3)
Surface TChl a (mg m−3 ) 0.07 (0.01) 0.07 (0.01) 0.08 (0.01)
Nitracline depth (m) 71 (3) 105 (2) 78 (8)
Phosphacline depth (m) 86 (3) 181 (7) 90 (5)
DCM depth (m) 74 (4) 96 (4) 85 (6)
1 % PAR depth (m) 71 (8) 94 (6) 81 (5)
0.3 mol m−2 d−1 isolume depth (m) 80 (7) 104 (5) 91 (6)
PAR at the DCM (mol m−2 d−1 ) 0.47 (0.26) 0.45 (0.06) 0.44 (0.19)
DCM TChl a concentration (mg m−3 ) 0.57 (0.11) 0.57 (0.07) 0.62 (0.29)
Surface phytoplankton biomass (mg C m−3 ) 6 (1) 6 (1) 5 (2)
DCM phytoplankton biomass (mg C m−3 ) 15 (8) 14(1) 16 (10)
Surface C : Chl a ratio (g : g) 83 (7) 84 (7) 67 (20)
DCM C : Chl a ratio (g : g) 25 (8) 23 (2) 28 (1)
Surface fucoxanthin : TChl a ratio 0.036 (0.001) 0.040 (0.004) 0.051 (0.005)
DCM fucoxanthin : TChl a ratio 0.21 (0.04) 0.29 (0.03) 0.24 (0.10)
DCM cell biovolume from the IFCB (µm3 per cell) 78 (37) 72 (35) 73 (12)
DCM percentage of phytoplankton C > 5 µm in ESD 59 (16) 73 (2) 66 (11)
DCM percentage of PP > 2 µm in ESD 74 (6) 81 (6) 73 (9)
Integrated TChl a (mg m−2 ) (0 m – 1 % PAR z) 16 (2) 18 (2) 21 (9)
Integrated PP (mg C m−2 d−1 ) (0 m – 1 % PAR z) 170 (36) 186 (56) 209 (67)
Percentage integrated PP > 2 µm (0 m – 1 % PAR z) 72 (4) 75 (6) 73 (3)
Integrated BP (mg C m−2 d−1 ) (0–200 m) 57 (3) 51 (9) 89 (10)
(Fig. S7). The mean integrated BP at the long stations ranged series studies (Lemée et al., 2002; Marty et al., 2002). In the
between 50–60 mg C m−2 d−1 at stations TYRR and ION and western basin, where the spring bloom is characterized by
ca. 90 mg C m−2 d−1 at station FAST (Table 1). Considering the presence of a surface chlorophyll maximum, a subsur-
all data in the euphotic layer, there was a positive correla- face maximum develops from April onwards that takes pro-
tion between both particulate and dissolved primary produc- gressively a deeper location, reaching 70–80 m in midsum-
tion and BP (Fig. 7). However, primary production explained mer. This deepening of the DCM occurs later in the northern
less than 10 % of the variability in BP. Taking into account than in the southern section of the western basin (Lavigne et
that BP displayed a surface maximum, which was rarely ob- al., 2015). In agreement, we found during PEACETIME that
served in the primary production profiles, we explored the the stations located in the southwest had deeper DCMs than
relationship between PP and BP in samples from below 30 m those located in the northwest (it has to be noted, though,
(Fig. S8). Although a positive relationship was observed, PP that the seasonal evolution during the cruise may have in-
still explained only a small amount of variability in BP, which fluenced the DCM depth and that the southwestern stations
reflects the fact that the deep maximum in BP was often shal- were sampled last). In the central Mediterranean (e.g. Ionian
lower than the deep PP maximum. Sea), the spring surface chlorophyll maximum does not oc-
cur, and the DCM also appears around April but becomes
deeper than in the western region. Accordingly, during our
4 Discussion cruise the DCM at long station ION was significantly deeper
than at the western stations. We also found, as previously de-
4.1 Seasonal and geographical context scribed in analyses of vertical structure in stratified waters
(Herbland and Voituriez, 1979; Letelier et al., 2004; Cullen,
The vertical location and longitudinal variability of the DCM 2015), a general correspondence between the top of the nu-
we observed agree with the patterns previously reported for tricline and the depth of the DCM, with deeper values in the
the Mediterranean Sea, based both on climatological analy- Ionian Sea than in the western basin. These differences re-
ses of chlorophyll a profiles (Lavigne et al., 2015) and time-
Biogeosciences, 18, 1749–1767, 2021 https://doi.org/10.5194/bg-18-1749-2021E. Marañón et al.: Deep maxima of phytoplankton biomass and production 1757
Figure 5. Vertical variability of the ratio of fucoxanthin to total
chlorophyll a concentration in the three long stations. The upper
x axis is included as a reference and shows the estimated diatom
contribution to TChl a computed with the mean value of three dif-
ferent conversion factors. See Methods for details.
eux et al. (2019). These authors concluded that in the Ionian
and Levantine basins the deepest winter mixed layer rarely
reaches the top of the nutricline and that the DCM is persis-
tently well above the nutricline during the stratified season.
Numerous surveys at fixed stations (Lemée et al., 2002;
Marty and Chiavérini, 2002) as well as along oceano-
graphic transects (Estrada, 1996; Moutin and Raimbault,
2002; López-Sandoval et al., 2011) have described the ver-
tical variability of PP in the Mediterranean Sea during the
stratification season. While subsurface maxima are often ob-
served in late spring and summer, these peaks tend to be lo-
cated above rather than at the DCM (Estrada, 1996; Marty
and Chiavérini, 2002). During the MINOS (Mediterranean
Investigation of Oligotrophic Systems) cruise, which sam-
pled the entire Mediterranean Sea from the western to the
Figure 4. Relationship between PAR and (a) the ratio of phy- Levantine basin in May–June 1996, Moutin and Raimbault
toplankton carbon to chlorophyll a , (b) chlorophyll a-specific (2002) found a strong correlation between the depths of the
particulate primary production and (c) the phytoplankton biomass deep PP peak and the DCM depth, but the former was on
turnover rate with data from all stations pooled together. The non- average 20 m shallower. In contrast, during PEACETIME
linear fits are (a) y = 89.0 (1 − exp(−0.62x)) (r 2 = 0.48, p < the mean depths of the primary production maximum and
0.001, n = 76) and (b) y = 26.2 (1 − exp(−0.22x)) (r 2 = 0.68, p the DCM coincided, and only in three profiles was the pri-
< 0.001, n = 119). mary production peak located above the DCM. One potential
source of bias during our 14 C uptake experiments could come
from the fact that all samples were incubated at sea surface
flect the more persistent stratification and stronger degree of temperature. However, the correction we applied to the mea-
oligotrophy that characterizes the central and eastern basins sured rates assumes a relatively strong degree of temperature
as compared to the western Mediterranean Sea (Bosc et al., dependence (an activation energy of 0.61 eV), while olig-
2004; D’Ortenzio and Ribera d’Alcalà, 2009). The nitracline otrophic conditions, prevailing during the cruise, are known
was deeper than the DCM at ION, which reflects longitudinal to result in decreased temperature sensitivity of phytoplank-
differences in the way the DCM and the mixed-layer depth ton metabolic rates (O’Connor et al., 2009; Marañón et al.,
are coupled in the Mediterranean Sea, as described by Barbi- 2018). Had we used a lower temperature sensitivity in our
https://doi.org/10.5194/bg-18-1749-2021 Biogeosciences, 18, 1749–1767, 20211758 E. Marañón et al.: Deep maxima of phytoplankton biomass and production
Figure 6. Vertical profiles of heterotrophic prokaryotic production (BP, dawn casts only) during each sampling day at the long-term stations
(a) TYRR, (b) ION and (c) and FAST. The grey line indicates depth of the DCM at each station.
corrections, the magnitude of the deep production peaks low-chlorophyll regions as well as in vitro bioassays with
would have been even greater. Thanks to the combined mea- inorganic nutrients (Mills et al., 2004; Tanaka et al., 2011;
surements of cell abundance and biovolume together with Tsiola et al., 2016) and desert dust (Marañón et al., 2010;
photosynthetic carbon fixation, it is possible to explore the Guieu et al., 2014) in low-nutrient, low-chlorophyll regions
variability in phytoplankton biomass and its turnover rate to typically display larger increases in carbon fixation and nu-
assess if the measured deep production peaks are plausible trient uptake rates than in photoautotroph abundance, which
and explore which processes may have been responsible for implies enhanced biomass turnover rates upon alleviation of
their occurrence. nutrient scarcity. Therefore low nutrient availability, which
Our estimates of growth rate also allowed us to assess if is widespread in the global ocean (Moore et al., 2013), re-
phytoplankton inhabiting the surface waters of the Mediter- sults not only in low phytoplankton biomass but also in slow
ranean Sea during the stratification season were just experi- growth rates.
encing nutrient limitation of their standing stock (yield lim-
itation sensu Liebig) or if they are also limited in their rate 4.2 Mechanisms underlying deep production maxima
of resource use (physiological rate limitation sensu Black-
man). As demonstrated in chemostat experiments (Goldman
Earlier studies have shown that both photoacclimation and
et al., 1979), fast growth rates are compatible with extremely
enhanced biomass contribute to the occurrence of the DCM
low ambient nutrient concentrations, and therefore oligotro-
in the western Mediterranean Sea, whereas in the central and
phy itself does not necessarily imply that Blackman limita-
eastern basins photoacclimation alone would be mainly re-
tion is operating. However, the mean growth rate measured
sponsible for the increased chlorophyll a at depth (Estrada,
in surface waters during the PEACETIME cruise (0.3 d−1 )
1996; Mignot et al., 2014; Barbieux et al., 2019). In con-
is well below the maximal, nutrient-saturated growth rate
trast, during our survey the contribution of increased phyto-
that could be expected at warm (> 20 ◦ C) temperatures for
plankton biomass was similar at all stations, including the
different groups such as diatoms, cyanobacteria and green
one located in the Ionian Sea. Most (ca. 75 %) of the in-
algae (≥ 1 d−1 ) (Kremer et al., 2017). Similarly low (0.2–
creased Chl a concentration at the DCM at all stations was
0.6 d−1 ) phytoplankton growth rates have been reported be-
due to photoacclimation, with the rest being a result of in-
fore for the western Mediterranean Sea (Pedrós-Alió et al.,
creased biomass. The C : Chl a ratios (g : g) we estimate (ap-
1999) and oligotrophic regions of the Atlantic subtropical
proximately 90–100 and 20–30 for surface and DCM popula-
gyres (Marañón, 2005; Armengol et al., 2019) and the North
tions, respectively) agree well with previous results from the
Pacific (Landry et al., 2008, 2009; Berthelot et al., 2019).
Mediterranean Sea (Estrada, 1996) and the Atlantic subtrop-
Multiple experimental approaches, including in situ iron ad-
ical gyres (Veldhuis and Kraay, 2004; Marañón, 2005; Pérez
ditions (Boyd et al., 2007; Yoon et al., 2018) in high-nutrient,
et al., 2006) as well as with general patterns observed in light-
Biogeosciences, 18, 1749–1767, 2021 https://doi.org/10.5194/bg-18-1749-2021E. Marañón et al.: Deep maxima of phytoplankton biomass and production 1759
Tyrrhenian Sea and the Algerian Basin. We used these fluxes
to estimate the contribution of new nutrients to sustain phy-
toplankton productivity at the deep biomass maximum at sta-
tions TYRR and FAST, given the observed biomass concen-
tration and turnover rate (Table 2) and assuming that the deep
biomass maximum extended over 30 m. These calculations
suggest that diffusive fluxes could provide only a small frac-
tion of the nitrogen and, especially, the phosphorus require-
ments of the phytoplankton assemblages inhabiting the lower
part of the euphotic layer. Thus most of the primary produc-
tion in the euphotic layer was sustained by recycled nutrients,
which agrees with the observation that phytoplankton growth
rates did not show any increase at the DCM despite the prox-
imity of the nutricline. The broadly homogeneous distribu-
tion of phytoplankton growth throughout the euphotic layer
also supports the conclusion of Fennel and Boss (2003) that
deep phytoplankton maxima develop approximately at the
compensation depth, where growth and losses balance each
other. We can speculate that the compensation depth during
our cruise broadly coincided with the 1 % PAR light level or
0.5 mol m−2 d−1 isolume, but additional primary production
measurements in deeper samples would have been required
to test this hypothesis.
The nano- and microphytoplankton size classes consis-
tently dominated primary production during the cruise, ac-
counting on average for ca. 70 % of total carbon fixation. The
relatively low share (≤ 30 %–35 %) of primary production
due to picophytoplankton agrees well with previous results
based on remote sensing across the entire Mediterranean Sea
Figure 7. Bacterial production as a function of (a) particulate and (Uitz et al., 2012), while field measurements conducted in
(b) dissolved primary production with data from all stations pooled the western and central basins during the stratification season
together. The linear regression models are (a) y = 0.058 x + 0.54 show somewhat higher and more variable picophytoplank-
(r 2 = 0.05, n = 110, p = 0.016) and (b) y = 0.12 x + 0.55 (r 2 = ton contribution (Magazzù and Decembrini, 1995; Decem-
0.07, n = 62, p = 0.034). brini et al., 2009). During PEACETIME, there a was signif-
icant increase with depth in the contribution of diatoms to
total phytoplankton biomass, which reached at least 30 % at
and nutrient-limited laboratory cultures (MacIntyre et al., the DCM of all stations and was particularly high (nearly
2002; Halsey and Jones, 2015; Behrenfeld et al., 2016). The 50 %) at the most stratified station, located in the Ionian
fact that high C : Chl a values (> 50) persisted throughout Sea. Deep maxima in diatom abundance are common in the
the water column until PAR was lower than 2 mol m−2 d−1 Mediterranean Sea during stratified conditions (Ignatiades et
suggests that nutrient limitation prevailed over most of the al., 2009; Siokou-Frangou et al., 2010; Mena et al., 2019)
euphotic layer, because under nutrient-sufficient and light- and are often associated with peaks in biogenic silica (Crom-
limited conditions C : Chl a typically takes values < 30 bet et al., 2011). The increased prevalence of diatoms at the
(Halsey and Jones, 2015). Only the populations inhabiting base of the euphotic layer, which illustrates the ecological
the DCM showed clear signs of light limitation, reflected in diversity of this group (Kemp and Villareal, 2018), is likely
the decreased C : Chl a ratios. The question remains whether a result of multiple adaptations and mechanisms, including
those populations were mainly sustained by new nutrients high growth efficiency under low-light conditions (Fisher and
supplied by diffusion from below the nutricline or by recy- Halsey, 2016), buoyancy regulation (Villareal et al., 1996),
cled nutrients originated within the euphotic layer. the ability to exploit transient nutrient pulses through luxury
Taillandier et al. (2020) combined measurements of the uptake and storage (Cermeño et al., 2011; Kemp and Vil-
vertical gradient in nutrient concentrations during PEACE- lareal, 2013) and the enhanced ammonium assimilation me-
TIME with estimates of diffusivity based on turbulent kinetic diated by microbial interactions in the phycosphere (Olofs-
energy dissipation rates measured by Ferron et al. (2017) in son et al., 2019). However, our observations were restricted
the western Mediterranean Sea, which allowed them to cal- in time, and therefore it remains uncertain whether the im-
culate the vertical diffusive fluxes across the nutricline in the portant presence of diatoms at the DCM observed during our
https://doi.org/10.5194/bg-18-1749-2021 Biogeosciences, 18, 1749–1767, 20211760 E. Marañón et al.: Deep maxima of phytoplankton biomass and production
Table 2. Estimation of the contribution of nutrient diffusive fluxes to sustain the requirements of the deep phytoplankton biomass maximum
(DPBM) at stations TYRR and FAST. The DPBM layer considered has a thickness of 30 m, and the nutrient requirements of primary
production are assumed to follow Redfield C : N : P proportions. The magnitude of nitrate and phosphate diffusive fluxes at the base of the
DPBM is taken from Taillandier et al. (2020).
TYRR FAST
Mean phytoplankton concentration (mg C m−3 ) 15 10
Biomass turnover rate (d−1 ) 0.3 0.3
C : N molar ratio of phytoplankton biomass 6.6 6.6
C : P molar ratio of phytoplankton biomass 106 106
Vertical extent of the DPBM layer (m) 30 30
Lower limit of the deep biomass layer (m) 60 80
N requirement of the DPBM (µmol N m−2 d−1 ) 1705 1136
P requirement of the DPBM (µmol P m−2 d−1 ) 107 71
Diffusive N flux (Taillandier et al. 2020) (µmol N m−2 d−1 ) 560 101
Diffusive P flux (Taillandier et al. 2020) (µmol P m−2 d−1 ) 12.8 2.3
Percentage of N requirement met by diffusive flux 33 9
Percentage of P requirement met by diffusive flux 12 3
cruise persists during the whole stratification season or if it in September 1999, was 0.066 ± 0.024, which would corre-
was associated with the downward export from the previous spond to a DCM primary production of 4.4 mg C m−3 d−1 , in
spring bloom, as previously observed in the western Mediter- agreement with our observations. The low α B value reported
ranean Sea (Estrada et al., 1993). by Uitz et al. (2008) largely reflected the photophysiolog-
ical properties of communities dominated by small cells, in
4.3 Phytoplankton photophysiology and productivity contrast with the assemblages encountered during the present
study. It thus would appear that the high primary production
Although the widespread occurrence of deep chlorophyll at the DCM during PEACETIME was due not only to en-
maxima, which cannot be detected by ocean colour sensors, hanced levels of phytoplankton biomass but also to the pres-
is often mentioned as a shortcoming of satellite-based pro- ence of a diatom-rich community characterized by high pho-
ductivity models, the vertical distribution of chlorophyll a tosynthetic efficiency. These results stress the importance of
concentration can be derived from surface optical proper- incorporating the linkage between community structure and
ties (Morel and Berthon, 1989; Uitz et al., 2006). The key photophysiological parameters to improve the application of
challenge rests in the quantification of the photophysio- bio-optical productivity models over diverse ecological and
logical parameters (e.g. photosynthetic efficiency) required biogeographic settings (Uitz et al., 2010, 2012; Robinson et
to convert photoautotroph biomass or pigment concentra- al., 2018).
tion into a measure of carbon fixation. Of special rele- We found that phytoplankton can sustain similar rates of
vance, in the case of low-light-acclimated populations, is biomass-specific carbon fixation across a wide range of irra-
the initial slope in the relationship between irradiance and diances, in spite of considerable variations in Chl a-specific
Chl a-specific photosynthesis (α B , mg C (mg Chl a)−1 h−1 photosynthesis. The uncoupling between these two metrics
(µmol photon m−2 s−1 )−1 ). Using a large data set of photo- of productivity likely arises from photoacclimation, whereby
synthetic parameters obtained with the same method, Uitz et cells receiving less irradiance invest more resources in light-
al. (2008) found that α B took a mean value of 0.025 ± 0.022 harvesting complexes and thus are capable of sustaining rates
in the lower part of the euphotic layer in oligotrophic re- of nutrient-limited carbon fixation (per unit biomass) simi-
gions across the world’s oceans. Assuming 14 h of day- lar to those of cells experiencing high light availability (Pan
light and that nighttime respiration losses account for 20 % et al., 1996). Using a photoacclimation model in conjunc-
of carbon fixed during the day (Geider, 1992) and given tion with satellite observations of phytoplankton carbon and
the mean Chl a concentration (0.6 mg m−3 ) and daily PAR Chl a, Behrenfeld et al. (2016) demonstrated that most of the
(0.5 mol m−2 d−1 ) measured at the DCM during PEACE- seasonal and interannual variability in surface Chl a concen-
TIME, this value of α B translates into a primary produc- trations of multiple ocean biomes resulted from photoaccli-
tion of < 1.7 mg C m−3 d−1 , lower than the rates we mea- mation and therefore cannot be readily translated into equiv-
sured (2–10 mg C m−3 d−1 ). Interestingly, the mean α B value alent changes in productivity. Our results suggest that the
determined at the base of the euphotic layer during the same conclusion also applies to small-scale vertical variabil-
PROSOPE (Productivity of Oceanic Pelagic Systems) cruise, ity in stratified environments, where phytoplankton growth
which sampled all major basins of the Mediterranean Sea rates are often relatively constant across the euphotic layer
Biogeosciences, 18, 1749–1767, 2021 https://doi.org/10.5194/bg-18-1749-2021E. Marañón et al.: Deep maxima of phytoplankton biomass and production 1761
(Pérez et al., 2006; Cáceres et al., 2013; Armengol et al., responsible for the stimulation of bacterial activity near the
2019; Berthelot et al., 2019). The fact that C : Chl a is highly base of the euphotic layer.
sensitive not only to irradiance but to nutrient availability and Atmospheric deposition of nutrients may have also con-
temperature as well (Geider, 1987; Halsey and Jones, 2015) tributed to sustain the surface BP peaks observed during
means that changes in growth rate can be disconnected from our study. Nitrogen and phosphorus amendments to seawater
Chl a-specific photosynthesis across multiple environmental from the mixed layer resulted in BP stimulation after 48 h,
gradients (Cullen et al., 1992; Marañón et al., 2018). The ap- indicating NP co-limitation of BP, whereas addition of a la-
parent paradox of relatively constant phytoplankton growth bile carbon source (glucose) had no effect (Van Wambeke
rates across the euphotic layer, in spite of marked changes in et al., 2020b). Thus the surface BP peak observed under in
both temperature and light availability, can be explained by situ conditions was not due to dependence of organic car-
considering that the physiological effect of a given environ- bon substrates but may have resulted in part from new N
mental factor tends to decrease when another factor is limit- and P availability through dry atmospheric deposition. The
ing (Cross et al., 2015; Edwards et al., 2016; Marañón et al., superior ability of heterotrophic bacteria to compete for in-
2018). Thus the lack of irradiance effects on the growth rate organic nutrients has been shown by the budget analysis and
of acclimated phytoplankton assemblages may have resulted experimental observations of Van Wambeke et al. (2020b),
from the fact that nutrient limitation prevailed throughout the who concluded that dry atmospheric deposition could sup-
water column. ply nearly 40 % of the heterotrophic bacteria N demand in
the upper mixed layer during the stratification season in the
Mediterranean Sea.
4.4 Relationship between heterotrophic prokaryotic
Despite the association between increased PP and in-
and primary production
creased BP in subsurface waters, the overall strength of the
relationship between these two variables during PEACE-
The vertical distribution of BP, which was characterized by TIME was weak. This in contrast with previous analyses in
the presence of both surface and deep maxima, likely re- the Mediterranean Sea that included a much broader range
flects the combined influence of several controlling factors. of plankton biomass and production regimes than the one
Different studies have investigated the relationship between covered during our cruise and found stronger correlations
temperature, inorganic nutrients and dissolved organic mat- between photosynthetic carbon fixation and BP (Turley et
ter availability as drivers of heterotrophic prokaryotic pro- al., 2000; Pulido-Villena et al., 2012). If we consider the
duction and carbon demand in the Mediterranean Sea over trophic coupling between heterotrophic bacteria and phyto-
seasonal (Lemée et al., 2002; Alonso-Sáez et al., 2008; Céa plankton as the extent to which dissolved primary produc-
et al., 2015) and mesoscale to basin-scale (Pedrós-Alió et al., tion meets heterotrophic bacterial carbon demand (Morán et
1999; Pulido-Villena et al., 2012) ranges of variability, but al., 2002), our results suggest a poor coupling during the
the relative role of these factors at the small vertical scale PEACETIME cruise. Assuming a value of bacterial growth
within the upper water column has been comparatively less efficiency of 10 %, as determined in the western Mediter-
explored. Van Wambeke et al. (2002) reported that BP con- ranean Sea during summer (Lemée et al., 2002; Alonso-
sistently peaked at the surface during a mesoscale survey in Sáez et al., 2008), our measured rates of dissolved pri-
the Gulf of Lion in spring, which was probably a result of mary production represented, on average, only 25 % (SD =
the fact that primary production also increased in the surface 14 %) of estimated bacterial carbon demand. Similar weak
layer, a pattern also reported by Lemée et al. (2002) through- phytoplankton–bacterioplankton coupling has been reported
out most of the year at the DYFAMED station (Ligurian Sea). before for the Mediterranean Sea during the stratification pe-
In the case of the PEACETIME cruise, however, the surface riod (Morán et al., 2002; Alonso-Sáez et al., 2008; López-
peak in BP cannot be attributed to increased primary pro- Sandoval et al., 2011), which emphasizes the role of addi-
duction, which took the lowest values in the surface layer. tional substrates other than recent products of photosynthesis
Temperature, which exhibited a ca. 5 ◦ C gradient over the released in dissolved form in fuelling bacterial metabolism.
upper 50 m, appears as the most likely responsible driver of These additional substrates can include dissolved organic
the surface BP peaks, considering that the estimated rates at carbon released by consumers (e.g. sloppy feeding) or during
a constant temperature of 17 ◦ C were nearly homogeneous cell lysis, as well as organic molecules previously produced
across the upper layer. Seasonal studies in coastal waters and accumulated over timescales longer than 1 d or derived
of the western Mediterranean Sea have also identified tem- from allochthonous sources such as river and atmospheric
perature as a factor that contributes to explain the temporal inputs. However, the fact that bacterial carbon demand of-
variability of bacterial production in surface waters (Alonso- ten exceeds the instantaneous rate of dissolved primary pro-
Sáez et al., 2008; Céa et al., 2015). In contrast, the deep peak duction does not mean that bacterial metabolism is indepen-
in BP found during our cruise was associated, at least in part, dent of phytoplankton photosynthesis over annual scales but
with increased phytoplankton biomass and production, so an rather reflects the temporal uncoupling resulting from the
enhanced availability of organic substrates may have been episodic nature of phytoplankton production events (Stein-
https://doi.org/10.5194/bg-18-1749-2021 Biogeosciences, 18, 1749–1767, 2021You can also read