Local genetic context shapes the function of a gene regulatory network
←
→
Page content transcription
If your browser does not render page correctly, please read the page content below
RESEARCH ARTICLE

                                     Local genetic context shapes the function
                                     of a gene regulatory network
                                     Anna Nagy-Staron1*, Kathrin Tomasek1, Caroline Caruso Carter1,
                                     Elisabeth Sonnleitner2, Bor Kavčič1, Tiago Paixão1†, Calin C Guet1*
                                     1
                                      Institute of Science and Technology Austria, Klosterneuburg, Austria; 2Department
                                     of Microbiology, Immunobiology and Genetics, Max F. Perutz Laboratories, Center
                                     Of Molecular Biology, University of Vienna, Vienna, Austria

                                     Abstract Gene expression levels are influenced by multiple coexisting molecular mechanisms.
                                     Some of these interactions such as those of transcription factors and promoters have been studied
                                     extensively. However, predicting phenotypes of gene regulatory networks (GRNs) remains a major
                                     challenge. Here, we use a well-defined synthetic GRN to study in Escherichia coli how network
                                     phenotypes depend on local genetic context, i.e. the genetic neighborhood of a transcription
                                     factor and its relative position. We show that one GRN with fixed topology can display not only
                                     quantitatively but also qualitatively different phenotypes, depending solely on the local genetic
                                     context of its components. Transcriptional read-through is the main molecular mechanism that
                                     places one transcriptional unit (TU) within two separate regulons without the need for complex
                                     regulatory sequences. We propose that relative order of individual TUs, with its potential for
                                     combinatorial complexity, plays an important role in shaping phenotypes of GRNs.

*For correspondence:
anna.staron@gmail.com (AN-S);        Introduction
calin@ist.ac.at (CCG)                Changes in regulatory connections between individual transcriptional units (TUs) or, in other words,
                  †                  the rewiring of gene regulatory networks (GRNs), is a major genetic mechanism underlying pheno-
Present address: Instituto
                                     typic diversity (Shubin et al., 2009; Wagner and Lynch, 2010; Wray, 2007). A lot of effort has been
Gulbenkian de Ciência, Oeiras,
Portugal                             put into understanding how mutations in transcription factors and their DNA binding sites within
                                     promoter regions influence GRN behavior, plasticity, and evolution (Babu et al., 2004; Balaji et al.,
Competing interests: The
                                     2007; Chen et al., 2012; Igler et al., 2018; Isalan et al., 2008; Nocedal et al., 2017). However, we
authors declare that no
                                     are still unable to predict GRN phenotypes from first principles (Browning and Busby, 2016).
competing interests exist.
                                        Genes and the genetic elements that regulate them, promoters, are arranged in a linear manner
Funding: See page 20                 on chromosomes. Thus they are embedded into a larger genetic context, represented by the chang-
Received: 21 December 2020           ing genetic background of the rest of the genomic sequence or by their specific physical location on
Accepted: 19 February 2021           the chromosome. The genetic context in which GRNs find themselves in, influences and modulates
Published: 08 March 2021             the way these respond to the environment and interact with other GRNs and it also shapes the inter-
                                     actions within the GRN itself (Cardinale and Arkin, 2012; Chan et al., 2005; Steinrueck and Guet,
Reviewing editor: Paul B
Rainey, Max Planck Institute for
                                     2017; Tas et al., 2021; Wu and Rao, 2010). In bacteria, gene expression levels are thought to be
Evolutionary Biology, Germany        determined by RNA polymerase recognizing promoter sequences and subsequently initiating tran-
                                     scription, which is the key step at which a large part of transcriptional regulation takes place
   Copyright Nagy-Staron et al.
                                     (Browning and Busby, 2004). However, context effects resulting from occupying a particular loca-
This article is distributed under
                                     tion within the genome can significantly alter expression levels (Junier, 2014; Lagomarsino et al.,
the terms of the Creative
Commons Attribution License,         2015; Scholz et al., 2019). Distance to the origin of replication influences transcription levels due to
which permits unrestricted use       gene dosage effects, the presence of transcriptionally active and silent regions, as well as spatial
and redistribution provided that     and temporal variation in DNA superhelicity, while collisions between DNA replication and transcrip-
the original author and source are   tion influence gene expression levels differently on leading and lagging strands (Beckwith et al.,
credited.                            1966; Bryant et al., 2014; Mirkin et al., 2006; Sobetzko et al., 2012; Vora et al., 2009). At a local

Nagy-Staron et al. eLife 2021;10:e65993. DOI: https://doi.org/10.7554/eLife.65993                                                     1 of 24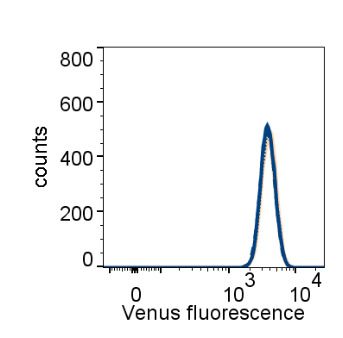
Research article                                              Chromosomes and Gene Expression Computational and Systems Biology

                                   scale, transcriptional interference, transcription-coupled DNA supercoiling, presence of cis-antisense
                                   RNA, as well as transcriptional read-through, all link together the expression of neighboring TUs
                                   (Cambray et al., 2013; Georg and Hess, 2011; Liu and Wang, 1987; Reynolds et al., 1992;
                                   Shearwin et al., 2005; Wu and Fang, 2003). Within operons, number, length, and order of genes
                                   can all affect gene expression (Jacob and Monod, 1961; Lim et al., 2011; Zipser, 1969). All of
                                   these factors that can individually modulate gene expression vary simultaneously across the genome,
                                   with potential for significant combinatorial effects (Meyer et al., 2018; Scholz et al., 2019).
                                       While these multiple local context-dependent mechanisms are known to modulate gene expres-
                                   sion, the qualitative phenotype of a GRN is often thought to be defined solely by the network topol-
                                   ogy and the gene expression levels of GRN components (Babu et al., 2004; Mangan et al., 2003;
                                   Payne and Wagner, 2015), and thus determined simply by the promoter sequences, independent
                                   of the physical location of the genes. One of the reasons for this assumption is the belief that cis-reg-
                                   ulatory changes are less pleiotropic than changes to the protein itself (Prud’homme et al., 2006),
                                   although some have questioned this (Stern and Orgogozo, 2008). However, other non-coding
                                   genetic factors such as transcriptional read-through or supercoiling have the potential to change
                                   gene expression with the same pleiotropic freedom as cis-regulatory changes. Here, we ask how the
                                   immediate local genetic context outside of individual TUs of a GRN can alter both the qualitative
                                   and quantitative phenotype of a network, and how many phenotypes are accessible for this particu-
                                   lar GRN, while the network topology per se remains unchanged. In order to keep the number of
                                   genetic interactions to a minimum, we chose to study a synthetic GRN. This tractable system allows
                                   for a simplified description of more complex naturally occurring GRNs, where a large number of
                                   inherently complex interactions make such a question very difficult to answer experimentally
                                   (Mukherji and van Oudenaarden, 2009; Wolf and Arkin, 2003). Here, we shuffle individual TUs
                                   (understood here as the unit formed by: the mRNA coding sequence, the promoter driving its
                                   expression and the transcriptional terminator marking the end of the transcribed sequence) of a
                                   GRN. In doing so, we alter solely the local genetic context, while keeping the actual interactions
                                   (topology) within the GRN unchanged and thus the number of interactions to a tractable minimum.
                                   We then define the phenotype of the GRN as the levels of gene expression measured across four
                                   different environments, defined by the presence or absence of two different chemical inducers that
                                   alter the binding state of two different well-characterized transcription factors. Qualitative pheno-
                                   types are here based on a set of binary output values for each input state, therefore defining differ-
                                   ent logical operators (e.g. NOR, ON, OFF) (for details see Threshold for assigning a phenotype to
                                   individual GRNs). Quantitative phenotypes are defined as a set of four expression values varying
                                   continuously within one particular behavior. In this way, we systematically explore the space of possi-
                                   ble phenotypes of the GRN and thereby we can disentangle the effects of local genetic context
                                   from multiple other factors that can affect gene expression levels.

                                   Results
                                   Our GRN (Figure 1A) is composed of the genes coding for three of the best characterized repress-
                                   ors: LacI, TetR, and lambda CI (abbreviations used throughout the text: L, T, and C, respectively),
                                   and the promoters they control, Plac, Ptet, and PR. The three repressor genes are transcriptionally
                                   interconnected into a GRN, with LacI repressing both tetR and its own expression, and TetR repres-
                                   sing expression of cI. The controlled promoters are synthetic variants of the PL promoter of phage
                                   lambda with two tet or lac operator sites located in the direct vicinity of the 35 and 10 promoter
                                   elements (Lutz and Bujard, 1997). The binding state of TetR and LacI changes in the presence of
                                   inducers: anhydrotetracycline (aTc) and isopropyl b-D-thiogalactopyranoside (IPTG), respectively. A
                                   yfp gene, expressed from a CI-controlled PR promoter, serves as output. The yfp gene is located
                                   separately from the rest of the genetic circuit at a transcriptionally insulated locus on the chromo-
                                   some (attB site of phage P21). In our synthetic system, each individual promoter and transcription
                                   factor gene it controls are separated from the neighboring one by a strong transcriptional terminator
                                   T1 of the rrnB gene (Orosz et al., 1991), forming an individual TU (Figure 1B). We chose T1 as one
                                   of the strongest transcriptional terminators in E. coli to transcriptionally insulate individual TUs from
                                   one another (Cambray et al., 2013).

Nagy-Staron et al. eLife 2021;10:e65993. DOI: https://doi.org/10.7554/eLife.65993                                                    2 of 24
Research article Chromosomes and Gene Expression Computational and Systems Biology
aTc IPTG
A. - -
IPTG aTc
+ -
- +
lacI tetR cI yfp
+ +
Predicted reporter expression
B.
kanR lacI CLT
promoter
LTrCr
ori terminator
cI CTLr
SC101*
TCrL
tetR
C.
C L T L Tr Cr C T Lr Cr T Lr
Normalized fluorescence
T Cr L Lr Cr T Tr C L L T Cr
Normalized fluorescence
D.
T C L L T C L Cr Tr Tr Cr L
Normalized fluorescence
Figure 1. Architecture and phenotypes of the gene regulatory network (GRN). (A) Diagram of interactions between the three independent
transcriptional units (TUs) encoding for the repressors, lacI, tetR, and cI, their respective inducers isopropyl b-D-thiogalactopyranoside (IPTG) and
anhydrotetracycline (aTc), and the promoters they control, with yfp as the GRN output (left). Phenotype of this GRN as predicted by our mathematical
model (right). (B) Genetic architecture of TU permutations of GRN plasmid (left). Cartoon of TU permutations (right). Abbreviations used throughout the
Figure 1 continued on next page
Nagy-Staron et al. eLife 2021;10:e65993. DOI: https://doi.org/10.7554/eLife.65993 3 of 24Research article Chromosomes and Gene Expression Computational and Systems Biology
Figure 1 continued
text: C stands for cI, L for lacI, and T for tetR. Letter r denotes reverse orientation. (C and D) Fluorescence of cells carrying a representative subset of
different TU permutations of the GRN plasmid. A binary output value (On or Off) was assigned to each environment which thus defines a logical
operation: NOT (aTc) in panel (C) and NOR in panel (D). Graphs show means and error bars standard deviations for three independent biological
replicates.
The online version of this article includes the following figure supplement(s) for figure 1:
Figure supplement 1. A model of the mechanistic basis of gene expression, including transcriptional read-through.
Figure supplement 2. Gene regulatory networks (GRNs) in which phenotype is dependent only on changes in relative transcriptional unit (TU) order
and orientation.
Figure supplement 3. Gene regulatory networks (GRNs) in which the influence of plasmid-encoded genetic elements cannot be ruled out.
Figure supplement 4. Influence of plasmid genetic elements on gene expression levels.
Figure supplement 5. Distribution of phenotypes depending on the threshold applied to define ON and OFF states.
Phenotype of GRN depends on local genetic context despite identical
topology
We asked whether the local genetic context can influence the phenotype of this GRN. First, we
developed a simple mathematical model of the mechanistic basis of gene expression for this specific
network topology (Figure 1—figure supplement 1A). This model tracks the concentrations of all
three repressors as their respective promoter activities are influenced by their known specific net-
work interactions. The predicted phenotype of our GRN will depend on the presence of aTc, but not
on the presence of IPTG (Figure 1A). We wanted to test if this phenotype is independent of the rela-
tive TU order and orientation, and we aimed to build plasmids with all possible 48 relative TU order
permutations with fixed positions (Riordan, 2003) such that: (i) every TU can occupy any of the three
positions, (ii) every TU is present only once, (iii) both forward and reverse orientations are possible,
and (iv) network topology stays the same (Figure 1B). To facilitate comparisons among all GRNs we
used a threshold on the expression of the YFP output for assigning a binary output value to each
environment and so defined a phenotype the GRN can achieve (for thresholds used to assign a par-
ticular phenotype to individual networks, see Supplementary material).
The phenotype of strains carrying the resulting 37 plasmids (multiple attempts to clone eleven of
the TU order permutations failed, see Supplemental material) varied widely both quantitatively and
qualitatively (Figure 1C,D, Figure 1—figure supplement 2, and Figure 1—figure supplement 3).
More than half (20) of the tested GRN permutations showed a phenotype which was qualitatively dif-
ferent than what was predicted ab initio. We also observed multiple quantitative differences in
expression levels within one class of logical phenotypes (e.g. permutations CLT, CTLr, TrCL, and
LTrCr; Figure 1C).
GRN phenotype is influenced by local genetic context independently of
the replicon
We then asked how and why the changes in relative order of individual TUs affect the phenotype of
the GRN, although network topology and individual genetic components of the GRN (i.e. individual
TUs) remain unchanged. In order to disentangle the specific interactions between network compo-
nents we focused on six GRNs which differ in relative TU order but not in gene orientation. These six
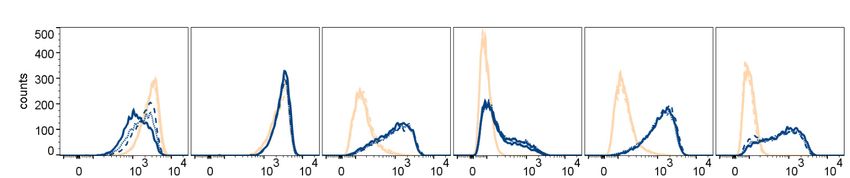
GRNs show two qualitatively different phenotypes (NOR and NOT [aTc]; Figure 2A, upper panel). In
four out of six strains (LCT, LTC, TCL, and TLC), induction with IPTG shifted yfp expression levels to
the OFF state. These population-level findings are also observed at the single cell level (Figure 2A,
lower panel). We tested to what extent our observation from plasmid-based TUs apply to chro-
mosomally located GRNs by integrating three networks with varying TU order (CTL, LCT, and TLC)
at a transcriptionally insulated chromosomal locus (attB site of phage HK022). In line with the plas-
mid-based GRNs, these strains also showed a dependency of phenotype on relative TU order, dem-
onstrating that this is not an effect related to plasmid localization of our GRN (Figure 2B). When
lacI, tetR, and cI are integrated at separate, transcriptionally insulated loci on the bacterial chromo-
some, the network phenotype is identical with the one predicted ab initio from its topology, confirm-
ing that it is the transcription of neighboring genes that changes the network’s phenotype
(Figure 2C).
Nagy-Staron et al. eLife 2021;10:e65993. DOI: https://doi.org/10.7554/eLife.65993 4 of 24Research article Chromosomes and Gene Expression Computational and Systems Biology
A.
plasmid
Normalized fluorescence
Venus fluorescence
cI
lacI
tetR
B. C.
chromosome (attBHK022)
Normalized fluorescence
Normalized fluorescence
// //
Figure 2. Changes in relative transcriptional unit (TU) order lead to qualitative changes of phenotype. Fluorescence of cells carrying six different TU
permutations of the gene regulatory network (GRN) on a plasmid (A), three GRN variants integrated on the chromosome at the phage HK022
attachment site (B), and with each of the repressor genes integrated at separate chromosomal loci (C). Graphs show population level fluorescence
measurements of strains exposed to: no inducer, anhydrotetracycline (aTc), isopropyl b-D-thiogalactopyranoside (IPTG), or a combination of aTc and
Figure 2 continued on next page
Nagy-Staron et al. eLife 2021;10:e65993. DOI: https://doi.org/10.7554/eLife.65993 5 of 24Research article Chromosomes and Gene Expression Computational and Systems Biology
Figure 2 continued
IPTG (as indicated). Graph shows mean and standard deviations for three independent biological replicates. Flow cytometry histograms of cell
fluorescence show 10,000 gated events, corresponding to YFP expressed in a given strain grown without (blue) and with IPTG (yellow). For each strain
and condition, three biological replicates are shown. Relative TU order of the three repressors is shown under the respective graphs.
Differences in cI expression lead to phenotypes that depend on relative
TU order
To elucidate the molecular basis of the observed phenotypic variability, we first asked whether the
relative TU order-dependent differences in phenotypes can be traced back to changes in levels of cI
gene expression. We isolated total RNA from strains differing in relative position of the cI gene (CLT
and TLC) grown in the absence or presence of IPTG, and quantified cI transcript levels using RT-
qPCR. cI expression after IPTG induction in strain TLC was over 10-fold higher than in strain CLT
(Figure 3A), suggesting that the differences in yfp fluorescence were indeed due to differences in cI
expression. In order to corroborate our findings at the mRNA level with protein expression levels,
we replaced the cI gene in strains CLT and TLC with yfp, and confirmed relative gene order effects
on yfp expression directly (Figure 3B).
Expression of the cI gene in our GRN is controlled by TetR (Figure 1A). Thus differences in cI
expression levels between the different relative TU order variants can be due to (i) global changes in
gene expression of Ptet controlled genes, which propagate to changes in expression of cI; or (ii) local
effects, such as transcriptional read-through or changes in supercoiling levels. To distinguish
between these two possibilities, we measured the activity of the promoter driving cI expression by
supplying Ptet-cfp in trans on a second plasmid. In all six strains with different relative TU order, Ptet
activity was strongly induced with aTc, while no Ptet activation was observed after IPTG induction
(Figure 3C). This indicates that cI expression observed after IPTG induction is not due to global
removal of TetR repression, but rather due to a local effect on cI gene expression. Furthermore, lev-
els of TetR-dependent repression do not depend on relative TU order. This local effect depends on
gene expression from the lac promoter in an IPTG-dependent manner (Figure 3D).
Transcriptional read-through is the molecular mechanism underlying
context-dependent GRN phenotype
We hypothesized that transcriptional read-through would be consistent with the context-dependent
effects we measured. We observed that in the cases when the cI gene is at the second or third posi-
tion of the GRN (Figure 1B), transcriptional read-through from upstream TUs (tetR and/or lacI) may
be enough to transcribe cI despite TetR-dependent repression, and in turn shut down PR activity in
response to IPTG (see also Supplemental material for effects of transcriptional read-through into
tetR and lacI). We asked whether the potential for transcriptional read-through, together with the
knowledge about the individual genetic components of this network, is enough to unambiguously
predict the phenotype of the GRN permutation variants we built. For this purpose, we added the
effects of transcriptional read-through to our mathematical model such that promoter activities were
now influenced not only by network interactions but also by the activity of neighboring genes (Fig-
ure 1—figure supplement 1B).
To facilitate the analysis of numerous GRNs we divided the 48 possible TU permutations into 24
pairs that differ only in orientation with respect to the plasmid backbone (Figure 1—figure supple-
ment 2 and Figure 1—figure supplement 3). 26 networks/13 pairs showed the same phenotype in
both orientations (Figure 1—figure supplement 2), eight networks/four pairs showed different phe-
notype in each orientation (Figure 1—figure supplement 3A), for three networks no corresponding
pair was cloned (Figure 1—figure supplement 3B) and eight networks/four pairs were not cloned.
For networks showing the same phenotype in both orientations we assumed there is no signifi-
cant influence of plasmid backbone elements (Figure 1—figure supplement 2). Here, the model
including transcriptional read-through agreed for 20 networks/10 pairs (Figure 1—figure supple-
ment 2A) and did not agree with six networks/three pairs (Figure 1—figure supplement 2B). A
null-model that did not account for transcriptional read-through failed to predict the observed differ-
ences in phenotypes.
Nagy-Staron et al. eLife 2021;10:e65993. DOI: https://doi.org/10.7554/eLife.65993 6 of 24Research article Chromosomes and Gene Expression Computational and Systems Biology
A. B.
C L T T L C V L T T L V
C.
PR-YFP Ptet-CFP
1
CLT
0.8
0.
CTL
LCT 0.
0.6
LTC 0.
0.4
TCL
0.
0.2
TLC
no ind. aTc
aT IPTG aTc
aT no ind. aTc
aT IPTG aTc
aT
&IPTG &IPTG
D.
C L T T L C
Figure 3. Differences in cI expression lead to transcriptional unit (TU) order dependent phenotypes. (A) RT-qPCR analysis of cI expression. RT-qPCR
was performed, using cI-specific primers. The induction ratios were calculated relative to the uninduced strain CLT. (B) YFP levels measured in strains
VLT and TLV which carry a yfp reporter (V) under control of Ptet and differ only in relative TU order. (C) Heatmaps show PR promoter activity in six strains
carrying plasmids differing in relative TU order (left) and activity of Ptet present in trans in the same strains on a second plasmid (right). (D) Relative TU
Figure 3 continued on next page
Nagy-Staron et al. eLife 2021;10:e65993. DOI: https://doi.org/10.7554/eLife.65993 7 of 24Research article Chromosomes and Gene Expression Computational and Systems Biology
Figure 3 continued
order effects depend on expression from the lac promoter in isopropyl b-D-thiogalactopyranoside (IPTG)-dependent manner. Strains CLT and TLC
were grown in the presence of different concentrations of IPTG. (B–D) Strains were exposed to anhydrotetracycline (aTc), IPTG, or a combination of aTc
and IPTG (as indicated). For reasons of clarity, in (C) the highest expression level for each strain was individually normalized. Graphs show means and
error bars standard deviations for three independent biological replicates.
Our experimental approach to test the transcriptional read-through hypothesis is based on the
premise that transcriptional read-through does not depend on a functional promoter of a down-
stream gene, in contrast to supercoiling- or RNAP concentration-dependent effects. Therefore, if
GRN behavior is due to transcriptional read-through, mutating the Ptet promoter should not affect
the responsiveness to IPTG. We tested this prediction by introducing two point mutations into the
10 element of Ptet in a number of different strains (Figure 4A and Figure 4—figure supplement
1). These two point mutations render Ptet inactive and therefore prevent transcription from this pro-
moter (Figure 4—figure supplement 2). The phenotype in the absence of any inducers and with
only IPTG was identical to the phenotype in the original strains, thus confirming that cI expression is
initiated at an upstream promoter (Figure 4B and Figure 4—figure supplement 1).
If the mechanism behind different phenotypes is transcriptional read-through, change of the ter-
minator strength should lead to a change in phenotype. We have chosen network TLC in which our
model predicted that a change of terminator strength will lead to alter the phenotype. In this GRN
we exchanged the T1 terminator preceding cI to either a stronger double T1T2 terminator of the
rrnB locus, or to the weaker Tcrp and TtonB terminators (Cambray et al., 2013). Change from T1 to
T1T2 changes the phenotype of the network to the one predicted by the model and observed when
single transcription factors are incorporated in separate loci on the chromosome (Figure 5A).
Change from T1 to either Tcrp or TtonB leads to a completely OFF phenotype, as expected when
transcriptional read-through through weaker terminators leads to expression of cI in all four
conditions.
Read-through transcripts, i.e. transcripts of more than one gene, can be detected by northern
blotting. We isolated total RNA from strains with T1, Tcrp, and TtonB grown in the absence or pres-
ence of IPTG, and visualized transcripts on northern blot (Figure 5—figure supplement 1). We
expected to detect lacI transcripts in all strains, and in case of transcriptional read-through, longer
transcripts encompassing both lacI and cI. No read-through transcript starting in tetR was expected,
since the T1 terminator separating tetR from lacI carries a RNaseE recognition site in its stem
(Apirion and Miczak, 1993; Szeberényi et al., 1984), which makes it impossible to distinguish
between read-through transcripts and transcripts originating from individual promoters. The same is
true for the strain harboring T1 terminators only, in which we expected to see only single gene
transcripts.
We detected read-through transcripts encompassing both lacI and cI in strains carrying Tcrp and
TtonB, thus directly demonstrating transcriptional read-through in these two strains. We also
detected fragments encompassing only the cI gene. This may suggest RNA processing at a cryptic
RNase site, or additional effects, such as dislodgement of repressor by RNA polymerase passing
through the terminator (Palmer et al., 2011). To rule out the emergence of unpredicted promoters,
we fused the junctions between lacI and cI, encompassing T1, Tcrp, and TtonB terminators in front
of YFP, but did not detect any significant increase in fluorescence (Figure 5—figure supplement 2).
In order to check whether a combination of two terminators would act additively on stopping
transcriptional read-through, we inserted the weaker crp terminator in front of T1 terminator in a dif-
ferent GRN, LCT, resulting in network LcrpT1CT. This network showed an intermediate phenotype,
consistent with predicted decrease in cI expression (Figure 5B).
Taken together, these results strongly support that transcriptional read-through is the molecular
mechanism underlying the relative TU dependent phenotypes we observe, and thus the different
logic phenotypes our GRN can achieve.
Interplay of several molecular mechanisms shapes GRN phenotype
Eight networks (four pairs) showed different phenotypes in each orientation and in all cases one phe-
notype from the pair was supported by our model while the other was not. This suggests that there
was a significant influence of the plasmid backbone elements. Just like the individual TUs
Nagy-Staron et al. eLife 2021;10:e65993. DOI: https://doi.org/10.7554/eLife.65993 8 of 24Research article Chromosomes and Gene Expression Computational and Systems Biology
A. Plac Plac Ptet
IPTG aTc
TLC tetR lacI cI
lacI tetR cI yfp
Plac Plac Ptet
IPTG
TLC-10 tetR lacI cI
lacI tetR cI yfp
B.
Figure 4. Phenotype of strain TLC can be explained by transcriptional read-through. (A) Genetic architecture of plasmid fragments encoding three
repressors in strains TLC and TLC-10 (carrying mutations in the 10 promoter element of Ptet). Promoters are marked as bent arrows, terminators are
represented by vertical bars and a circle, monocistronic transcripts are represented by solid arrows, predicted read-through transcripts by dashed
arrows (left). Interaction diagrams within the two gene regulatory networks (GRNs). Solid lines represent interactions between transcription factors and
the promoters they control, dashed line represents effects resulting from local genetic context (right). (B) Fluorescence of cells carrying TLC plasmid
with either Ptet or Ptet carrying a mutation in the 10 promoter element (TLC-10) grown in the presence or absence of anhydrotetracycline (aTc) and
isopropyl b-D-thiogalactopyranoside (IPTG). We expected that if GRN behavior is due to transcriptional read-through, mutating the Ptet promoter
should not affect the responsiveness to IPTG. If, on the other hand, expression of cI was driven only by Ptet, mutating the 10 promoter element should
lead to an ALL ON phenotype. Lack of repression in strains with Ptet-10 variant after aTc induction further confirms that this promoter variant is inactive.
Graph shows means and error bars standard deviations for three independent biological replicates.
The online version of this article includes the following figure supplement(s) for figure 4:
Figure supplement 1. Phenotype of strains LCT, TrCrLr, TCL, LrCrTr, TLC, and CrLrTr can be explained by transcriptional read-through.
Figure supplement 2. Point mutations in 10 promoter element render Ptet inactive.
constituting our GRN, TUs located on the plasmid backbone (namely the kanamycin resistance gene
kanR and repA in the plasmid origin of replication) also have the potential to influence expression of
neighboring TUs, and hence the GRN phenotype. To rule out transcriptional read-through from the
repA gene located at the plasmid origin of replication, we cloned a promoterless yfp gene down-
stream of repA; however, we did not detect any significant change in fluorescence (Figure 1—figure
supplement 4A). We noticed that there is a slight change in repression of Ptet depending on the rel-
ative orientation to the plasmid backbone (Figure 1—figure supplement 4B). Since supercoiling
can influence gene expression, especially of plasmid-located genes, we also expect supercoiling–
mediated effects to modulate expression and thus influence phenotypes of our GRN
(Sobetzko, 2016; Yeung et al., 2017).
Nagy-Staron et al. eLife 2021;10:e65993. DOI: https://doi.org/10.7554/eLife.65993 9 of 24Research article Chromosomes and Gene Expression Computational and Systems Biology
A. TLC TLT1T2C
T1 T1T2
Plac Plac Ptet Plac Plac Ptet
tetR lacI cI tetR lacI cI
TLTcrpC TLTtonBC
Tcrp TtonB
Plac Plac Ptet Plac Plac Ptet
tetR lacI cI tetR lacI cI
B. LCT LTcrpT1CT
T1 TcrpT1
Plac Ptet Plac
Plac Ptet Plac
lacI cI tetR
lacI cI tetR
Figure 5. Change of terminator leads to qualitative change in phenotype. (A) Genetic architecture of plasmid
fragments encoding three repressors in strains TLC with different terminators: T1, T1T2, Tcrp, or TtonB, preceding
cI, and fluorescence of cells carrying these plasmids grown in the presence or absence of anhydrotetracycline (aTc)
and isopropyl b-D-thiogalactopyranoside (IPTG). (B) Genetic architecture of plasmid fragments encoding three
Figure 5 continued on next page
Nagy-Staron et al. eLife 2021;10:e65993. DOI: https://doi.org/10.7554/eLife.65993 10 of 24Research article Chromosomes and Gene Expression Computational and Systems Biology
Figure 5 continued
repressors in strains LCT with either T1 or a double Tcrp-T1 terminator, and fluorescence of cells carrying these
plasmids grown in the presence or absence of aTc and IPTG. (A and B) Promoters are marked as bent arrows,
terminators are represented by vertical bars and a circle, operators as rectangles, monocistronic transcripts are
represented by solid arrows, predicted read-through transcripts by dashed arrows. Increasing line thickness
corresponds to increasing amount of transcript. Graph shows means and error bars standard deviations for three
independent biological replicates.
The online version of this article includes the following figure supplement(s) for figure 5:
Figure supplement 1. Northern blot assay shows read-through transcript in strains carrying Tcrp and TtonB.
Figure supplement 2. Terminator containing DNA fragments between repressor genes show no cryptic promoter
activity.
Local genetic context modulates regulation of lac promoter
Our simplified synthetic system allowed us to observe the effects of local genetic context created in
a systematic manner by arranging transcription factor genes next to one another on a plasmid
(Figure 2A) or the chromosome (Figure 2B). We also decided to test our findings in a native regula-
tory network of E. coli composed of one transcription factor – LacI, and the promoter it controls,
Plac, and asked whether native local genetic context has the potential to modulate its phenotype.
Using a DlacI DlacZYA genetic background we inserted the lac promoter driving yfp expression in a
transcriptionally insulated locus (phage l attachment site, attB) and the lac repressor, lacI, into one
of three loci on the right replichore (Figure 6A). Subsequently, we measured gene expression from
the lac promoter, Plac, in these three strains by monitoring yfp fluorescence levels after treatment
with increasing IPTG concentrations. The shape of the induction curve was considered to be the net-
work’s phenotype. It should be stressed that the lacI gene (under control of its native promoter) was
inserted only into non-coding chromosomal regions, shortly after an endogenous terminator. The
loci for insertion were chosen such that genes downstream of the terminator were non-essential and
in the same orientation as the genes upstream. Chosen terminators were of different strengths:
strong, middle, and weak (D. Toledo Aparicio, M. Lagator, and A. Nagy-Staron, personal communi-
cation, September 2019) and were located in close vicinity (39’–43’ on MG1655 chromosome) to
avoid gene dosage and transcription factor – promoter distance effects (Block et al., 2012;
Kuhlman and Cox, 2012). Moreover, the growth medium (and hence cell growth rate) was chosen
such as to further minimize gene dosage effects (Block et al., 2012). To assess whether genomic
location affected response to IPTG, we measured yfp fluorescence reporting on Plac expression lev-
els at several points along the IPTG concentration gradient. If lacI is inserted after a weaker termina-
tor, expression from lac promoter is lower for a range of IPTG concentrations as compared to strain
where lacI is inserted after a strong terminator (Figure 6B). We conducted an analysis of variance
(ANOVA) to compare the effect of genomic localization on Plac activity. There was a significant effect
for five IPTG concentrations tested, and post hoc comparisons using the Tukey test were performed
(Figure 6—figure supplement 1). We also directly assessed the amount of lacI transcript in these
three strains using RT-qPCR and saw differences in expression levels consistent with the observed
Plac induction curves (Figure 6C).
In this minimal network consisting of a transcription factor and the promoter it controls, the net-
work phenotype is indeed modulated only by the endogenous local genetic context, likely due to
varying levels of transcriptional read-through into the lacI gene. To verify this, we performed PCR on
cDNA from the three strains, using primers spanning the intergenic regions upstream of lacI
(Figure 6D). In all three cases, a DNA band corresponding to the amplification of the cDNA span-
ning the intergenic region was obtained, confirming read-through transcription into lacI from the
upstream gene (no band was obtained with RNA as template). This corroborates our findings that
genetic context of network elements can modulate network phenotype and that any kind of chromo-
somal rearrangement has the potential to alter network output.
Discussion
By comprehensively shuffling the relative TU order in a synthetic GRN, we show that local genetic
context can significantly influence the phenotype of GRNs both quantitatively and qualitatively, and
Nagy-Staron et al. eLife 2021;10:e65993. DOI: https://doi.org/10.7554/eLife.65993 11 of 24Research article Chromosomes and Gene Expression Computational and Systems Biology
A.
PlacI Plac
-35 -10
lacI lacZ yfp
03 01 02
Chromosomal position varied attλ
B.
locus [EC50] h
yeaH 0.1805 1.458
flhC 0.1578 1.999
asnT 0.1412 2.240
C. D.
gDNA
gDNA
cDNA
cDNA
RNA
RNA
gDNA
cDNA
0.
0.5 RNA
0.
0.4
0.
0.3
0.
0.2
0.
0.1 yeaH flhC asnT
lacI
gene-specific transcripts
read-through transcript
PCR primers
Figure 6. Effect of genetic context of lacI repressor chromosomal position on Plac activity. (A) Diagram of interactions between LacI repressor and the
promoter it represses, as well as genetic architecture of the DNA fragments integrated into MG1655 DlacI DlacZYA strain. Promoters are marked as
bent arrows, terminators are represented by vertical bars and a circle, operators as rectangles. (B) Plac activity in cells carrying lacI inserted at different
loci after a weak (yeaH), medium (flhC), and strong (asnT) terminator grown in different concentrations of isopropyl b-D-thiogalactopyranoside (IPTG).
Figure 6 continued on next page
Nagy-Staron et al. eLife 2021;10:e65993. DOI: https://doi.org/10.7554/eLife.65993 12 of 24Research article Chromosomes and Gene Expression Computational and Systems Biology
Figure 6 continued
yfp levels were measured in exponentially growing cells. Graph shows means for at least three independent biological replicates. (C) RT-qPCR
quantification of lacI transcript in strains described above. RT-qPCR was performed, using lacI-specific primers. The induction ratios were calculated
relative to the strain with insertion in yeaH locus. (D) Ethidium bromide-stained 1% agarose gel of PCR products obtained with primers spanning the
intergenic region between the upstream gene (yeaH, flhC, or asnT) and lacI. Templates for PCR were: chromosomal DNA (gDNA), cDNA as used for
RT-qPCR above, and RNA.
The online version of this article includes the following figure supplement(s) for figure 6:
Figure supplement 1. Plac activity differs significantly in cells carrying lacI inserted after a weak (yeaH), medium (flhC), and strong (asnT) terminator
grown in different concentrations of isopropyl b-D-thiogalactopyranoside (IPTG).
thus can qualitatively and quantitatively change the function a GRN performs. Hence, the phenotype
of a GRN cannot be fully understood without reference to the local genetic context of its individual
network components. We find that our GRN can access multiple phenotypes by simply shuffling the
relative order of TUs without any changes in promoters and coding sequence. Thus, changes in regu-
latory connections between single regulons can be achieved solely by changes in local genetic con-
text, which represent a category of mutations that is to be contrasted from single base pair
mutations. The local genetic context is not limited to proximal transcription factors which are part of
the same GRN, like our synthetic plasmid system that represents the most direct example. In fact,
the local context effects and in particular transcriptional read-through can occur anywhere on the
chromosome (Figure 6), indicating that any chromosomal rearrangement has the potential to alter
not only the expression levels of a gene but importantly also the function of a GRN.
Local genetic context of a TU can change after a deletion, duplication, insertion, inversion, or
translocation event (Periwal and Scaria, 2015). These mutational events are often mediated by
mobile genetic elements, and their rates depend on the type of mobile element, the precise geno-
mic location as well as the organism (Dı́az-Maldonado et al., 2015; Periwal and Scaria, 2015;
Steinrueck and Guet, 2017). Reported rates span a wide range (from 10 3 to 10 8 per cell per gen-
eration), but are typically orders of magnitude higher than rates of point mutations (Hudson et al.,
2002; Saito et al., 2010; Sousa et al., 2013; Tomanek et al., 2020). Given this elevated frequency
of small- and large-scale genomic rearrangements in various bacterial species, changes in local
genetic context have the potential to shape bacterial phenotypes even in the absence of sequence
changes. Specific local genetic contexts could have arisen in response to selection for changes in
gene expression levels. Indeed, genomic rearrangements were found to significantly change expres-
sion patterns in numerous organisms, including E. coli, Bordetella pertussis, and Lactobacillus rham-
nosus (Brinig et al., 2006; Douillard et al., 2016; Raeside et al., 2014; Weigand et al., 2017). It
needs to be stressed that the impact of local genetic context of GRN elements on fitness will
strongly depend on the network’s output. Examples of how even a small effect can be strongly
amplified further downstream in a regulatory network are the regulatory circuit governing lysogenic
and lytic states of phage lambda, or the processes behind entry into sporulation or genetic compe-
tence in Bacillus subtilis (Dubnau and Losick, 2006; Narula et al., 2012; Ptashne, 2004;
Smits et al., 2005).
Growing evidence has been emerging that transcriptional read-through is widespread
(Cambray et al., 2013; Conway et al., 2014; Lalanne et al., 2018; Yan et al., 2018). This raises the
question of whether (potentially ubiquitous) the lack of clearly defined gene and operon boundaries
can be disruptive, or alternatively if this lack of precise functional boundaries is used for the benefit
of the cell. The answer is likely gene-specific, reflecting the complexity of the numerous molecular
mechanisms acting at the level of a single gene. On one hand, in order to impact the phenotype,
transcriptional read-through into neighboring genes needs to reach an effective threshold, and
increases in expression levels can be down-regulated post-transcriptionally (Lalanne et al., 2018).
On the other hand, fitness benefits have been observed in strains with global changes in Rho-depen-
dent termination levels (Freddolino et al., 2012; Lee and Helmann, 2014; Steinrueck and Guet,
2017; Tenaillon et al., 2012), and it is likely that local transcriptional read-through at specific intrin-
sic terminators is also beneficial under certain conditions. As rates of transcriptional read-through
can be condition-dependent (Yan et al., 2018), there are many complex molecular interactions left
to disentangle regarding the fitness effects, whether beneficial or detrimental, of inefficient tran-
scriptional termination.
Nagy-Staron et al. eLife 2021;10:e65993. DOI: https://doi.org/10.7554/eLife.65993 13 of 24Research article Chromosomes and Gene Expression Computational and Systems Biology
We find that transcriptional read-through is an important molecular mechanism behind the effects
we observe in our synthetic GRN system. Changes in the strength of transcriptional termination gen-
erally require just a small number of mutations, often only individual point mutations (San Millan
et al., 2009; Schuster et al., 1994; Weigand et al., 2017). Importantly, despite our synthetic GRN
having been designed to restrict transcriptional read-through by using a single very strong transcrip-
tional terminator, we observed a variety of phenotypes our GRN can access (Cambray et al., 2013).
Naturally occurring transcriptional terminators cover a wide range of efficiencies and hence have
potential to create a large number of regulatory connections between neighboring TUs
(Cambray et al., 2013; Reynolds et al., 1992).
Most studies on chromosomal position effects focus explicitly on molecular mechanisms other
than transcriptional read-through by insulating a reporter system with strong terminators
(Berger et al., 2016; Block et al., 2012; Sousa et al., 1997). Given the fact that endogenous termi-
nators vary widely in their efficiency, we argue that transcriptional read-through from neighboring
genes is an inherent component of chromosomal position effects. It can significantly add to other
genetic context-dependent effects resulting from gene dosage or DNA supercoiling. Such complex
interplay of mechanisms can be seen in our synthetic genetic system, as not all phenotypes we see
can be explained by transcriptional read-through alone and there are likely other molecular mecha-
nisms of a more global nature influencing the phenotypes of our GRN. This observation highlights
how challenging it is to disentangle all of the complex genetic interactions even in a very simplified
synthetic GRN built out of the best-characterized transcription factors. Using simple synthetic sys-
tems helps to dissect and understand the dynamics of more intricate and complex cellular interac-
tions, following the tradition of simple model systems that have been powerful throughout the
history of molecular biology. Understanding of how synthetic genetic systems behave can be greatly
aided by modeling approaches. However, often times the mathematical models can be complex in
their implementation and thus difficult to interpret. As we show here, simple, minimalistic models
can give important insights into fundamental biological mechanisms. Moreover, transcriptional read-
through is a component rarely included in the modeling of GRNs. Yet, its effect can be readily added
into any modeling framework.
Gene expression and its regulation are influenced by multiple coexisting molecular mechanisms,
through the concerted action of DNA binding proteins, including RNA polymerase, transcription fac-
tors, topoisomerases, and nucleoid-associated proteins acting at different levels of organization:
from short promoter sequences to mega-base large DNA macro-domains (Junier, 2014;
Lagomarsino et al., 2015). Here, we show that the local genetic context created by the relative TU
order can act as one of the genetic mechanisms shaping regulatory connections in regulons (Fig-
ure 7). Changes in local genetic context have the potential to place an individual TU into two inde-
pendent regulons without the need to evolve complex regulatory elements. Transcriptional read-
through, by enabling a diversity of gene expression profiles to be accessed by shuffling of individual
TUs, may be one of the mechanisms shaping the evolutionary dynamics of bacterial genomes.
Indeed, the fact that gene expression levels of one gene can be influenced by the gene expression
levels of its immediate neighbor has important consequences for the evolution of operons. For a
long time it has been debated whether any selective advantage is gained from the physical proximity
of two TUs and how this physical proximity can be maintained before common transcription factor-
based transcriptional regulation can evolve (Lawrence and Roth, 1996). We suggest that physical
proximity alone can result in increased co-expression due to transcriptional read-through and thus
can be advantageous by changing gene expression patterns without the need for any changes in
promoter sequences or to the specificity of transcription factors. Indeed, correlated expression of
genes reaching beyond the level of an operon has been recently observed (Junier et al., 2016;
Junier and Rivoire, 2016). Our results also have important implications for comparative genomics,
as sequence conservation does not necessarily equal functional conservation. Finally, there is a les-
son for engineering living systems, as our results underscore the importance of understanding how
nature itself can compute with GRNs (Guet et al., 2002; Kwok, 2010).
The simple synthetic and endogenous examples of GRNs we studied here show how local genetic
context can be a source of phenotypic diversity in GRNs, as the expression of a single gene or
operon can be linked to levels and patterns of gene expression of its immediate chromosomal neigh-
borhood. Systematic studies that utilize simple synthetic systems offer the promise of understanding
how the genetic elements interact and result in the diversity of phenotypes we observe.
Nagy-Staron et al. eLife 2021;10:e65993. DOI: https://doi.org/10.7554/eLife.65993 14 of 24Research article Chromosomes and Gene Expression Computational and Systems Biology
A. Ptet Plac Plac Plac Plac Ptet
CLT cI lacI tetR TLC tetR lacI cI
lacI tetR cI yfp lacI tetR cI yfp
B. TF1 TF2 TF1 TF2
PTF1 PTF1 PTF2 Gene1 Gene2 Gene3
Gene1 Gene2 Gene3
Figure 7. Architecture of a regulon depends on local genetic context. (A) Diagram of interactions within our gene regulatory network (GRN) in two
different transcriptional unit (TU) arrangements: CLT and TLC. (B) Regulatory patterns in two regulons with overlapping components. Genes Gene1 and
Gene2 are regulated via transcription factor-operator interactions with regulator TF1. Gene Gene3 is regulated by TF2 binding and by TF1 via local
genetic context effects. (A and B) Solid lines represent interactions between transcription factors and the promoters they control, dashed line
represents effects resulting from local genetic context. Promoters are marked as bent arrows, terminators are represented by vertical bars and a circle.
Materials and methods
Predicted effects of transcriptional read-through into each of the TFs
In our synthetic GRN, repressor-encoding genes are separated by identical T1 terminators. Tran-
scriptional read-through can in principle happen at any terminator. This scenario is also incorporated
in our model. However, in our experimental approach we focused only on read-through into cI,
which is the network element that directly regulates the level of the measured output yfp by binding
to its promoter PR (Figure 1A). Transcriptional read-through into tetR or lacI from cI would happen
only after induction with aTc, when output is insensitive to the presence of LacI and TetR. Transcrip-
tional read-through from lacI into tetR can only increase expression of tetR, which even without this
effect fully represses Ptet. Transcriptional read-through from tetR into lacI could potentially make a
difference when strains are grown without IPTG, but due to the negative feedback loop and tight
repression of Ptet these effects are likely too subtle to be visible in our set-up. Thus, for the particular
network topology of this study, any changes in levels of LacI and TetR due to transcriptional read-
through cannot impact in any way the level of YFP.
Threshold for assigning a phenotype to individual GRNs
Figure 1—figure supplement 2 and Figure 1—figure supplement 3 show fluorescence levels of all
the strains carrying different TU order permutations of our network. To define a phenotype that
each of the GRNs can achieve, we assign a binary output value for each input state. For each strain,
Nagy-Staron et al. eLife 2021;10:e65993. DOI: https://doi.org/10.7554/eLife.65993 15 of 24Research article Chromosomes and Gene Expression Computational and Systems Biology
fluorescence was normalized to the highest expression level at the given time point. The OFF state
was defined as at least threefold repression compared to the highest ON state. Moreover, the mini-
mal ON value in each GRN was required to be at least threefold greater than the maximal OFF
value. A distribution of logical phenotypes for a varying threshold can be seen in Figure 1—figure
supplement 5. In the mathematical model, the same procedure is followed. Expression values com-
ing from the mathematical model are normalized by the highest expression value and then a thresh-
old is applied to determine ON and OFF states. The threshold value is constant across all gene
orders and orientations.
Cloning of 48 TU order permutations
Despite repeated attempts, cloning of 11 of the 48 TU order permutations failed. Eight of them
were not clonable in either orientation with respect to the plasmid backbone. For three networks,
we were able to clone only one orientation (Figure 1—figure supplement 3B). Generally, we experi-
enced increased difficulties in cloning GRNs where TUs were not oriented in one direction, which
may at least in part be traced back to a number of highly homologous sequences in our plasmids.
A model for the impact of transcriptional read-through on gene
expression
In order to test the mechanistic basis of the changes in gene expression caused by changes in TU
order and orientation, we developed a mathematical model that takes into account transcriptional
read-through between adjacent TUs. The basic scheme is depicted in Figure 1—figure supplement
1. We model the rate of transcript production by a constant term (ki, the constitutive expression rate
of the promoter), and an input dependent term that models the repression by other components
ð1 IÞ KXXþX and a degradation term (-d X).
dL
dt ¼ kL ð1 I1 Þ KLLþL dL þ r L
dT
dt ¼ kL ð1 I1 Þ KLLþL dL þ r T
dC
dt ¼ kC ð1 I2 Þ KTLþL dL þ r C
L, T, and C correspond to lacI, tetR, and cI, respectively, I1 and I2 correspond to the presence or
absence of IPTG and aTc, respectively. I1 and I2 can take only one of two values, 0 or 1. It should be
noted that lacI and tetR share the same promoter and are therefore controlled by the same rates of
production.
Importantly, we include a term r that models transcriptional read-through. This term takes into
account the order and orientation of the specific gene network. When two genes, A and B, are adja-
cent to each other and share the same orientation this term will take the values r~AA~B ¼ 0 for gene A
and r~AA~B ¼ A0 for gene B, where A’ corresponds to the rate of transcription of gene A
kA ð1 IxÞ KAAþA . The output of the network is an inverse threshold function of the expression
level of cI, so that the output is ON if cI expression is below the threshold t and OFF if above it.
In order to obtain the function realized by each of the networks, this system of differential equa-
tions is solved for the steady state for the four possible states of the I1 and I2 (0,0), (0,1), (1,0), and
(1,1). For each network, the expression levels are normalized by the state with the highest expression
and then a threshold is applied to the expression level of cI to determine if the network is in an ON
or OFF state (see above). For mathematical simplicity and to reduce the number of free parameters
we assumed: kL = kC = 1, d = 1, KL = KT = K, leaving essentially two free parameters: the half-repres-
sion point K and the read-through rate .
In order to obtain the parameters region that allows this system of ordinary differentials equations
to fit the experimental data, we performed a grid search in these two parameters. The results for t
= 2/5 can be seen on Figure 1—figure supplement 1C.
Bacterial strains and growth conditions
All strains used in this study are derivatives of E. coli MG1655 and are listed in Supplementary file
1. Plasmids are listed in Supplementary file 3. Strain and plasmid construction is described in detail
below. M9CA+glycerol medium (1 M9 salts, 0.5% glycerol, 2 mM MgSO4, 0.1 mM CaCl2, 0.5%
Nagy-Staron et al. eLife 2021;10:e65993. DOI: https://doi.org/10.7554/eLife.65993 16 of 24Research article Chromosomes and Gene Expression Computational and Systems Biology
casamino acids) was routinely used for bacterial growth unless otherwise stated. Selective media
contained ampicillin at 100 mg ml 1, kanamycin at 50 mg ml 1 (for plasmid located resistance cas-
sette) or 25 mg ml 1 (for chromosomally located resistance cassette), and chloramphenicol at 15 mg
ml 1. Solid media additionally contained 1.5% (w/v) agar. IPTG was used at 1 mM unless stated oth-
erwise, aTc at 100 ng ml 1.
Strain and plasmid construction
All strains and plasmids used in this study are listed in Supplementary file 1 and
Supplementary file 3, respectively. Strain used for measuring GRN behavior was based on TB201,
which is an E. coli MG1655 derivative carrying a attP21::PR-yfp allele. DlacI785::kanR and DlacZ4787::
rrnB-3 alleles were transduced (P1) into TB201 from JW0336, and the KanR marker removed (pCP20
[Cherepanov and Wackernagel, 1995]), resulting in strain ASE023. recA gene of strain ASE023 was
in-frame deleted using l Red recombination (Datta et al., 2006). KanR marker was amplified from
pKD13 (Datsenko and Wanner, 2000) and introduced into the recA gene of ASE023. KanR cassette
was subsequently removed (pCP20 [Cherepanov and Wackernagel, 1995]) resulting in strain
KT131. Strain KT132 was used for measuring behavior of networks containing yfp instead of cI and
was constructed as described above, with the parent strain being MG1655 instead of TB201. Strain
Frag1B was used to supply constitutively expressed tetR encoded on the chromosome and measure
orientation-dependent repression of PLtetO1.
Plasmids were constructed by using standard cloning techniques (Sambrook and Russell, 2001)
with enzymes and buffers from New England Biolabs, according to the respective protocols. All
primer sequences used for this study are listed in Supplementary file 2. For cloning and plasmid
propagation E. coli Frag1D was grown routinely in lysogeny broth (LB) at 30˚C with agitation (240
rpm). All plasmids and strains were verified by sequencing.
To facilitate directional cloning of the DNA fragments, and at the same time reduce the back-
ground of clones containing empty plasmids, we inserted a DNA fragment encoding mCherry
flanked with BglI sites into the cloning vector. This facilitated isolation of completely cut vector as
well as identification of background clones on a plate due to their fluorescence. The fragment
encoding mCherry was amplified from vector pBS3Clux (Radeck et al., 2013) and cloned into PstI
and SmaI sites of vector pLA2 (Haldimann and Wanner, 2001), creating plasmid pAS017. The plas-
mid used for cloning of GRN permutations, pAS019, was constructed by amplifying the vector back-
bone (consisting of kanamycin resistance cassette, and SC101* origin of replication) of pZS*2R-gfp
and inserting the BglI sites-flanked mCherry cassette from pAS017 into its ScaI and EcoRI sites.
Fragments encoding PLlacO1-tetR, PLlacO1-lacI, and PLtetO1-cI were amplified from the original
D052 plasmid (Guet et al., 2002) and cloned into XhoI and XbaI sites of vector pZS*12-gfp (simulta-
neously removing the gfp cassette), resulting in plasmids pAS014, pAS015, and pAS016, respec-
tively. All three repressors are tagged with ssrA degradation tag to reduce the half-life of the
proteins (Keiler et al., 1996).
For construction of the set of gene order permutations, fragments containing PLlacO1-tetR,
PLlacO1-lacI, and PLtetO1-cI were amplified from pAS014, pAS015, and pAS016, respectively. The frag-
ment containing PLtetO1-yfp was amplified from pZS*11-yfp. The primers were designed to create
BglI restriction sites flanking the genes so that directional and ordered cloning was possible. Equi-
molar amounts of the fragments were ligated using T4 DNA ligase. The respective trimer was puri-
fied from an agarose gel and cloned into BglI sites of pAS019, resulting in plasmids pN1-54. pKT10,
the empty control plasmid, was constructed by removing mCherry from pAS019 using XhoI and SalI
and ligating the compatible overhangs. Mutations in the 10 promoter element of plasmids pAS016
and pZS*11-yfp were introduced by site-directed mutagenesis. Primer design and mutagenesis were
performed according to the manufacturer’s instructions for the QuikChange II site-directed muta-
genesis kit (Agilent Technologies) resulting in plasmids pAS023 and pAS024. Plasmid pAS023
served as template for construction of network plasmids with Ptet-10 mutation (pAS026, pAS045-7,
and pAS050-1). Terminators T1T2, Tcrp, and TtonB were cloned into XbaI site of plasmid pAS015,
resulting in plasmids pAS020, pAS021, and pAS038, respectively. These plasmids served as tem-
plate for construction of network plasmids with exchanged terminators (pAS039, pAS040, pAS053,
and pAS055). Promoterless yfp gene and PLtetO1-yfp were amplified from pZS*11-yfp and cloned
with BglI into pAS019 resulting in plasmids pAS035, pAS036, and pAS037. DNA fragments
Nagy-Staron et al. eLife 2021;10:e65993. DOI: https://doi.org/10.7554/eLife.65993 17 of 24You can also read