Assessing the large-scale plant-water relations in the humid, subtropical Pearl River basin of China
←
→
Page content transcription
If your browser does not render page correctly, please read the page content below
Hydrol. Earth Syst. Sci., 25, 4741–4758, 2021
https://doi.org/10.5194/hess-25-4741-2021
© Author(s) 2021. This work is distributed under
the Creative Commons Attribution 4.0 License.

Assessing the large-scale plant–water relations in
the humid, subtropical Pearl River basin of China
Hailong Wang1,2,3 , Kai Duan1,2,3 , Bingjun Liu1,2 , and Xiaohong Chen1,2
1 School of Civil Engineering, Sun Yat-sen University, Guangzhou, Guangdong 510275, China
2 Guangdong   Engineering Technology Research Center of Water Security Regulation and Control for Southern China,
Sun Yat-sen University, Guangzhou 510275, China
3 Southern Marine Science and Engineering Guangdong Laboratory, Zhuhai, Guangdong 519082, China

Correspondence: Hailong Wang (wanghlong3@mail.sysu.edu.cn, whl84@hotmail.com)

Received: 21 May 2020 – Discussion started: 29 June 2020
Revised: 21 July 2021 – Accepted: 8 August 2021 – Published: 31 August 2021

Abstract. Vegetation interacts closely with water resources.      1   Introduction
Conventional field studies of plant–water relations are fun-
damental for understanding the mechanisms of how plants           Vegetation covers 70 % of the land surface, playing a vital
alter and adapt to environmental changes, while large-scale       role in water, carbon and energy exchanges between land and
studies can be more practical for regional land use and wa-       atmosphere (Yang et al., 2016). As climate change has been
ter management towards mitigating climate change impacts.         more and more evident since the industrial age (Marvel et al.,
In this study, we investigated the changes in the total water     2019; Sippel et al., 2020), resulting in numerous ecohydro-
storage (TWS), aridity index (AI) and vegetation greenness,       logical problems such as droughts, flooding, tree mortality,
productivity, and their interactions in the Pearl River basin     etc., managing land use especially through vegetation manip-
since April 2002. Results show an overall increasing trend        ulations has been considerably practiced in many catchment
of vegetation greenness and productivity, especially in the       planning projects (Adhami et al., 2019; Stewardson et al.,
middle reaches where TWS also increased. This region dom-         2017). The theoretical basis for vegetation-involved catch-
inated by croplands was identified as the hot spot for changes    ment management is the plant–water relations across multi-
and interactions between water and vegetation in the basin.       ple scales; for example, vegetation can intercept precipitation
Vegetation was more strongly affected by TWS than precip-         by the canopy which helps with the flood control (Soulsby et
itation (P ) at both the annual and monthly scales. Further       al., 2017; Wheater and Evans, 2009), they uptake soil wa-
examination showed that the influence of TWS on vegeta-           ter or groundwater and transpire it through leaves to increase
tion in dry years was stronger than wet years, while the im-      moisture in the air, and the plant roots create macropores for
pact of P was stronger in wet years than dry years; more-         water flow paths in soils to aid rapid recharge to soil water
over, vegetation productivity responded slower but stronger       stores (Ghestem et al., 2011). In addition, vegetation assim-
to atmospheric dryness in dry years than wet years. The lag       ilates carbon dioxide (CO2 ) through photosynthesis to pro-
effects resulted in nonlinearity between water and vegetation     duce food and energy materials and reduce greenhouse gas
dynamics. This study implies that vegetation in the basin uses    concentration (Notaro et al., 2007; Yosef et al., 2018). In turn,
rainwater prior to water storage until the soil becomes dry,      atmospheric and hydrologic conditions can affect vegetation
and their dynamics indicate that vegetation development is        growth by altering the physiological characteristics such as
subject to water availability, and that vegetation is not domi-   the openness of stomatal aperture (Reyer et al., 2013; Sala et
nant in reducing water availability.                              al., 2010). Therefore, investigation of plant–water relations
                                                                  is of great importance in maintaining terrestrial hydrological
                                                                  regimes and mediating the carbon cycle and energy balance
                                                                  in the Earth systems.

Published by Copernicus Publications on behalf of the European Geosciences Union.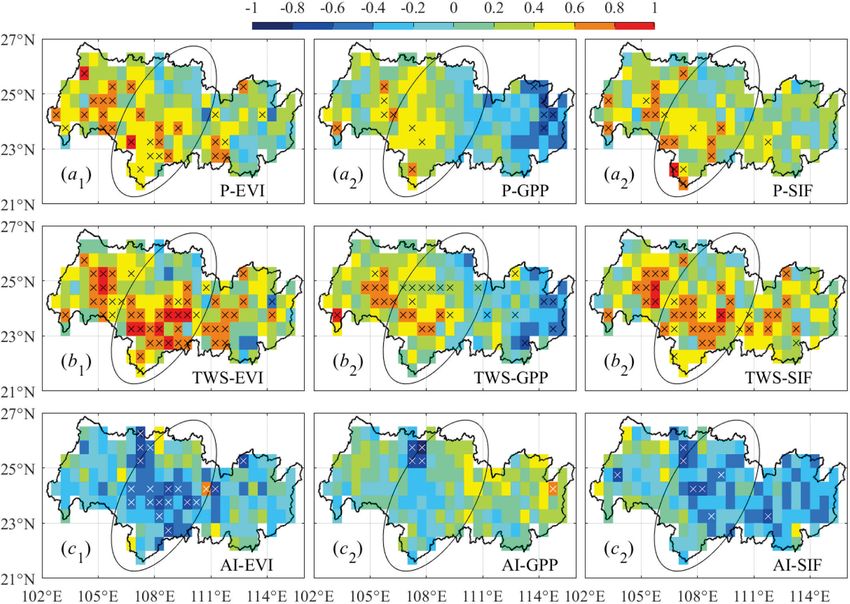
4742             H. Wang et al.: Assessing large-scale plant–water relations in the humid, subtropical Pearl River basin

   Conventional studies of plant–water relations are often        leaf area index, and gross primary production (GPP). Among
carried out at the leaf and canopy level based on exten-          them, NDVI (normalized difference vegetation index) and
sive field measurements. There is a rich pool of literature       EVI (enhanced vegetation index) as well as GPP data have
that examine the plant responses to stress from both atmo-        been extensively used in the literature to facilitate studies of
spheric conditions and water supply (Martin-StPaul et al.,        vegetation in response to climate and hydrology. For exam-
2017; Whitehead, 1998). It may be true that all ecosystems        ple, A et al. (2017) discussed the relationship between total
are, to some degree, controlled by water, but the mechanisms      water storage (TWS), soil moisture, and GPP in response to
vary greatly (Asbjornsen et al., 2011); for instance, plant wa-   drought in 2011 in Texas, USA, and found that vegetation
ter use responded sensitively to rainfall pulses and amounts      dependency on TWS weakened in the shrub-dominated west
in dry semi-arid areas (Huang and Zhang, 2015; Plaut et al.,      and strengthened in the grassland and forest area; Wang et
2013), whilst the light exposure (i.e., radiation) between fre-   al. (2020) compared phenological matrix derived by NDVI,
quent low-intensity rainfall events seemed more important         SIF (solar-induced chlorophyll fluorescence), and VOD (veg-
for stimulating transpiration than rainfall amount in the hu-     etation optical depth) and found consistent patterns of asyn-
mid low-energy boreal forest (Wang et al., 2017). It is well      chrony. The advantage of RS analysis in terms of the spatial
recognized that plant–water interactions will affect soil mois-   and temporal coverage is prominent in assisting the land and
ture dynamics, and the soil water especially the root zone        water management by pinpointing the areas where the veg-
moisture, in turn, plays a key role in regulating plant growth.   etation and hydroclimate changes and interactions are more
The relationship is commonly characterized as the linear in-      sensitive.
crease in plant water use with increasing moisture within a          Among the studies of plant–water relations lies an inter-
certain range, above which plant water use maintains its po-      esting and meaningful argument. On the one hand, vegeta-
tential rate and will be limited mainly by energy (Novák et       tion need water to survive and, thus, are directly influenced
al., 2005).                                                       by water availability. For instance, the most severe ecosys-
   The field studies are fundamental for deeper understand-       tem degradation being faced by many inland river basins is
ing of the mechanisms of how plants alter and adapt to en-        closely related to reduced water availability (Yu and Wang,
vironmental changes (Massmann et al., 2018; Petr et al.,          2012). On the other hand, vegetation is an effective conduit
2015; Sussmilch and McAdam, 2017). However, it is diffi-          for returning water from soils to the atmosphere through tran-
cult to draw universal conclusions about plant–water rela-        spiration and interception loss, and, thus, can cause big water
tions extrapolative to a large landscape comprised of mul-        shortage concerns (Xia and Shao, 2008). It is found that, in
tiple vegetation types and with different structures from site-   most cases, an increase in forest cover will reduce water yield
specific analysis (Aranda et al., 2012; Wang et al., 2008).       and soil water storage (Brown et al., 2005; Schwärzel et al.,
This phenomenon is depicted as the long-standing “scale           2020) because of an increase in evapotranspiration, though
issue” in ecohydrology (Anderson et al., 2003; Jarvis and         the magnitudes are subject to scale, species, and catchment
Mcnaughton, 1986), which weakens the applicability of             size (Blaschke et al., 2008; Wang et al., 2008). Numerous
observation-based research outcomes during the implemen-          studies prove that many dryland ecosystems are sourcing soil
tation of vegetation-related ecological projects at a large       water recharged by precipitation or groundwater, therefore,
scale (Liang et al., 2015). Practically, assessing and mitigat-   plant growth depends largely on rainfall pulses or ground-
ing climate change impacts require effective integrated ef-       water level (Eamus and Froend, 2006; Xu et al., 2016; Yang
forts at a catchment or regional scale (Fowler et al., 2019;      et al., 2014). While the majority of such studies were car-
Ma et al., 2015); therefore, it is necessary to investigate the   ried out in semi-arid regions because of the urgent need to
plant–water relations at a larger scale beyond the field sites.   find an equilibrium threshold between ecological restoration
However, data availability is often one of the greatest ob-       and available water resources in these water-limited areas,
stacles for large-scale and long-term ecohydrological stud-       it is still largely unclear whether the restriction of water re-
ies. Remote sensing (RS) products are thus very useful and        sources or available energy on vegetation growth prevails in
favorable because the abundant land surface information is        the humid or semi-humid areas with both abundant rainfall
beneficial, especially in sparsely monitored basins in terms of   and radiation. The mechanisms of hydroclimate controls on
overlooking the plant–water dynamics from a large area and        vegetation can be different between arid and humid environ-
over a long period. Over the past several decades, various RS     ments (Asbjornsen et al., 2011; Sohoulande Djebou et al.,
data have been applied in many fields such as water budget        2015).
assessment and hydrological components estimation (Pham-             In this study, we investigated the plant–water relationships
Duc et al., 2019; H. Wang et al., 2014), vegetation pheno-        in the Pearl River basin (PRB), the largest river basin in sub-
logical variation and the climate change impacts (Güsewell        tropical, humid southern China, which supports a population
et al., 2017; Hwang et al., 2018), ecosystem services and         of ∼ 120 million. Water is one of the most important strate-
its linkages with climate and land use (Xiao et al., 2019),       gic resources in the basin, especially in one of its sub-basins
etc. Vegetation dynamics can be reflected by many avail-          – the East River basin. The East River basin provides wa-
able indicators, including reflectance-based vegetation index,    ter for the densely populated and highly economically devel-

Hydrol. Earth Syst. Sci., 25, 4741–4758, 2021                                      https://doi.org/10.5194/hess-25-4741-2021
H. Wang et al.: Assessing large-scale plant–water relations in the humid, subtropical Pearl River basin                       4743

oped delta region, including Shenzhen and Hong Kong, and           der natural hazards such as flood and storm surge in wet
the water exploitation rate has nearly reached 38 %, which         seasons and saltwater intrusion in dry seasons (Liu et al.,
increases the difficulty in water allocation and management        2019). In the last 2 decades, droughts were found to occur
among different administrative regions and water use sectors.      frequently in the basin and affected the water allocation to
Vegetation, both natural and cultivated, covers vast areas of      different municipal areas and industries (Deng et al., 2018;
the Pearl River basin (> 92 %). With around half of the to-        Xu et al., 2019).
tal annual precipitation leaving the basin as evapotranspira-
tion (Gao, 2010), consumption of water by plants is non-
                                                                   2.2   Data sources and pre-processing
negligible and may pose threats to other water cycle com-
ponents like streamflow, which is the major water resource
in most of the basin. Despite previous studies examining the       To assess the plant–water relations at a large spatial scale,
changes in vegetation greenness and investigating the roles of     we obtained hydroclimate and vegetation data from different
climate and droughts (represented primarily by temperature         sources (Table 1). Total water storage (TWS) change as one
and precipitation) in the PRB and its sub-basins (Lin et al.,      important water availability indicator is inferred by the mass
2017; Niu et al., 2018; Wu et al., 2019; Zhang et al., 2013),      change detected by GRACE (Gravity Recovery and Climate
there are few studies quantifying how vegetation productiv-        Experiment) satellites (Tapley et al., 2004), which can be ac-
ity alongside greenness interact with water resources from         cessed from three data processing centers. We obtained the
the short to the long term under contrasting atmospheric dry-      monthly TWS anomaly (TWSA) data from Jet Propulsion
ness conditions. Such an investigation can be informative for      Laboratory (JPL) and Center for Space Research (CSR) that
the basin-wide land and water use planning under a rapid           are based on the mascons solution (release 6) at a resolution
changing environment. Thus, the objectives of this study in-       of 0.5◦ . These JPL and CSR RL06 products incorporate cor-
clude (1) characterizing the spatiotemporal patterns of hydro-     rections to minimize errors, including the C20 coefficients
climate and vegetation changes in the last decade or so, iden-     corrections from satellite laser ranging (Loomis et al., 2019),
tifying the hot spots for these changes and the possible driv-     the degree 1 coefficients (GeoCenter) corrections, the glacial
ing forces, and (2) quantifying the plant–water relations at       isostatic adjustment (GIA) corrections (Peltier et al., 2018),
different temporal scales and under contrasting dryness con-       etc. (Swenson and Wahr, 2006). Moreover, the CSR RL06
ditions to determine the interactive roles of water availability   mascon solution uses mascon grids of 1◦ , and the hexago-
and plant growth in this humid basin.                              nal tiles that span across the coastline are split into two tiles
                                                                   along the coastline to minimize the leakage between land
                                                                   and ocean signals, while the JPL RL06 mascon solution uses
2     Data and methods                                             mascon grids of 3◦ , and leakage errors across land/ocean
                                                                   boundary are incorporated with the procedure provided by
2.1    Study area                                                  Wiese et al. (2016). Save et al. (2016) reported that quanti-
                                                                   fying leakage errors does not impact CSR mascon solutions
The Pearl River (in the range of 102–116◦ E, 21–27◦ N) ranks       as much as it affects the JPL mascon estimate due to the na-
as the second largest in China in terms of streamflow, with        tive estimation resolution of 1◦ for CSR mascons versus 3◦
a drainage area of ∼ 450 000 km2 (Fig. 1). The climate of          for JPL mascons. In addition, JPL RL06 products also pro-
the Pearl River basin (PRB) is characterized as subtropi-          vide gridded scaling factors generated by the CLM (Commu-
cal, mainly influenced by the East Asian monsoon and ty-           nity Land Model) land surface model to be multiplied to the
phoons. The long-term mean annual temperature across the           mascon fields that have the color rendering index (CRI) filter
basin is 14–22◦ , and the mean annual precipitation is 1200–       applied to calculate the final TWSA values (Landerer et al.,
2200 mm (Chen et al., 2010), decreasing from southeast to          2020; Wiese et al., 2016). In this study, to reflect the spatial
northwest, and primarily falls as rain and concentrates in         variability in the TWSA over time, we further calculated the
April–September. The elevation is ∼ 2900 m in the west up-         standard deviation of the entire time series averaged over the
land, and it decreases dramatically to the delta in the south-     basin, i.e., the standard deviation of TWSA in each year rep-
east, creating a maximum gradient of ∼ 3000 m.                     resents the spatial variability in TWSA in that year across the
   The dominant vegetation is evergreen forests (∼ 65.3 %),        whole basin.
followed by cropland (∼ 18.1 %) distributed mainly in the             In addition to water storage, precipitation (P ) data
middle of the basin along a northeast–southwest transect,          were obtained from Global Land Data Assimilation Sys-
which happens to be in the transitional areas of high-to-          tem (GLDAS; Rodell et al., 2004) and the national stan-
low elevations in Guangxi province. Grassland (∼ 9.3 %) is         dard meteorological stations distributed across the basin
the third largest land cover type mostly located in the west-      from the China Meteorological Administration (CMA). Po-
ern upland. Due to the downstream location, flat terrain,          tential evapotranspiration (ETp ) was also obtained from
and rapid population growth and economic development, the          GLDAS and Moderate Resolution Imaging Spectroradiome-
Pearl River Delta tends to be more and more vulnerable un-         ter (MODIS). The aridity index (AI) was calculated as the

https://doi.org/10.5194/hess-25-4741-2021                                       Hydrol. Earth Syst. Sci., 25, 4741–4758, 2021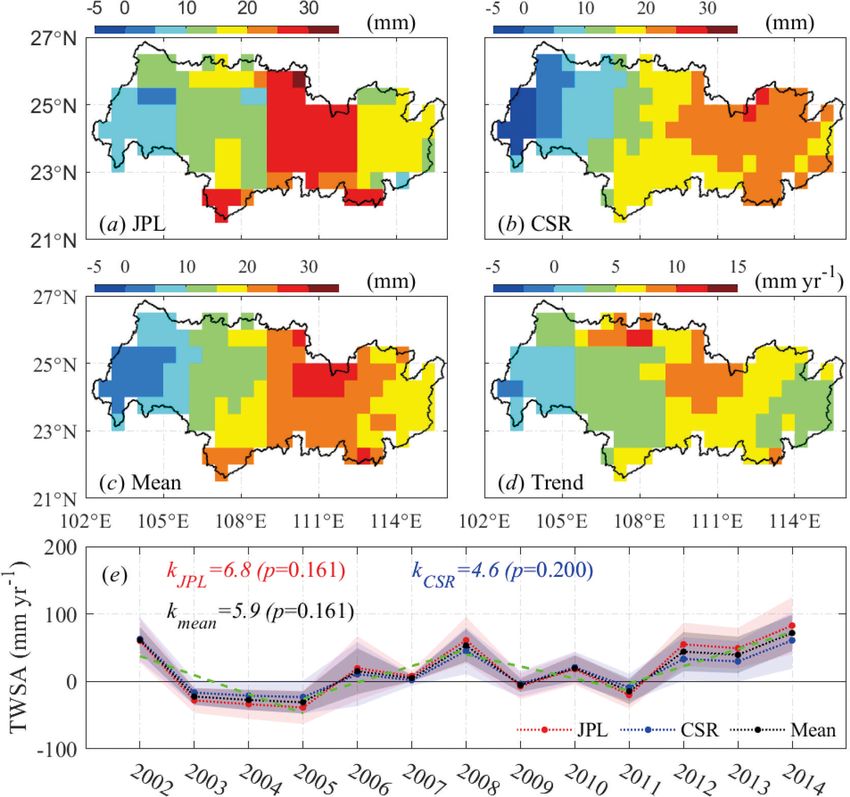
4744 H. Wang et al.: Assessing large-scale plant–water relations in the humid, subtropical Pearl River basin
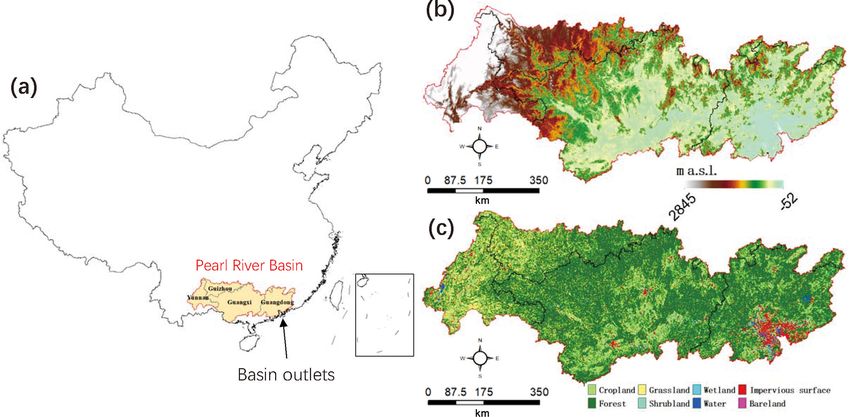
Figure 1. (a) The Pearl River basin and the related provinces on a map of the China. (b) Digital elevation map (meters above sea level –
m a.s.l.; 1000 m resolution). (c) Land cover types (30 m resolution).
Table 1. Information of data used in this study.
Variable Product Resolution Time span Data link
P GLDAS- 0.25◦ × 0.25◦ , Apr 2002– https://disc.gsfc.nasa.gov
Noah (v2.1) monthly Mar 2015 (last access: 6 August 2019)
CMA Station based, Apr 2002– http://data.cma.cn/data
monthly Mar 2015 (last access: 6 August 2019)
ETp GLDAS- 0.25◦ × 0.25◦ , Apr 2002– https://disc.gsfc.nasa.gov
Noah (v2.1) monthly Mar 2015 (last access: 6 August 2019)
MOD16A2 0.05◦ × 0.05◦ , Apr 2002– http://files.ntsg.umt.edu/data/NTSG_Products/MOD16/
monthly Dec 2014 (last access: 6 August 2019)
TWSA GRACEJPL , 0.5◦ × 0.5◦ , Apr 2002– http://grace.jpl.nasa.gov;
GRACECSR monthly Mar 2015 (last access: 6 August 2019)
(RL06) http://www2.csr.utexas.edu/grace/RL06_mascons.html
(last access: 6 August 2019)
EVI MOD13C2 0.05◦ × 0.05◦ , Apr 2002– https://lpdaac.usgs.gov/products/mod13c2v006/
monthly Dec 2014 (last access: 20 March 2021)
GPP MOD17A2 0.05◦ × 0.05◦ , Apr 2002– http://www.ntsg.umt.edu/project/modis/mod17.php
monthly Dec 2014 (last access: 6 August 2019)
VPM 0.05◦ , monthly Apr 2002– https://figshare.com/articles/Monthly_GPP_at_0_05_degree/5048113
Mar 2015 (last access: 6 August 2019)
PML-v2 0.05◦ , 8 d Jul 2002– https://github.com/kongdd/PML
Mar 2015 (last access: 6 August 2019)
SIF GOSIF-v2 0.05◦ , monthly Apr 2002– http://data.globalecology.unh.edu/data/GOSIF_v2
Mar 2015 (last access: 20 March 2021)
Hydrol. Earth Syst. Sci., 25, 4741–4758, 2021 https://doi.org/10.5194/hess-25-4741-2021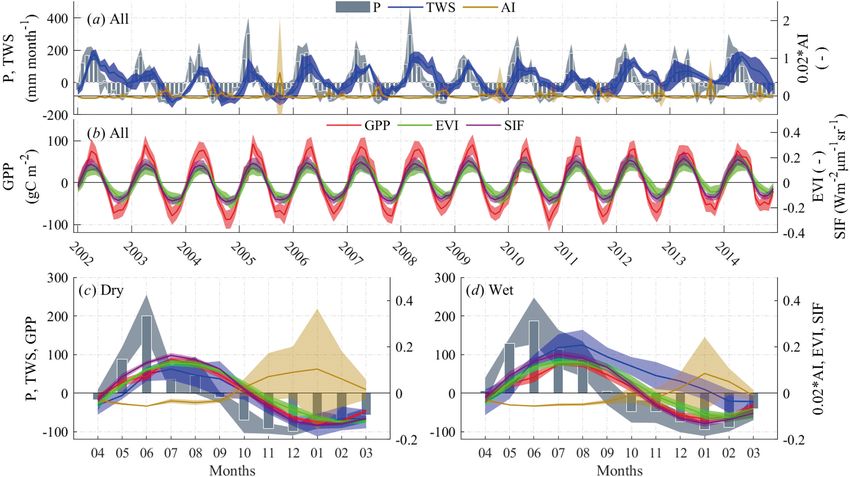
H. Wang et al.: Assessing large-scale plant–water relations in the humid, subtropical Pearl River basin                       4745

ratio of average ETp to P to represent the atmospheric dry-        tively good agreement, and temporally ETp are close to each
ness condition.                                                    other at the monthly scale, while the uncertainty enlarges at
   Vegetation data include the EVI, SIF, and GPP, represent-       the annual scale.
ing surface greenness and productivity, accordingly. EVI was          Z. Liu et al. (2014) compared five GPP data sets against
obtained from the MODIS at a monthly and 0.05◦ resolution.         observations at six sites across China and concluded that
SIF brings major advancements in measuring the terrestrial         MODIS GPP was more reliable over grassland, cropland,
photosynthesis, has a strong correlation with vegetation pro-      and mixed forestland than the other data sets. These land
duction, and represents well the vegetation dynamics. We ob-       cover types happen to be the predominant ones in the PRB,
tained 0.05◦ and monthly global Orbiting Carbon Observa-           which assures some degree of confidence in GPP analysis
tory 2 SIF data (GOSIF; Li and Xiao, 2019). Monthly GPP            using MODIS product. Y. Zhang et al. (2017) and Yuan et
was obtained from three sources, including MODIS (Run-             al. (2015) also compared various GPP data sets globally and
ning et al., 2004), VPM (Vegetation Photosynthesis Model)          regionally, and inconsistencies existed in these comparisons
(Y. Zhang et al., 2017) and Penman–Monteith–Leuning ver-           that could stem from the way each algorithm parameteriz-
sion 2 (PML-v2; Zhang et al., 2019).                               ing atmospheric and water stress and difference in the vege-
   Information relating to the data sources for all variables is   tation index data. From Figs. S4 and S5, for a comparison
listed in Table 1. All data were resampled to 0.5◦ from their      of three GPP data sets, we found that, spatially, the GPP
original resolutions. Moreover, to compare with GRACE              values from MODIS and VPM are more comparable than
data, anomalies of P , AI, EVI, SIF, and GPP data were cal-        PML, which provides higher values. The annual trends in-
culated by subtracting the means over the same baseline pe-        ferred by the three products vary across the basin, mostly
riod of GRACE data (i.e., January 2004–December 2009).             within the range of −25 to 25 gC m2 yr−1 . Correlation co-
Note that using a different baseline period such as the en-        efficients between each of the two GPP data sets are high
tire study period is also feasible, and a longer baseline period   at both the monthly and annual scales. It is worth mentioning
is preferable. Using a different baseline period will change       that the algorithms for MODIS, VPM, and PML only account
the magnitude of the anomaly data series slightly but not the      for atmospheric restrictions (including vapor pressure deficit,
dynamics (i.e., fluctuation patterns and occurring time for        temperature, and radiation) but barely account for soil water
the high and low values) and trends which are more rele-           availability (Pei et al., 2020), in which case the GPP could be
vant in this study. Moreover, we checked the mean annual           overestimated. However, without extensive gridded ground
precipitation over the basin and found the mean value was          observations in the basin to validate these data sets, it is hard
1444.0 ± 138.0 mm over the period of 2004–2009, compara-           to conclude which one is most accurate.
ble to 1461.3 ± 150.7 mm over the entire study period. The            With the lack of ground truth data, and inspired by the
means of the period of 2004–2009 is representative of the          studies of TWS change using GRACE satellite data with dif-
normal condition over the basin for this study period. All         ferent processing algorithms (Long et al., 2017; Sakumura
variables were obtained from April 2002 to March 2015,             et al., 2014), it may be more informative to use the aver-
covering 13 hydrological years. Cubic spline interpolation         age values from as many available data sets for the targeted
was applied to fill the missing monthly data for the GRACE,        variables as possible, i.e., the ensemble means, than to use
MOD16/17, and PML.                                                 a single data set. We used this method to obtain the mean
                                                                   TWSA, ETp , and GPP values for correlation analysis in this
2.3   Associated uncertainties in the data sets                    study. This may be worth further investigation, which could
                                                                   enhance the studies in many ungauged basins for critical hy-
In this study, we used remote sensing and assimilated data         drological assessments, given the increasing availability of
of water storage, vegetation status, and precipitation to as-      remotely sensed and assimilated data sets.
sess their relationships. Precipitation is one of the commonly
monitored meteorological variables, usually with relatively        2.4   Data analysis
long time series and wide spatial coverage. We compared P
from GLDAS and meteorological stations in Fig. S1 in the           To investigate the changes in hydroclimate and vegetation,
Supplement. It shows that the two data sets agree well both        we carried out trend analysis using the Mann–Kendall (MK)
spatially and temporally. The spatial coefficients of determi-     test method both in space and in time. The MK test does
nation (R 2 ) range from 0.7 to 0.9 in pixels where stations are   not require normality of time series and is less sensitive to
available, and the temporal R 2 is 0.98, with a close-to-one       outliers and missing values (Pal and Al-Tabbaa, 2009). This
regression slope. The comparison indicates that the gridded        non-parametric test method has been used in many studies
GLDAS precipitation data can be used to analyze the dynam-         to detect changing hydrological regimes (Déry and Wood,
ics and relationships of hydroclimate and vegetation parame-       2005; Zhang et al., 2009). Interplay between hydroclimate
ters. ETp was also compared in Figs. S2 and S3, which shows        and vegetation was quantified by linear regression; the Pear-
that spatially the correlation coefficient between monthly and     son correlation coefficient (r) and coefficient of determina-
annual ETp lies mostly in 0.6–1.0 and 0.4–1.0, showing rela-       tion (R 2 ) were taken as a measure for assessment of the link-

https://doi.org/10.5194/hess-25-4741-2021                                       Hydrol. Earth Syst. Sci., 25, 4741–4758, 2021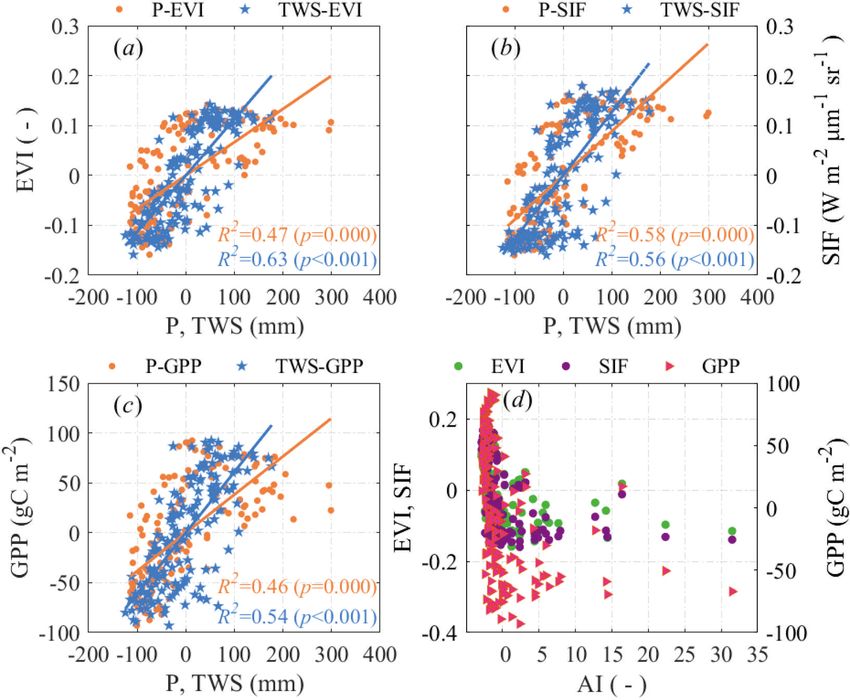
4746               H. Wang et al.: Assessing large-scale plant–water relations in the humid, subtropical Pearl River basin

Figure 2. Spatial distribution of TWSA in the basin inferred by (a) GRACEJPL , (b) GRACECSR , (c) the mean of GRACEJPL and
GRACECSR , (d) the linear trends of the mean annual TWSA, and (e) mean annual TWSA over the entire basin. Shaded areas in panel
(e) show the standard error of each series. Dashed green lines indicate statistically insignificant trends (R 2 = 0.68, 0.82, 0.58, and 0.83,
respectively).

ages between different variables. Data series were detrended             annual scales over the entire basin. It is worth mentioning
by removing the linear trends and deseasonalized by sub-                 that vegetation growth is usually controlled by two groups
tracting the multiyear monthly means when calculating the                of factors, i.e., the demand (e.g., radiation, vapor pressure
Pearson correlation coefficients. Furthermore, to investigate            deficit, temperature, etc.) and the supply (e.g., soil moisture,
the interactive role of vegetation growth and water availabil-           groundwater, water storage, etc.). The supply control was
ity, we carried out a lag effect analysis between vegetation             represented by P and TWS here, and the demand effect was
parameters and hydroclimate variables. We assume that veg-               integrated in ETp and embedded in the aridity index. In this
etation growth is subject to water resources availability if the         sense, we have the impacts of both groups accounted for on
temporal variation of vegetation parameters falls behind that            vegetation growth.
of P and/or TWSA and vice versa.
   Since the interactions between hydroclimate and vegeta-
tion can be different under dry and wet conditions, we se-               3     Results
lected dry and wet years according to the national drought
records, as well as the annual dynamics of TWS, vegetation               3.1    Changes in water storage and dryness
indices, and AI under the criteria that dry conditions cor-
respond to low negative anomaly values of TWS and GPP                    Comparison of the GRACE data from JPL and CSR shows
in addition to a high positive anomaly of AI. The relation-              that mean annual TWSA from GRACEJPL was overall
ships between hydroclimate dynamics and vegetation green-                greater than that of GRACECSR (Fig. 2a and b). Both prod-
ness and productivity were specifically compared in these dry            ucts showed clear zonal characteristics similar to the average
and wet years. Uncertainties of the data used were estimated             of the two (Fig. 2c) in that TWSA was generally higher in
by the standard deviation of each variable at the monthly and            the middle-to-eastern areas than the rest of the basin, espe-
                                                                         cially the western upland, which infers a generally wetting

Hydrol. Earth Syst. Sci., 25, 4741–4758, 2021                                              https://doi.org/10.5194/hess-25-4741-2021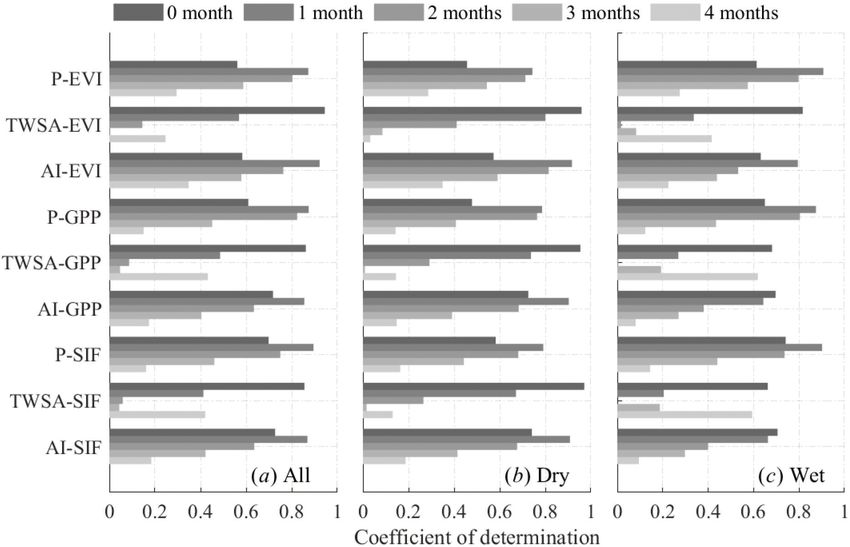
H. Wang et al.: Assessing large-scale plant–water relations in the humid, subtropical Pearl River basin                                   4747

Figure 3. (a) Spatial distribution of the mean annual aridity index across the basin during hydrological years 2002–2014, (b) annual trend of
aridity index, and (c) mean annual aridity index over the basin. Red lines show the periodic trends. The dashed red line indicates statistically
insignificant trend. The coefficient of determination is 0.71, 0.47, and 0.61, respectively.

condition in comparison to the baseline period. The trends                land areas, and the alternate periodical wetting and drying
of annual TWSA (Fig. 2d) showed that, over the 13 hydro-                  episodes like TWSA also existed temporally. Areas with low
logical years, the TWS in most of the basin has increased                 TWS change rates generally coincided with drying climate
at a rate below 10 mm yr−1 , with 46 % of the total area in               represented by aridity index. Combining TWSA and AI dy-
the range of 5.0–10.0 mm yr−1 . Areas with a low chang-                   namics, we were able to define the relatively dry and wet
ing rate were mainly located in the west upland where the                 years during the study period.
predominant land cover is grassland with underlying karst
limestones. It should be noted that the spatial distribution              3.2    Changes in vegetation greenness and productivity
of water storage change should be interpreted with cau-
tion as the GRACE satellites intrinsically provide ∼ 3◦ res-              Spatial EVI distributions (Fig. 4a) were highly related to veg-
olution coverage, while the products in use are processed                 etation cover types that the high EVI values coincided with
with different smoothing and scaling solutions to improve                 forest covers, and low values corresponded to impervious
the spatial resolutions. It is suggested to use the spatially             surfaces, grasslands, and croplands. It clearly reflects the im-
averaged values for temporal analysis over a large region.                pacts of urbanization on surface greenness, particularly near
Nonetheless, to detect the possible hot spots for changes in              the basin outlets in the southeast. Over the 13 hydrological
water resources and vegetation, we kept the spatial analy-                years, EVI has shown significant increases across the basin,
sis in this study. Temporally, the basin has generally been               and the majority (∼ 78.7 %) had a MK test p < 0.05 at the
becoming wetter since 2002 (Fig. 2e). The TWSA has in-                    pixel level. The areas with greater increases were mostly con-
creased over the 13 hydrological years (statistically insignif-           centrated in the central south of the basin where croplands
icant) by 6.8 ± 2.6 mm yr−1 , as inferred by GRACEJPL and                 are predominant, indicating a possible intensification of crop
4.6 ± 1.0 mm yr−1 by GRACECSR , with an average of 5.9 ±                  farming activities over these areas. Temporally, EVI has an
1.4 mm yr−1 . In the following sections, only the mean TWSA               overall significant increase trend over the 13 hydrological
from GRACEJPL and GRACECSR was used for analysis. No-                     years at an annual rate of 0.004 ± 0.003 (p < 0.001). It is
ticeably, there were three shifts in the drying and wetting               noticeable that the periodical shifts in the EVI trends were
tendencies over the study period, i.e., the shift from drying             just slightly different to TWSA in Fig. 2e. This reflects a
between 2002 and 2005 to wetting between 2005 and 2008,                   tight bond between the vegetation greenness and water avail-
followed by the shift back to drying between 2008 and 2011                ability in this rain-abundant region at the annual scale. In-
and, finally, the shift to wetting after 2011.                            terestingly, in 2004–2005, when water storage continued to
   Figure 3 shows the aridity index (AI; ratio of ETp to P )              decrease following the previous years, EVI did not show a
characterizing the spatial and temporal patterns of dryness.              continuity of decreasing but increased instead, which coin-
AI indicates the lump effect of water supply and atmospheric              cided with a slight decrease in aridity index.
demand. The majority of the basin has a semi-humid climate                   As an effective probe for photosynthesis, SIF showed
(AI = 1.0–1.5); the western upland was clearly drier than                 almost identical patterns and trends with EVI (Fig. 4b),
the rest of the basin, which is clearly associated with pre-              i.e., high values distributed in forests and low values in crop-
cipitation patterns. Although the dryness condition has not               lands and grassland. Over the years, SIF has increased sig-
changed significantly over the 13 hydrological years with an              nificantly by 0.003 ± 0.012 W m−2 µm−1 sr−1 per year (p <
overall positive trend spatially (0.002 ± 0.009) and tempo-               0.001). Another vegetation biomass parameter GPP was also
rally (0.005 ± 0.025), it has some interesting characteristics,           analyzed for the basin (Fig. 4c). It is not surprising to observe
such as the wetting tendencies primarily located in the crop-             that GPP was highly responsive to EVI and SIF, such that ar-
                                                                          eas with low EVI and SIF also had low GPP (e.g., the central

https://doi.org/10.5194/hess-25-4741-2021                                                Hydrol. Earth Syst. Sci., 25, 4741–4758, 2021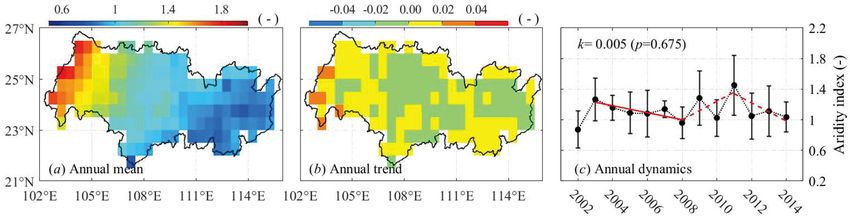
4748 H. Wang et al.: Assessing large-scale plant–water relations in the humid, subtropical Pearl River basin
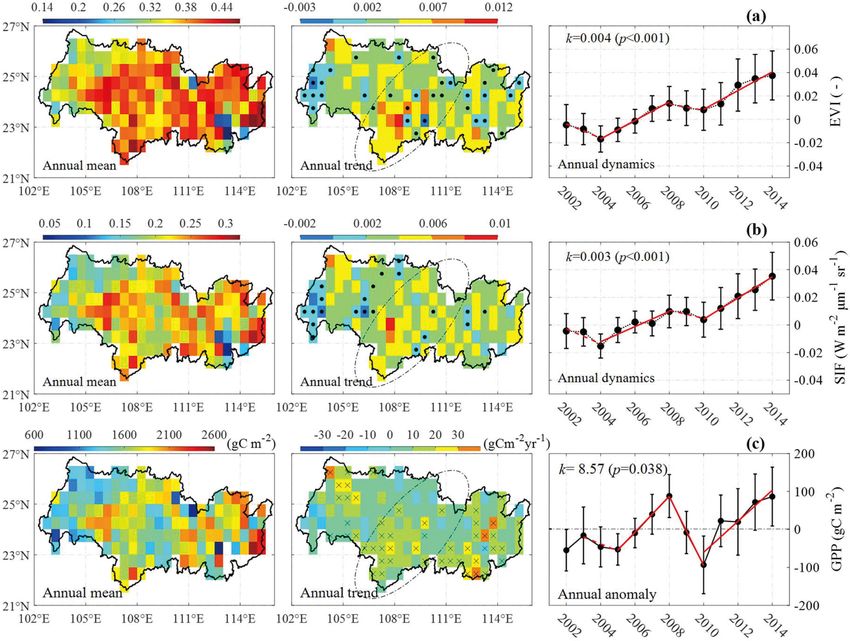
Figure 4. Spatial distribution of mean annual values, linear trends, and temporal dynamics for (a) enhanced vegetation index (EVI), (b) solar-
induced chlorophyll fluorescence (SIF), and (c) gross primary production (GPP) during hydrologic years 2002–2014. Red lines show the
annual trends in different periods. Dashed red lines show statistically insignificant trends (p > 0.05). The ellipse marks the areas where
croplands dominate. Black dots indicate p > 0.05 for the trend in the relevant pixels, and black crosses indicate p < 0.05 for the trend in the
relevant pixels.
agricultural region and upland grassland). The GPP anomaly
also showed positive high values in the central southern ar-
eas dominated by croplands coincident with EVI and the SIF
anomaly. It should be noted that the trends were statistically
significant only in 33.6 % of all pixels, many of which are lo-
cated in the cropland areas. Over the entire basin, annual GPP
showed almost the same periodical decreasing and increas-
ing trends as EVI and SIF, except that the first turning point
occurred in 2005 rather than 2004. Linear regression gave a
coefficient of determination R 2 = 0.44 (p = 0.014) between
annual TWSA and EVI and of R 2 = 0.41 (p = 0.019) be-
tween TWSA and SIF, both higher than that between TWSA
and GPP (R 2 = 0.23; p = 0.099), which may imply a more
direct and stronger dependence on vegetation greenness than Figure 5. Coefficient of determination (R 2 ) from linear regressions
productivity on water storage at an annual scale. between the basin-averaged anomalies of P , TWS, AI, EVI, SIF,
and GPP at the annual scale. The asterisk indicates p < 0.05.
Hydrol. Earth Syst. Sci., 25, 4741–4758, 2021 https://doi.org/10.5194/hess-25-4741-2021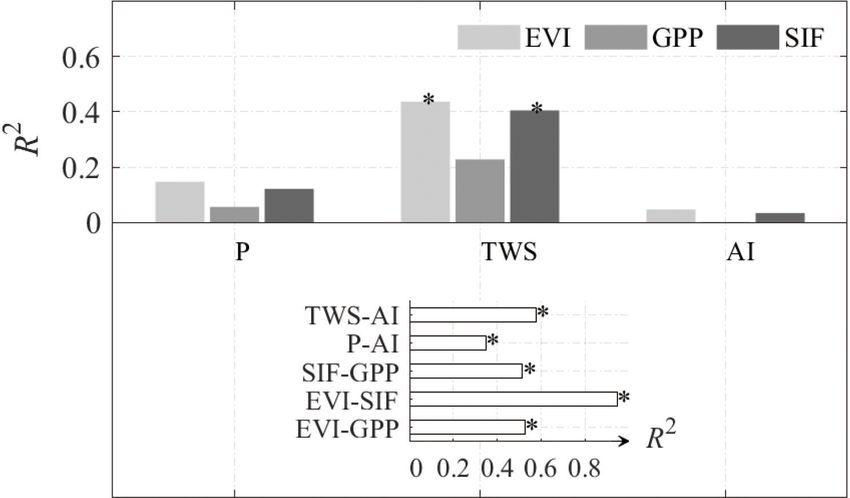
H. Wang et al.: Assessing large-scale plant–water relations in the humid, subtropical Pearl River basin                                   4749

Figure 6. Pearson correlation coefficient between annual anomalies of (a1 –a3 ) precipitation, EVI, GPP, and SIF, (b1 –b3 ) total water storage,
EVI, GPP, and SIF, and (c1 –c2 ) aridity index, EVI, GPP, and SIF. The ellipse marks the areas where croplands dominate. Crosses (black and
white) indicate p < 0.05.

3.3   Interactions between hydroclimate and vegetation                    ductivity on a yearly basis, and the water constraint on veg-
                                                                          etation was stronger than that of dryness. It should be noted
                                                                          again that, due to the intrinsic resolution of GRACE satellite
Combining Figs. 2–4, we found that climate condition, wa-                 imaging, the pixel-wise calculation of the correlation coeffi-
ter storage, and vegetation dynamics are tightly interlinked.             cient between TWSA and the other parameters cannot nec-
The coefficient of determination between anomalies of these               essarily accurately represent their quantitative relationships
variables (Fig. 5) shows that the variation in annual EVI can             and, therefore, should be interpreted with caution. Here we
be explained by TWS by 43.7 % (p = 0.014), followed by P                  kept the figure with the intention of finding the possible hot
(14.7 %; p = 0.196) and AI (4.6 %; p = 0.479). The influ-                 spots of intensive interactions.
ence of these three variables on GPP and SIF followed the                    At the monthly scale, over the entire basin, the linear re-
same order (R 2 = 0.23, 0.06, and 0.02 for GPP; R 2 = 0.41,               sponses of GPP to P and TWS were slightly weaker than
0.12, and 0.03 for SIF) but was not statistically significant             the linear responses of EVI and SIF to P and TWS (Fig. 7a
(p > 0.05, except for TWS and SIF). In addition, GPP was                  and b). The response of both EVI, SIF, and GPP to P was
positively associated with EVI and SIF (R 2 = 0.53 and p =                more nonlinear than to TWS, and the sensitivity of EVI, SIF,
0.005; R 2 = 0.51 and p = 0.006). SIF and EVI are corre-                  and GPP to TWS was all stronger than to P , as indicated
lated the highest among the three vegetation parameters with              by the linear regression slopes, implying a stronger link be-
a R 2 = 0.95 (p < 0.001). P and TWS were negatively cor-                  tween vegetation growth and water storage than precipita-
related with dryness (p < 0.05).                                          tion. Meanwhile, an increase in dryness resulted in strong
   Spatially, precipitation, water storage, and dryness af-               nonlinear decreases in all vegetation parameters (Fig. 7c).
fected vegetation in a similar way compared to temporal                   The relationships show that although precipitation is the
characteristics, i.e., the influence of TWS was relatively                main water input to the terrestrial hydrological cycle, it is
stronger than P and AI. The hot spots of the interactions                 how much water is stored in the soils that determines vegeta-
were found in the middle–south areas, and dryness more neg-               tion greenness and biomass production, and the atmospheric
atively affected greenness than productivity in these areas               constraints on vegetation are more complex than water sup-
(Fig. 6). Atmospheric stress and water stress imposed a more              ply. Nonlinear plant–water relationships can be explained by
direct and stronger impact on vegetation greenness than pro-

https://doi.org/10.5194/hess-25-4741-2021                                                Hydrol. Earth Syst. Sci., 25, 4741–4758, 2021
4750 H. Wang et al.: Assessing large-scale plant–water relations in the humid, subtropical Pearl River basin
the lag effect in that the monthly changes in EVI, SIF, and ern upland with grass cover and the central southern areas
GPP fell behind the changes of P and TWS to varying de- of croplands. Over the 13 hydrological years, EVI and GPP
grees (Fig. 8). Based on our assumption, it is more likely that have increased significantly by 0.004 (unitless; p < 0.001)
the decline in water resources deteriorates vegetation green- and 8.57 gC m2 yr−1 (p = 0.038), respectively, with periodic
ness and productivity, not the opposite. This means that the decreasing and increasing tendencies. Unlike the north of
leading role of water availability on vegetation growth out- China where vegetation cover has been deeply affected and
weighed the impacts of vegetation growth on water resources is largely recovered through decades of ecological restora-
reduction. tion projects (Chen et al., 2019; Feng et al., 2005), vegetation
Vegetation response to hydroclimate changes is expected cover, especially the forest cover, which occupies most of the
to differ in dry and wet years. Here, we assumed that the PRB remained near-constant from the early 2000s – at least
annual anomalies of TWS < 0, EVI < 0, and AI > 0 corre- in the Guangdong province located in the east of the basin
sponded to dry conditions and, hence, defined 2003, 2005, (Chen et al., 2015). We identified the areas with a significant
2007, 2009, and 2011 as dry years and 2002, 2006, 2008, increase in the vegetation parameters in the central southern
2010, and 2012–2014 as relatively wet years. There was ev- region of the basin where croplands dominate. The changes
idence of drought occurrences in these dry years (Lin et al., in TWS, EVI, SIF, and GPP jointly imply that the water stor-
2017; J. Wang et al., 2014). It can be seen that the dry and age increase in this hot spot region, which was likely induced
wet years were mainly differentiated by the rainfall data in by increased precipitation, coincides with the intensification
spring–summer months, resulting in obviously lower water of agricultural activities and has boosted the food produc-
storage and higher dryness in autumn–winter in dry years tion since the early 2000s. That is, the intensive vegetation
than wet years. Noticeably, although the hydroclimate con- greening most likely was not only induced by natural hy-
ditions differed greatly, the vegetation parameters showed droclimatic changes but was also intervened by agricultural
similar patterns and ranges (Fig. 8c and d). While the max- activities such as planting structure adjustment and irriga-
imum and minimum GPP was slightly higher (14.9 %) and tion during dry spells. Tong et al. (2018) showed that veg-
lower (14.3 %) in dry years than wet years, respectively, the etation greenness and aboveground biomass production have
EVI and SIF did not show such distinct differences (< 5 %). increased in southwestern China despite drought conditions.
This implies that vegetation greenness is less sensitive to any The increases have been attributed largely to land use type
changes in hydroclimate than productivity, and that GPP dur- conservation, mainly through ecological engineering such as
ing dry periods was relatively higher than that in wet periods, reforestation, etc. Their study area partly overlapped with
reflecting a positive effect of water stress on biomass produc- this study, and their results support our speculation indirectly
tion, but this could be mainly attributed to anthropogenic in- that the agricultural activities in this cultivated area have in-
tervention such as probable water surplus via irrigation dur- tensified and thus enhanced vegetation growth. Changes in
ing dry periods. planting structure in these agricultural areas could also re-
Figure 9 gives the R 2 from the linear regression between sult in enhanced greenness and improved productivity com-
the monthly climatological means of different variables con- pared to the traditional cultivated crops, but this cannot be
sidering phase shift for lag analysis over all the years, dry quantified without detailed crop data throughout the years.
years, and wet years, respectively. It shows EVI, SIF, and Nonetheless, such phenomenon is, for the first time, revealed
GPP varied strongest with P , TWSA and AI in the previ- in studies, and it can be meaningful for the food–water man-
ous 1, 0, and 1 month, respectively. Comparison of the lag agement in this region and indicative of a possible expansion
time in dry and wet years shows that the influence of P of China’s main food production from the north to the south
on vegetation was more prominent in wet years than in dry in the context of water and energy richness in the south and
years, while TWS influence was greater in dry years than shortages in the north (Kuang et al., 2015).
wet years. There was high consistency between the vegeta-
tion change and water storage change with zero lags, in com- 4.2 Interactive roles of water supply, demand, and
parison to 1-month lag between vegetation parameters and vegetation changes
precipitation. Moreover, the response of GPP and SIF to dry-
ness change was 1 month slower in dry years than wet years. The overall TWS increase is promising for the managers and
users of water resources in the PRB; however, the strong cor-
relation with precipitation seasonality restrained the avail-
4 Discussion able water in the relatively dry periods, which would raise
concerns on water shortage under drought conditions. In fact,
4.1 Hot spot for hydroclimate and vegetation changes previous studies have reported the contribution and restric-
tion of P to TWS. For instance, Chen et al. (2017) revealed
The three investigated vegetation parameters shared the same the liability of P to TWS (r = 0.78) in the PRB. Mo et
spatial patterns and high GPP corresponded to high EVI and al. (2016) found TWS more strongly explained (60 %) by
SIF in the forested areas; low values existed in the west- annual P in river basins in southern China than in northern
Hydrol. Earth Syst. Sci., 25, 4741–4758, 2021 https://doi.org/10.5194/hess-25-4741-2021H. Wang et al.: Assessing large-scale plant–water relations in the humid, subtropical Pearl River basin 4751 Figure 7. Scatterplot of monthly anomalies of precipitation (P ), total water storage (TWS), aridity index (AI), enhanced vegetation in- dex (EVI), solar-induced chlorophyll fluorescence (SIF), and gross primary production (GPP) over the entire basin. Each point represents a basin-wide averaged monthly data. Figure 8. (a, b) Monthly variations in anomalies of precipitation (P ), total water storage (TWS), aridity index (AI; scaled for a better view), enhanced vegetation index (EVI), gross primary production (GPP), and solar-induced chlorophyll fluorescence (SIF) in all years. (c) Monthly climatological means of the variables in dry hydrological years and (d) monthly climatological means in wet hydrological years during 2002–2014. Plots (c) and (d) share the same units and legends with plots (a) and (b). Shaded areas show the standard errors of each variable representing the spatial variability. https://doi.org/10.5194/hess-25-4741-2021 Hydrol. Earth Syst. Sci., 25, 4741–4758, 2021
4752              H. Wang et al.: Assessing large-scale plant–water relations in the humid, subtropical Pearl River basin

Figure 9. Coefficient of determination between monthly climatological means of the anomalies of precipitation (P ), total water stor-
age (TWS), aridity index (AI), enhanced vegetation index (EVI), solar-induced chlorophyll fluorescence (SIF), and gross primary pro-
duction (GPP) in (a) all years, (b) the dry years, and (c) the wet years after shifting a different number of months, as indicated in the
legend.

China. In this sense, storage shortage in dry periods subject to       was slightly higher in the growing seasons in dry years than
seasonal reduction in precipitation would hamper vegetation            wet years. These comparisons may imply that a certain de-
greening. Analysis in this study shows that EVI was highly             gree of drying can stimulate biomass production. This phe-
correlated with TWS and P at the annual scale, consistent              nomenon is also revealed by other studies (Zhang and Zhang,
with previous studies in the PRB and other areas (Guan et              2019). The underlying mechanisms could be similar to the
al., 2015; Zhao et al., 2016; Zhu et al., 2018), while at the          principle of regulated irrigation in agricultural practice to in-
monthly scale EVI, SIF, and GPP were all strongly associated           crease water use efficiency under a certain degree of water
with TWS but slightly less strongly with P . The differences           stress (Chai et al., 2016), or that the atmospheric conditions
in EVI and GPP response to hydroclimate variables may lie              are more favorable for photosynthesis during dry years than
in the way these two parameters are calculated, especially             wet years (Restrepo-Coupe et al., 2013; Zhang and Zhang,
given that GPP is formulated by atmospheric variables like             2019), provided that the soil water or groundwater storage is
temperature, vapor pressure deficit, and photosynthetically            not depleted severely in these dry years. This dryness effect
active radiation (Pei et al., 2020). Because of the asynchrony         on ecosystem productivity cannot be detected in the annual
in the atmospheric variables and vegetation greenness (Kong            scale assessment (Brookshire and Weaver, 2015; Yao et al.,
et al., 2020; Piao et al., 2006), the GPP and EVI would also           2020). These results imply that pre-growing season hydro-
have some inconsistency in time. This would then further in-           climate conditions play a key role in the follow-on vegeta-
dicate that it should be given more caution when choosing a            tion growth and production (Kong et al., 2020; Piao et al.,
parameter (EVI, NDVI, SIF, or GPP) to better represent veg-            2006; Wang et al., 2019), and that vegetation dynamics are
etation phenological features, which is still lacking in the lit-      subject not only to atmospheric changes but also water re-
erature for discussion (Kong et al., 2020; Wang et al., 2020).         source availability even in this humid subtropical radiation-
The weakened linear influence of P on vegetation parame-               and rain-abundant region, while vegetation development is
ters at the monthly scale, found also by others such as Bai            not dominant in reducing water availability. The causal role
et al. (2019) and A et al. (2017), can be explained by the lag         of vegetation in water decline has been reported mostly at a
effect in that EVI, SIF, and GPP lagged by 1 and 0 months              shorter timescale, like daily or sub-daily, such as the studies
after P and TWS, respectively.                                         in a poplar stand in northwestern China (Shen et al., 2015),
   Comparison of the plant–water relations in dry and wet              a pine-dominated catchment in Sierra Nevada, USA (Kirch-
years showed a slower response of GPP to aridity index in              ner et al., 2020), and a mixed forest in the Czech Republic
dry years than wet years. A Wilcoxon rank sum test shows               (Deutscher et al., 2016), which demonstrated that sap flow
that the areal mean EVI and GPP in dry years are not sig-              by trees led to decline in groundwater level and streamflow.
nificantly different from those in wet years. In fact, GPP

Hydrol. Earth Syst. Sci., 25, 4741–4758, 2021                                           https://doi.org/10.5194/hess-25-4741-2021
H. Wang et al.: Assessing large-scale plant–water relations in the humid, subtropical Pearl River basin                            4753

   The drying episodes confined the vegetation greenness           lating role of a certain degree of drying on vegetation pro-
and production. Y. Liu et al. (2014) reported that China’s         duction. Therefore, essentially the vegetation growth in this
national total annual net ecosystem productivity exhibited         subtropical humid region is more strongly controlled by at-
declines during 2000–2011, mainly due to the reduction             mospheric demand factors than water supply factors at the
in GPP caused by extensive drought. Although drought is            monthly scale. This study reveals the changes in and inter-
generally associated with declines in vegetation greenness         play between plants and water, using readily available remote
and productivity due to water and heat stresses (Eamus et          sensing and assimilated data, and has implications for proper
al., 2013), the magnitude of vegetation reduction, deter-          measures regarding land use alterations to mitigate frequent
mined by ecosystem sensitivity to drought, can vary dra-           drought impacts on water resources and ecosystems under a
matically across plant communities and, thus, show different       warming climate.
spatial patterns relative to different vegetation types. While
Q. Zhang et al. (2017) detected insensitivity of vegetation to
droughts in humid southern China, including the lower reach        Data availability. The original data in the study are freely available
of PRB, this study observed that EVI experienced a recovery        from the links given in Table 1.
in 2004–2005 after drought in the previous year, which may
be a result of irrigation during drought in the agricultural re-
gions since forests are more resilient to droughts (DeSoto et      Supplement. The supplement related to this article is available on-
al., 2020; Fang and Zhang, 2019). Future climate projections       line at: https://doi.org/10.5194/hess-25-4741-2021-supplement.
predict increases in temperature and insignificant changes in
precipitation in the basin which would trigger more heat-
                                                                   Author contributions. HW conceptualized the study, developed the
wave-induced flash droughts (Li et al., 2020). This would
                                                                   methodology, wrote the original draft, and reviewed and edited the
likely enhance the atmospheric controls on vegetation de-
                                                                   paper. KD developed the methodology and reviewed and edited the
velopment. To mitigate the impacts on both water resources         paper with BL and XC, who also validated the study.
and ecosystems, proper plans should be made, such as the
conversion of the low resilient ecosystems to forests (Fang
and Zhang, 2019; Tong et al., 2018) and the improvement of         Competing interests. The authors declare that they have no conflict
biodiversity in ecosystems (Isbell et al., 2015; Oliver et al.,    of interest.
2015), in addition to engineering regulations like reservoir
operations (Lin et al., 2017).
                                                                   Disclaimer. Publisher’s note: Copernicus Publications remains
                                                                   neutral with regard to jurisdictional claims in published maps and
5   Conclusions                                                    institutional affiliations.

Plant–water relations over the Pearl River basin were ex-
amined using remote sensing products during the hydrolog-          Acknowledgements. We thank the editor, Patricia Saco, for han-
ical years of 2002–2014. Results show that water storage           dling our paper, and Qiang Zhang and two anonymous reviewers
has increased across the entire basin at an average rate of        for their invaluable comments and suggestions to improve the pa-
                                                                   per.
5.9 mm yr−1 . Vegetation greenness and productivity has also
shown some changes, with significant increases concentrated
in the cultivated lands. Spatial characterization reveals that
                                                                   Financial support. This research has been supported by the Guang-
the central southern areas of the basin dominated by crop-         dong Provincial Department of Science and Technology, China
lands are the hot spots for the changes in and interactions        (grant no. 2019ZT08G090), the Open Research Fund of State Key
between hydroclimate and vegetation. This implies that an          Laboratory of Simulation and Regulation of Water Cycle in River
increase in vegetation is not only a result of natural hydro-      Basin, China (grant no. IWHR-SKL-201920), and the National Nat-
climatic controls but also anthropogenic interventions such        ural Science Foundation of China, China (grant no. 51909285).
as securing food production by the intensification of agri-
cultural activities in these areas. Lag effect analysis at the
monthly scale reflects that, even in this rain-abundant sub-       Review statement. This paper was edited by Patricia Saco and re-
tropical basin, the water supply dominance on vegetation dy-       viewed by two anonymous referees.
namics precedes the water resource reduction by vegetation
development. Furthermore, a stronger influence of precipita-
tion and a weaker influence of water storage on vegetation
were found in wet years than dry years. A slower response
of vegetation productivity to the aridity index in dry years
than wet years was identified, which may indicate a stimu-

https://doi.org/10.5194/hess-25-4741-2021                                        Hydrol. Earth Syst. Sci., 25, 4741–4758, 2021
4754 H. Wang et al.: Assessing large-scale plant–water relations in the humid, subtropical Pearl River basin
References within the Pearl River Delta, China, Quatern. Int., 226, 44–53,
https://doi.org/10.1016/j.quaint.2009.08.014, 2010.
Chen, Z., Jiang, W., Wu, J., Chen, K., Deng, Y., Jia, K., and
A, G., Velicogna, I., Kimball, J. S., Du, J., Kim, Y., Colliander, A., Mo, X.: Detection of the spatial patterns of water storage
and Njoku, E.: Satellite-observed changes in vegetation sensitiv- variation over China in recent 70 years, Sci. Rep., 7, 1–9,
ities to surface soil moisture and total water storage variations https://doi.org/10.1038/s41598-017-06558-5, 2017.
since the 2011 Texas drought, Environ. Res. Lett., 12, 054006, Deng, S., Chen, T., Yang, N., Qu, L., Li, M., and Chen, D.: Spatial
https://doi.org/10.1088/1748-9326/aa6965, 2017. and temporal distribution of rainfall and drought characteristics
Adhami, M., Sadeghi, S. H., Duttmann, R., and Sheikhmoham- across the Pearl River basin, Sci. Total Environ., 619–620, 28–
mady, M.: Changes in watershed hydrological behavior due 41, https://doi.org/10.1016/j.scitotenv.2017.10.339, 2018.
to land use comanagement scenarios, J. Hydrol., 577, 124001, Déry, S. J. and Wood, E. F.: Decreasing river discharge
https://doi.org/10.1016/j.jhydrol.2019.124001, 2019. in northern Canada, Geophys. Res. Lett., 32, 1–4,
Anderson, M. C., Kustas, W. P., and Norman, J. M.: Up- https://doi.org/10.1029/2005GL022845, 2005.
scaling and Downscaling – A Regional View of the Soil- DeSoto, L., Cailleret, M., Sterck, F., Jansen, S., Kramer, K., Robert,
Plant-Atmosphere Continuum, Agron. J., 95, 1408–1423, E. M. R., Aakala, T., Amoroso, M. M., Bigler, C., Camarero,
https://doi.org/10.2134/agronj2003.1408, 2003. J. J., Čufar, K., Gea-Izquierdo, G., Gillner, S., Haavik, L. J.,
Aranda, I., Forner, A., Cuesta, B., and Valladares, F.: Hereş, A. M., Kane, J. M., Kharuk, V. I., Kitzberger, T., Klein,
Species-specific water use by forest tree species: From T., Levanič, T., Linares, J. C., Mäkinen, H., Oberhuber, W., Pa-
the tree to the stand, Agr. Water Managr., 114, 67–77, padopoulos, A., Rohner, B., Sangüesa-Barreda, G., Stojanovic,
https://doi.org/10.1016/j.agwat.2012.06.024, 2012. D. B., Suárez, M. L., Villalba, R., and Martínez-Vilalta, J.: Low
Asbjornsen, H., Goldsmith, G. R., Alvarado-Barrientos, M. S., growth resilience to drought is related to future mortality risk
Rebel, K., Van Osch, F. P., Rietkerk, M., Chen, J., Gotsch, S., in trees, Nat. Commun., 11, 1–9, https://doi.org/10.1038/s41467-
Tobón, C., Geissert, D. R., Gómez-Tagle, A., Vache, K., and 020-14300-5, 2020.
Dawson, T. E.: Ecohydrological advances and applications in Deutscher, J., Kupec, P., Dundek, P., Holík, L., Machala, M.,
plant-water relations research: A review, J. Plant Ecol., 4, 3–22, and Urban, J.: Diurnal dynamics of streamflow in an upland
https://doi.org/10.1016/j.soildyn.2016.02.004, 2011. forested micro-watershed during short precipitation-free periods
Bai, J., Shi, H., Yu, Q., Xie, Z., Li, L., Luo, G., Jin, N., is altered by tree sap flow, Hydrol. Process., 30, 2042–2049,
and Li, J.: Satellite-observed vegetation stability in re- https://doi.org/10.1002/hyp.10771, 2016.
sponse to changes in climate and total water storage Eamus, D. and Froend, R.: Groundwater-dependent ecosystems:
in Central Asia, Sci. Total Environ., 659, 862–871, The where, what and why of GDEs, Aust. J. Bot., 54, 91–96,
https://doi.org/10.1016/j.scitotenv.2018.12.418, 2019. https://doi.org/10.1071/BT06029, 2006.
Blaschke, P., Hicks, D., and Meister, A.: Quantification of the Flood Eamus, D., Boulain, N., Cleverly, J., and Breshears, D. D.:
and Erosion Reduction Benefits, and Costs, of Climate Change Global change-type drought-induced tree mortality: Vapor pres-
Mitigation Measures in New Zealand, Wellington, available at: sure deficit is more important than temperature per se in
https://environment.govt.nz/ (last access: 27 April 2020), 2008. causing decline in tree health, Ecol. Evol., 3, 2711–2729,
Brookshire, E. N. J. and Weaver, T.: Long-term decline in grassland https://doi.org/10.1002/ece3.664, 2013.
productivity driven by increasing dryness, Nat. Commun., 6, 1– Fang, O. and Zhang, Q. Bin: Tree resilience to drought increases
7, https://doi.org/10.1038/ncomms8148, 2015. in the Tibetan Plateau, Global Change Biol., 25, 245–253,
Brown, A. E., Zhang, L., McMahon, T. A., Western, A. https://doi.org/10.1111/gcb.14470, 2019.
W., and Vertessy, R. A.: A review of paired catch- Feng, Z., Yang, Y., Zhang, Y., Zhang, P., and Li, Y.:
ment studies for determining changes in water yield result- Grain-for-green policy and its impacts on grain sup-
ing from alterations in vegetation, J. Hydrol., 310, 28–61, ply in West China, Land Use Policy, 22, 301–312,
https://doi.org/10.1016/j.jhydrol.2004.12.010, 2005. https://doi.org/10.1016/j.landusepol.2004.05.004, 2005.
Chai, Q., Gan, Y., Zhao, C., Xu, H. L., Waskom, R. M., Niu, Y., Fowler, M. D., Kooperman, G. J., Randerson, J. T., and Pritchard,
and Siddique, K. H. M.: Regulated deficit irrigation for crop pro- M. S.: The effect of plant physiological responses to rising
duction under drought stress. A review, Agron. Sustain. Dev., 36, CO2 on global streamflow, Nat. Clim. Change, 9, 873–879,
1–21, https://doi.org/10.1007/s13593-015-0338-6, 2016. https://doi.org/10.1038/s41558-019-0602-x, 2019.
Chen, C., Park, T., Wang, X., Piao, S., Xu, B., Chaturvedi, R. K., Gao, X.: Actual Evapotranspiration in the Pearl River Basin: Es-
Fuchs, R., Brovkin, V., Ciais, P., Fensholt, R., Tømmervik, H., timation, Spatio-Temporal Variations and Climatic Sensitivities,
Bala, G., Zhu, Z., Nemani, R. R., and Myneni, R. B.: China and The Chinese University of Hong Kong, Hong Kong, 2010.
India lead in greening of the world through land-use manage- Ghestem, M., Sidle, R. C., and Stokes, A.: The Influ-
ment, Nat. Sustain., 2, 122–129, https://doi.org/10.1038/s41893- ence of Plant Root Systems on Subsurface Flow: Im-
019-0220-7, 2019. plications for Slope Stability, Bioscience, 61, 869–879,
Chen, X., Liu, X., Zhou, G., Han, L., Liu, W., and Liao, J.: 50-year https://doi.org/10.1525/bio.2011.61.11.6, 2011.
evapotranspiration declining and potential causations in subtropi- Guan, K., Pan, M., Li, H., Wolf, A., Wu, J., Medvigy, D.,
cal Guangdong province, southern China, Catena, 128, 185–194, Caylor, K. K., Sheffield, J., Wood, E. F., Malhi, Y., Liang,
https://doi.org/10.1016/j.catena.2015.02.001, 2015. M., Kimball, J. S., Saleska, S. R., Berry, J., Joiner, J., and
Chen, Y. D., Zhang, Q., Xu, C. Y., Lu, X., and Zhang, S.: Lyapustin, A. I.: Photosynthetic seasonality of global tropical
Multiscale streamflow variations of the Pearl River basin
and possible implications for the water resource management
Hydrol. Earth Syst. Sci., 25, 4741–4758, 2021 https://doi.org/10.5194/hess-25-4741-2021You can also read