North Atlantic marine biogenic silica accumulation through the early to middle Paleogene: implications for ocean circulation and silicate ...
←
→
Page content transcription
If your browser does not render page correctly, please read the page content below
Clim. Past, 17, 1937–1954, 2021
https://doi.org/10.5194/cp-17-1937-2021
© Author(s) 2021. This work is distributed under
the Creative Commons Attribution 4.0 License.

North Atlantic marine biogenic silica accumulation through
the early to middle Paleogene: implications for ocean
circulation and silicate weathering feedback
Jakub Witkowski1 , Karolina Bryłka2 , Steven M. Bohaty3 , Elżbieta Mydłowska4 , Donald E. Penman5 , and
Bridget S. Wade6
1 Institute of Marine and Environmental Sciences, University of Szczecin, ul. Mickiewicza 18, 70-383 Szczecin, Poland
2 Department    of Geology, Faculty of Science, Lund University, Sölvegatan 12, Lund, Sweden
3 Schoool of Ocean and Earth Science, National Oceanography Centre Southampton, University of Southampton,

Waterfront Campus, European Way, Southampton SO14 3ZH, UK
4 Institute of Spatial Management and Socio-Economic Geography, ul. Mickiewicza 18, 70-383 Szczecin, Poland
5 Department of Geosciences, Utah State University, 4505 Old Main Hill, Logan, UT 84322, USA
6 Department of Earth Sciences, University College London, Gower Street, London WC1E 6BT, UK

Correspondence: Jakub Witkowski (jakub.witkowski@usz.edu.pl)

Received: 26 April 2021 – Discussion started: 12 May 2021
Revised: 28 August 2021 – Accepted: 31 August 2021 – Published: 29 September 2021

Abstract. The Paleogene history of biogenic opal accu-             the Norwegian–Greenland Sea at ∼ 49 Ma. Reduced bio SiO2
mulation in the North Atlantic provides insight into both          flux in the North Atlantic, in combination with increased
the evolution of deepwater circulation in the Atlantic basin       bio SiO2 flux documented in existing records from the equa-
and weathering responses to major climate shifts. However,         torial Pacific between ∼ 42 and 38 Ma, is interpreted to in-
existing records are compromised by low temporal resolu-           dicate diminished nutrient supply and reduced biosiliceous
tion and/or stratigraphic discontinuities. In order to address     productivity at Blake Nose in response to weakening of the
this problem, we present a multi-site, high-resolution record      overturning circulation. Subsequently, in the late Eocene, a
of biogenic silica (bio SiO2 ) accumulation from Blake Nose        deepwater circulation regime favoring limited bio SiO2 burial
(ODP Leg 171B, western North Atlantic) spanning the early          in the Atlantic and enhanced bio SiO2 burial in the Pacific
Paleocene to late Eocene time interval (∼ 65–34 Ma). This          was established after ∼ 38 Ma, likely in conjunction with re-
record represents the longest single-locality history of marine    invigoration of deepwater export from the North Atlantic.
bio SiO2 burial compiled to date and offers a unique perspec-      We also observe that Blake Nose bio SiO2 fluxes through the
tive into changes in bio SiO2 fluxes through the early to middle   middle Eocene cooling interval (∼ 48 to 34 Ma) are simi-
Paleogene extreme greenhouse interval and the subsequent           lar to or higher than background fluxes throughout the late
period of long-term cooling. Blake Nose bio SiO2 fluxes dis-       Paleocene–early Eocene interval (∼ 65 to 48 Ma) of intense
play prominent fluctuations that we attribute to variations in     greenhouse warmth. This observation is consistent with a
sub-thermocline nutrient supply via cyclonic eddies associ-        temporally variable rather than constant silicate weathering
ated with the Gulf Stream. Following elevated and pulsed           feedback strength model for the Paleogene, which would in-
bio SiO2 accumulation through the Paleocene to early Eocene        stead predict that marine bio SiO2 burial should peak during
greenhouse interval, a prolonged interval of markedly ele-         periods of extreme warming.
vated bio SiO2 flux in the middle Eocene between ∼ 46 and
42 Ma is proposed to reflect nutrient enrichment at Blake
Nose due to invigorated overturning circulation following
an early onset of Northern Component Water export from

Published by Copernicus Publications on behalf of the European Geosciences Union.
1938                                                 J. Witkowski et al.: Paleogene North Atlantic biogenic silica accumulation

1   Introduction                                                    al., 2017). Testing this assumption using the diatom fos-
                                                                    sil record is problematic due to the vulnerability of diatom
Biogenic silica (bio SiO2 ) secretion by marine plankton and        bio SiO2 to diagenetic alteration (see Witkowski et al., 2020b,
the subsequent accumulation of biosiliceous marine sedi-            for a discussion and references). Thus, most interpretations
ments represent the main output flux in the global silicon          concerning the long-term silicon availability impact on ma-
cycle (Tréguer and De La Rocha, 2013). The present-day sil-         rine diatom production, as well as most scenarios for the
icon cycle is also closely linked to the carbon cycle because       timing of diatom rise to ecological prominence, are based
diatoms – the most successful and efficient bio SiO2 -secreting     on a range of indirect evidence, including modeling, isotope
plankton group in the modern oceans – are also the key ma-          (bio)geochemistry, statistical treatment of large databases,
rine primary producers, responsible for up to 40 % of total         and insights from other biosilicifying groups (for a recent
global net photosynthesis per year (Smetacek, 1999). Ow-            synthesis, see Hendry et al., 2018).
ing to the ballast effect of their siliceous valves, diatoms are        In the modern oceans, deepwater circulation also ex-
extremely efficient at exporting organic carbon (Corg ) from        erts a major control on marine bio SiO2 accumulation pat-
the surface to the deep ocean and facilitating Corg burial in       terns throughout the ocean basins. Firstly, ocean circula-
marine sediments (Yool and Tyrrell, 2003). This relationship        tion determines the distribution and concentration of limiting
between the silicon and carbon cycles has profound impli-           macronutrients (N, P, dissolved Si) in deep waters and their
cations for understanding climate change on both long and           upwelling into surface waters where they fuel primary pro-
short timescales in the past, founded on the premise that           duction, and, secondly, circulation impacts bio SiO2 preserva-
sedimentary bio SiO2 mass accumulation rates (fluxes) rep-          tion in seafloor sediments (Ragueneau et al., 2000). Most of
resent the rate of bio SiO2 burial and, importantly, that the       the present-day biosiliceous production is focused along con-
burial rate reflects bio SiO2 production in surface waters at the   tinental margins in areas where diatoms can take advantage
time of deposition (Ragueneau et al., 2000; Yool and Tyrrell,       of nutrients supplied from continental runoff and coastal up-
2005).                                                              welling (Malviya et al., 2016). A large proportion of bio SiO2 ,
    One fundamental control on marine siliceous plankton            however, is recycled even before settling out of the photic
production is the amount of dissolved silicon supplied to the       zone (Van Cappellen et al., 2002), since the modern oceans
oceans from terrestrial silicate weathering, a chemical pro-        are undersaturated with respect to SiO2 at all depths. Only
cess that ultimately consumes atmospheric CO2 and releases          a fraction of bio SiO2 produced in the photic zone therefore
silicic acid and alkalinity to the oceans (i.e., when combined      reaches the ocean floor, and, furthermore, only a fraction of
with carbonate burial in the oceans; Walker et al., 1981;           the exported bio SiO2 is incorporated into sediments and pre-
Fontorbe et al., 2020; Penman et al., 2020). By moderating          served (Frings, 2017).
atmospheric CO2 , the silicate weathering feedback is postu-            Both the strength of the silicate weathering feedback and
lated to operate as a thermostat, maintaining the Earth’s sur-      ocean circulation patterns are believed to have undergone
face within a habitable range of temperatures since early in        profound changes through the early to middle Paleogene
geological history (Kasting, 2019). In today’s rapidly warm-        as the Earth transitioned from a hothouse, ice-free climate
ing world, an accurate understanding of the operation of sil-       state (e.g., Zachos et al., 2008; Kirtland-Turner et al., 2014;
icate weathering as a climate feedback mechanism is essen-          Anagnostou et al., 2016) to an icehouse climate marked
tial.                                                               by continental-scale ice sheets (Zachos et al., 2001; Miller
    Past transient greenhouse warming events, such as the           et al., 2020). Isotopic weathering proxies (87 Sr/86 Sr and
“hyperthermal” events of the early to middle Paleogene              δ 7 Li) display a broad minimum spanning the late Paleocene
(Paleocene and Eocene epochs; ∼ 66–34 Ma), offer ancient            through early Eocene interval (Misra and Froelich, 2012),
points of comparison for the present-day warming and future         which have been interpreted to indicate either flat continental
climate scenarios. Existing studies suggest that Paleogene          relief through this period (and thus reduced rates of continen-
bio SiO2 accumulation patterns are directly linked to varia-        tal runoff; Froelich and Misra, 2015) or evidence for a vari-
tions in continental weathering on both long (Muttoni and           able strength of the negative feedback between climate and
Kent, 2007; Cermeño et al., 2015; Renaudie, 2016) and short         silicate weathering (Caves et al., 2016). Sea level fall associ-
(Witkowski et al., 2014; Penman, 2016; Penman et al., 2019)         ated with the onset of the Antarctic glaciation at the Eocene–
timescales. Additionally, large volumes of diatomite and            Oligocene transition (EOT) (Zachos et al., 1996) and the in-
diatom-rich clays deposited on continental shelves during the       tensification of the Himalayan orogeny are also thought to
early Paleogene (e.g., Oreshkina and Aleksandrova, 2007)            have altered the dominant weathering regime by facilitating
suggest that the supply of dissolved silicon from continen-         physical rather than chemical weathering and by exposing
tal weathering under greenhouse climates exerted a strong           large volumes of fresh rock to erosion and weathering (Cer-
influence on marine bio SiO2 accumulation. These interpre-          meño et al., 2015).
tations are based on an assumption that diatoms were al-                The early Cenozoic was a time of low thermal gradi-
ready key players in global silicon and carbon cycling in           ents between surface and deep waters and between high and
the early Cenozoic (see Fontorbe et al., 2016; Conley et            low latitudes, which limited vigorous overturning circula-

Clim. Past, 17, 1937–1954, 2021                                                        https://doi.org/10.5194/cp-17-1937-2021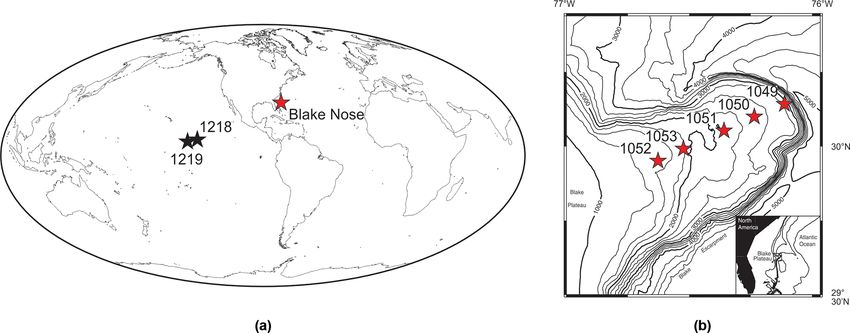
J. Witkowski et al.: Paleogene North Atlantic biogenic silica accumulation                                                 1939

tion (Moore et al., 2008; Vahlenkamp et al., 2018). There is,    lantic and on the Eurasian Platform (Miskell et al., 1985;
however, little consensus on the timing of the onset of pro-     Muttoni and Kent, 2007; Moore et al., 2008; Barron et
duction of Northern Component Water (NCW) sourced from           al., 2015; Wade et al., 2020). Unusually expanded lower Pa-
the high-latitude North Atlantic, a precursor to today’s North   leocene through upper Eocene biosiliceous successions were
Atlantic Deep Water. Estimates for NCW onset vary from           recovered from Blake Nose in the midlatitude western North
the late early Eocene (∼ 49–50 Ma; Hohbein et al., 2012)         Atlantic (Shipboard Scientific Party, 1998a–f; Witkowski et
through the late Eocene (∼ 38 Ma; e.g., Borrelli et al., 2014;   al., 2020a). In order to gain a quantitative insight into how
Coxall et al., 2018) to across the EOT interval (∼ 34 Ma;        bio SiO2 burial evolved through the early Paleogene hothouse
Via and Thomas, 2006; Abelson and Erez, 2017). Regard-           and the ensuing period of global cooling, we have gener-
less, the long-term global cooling spanning the middle and       ated a composite high-resolution Blake Nose bio SiO2 flux
late Eocene (∼ 48–34 Ma) is thought to have resulted in en-      record from ∼ 65 to 34 Ma, spanning nearly the entire Pa-
hanced upwelling, and the opening of the Drake Passage is        leocene and Eocene epochs. This work follows on from two
viewed as a milestone in establishing the global pattern of      previous publications with a focus on the Blake Nose early
thermohaline circulation in its present-day form in the At-      to middle Paleogene siliceous microfossils: (1) Witkowski
lantic (Via and Thomas, 2006; Katz et al., 2011; Borrelli et     et al. (2020a), in which a revised chronological framework
al., 2014; Abelson and Erez, 2017).                              is proposed for Sites 1050 and 1051; and (2) Witkowski et
   Despite the importance of siliceous biota in the present-     al. (2020b), in which Paleogene trends in chert and porcelan-
day carbon cycle, our understanding of the temporal trends       ite occurrences are compared to spatial and temporal patterns
in marine bio SiO2 accumulation through the early Paleo-         in Atlantic biosiliceous sediment occurrences. In our study
gene is limited. First-order observations indicate an associ-    here, we aim to determine the main controls on bio SiO2 fluxes
ation between peak chert–porcelanite occurrence and deep-        in a key locus of biosiliceous accumulation in the western
water temperatures through the Early Eocene Climatic Op-         North Atlantic (Blake Nose) during the early to middle Pale-
timum (EECO) (Muttoni and Kent, 2007; Witkowski et               ogene – a period of Cenozoic climate change characterized
al., 2020b) and during short-lived hyperthermal events of        by profound variations in global temperature.
the early Eocene (Penman et al., 2019). The rapid cooling
at the end of the Eocene is also widely regarded as the period
                                                                 2     Materials and methods
of diatom proliferation and diversification, especially in the
Southern Ocean (Egan et al., 2013; Lazarus et al., 2014; Re-     2.1    Study sites and stratigraphy
naudie, 2016). However, trends in marine bio SiO2 accumula-
tion in the period between these temporally broadly isolated     This study is focused on drill cores recovered as part
events representing contrasting climate states are not well      of the Ocean Drilling Program (ODP) Blake Nose Paleo-
documented. The longest currently available perspective on       ceanographic Transect and includes Holes 1049A, 1050A/C,
marine bio SiO2 accumulation (Cretaceous through Miocene)        1051A, 1052B/F, and 1053A (Shipboard Scientific Party,
is based on Deep Sea Drilling Project (DSDP) Leg 1 through       1998b–f) (Fig. 1) (Table 1). The transect was drilled on
44 smear-slide data (i.e., data gathered between 1968 and        Blake Nose (BN; also often referred to as “Blake Ridge”)
1978) converted to mass accumulation rates and binned into       in the western North Atlantic Ocean in order to recon-
10 Myr increments (Miskell et al., 1985). Direct sediment        struct the Cretaceous–Paleogene paleoceanographic history
measurements of bio SiO2 concentrations (with calculated         of the region adjacent to the South Atlantic Bight (Ship-
fluxes) through the Paleogene are sparse (e.g., Diester-Haass,   board Scientific Party, 1998a), offshore of the southeast-
1995; Salamy and Zachos, 1999; Diekmann et al., 2004;            ern US seaboard between Florida Straits and Cape Hatteras
Lyle et al., 2005; Iwasaki et al., 2014) and mostly focus        (Gula et al., 2016). The BN is a northeast-trending exten-
on restricted time windows of the late Eocene through early      sion of the Blake Plateau comprised of a Cretaceous to Pa-
Oligocene interval. A major reason for this is that bio SiO2     leogene continental margin succession (Pinet et al., 1981;
is highly vulnerable to water-column and seafloor dissolu-       Shipboard Scientific Party, 1998a) (Fig. 1b). As Paleogene
tion, which results in early Paleogene siliceous phytoplank-     sediments draping BN were deposited on the seaward slope
ton occurrences often being confined to narrow stratigraphic     of a large reef formed in the Early Cretaceous, the transect
intervals at many sites (see Barron et al., 2015; Witkowski et   sites likely retain the relative depths of the paleo-reef system
al., 2020b).                                                     (Shipboard Scientific Party, 1998a). Drilling at BN, as well
   The observations summarized above provoke three fun-          as at sites further north along the North American margin,
damental questions. (1) How did bio SiO2 burial flux evolve      documented well-preserved early Paleogene siliceous micro-
through the early to middle Paleogene? (2) What were the         fossils (e.g., Gombos, 1982; Nishimura, 1992; Hollis, 2014).
main controls on changes in marine bio SiO2 burial in this       The BN transect sites that recovered the most expanded early
time interval? (3) What was the bio SiO2 burial response to      to middle Paleogene sections (Sites 1050 and 1051) include
long-term Paleogene climate changes? Through the early Pa-       only a few narrow chert and porcelanite-bearing intervals
leogene, bio SiO2 accumulation was largely focused in the At-    (Witkowski et al., 2020b) and sparse clinoptilolite (a zeolite

https://doi.org/10.5194/cp-17-1937-2021                                                     Clim. Past, 17, 1937–1954, 2021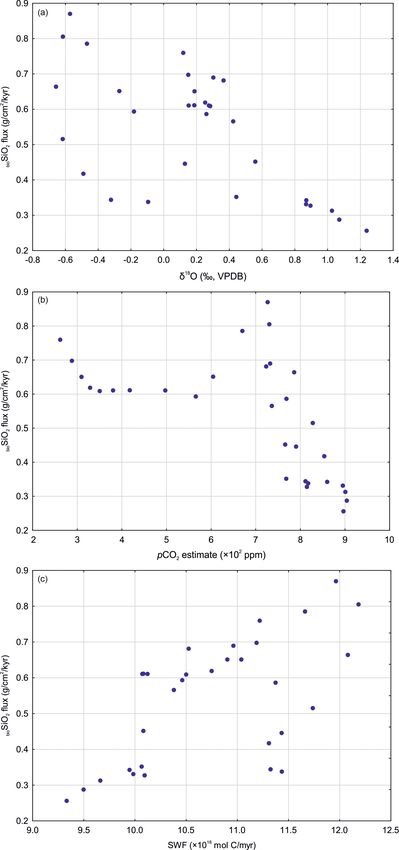
1940                                                 J. Witkowski et al.: Paleogene North Atlantic biogenic silica accumulation

alteration product of biogenic silica) occurrences, which sug-      from the entire succession cored at Hole 1051A (∼ 8.5 to
gests minimal diagenesis of sedimentary bio SiO2 . As such,         644 compacted m b.s.f.) were examined for this study.
the good overall preservation of siliceous microplankton in             Site 1052 is the shallowest site of the BN transect sites,
Paleogene sediments at BN, combined with the exception-             drilled near the crest of the BN (Fig. 1b; Table 1). Most
ally long stratigraphic span of the record recovered during         of the middle bathyal (600–1000 m paleodepth; Shipboard
Leg 171B (Witkowski et al., 2020a, and references therein),         Scientific Party, 1998e) Paleogene succession at this site is
makes the BN transect especially well-suited for reconstruct-       truncated by a prominent hiatus. In this study, we include a
ing variations in bio SiO2 burial flux in the early Paleocene       narrow composite interval of Holes 1052B and 1052F (∼ 77
through late Eocene time period. To this end, we examined           to 131 meters composite depth, mcd) spanning the Middle–
1230 samples from five BN drill sites: Sites 1049, 1050,            Late Eocene Turnover (MLET) (Kamikuri and Wade, 2012).
1051, 1052, and 1053.                                               As this interval overlaps parts of Holes 1051A and 1053A, it
   Site 1049 is the most distal and deepest site included in this   is not considered in sediment flux calculations. For age con-
study (1000–2000 m paleodepth; Shipboard Scientific Party,          trol at Site 1052, we use the bio-magnetostratigraphic con-
1998b) (Fig. 1b; Table 1). The Paleogene section of Hole            straints from Shipboard Scientific Party (1998e), Ogg and
1049A was poorly recovered due to the extensive presence            Bardot (2001), and Wade et al. (2012), following Witkowski
of chert horizons. As a consequence, numerous biostrati-            et al. (2020b). A total of 39 samples from Site 1052 were
graphic datums are poorly constrained through the recovered         used in this study.
sequence, and age control is only approximate, especially               Site 1053 was drilled between Sites 1051 (intermediate
through the early–middle Eocene transition (EMET). Based            depth) and 1052 (shallowest depth) in the upper part of
on the recent revisions to the bio-magnetostratigraphy of           the BN transect (500–700 m paleodepth; Shipboard Scien-
Holes 1050A and 1051A, however, Witkowski et al. (2020b)            tific Party, 1998f) (Fig. 1b; Table 1). Site 1053 recovered
proposed a revised age model for the Paleocene through              an expanded siliceous-microfossil-rich upper Eocene section
Eocene interval of Hole 1049A. Here, we examine 70 sam-             with no detectable stratigraphic gaps, as indicated by the age
ples from the chert-free, siliceous-microfossil-bearing inter-      model of Borrelli et al. (2014). At total of 79 samples from
val of Hole 1049A, spanning Cores 1049A-3H through -12X             Hole 1053A (∼ 0.5 to 183 meters below seafloor, m b.s.f.)
(∼ 21.1 to 88.1 compacted meters below seafloor; m b.s.f. –         were examined for this study.
see Witkowski et al., 2020a; Table 1). Due to incomplete re-            Despite two major discontinuities and multiple recovery
covery and the temporal patchiness of the record, however,          gaps, our composite BN record is comprised of data from
we do not include data from Hole 1049A in bio SiO2 flux cal-        five sites and spans the earliest Paleocene (∼ 64.74 Ma; mag-
culations.                                                          netochron C28n in Hole 1051A, Witkowski et al., 2020a)
   Site 1050 (1000–2000 m paleodepth; Shipboard Scientific          through latest Eocene (∼ 33.94 Ma; magnetochron C13r in
Party, 1998c) was drilled several kilometers upslope of Site        Hole 1053A; Borrelli et al., 2014) interval. This compos-
1049 (Fig. 1b; Table 1). The Paleogene succession cored             ite represents the longest currently available single-locality
in Holes 1050A and 1050C is considerably more expanded              record of deep-sea biosiliceous sedimentation through the
and stratigraphically more complete than in Hole 1049A.             Paleogene. We report all ages relative to the Gradstein et
Siliceous microfossils occur throughout the succession cored        al. (2012) timescale, hereafter referred to as GTS2012.
in Hole 1050A, but in Hole 1050C siliceous microfossils are
confined to Core 1050C-2R (Witkowski et al., 2020b). We             2.2 bio SiO2 measurements
apply the age model of Witkowski et al. (2020a), who inter-
preted the presence of two major stratigraphic gaps. For this       bio SiO2 concentrations were determined by means of a
study, we examined 273 samples from Hole 1050A (Cores               Hach DR-3900 spectrophotometer using Hach method 8186
1050A-2H through -36X; ∼ 11 to 319.3 compacted m b.s.f.)            (heteropoly blue method). All spectrophotometric analyses
and 7 samples from Hole 1050C (Core 1050C-2R; 328 to                closely followed the wet alkaline extraction procedure of Oli-
336 compacted m b.s.f.).                                            varez Lyle and Lyle (2002). Unlike Olivarez Lyle and Lyle
   Site 1051, the intermediate-depth site of the BN tran-           (2002), however, for base extraction we used 1 M KOH and
sect (1000–2000 m paleodepth; Shipboard Scientific Party,           10 mg ground sediment subsamples rather than 2 M KOH
1998d) (Fig. 1b; Table 1), recovered the most expanded              and 20 mg subsamples. This was done in order to avoid SiO2
lower Paleocene through upper Eocene succession among               polymerization (Annette Olivarez Lyle, personal communi-
Leg 171B sites. Siliceous microfossils occur throughout this        cation, 2015), manifested by the precipitation of whitish fil-
succession, except for within several narrow dissolution in-        aments in test tubes following base extraction conducted at
tervals (for details see Witkowski et al., 2020b). We use           higher KOH concentrations with larger subsamples. bio SiO2
the age model of Witkowski et al. (2020a), who showed               concentrations for individual sites are tabulated in Tables S1
that the Hole 1051A succession is interrupted by two ma-            through S5 in the Supplement, and data used for bio SiO2
jor gaps that are broadly correlative with the hiatuses in Hole     flux calculations are presented in Figs. S1–S3 in the Sup-
1050A (see also Röhl et al., 2003). A total of 762 samples          plement.

Clim. Past, 17, 1937–1954, 2021                                                       https://doi.org/10.5194/cp-17-1937-2021
J. Witkowski et al.: Paleogene North Atlantic biogenic silica accumulation                                                            1941

Figure 1. Maps showing the location of sites considered in the present paper: (a) Blake Nose (red star) in the western North Atlantic and
eastern equatorial Pacific sites (black stars). Base map generated using Ocean Drilling Stratigraphic Network (2021) Advanced Plate Tectonic
Reconstruction service (https://www.odsn.de/, last access: 12 April 2021). (b) Location of the Ocean Drilling Program (ODP) Leg 171B sites
on Blake Nose. Modified from Shipboard Scientific Party (1998a).

Table 1. Sites included in this study, along with geographic coordinates, site chapters, and number of samples examined for bio SiO2 . Sites
used for bio SiO2 flux calculations are in italics.

        ODP hole        Latitude          Longitude       Water depth    Reference                             Number of samples
                                                             (m)                                                   examined for
                                                                                                                         bio SiO2

        1049A        30◦ 08.54360 N    76◦ 06.73120 W        2656.1      Shipboard Scientific Party (1998b)                     70
        1050A        30◦ 05.99770 N    76◦ 14.10110 W        2299.8      Shipboard Scientific Party (1998c)                    273
        1050C        30◦ 05.99530 N    76◦ 14.09970 W        2296.5      Shipboard Scientific Party (1998c)                      7
        1051A        30◦ 03.17400 N    76◦ 21.45800 W        1982.7      Shipboard Scientific Party (1998d)                    762
        1052B        29◦ 57.07910 N    76◦ 37.60980 W        1345.0      Shipboard Scientific Party (1998e)                     13
        1052F        29◦ 57.07940 N    76◦ 37.60940 W        1343.5      Shipboard Scientific Party (1998e)                     26
        1053A        29◦ 59.53850 N    76◦ 31.41350 W        1629.5      Shipboard Scientific Party (1998f)                     79
        Total samples examined                                                                                                1230

   Three methods were employed to monitor analytical pre-               Piela et al., 2012; D’haenens et al., 2014).
cision of the bio SiO2 measurements: (1) one sample in each
analyzed batch was subject to stepwise standard addition                MAR(g cm−2 kyr−1 ) = sedimentary component
against a target curve using liquid SiO2 standard supplied by           [g component/g bulk sediment] × linear
Hach (average target curve R 2 = 0.994, n = 84); (2) one ran-
                                                                        sedimentation rate (LSR) [cm kyr−1 ] × sediment dry
dom sample from every sample batch was also analyzed in
duplicate, with good correlation between duplicate analyses             bulk density (DBD) [g cm−3 ]
(average R 2 = 0.98, n = 92; Fig. S4); and (3) one of three in-
house consistency standards was analyzed in approximately                  Use of magneto-biostratigraphic age models to establish
every second sample batch.                                              LSRs typically produces unrealistic jumps in sediment flux
                                                                        estimates at magnetostratigraphic boundaries, with order-of-
                                                                        magnitude differences between consecutive age–model tie
                                                                        points. In order to smooth out such abrupt features, which
                                                                        we deem to be artifacts of the applied age models, in our flux
                                                                        records, we fitted polynomial regressions against the age vs.
2.3   Sediment mass accumulation rate calculations                      depth curves (or segments thereof comprised between hia-
                                                                        tuses), following the approach of Piela et al. (2012). The
All sediment mass accumulation rate (hereafter: flux) values            datasets developed in the present work are based on sev-
in this work are expressed as grams per square centimeter               eral holes that include several hiatuses, which is why robust
(g cm−2 ) per 1000 years (kyr) and are calculated using stan-           age models that are consistent between holes are essential
dard terms from previous studies (e.g., Diester-Haass, 1995;            to obtain a reliable composite stratigraphy. We therefore plot

https://doi.org/10.5194/cp-17-1937-2021                                                              Clim. Past, 17, 1937–1954, 2021
1942 J. Witkowski et al.: Paleogene North Atlantic biogenic silica accumulation
the flux records derived from smoothed LSR estimates us- where βj represents model parameters (regression coeffi-
ing ages interpolated from the original (i.e., non-smoothed) cient), and ξ is a random component. The parameters of
age–depth curves (Figs. S1–S3). the regression equation are estimated using the least-squares
Sediment flux studies often estimate wet bulk sediment method, and the determination coefficient and standard error
density through calibration of high-resolution estimates of of estimation are used to assess the goodness of the model.
wet bulk density (obtained via gamma ray attenuation, GRA,
analysis) against discrete DBD measurements collected dur- 3 Results and interpretation
ing routine shipboard analysis. In the present work, estab-
lishing a single GRA–DBD correlation over the entire cored Our new composite %bio SiO2 record from Blake Nose spans
interval proved ineffective for Sites 1050 and 1051, likely the interval between ∼ 65 and 34 Ma (Fig. 2a), representing
due to the downhole increase in compaction. Instead, we the longest single-locality record of bio SiO2 concentrations
estimated DBD for a given depth by interpolating between compiled to date. The composite record, however, lacks data
shipboard discrete DBD measurements (Shipboard Scientific in two short time windows: between ∼ 53.5 and 52.0 Ma
Party, 1998b–d, f). Sediment density plots, LSRs, and calcu- (magnetochrons C24n through C23n) and between ∼ 47.5
lated fluxes are included in the Supplement (Figs. S1–S3 and and 49.0 Ma (i.e., through the EMET). This is due to the pres-
Tables S2–S3, S5). ence of prominent hiatuses at all study sites spanning these
intervals (Shipboard Scientific Party, 1998b–d; Witkowski et
2.4 Stable isotope and pCO2 data al., 2020a) (Fig. 2a).
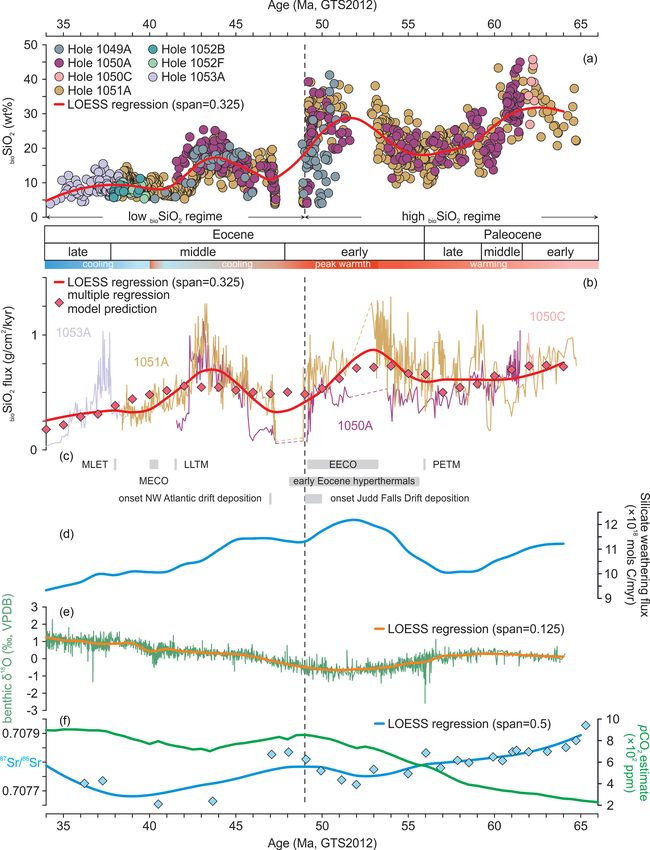
The BN %bio SiO2 composite shows variable but generally
Our interpretation of possible controls on early to middle high values between ∼ 65 and 49 Ma (Fig. 2a). Two broad
Paleogene bio SiO2 accumulation is based on comparison to %bio SiO2 maxima are observed within this high-bio SiO2 in-
published isotopic weathering (87 Sr/86 Sr, 187 Os/188 Os, and terval, culminating at ∼ 61.5 Ma and at ∼ 51.5 Ma (Fig. 2a).
δ 7 Li; Ravizza et al., 2001; Ravizza and Peucker-Ehrenbrink, These maxima are separated by a broad low in %bio SiO2 with
2003; Misra and Froelich, 2012; Klemm et al., 2005) and a nadir centered at approximately the Paleocene–Eocene
paleocirculation proxies (δ 13 C, δ 18 O; Cramer et al., 2009), boundary (∼ 56 Ma). From ∼ 49 Ma to the end of the record
as well as a recent atmospheric pCO2 reconstruction (Fos- at ∼ 34 Ma, %bio SiO2 levels are considerably lower and less
ter et al., 2017) and silicate weathering flux model (hereafter variable (Fig. 2a), with a distinct maximum culminating at
SWF) (Caves et al., 2016). For further discussion and a full ∼ 44 Ma.
documentation of data sources see the Supplement (“Stable Long-term trends in BN bio SiO2 fluxes are calculated
isotope and pCO2 data” section and Fig. S5). based on a composite record built from datasets generated
from Sites 1050, 1051, and 1053. Through the Paleocene
2.5 Statistical treatment and early Eocene, Site 1050 generally displays lower bio SiO2
fluxes than Site 1051 (Fig. 2b). From ∼ 46 to 34 Ma, both
Smoothed long-term trends in bio SiO2 flux and published bio SiO2 flux trends and values are remarkably consistent be-
geochemical records were obtained via local regression (ab- tween Sites 1050 and 1051 (Fig. 2b). The short time interval
breviated as LOESS; Cleveland et al., 1992) computed us- in which records from Site 1051 and Site 1053 overlap also
ing R Studio v. 3.5.1. Statistical analysis was performed reveals coherent bio SiO2 flux values (Fig. 2b). Thus, follow-
on smoothed time series (bio SiO2 flux, δ 13 C, δ 18 O, pCO2 ing a period of high inter-site variability through the Pale-
87 Sr/86 Sr, 187 Os/188 Os, δ 7 Li, and SWF) using Statistica
ocene, three intervals of elevated bio SiO2 fluxes are observed,
13.1 package. which are consistent between sites and peak at ∼ 53.2, ∼
The degree of covariance of the analyzed variables was 43.3, and ∼ 37.7 Ma. The overall patterns in %bio SiO2 and
assessed by correlation analysis. A normality test procedure bio SiO2 flux estimates are also consistent, especially through
was carried out for all variables using the Shapiro–Wilk test the middle and late Eocene. Most importantly, however, the
(α = 0.05). The Pearson correlation coefficient was used to bio SiO2 flux values fall within the same order of magnitude
assess covariance for each pair of variables characterized by through most of the study period (except for peak bio SiO2
a normal distribution. The nonparametric Spearman correla- fluxes at Site 1051 between 54 and 53 Ma and from 44
tion coefficient was used when non-normal distribution was to 43 Ma). Furthermore, our record consistently shows that
indicated for a given variable by the Shapiro–Wilk test. bio SiO2 fluxes through the middle Eocene cooling were, on
The analysis also involved a multiple regression model, average, higher than (Site 1050) or similar to (Site 1051)
which describes the relationship of the dependent variable Y bio SiO2 fluxes through the early Eocene period of extreme
with a set of independent variables X1 , X2 , . . ., Xk (which, in greenhouse warmth (Fig. 2b).
this study, is the relationship between bio SiO2 flux and other
proxy records). It is defined by Eq. (1):
Y = β0 + β1 X1 + β2 X2 + . . . + βk Xk + ξ, (1)
Clim. Past, 17, 1937–1954, 2021 https://doi.org/10.5194/cp-17-1937-2021J. Witkowski et al.: Paleogene North Atlantic biogenic silica accumulation 1943 Figure 2. Composite Blake Nose weight percent biogenic silica concentrations (a) and fluxes (b) through the early to middle Paleogene plotted against key tectonic and climatic events (c), silicate weathering flux as modeled by Caves et al. (2016) (d), global benthic foraminiferal δ 18 O compilation of Cramer et al. (2009; rescaled to GTS2012) (e), and pCO2 reconstruction (Foster et al., 2017) and 87 Sr/86 Sr ratios (Misra and Froelich, 2012) (f). The schematic representation of climatic trends next to the chronostratigraphy panel is consistent with Cramwinckel et al. (2018). Abbreviations: wt % – weight percent; bio SiO2 – biogenic silica; GTS2012 – Geologic Time Scale 2012; see Gradstein et al. (2012). https://doi.org/10.5194/cp-17-1937-2021 Clim. Past, 17, 1937–1954, 2021
1944                                                J. Witkowski et al.: Paleogene North Atlantic biogenic silica accumulation

3.1    Impact of hiatuses and diagenesis on BN bio SiO2            but inversely, correlated with both pCO2 (r = −0.775,
       flux estimates                                              p < 0.05) and δ 18 O (r = −0.618, p < 0.05) (Fig. 3). A
                                                                   weaker, but still statistically significant, correlation ex-
The bio SiO2 records from Sites 1050 and 1051, which con-          ists between bio SiO2 flux and δ 7 Li (r = −0.473, < 0.05),
stitute the older part of the composite presented here, are in-    187 Os/188 Os (r = 0.430, p < 0.05), and 87 Sr/86 Sr (0.418,
terrupted by hiatuses. These discontinuities in the BN record      p < 0.05) (Fig. 3). No statistically significant correlation
could introduce a bias to the flux estimates, for instance by      has been found between bio SiO2 flux and trends in benthic
influencing the LSR calculations. The age models for Holes         foraminiferal δ 13 C. These relationships suggest that, over-
1050A/C and 1051A used in this study (see Witkowski et             all, through the early to middle Paleogene, bio SiO2 flux at
al., 2020a, for details), however, are highly consistent in that   BN was indirectly shaped by a combination of changes in at-
the hiatuses are identified in correlative intervals, and, fur-    mospheric greenhouse gas levels, bottom water temperatures
thermore, LSRs used in flux calculations were subjected to         (assuming ice-free poles through our study period), and sup-
polynomial smoothing, which should eliminate most short-           ply of solutes from terrestrial silicate weathering.
term artifacts imposed by age model imperfections. bio SiO2           Multiple regression indicates four significant variables
flux estimates could also be compromised by winnowing,             shaping BNbio SiO2 flux: δ 18 O, pCO2 , δ 13 C, and 87 Sr/86 Sr.
which could concentrate biosiliceous particles over some ar-       Except for δ 13 C, this is consistent with the correlations dis-
eas of the seabed, while removing them from adjacent ar-           cussed above. Notably, SWF was excluded by the multiple
eas. In the core description logs for BN sites included in the     regression model. This is likely due to the high overall sim-
present bio SiO2 flux reconstruction, explicit mention of win-     ilarity in temporal trends displayed by BN bio SiO2 flux and
nowing is made only in one instance, i.e., for Core 1051A-         SWF. The multiple regression model equation takes the form
41X (Shipboard Scientific Party, 1998d). This core is also
characterized by the abundant presence of zeolite crystals         bio SiO2 flux = 798.57 − 0.156 × δ
                                                                                                        18
                                                                                                             O − 0.0008 × pCO2
(likely clinoptilolite; Jakub Witkowski, unpublished obser-
vations), which are an indicator of bio SiO2 diagenesis (see           − 0.111 × δ 13 C − 1126.58 × 87 Sr/86 Sr.
Fenner, 1991). For this reason, Core 1051A-41X was ex-
                                                                   This model explains ∼ 71 % of BN bio SiO2 flux variance,
cluded from the present study. Also, %bio SiO2 measurements
                                                                   with a standard error of estimation equal to 0.09. We find
were not performed on the sparse cherty or porcellanic inter-
                                                                   that the model reproduces our calculated bio SiO2 flux val-
vals at Sites 1050 and 1051. Scanning electron microscope
                                                                   ues reasonably well (Fig. 2b), suggesting that the use of
examination of diatoms from the remaining intervals of the
                                                                   smoothed datasets is suitable for identifying long-term trends
BN composite indicates only minor diagenetic effects on the
                                                                   in bio SiO2 fluxes. Thus, both the correlations and multiple
siliceous microfossils, manifested mostly by dissolution of
                                                                   regression suggest that BN bio SiO2 flux was shaped mostly
the most delicate parts of the valves, such as areole occlu-
                                                                   by δ 18 O, pCO2 , and the supply of continental weathering
sions or pore fields. For these reasons, the bio SiO2 fluxes re-
                                                                   products – all of which are related to the temperature–silicate
constructed in this study are deemed to be robust.
                                                                   weathering feedback.

3.2    Controls on bio SiO2 accumulation through the early         4     Discussion
       to middle Paleogene at Blake Nose
                                                                   4.1    Implications for paleocirculation
bio SiO2 production, export, and preservation in marine sed-
iments are influenced globally by dissolved silicon supply         The Blake Nose area is positioned on the western margin
to the oceans derived from terrestrial weathering, which           of the North Atlantic subtropical gyre, which exerts a ma-
is closely linked to climate via a negative feedback (e.g.,        jor control on nutrient availability in surface waters along
Walker et al., 1981), and by ocean circulation patterns and        the North American continental margin (Pelegrí et al., 1996).
upwelling, which supply the bulk of macronutrients to sur-         Over the South Atlantic Bight region, encompassing the
face waters (Miskell et al., 1985; Handoh et al., 2003). In        Blake Plateau, the key mechanism fueling modern phyto-
order to gain insight into the influence that each of these        plankton production is sub-mesoscale frontal eddies arising
factors has exerted on bio SiO2 accumulation through the           from meanders on the landward side of the Gulf Stream Sys-
early to middle Paleogene at BN, we compared the bio SiO2          tem (GSS; Richardson, 2001; Gula et al., 2015). Compara-
flux composite record to published composite global ben-           ble cyclonic eddies of < 100 km diameter are also observed
thic foraminiferal δ 18 O and δ 13 C records, pCO2 proxy es-       in other western boundary current (WBC) systems, which
timates, proxy records of continental weathering (87 Sr/86 Sr,     are generally viewed as oligotrophic settings (Roughan et
187 Os/188 Os and δ 7 Li), and modeled silicate weathering flux    al., 2017). These eddies are responsible for upward pumping
(SWF) (Figs. 2, S5).                                               of nutrients from sub-thermocline, nitrate-rich waters (Lee et
   We find that bio SiO2 flux is moderately correlated with        al., 1991). Upwelled waters intrude onto the continental mar-
modeled SWF (r = 0.597, p < 0.05) and more strongly,               gin and sustain rich biological production through the lifes-

Clim. Past, 17, 1937–1954, 2021                                                        https://doi.org/10.5194/cp-17-1937-2021
J. Witkowski et al.: Paleogene North Atlantic biogenic silica accumulation 1945
pan of an eddy (Roughan et al., 2017). Siliceous plankton
production and export in the GSS is influenced by a number
of factors, including Atlantic Meridional Overturning Circu-
lation (AMOC) intensity and the North Atlantic Oscillation,
which together act to shift the GSS position relative to the
North American seaboard on a decadal timescale (Sanchez-
Franks and Zhang, 2015). Also, the topography of the North
American continental margin (Richardson, 2001) in conjunc-
tion with eustatic sea level variations exert a strong influence
on the GSS path on long timescales, with features such as
the Charleston Bump acting to deflect the jet trajectory to-
ward the open ocean (Pinet et al., 1981; Gula et al., 2015).
A northeastward-flowing, wind- and Coriolis-force-driven
WBC likely operated in the North Atlantic at least since the
Cretaceous (Gradstein and Sheridan, 1983), albeit at reduced
strength relative to the modern era before the final closure of
the Central American Seaway (Montes et al., 2012). Given
the overall stability of the western North Atlantic topogra-
phy over the Cenozoic, cyclonic frontal eddies were likely an
inherent feature of the South Atlantic Bight region through-
out the Paleocene and Eocene. The semi-periodic fluctua-
tions in BN bio SiO2 flux through time could therefore also
be attributed to changes either in the mean GSS path (e.g.,
Wade and Kroon, 2002) or variations in sub-thermocline nu-
trient supply, which are largely dependent on vertical mixing
of the ocean (Miskell et al., 1985; Moore et al., 2008) – or a
combination of both processes.
Reconstructing intermediate-water and deepwater circula-
tion patterns in the North Atlantic through the early Ceno-
zoic is more complex than reconstructing GSS history.
Vahlenkamp et al. (2018) reviewed the existing perspectives
on the Atlantic Ocean circulation through the Paleogene. εNd
reconstructions generally indicate a southern high-latitude
source for the deep waters bathing the North American
margin throughout the early to middle Paleogene (Thomas
et al., 2003; Batenburg et al., 2018), although a Tethyan-
sourced water mass is also hypothesized by some researchers
(Fontorbe et al., 2016; Vahlenkamp et al., 2018). At present,
it is not known how a southern-sourced, northward-flowing
deepwater mass may have affected nutrient availability and
upwelling in the western North Atlantic, especially along
continental margins. The high diatom : radiolarian (D : R) ra-
tios (Witkowski et al., 2020b, for further discussion see be-
low) and common occurrence of well-preserved epiphytic di-
atoms such as Arachnoidiscus (see Witkowski et al., 2020a)
suggest that much of the BN bio SiO2 flux through the Pale-
ocene may be attributed to neritic production. Varying pro-
Figure 3. Correlation scatter plots for the three strongest statisti- portions of continental-runoff-derived vs. upwelled nutrient
cal relationships identified in the present study: biogenic silica flux input could also be invoked to explain the disparity in bio SiO2
vs. δ 18 O (a), pCO2 (b), and silicate weathering flux (c). Abbrevi- fluxes between the more proximal Site 1051 and the more
ations: bio SiO2 – biogenic silica; SWF – silicate weathering flux. distal Site 1050 through the Paleocene.
Data sources indicated in the text. An intensely debated question in the early Paleogene deep-
water circulation reconstructions is the timing of the onset of
NCW flow – a precursor to quasi-modern deepwater circu-
lation (Via and Thomas, 2006). North Atlantic δ 13 C records
https://doi.org/10.5194/cp-17-1937-2021 Clim. Past, 17, 1937–1954, 20211946 J. Witkowski et al.: Paleogene North Atlantic biogenic silica accumulation
do not indicate major paleocirculation changes prior to the valve weight data are available. In the modern oceans, ra-
late Eocene (∼ 38 Ma; Katz et al., 2011; Borrelli et al., 2014; diolarian tests are on average an order of magnitude heavier
Coxall et al., 2018), and numerous studies place the onset of than diatom valves (with differences in fact ranging over sev-
AMOC either shortly prior to or following the EOT (Via and eral orders of magnitude; Lisitzin, 1971). Assuming a 10 :
Thomas, 2006; Abelson and Erez, 2017; Coxall et al., 2018). 1 radiolarian-to-diatom skeleton weight ratio for the early
In contrast to the timing of NCW flow initiation indicated Paleogene and using an average radiolarian test weight of
by isotopic proxy records, the onset of widespread drift de- 0.225 µg consistent with the range of values displayed by
position in the North Atlantic is documented considerably the oldest materials included in Moore (1969), we make a
earlier, i.e., near the termination of the EECO (∼ 49 Ma; rough estimate of the diatom vs. radiolarian contribution to
Hohbein et al., 2012; Boyle et al., 2017). This is also syn- total BN bio SiO2 based on quantitative siliceous microfos-
chronous with ubiquitous deep-sea erosion coincident with sil counts of Witkowski et al. (2020b). As other siliceous
the EMET (Aubry, 1995; Witkowski et al., 2020b), strongly plankton groups are sparse in BN siliceous microfossil as-
suggesting that the onset of vigorous northern-sourced bot- semblages (Witkowski et al., 2020b) and likely contribute
tom current activity began at ∼ 49–47 Ma (Vahlenkamp et little bio SiO2 to sediments (Lisitzin, 1971), we exclude the
al., 2018; Witkowski et al., 2020a). Following the EMET, relatively minor contributions of silicoflagellates, siliceous
the northward-flowing GSS and the invigorated deep WBC dinoflagellates, and chrysophycean cysts from the calcula-
facilitated diapycnal mixing, which likely enhanced biologi- tions. These rough approximations indicate a mean diatom
cal pump efficiency along continental margins of the western contribution of ∼ 35.7 % to the total biogenic silica content
North Atlantic. This is consistent with a range of geochemi- at BN (Fig. S6), with the highest values observed for the early
cal proxies, including thallium isotope (ε 205 Tl) evidence for and middle Paleocene, consistent with the D : R ratios rang-
increased Corg burial from ∼ 50 Ma (Nielsen et al., 2009) and ing as high as > 200 reported by Witkowski et al. (2020b).
with surface-to-deep δ 13 C gradients (Hilting et al., 2008). Given that diatom valves are less resistant to dissolution than
BN diatom assemblage data from Witkowski et al. (2020b) radiolarian tests, the contribution of diatoms to total bio SiO2
also support an oligotrophic regime over BN for the time pe- in early Paleogene sediments at BN is likely underestimated
riod prior to and including the EECO based on high percent- due to selective dissolution.
ages of hemiauloids. Following the EECO (after ∼ 49 Ma), It is important to note that these considerations disre-
elevated percentages of diatom resting spores point to alter- gard the contribution of siliceous sponge spicules to to-
nating, perhaps seasonal, periods of nutrient enrichment and tal bio SiO2 in the BN sediments. Counting and identifying
depletion, in line with strong periodic upwelling of nutrients sponge spicules were beyond the scope of the present study,
by means of Gulf Stream frontal eddies (Lee et al., 1991). and, to the best of our knowledge, no quantitative studies
This interpreted invigoration in ocean mixing led to a consid- on sponge spicules from the BN cores have been performed
erable increase in primary production during the early middle thus far. Consequently, we were not able to use published
Eocene, as evidenced by a rapid increase in both CaCO3 and data to estimate sponge spicule contribution to total bio SiO2
bio SiO2 fluxes at BN at ∼ 46 Ma (Fig. 4a, b). in early Paleogene sediments at BN. Several recent stud-
ies point to a declining contribution of sponges to the to-
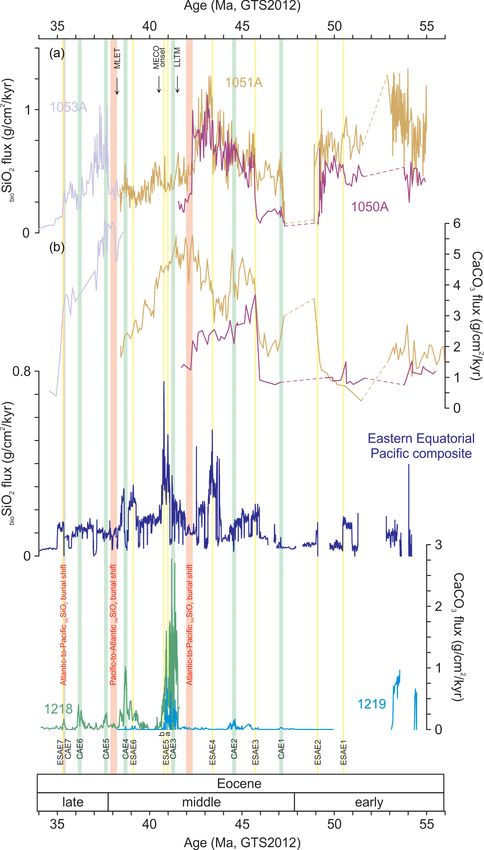
4.2 Comparison to eastern equatorial Pacific bio SiO2
tal bio SiO2 flux that is probably linked to diatom expan-
flux records
sion in the late Mesozoic (Maldonado et al., 1999; Conley et
al., 2017). Modern bio SiO2 flux attributed to sponges ranges
The only published early Paleogene bio SiO2 flux record from from 25 to 48 Tg Si yr−1 and is an order of magnitude lower
another region of comparable duration to the BN composite than the total bio SiO2 flux estimate for continental margins
record is that derived from eastern equatorial Pacific (EEP) (140–235 Tg Si yr−1 ) and for the deep sea (153 Tg Si yr−1 )
cores (Moore et al., 2008). There are several important dif- (Hayes et al., 2020). Sponge spicules are therefore unlikely
ferences between the Atlantic and Pacific records (Fig. 4), to have made a significant contribution to total bio SiO2 flux
including (1) contrasting proportions of diatoms in the BN at BN through the early to middle Paleogene. SiO2 preser-
vs. EEP sediments, (2) the presence or absence of exported vation is again a related issue, as sponge spicules undergo
neritic material, and (3) a shorter time interval covered by dissolution at slower rates compared to siliceous plankton
the EEP record (Eocene only). Where the records overlap in valves or tests (Bertolino et al., 2017). Although some at-
time, however, there is a variable degree of coupling between tempts have been made (e.g., Warnock and Scherer, 2015),
bio SiO2 flux records from BN and EEP. there is currently no standardized quantitative measure of di-
High diatom : radiolarian (D : R) ratios in early to middle atom preservation in sediments, and the basic indicators of
Paleogene sediments at BN were interpreted by Witkowski et silica dissolution are chert–porcelanite and clinoptilolite oc-
al. (2020b) to indicate that preserved bio SiO2 was mostly of currences. As indicated above, both chert–porcelanite and
diatom origin. It is challenging, however, to provide a quan- clinoptilolite occur only at isolated, narrow levels at the
titative estimate of the diatom vs. radiolarian contribution to sites included in bio SiO2 flux estimates in the present study,
total bio SiO2 at BN, primarily because no published diatom and in some intervals diatom preservation can be consid-
Clim. Past, 17, 1937–1954, 2021 https://doi.org/10.5194/cp-17-1937-2021J. Witkowski et al.: Paleogene North Atlantic biogenic silica accumulation 1947 Figure 4. Eocene biogenic silica (a) and calcium carbonate (b) fluxes at Blake Nose sites plotted against biogenic silica (c) and calcium carbonate (d) fluxes at eastern equatorial Pacific sites. Blake Nose carbonate data are from Shipboard Scientific Party (1998c, d, f). Eastern equatorial Pacific data are from Moore et al. (2008) and Lyle et al. (2005). Abbreviations: bio SiO2 – biogenic silica; GTS2012 – Geologic Time Scale 2012 (see Gradstein et al., 2012); MLET – Middle–Late Eocene Turnover; LLTM – Late Lutetian Thermal Maximum; ESAE – Eocene silica accumulation event; CAE – carbonate accumulation event. https://doi.org/10.5194/cp-17-1937-2021 Clim. Past, 17, 1937–1954, 2021
1948                                                J. Witkowski et al.: Paleogene North Atlantic biogenic silica accumulation

ered pristine. Hence, the assumption is that no extensive di-      In contrast, this late middle Eocene period of low bio SiO2
atom silica dissolution has occurred in Holes 1050A and C          flux at BN precisely corresponds to an interval of elevated
and 1051A, which would lead to preferential preservation           bio SiO2 fluxes in the EEP (Fig. 4a vs. c), including the bi-
of the more dissolution-resistant sponge spicule silica over       modal ESAE 5, which represents the peak in the Eocene
the more dissolution-prone diatom and/or radiolarian silica.       EEP bio SiO2 accumulation at ∼ 41 Ma. Thus, the decrease
Thus, our conclusion is that siliceous sponge spicules do not      in nutrient levels in the Atlantic appears to have been as-
contribute significantly to total bio SiO2 flux in the BN cores.   sociated with nutrient enrichment and elevated biosiliceous
    In contrast to the abundant presence of diatoms at BN,         production in the EEP, representing an inter-basin shift in
Moore et al. (2008) refer to the near absence of diatoms           biosiliceous productivity and sedimentation.
in the Eocene EEP cores as an “enigma”. Although Moore                 Near the end of the middle Eocene, ESAE 6 is abruptly
et al. (2008) do not specify whether or not this observation       terminated at ∼ 38.5 Ma, concomitant with a major radio-
is based on sieved residues (thereby potentially missing di-       larian turnover at EEP sites (Moore et al., 2008). A similar
atoms in the smaller sediment fractions), other Paleogene di-      episode of accelerated turnover in radiolarians has been iden-
atom reports from pelagic low-latitude Pacific sites corrobo-      tified at ∼ 38.25 at BN (Kamikuri and Wade, 2012; Newsam
rate this view (e.g., Fenner, 1984). We propose that the rea-      et al., 2017), but in conjunction with a rapid rise in bio SiO2
son for this difference in diatom abundance in sediments be-       flux levels. ESAEs 7 and 8 in the EEP are minor events
tween BN and EEP is twofold. Firstly, most early Paleogene         at ∼ 35 and ∼ 34 Ma, respectively, and no age-equivalent
diatom occurrences in the Atlantic are in marginal settings        events are observed in the BN bio SiO2 flux record. We in-
(Witkowski et al., 2020b), where at least part of the preserved    terpret the decoupling between BN and EEP bio SiO2 flux
diatom assemblage may originate from offshore export of            records after ∼ 42 Ma as a series of inter-basin bio SiO2 accu-
neritic plankton, and diatom preservation may be fostered          mulation shifts (Fig. 4a vs. c), likely associated with deepwa-
by higher concentrations of Al (DeMaster, 2014; Hayes et           ter circulation changes affecting nutrient availability in sur-
al., 2020). Secondly, the radiolarian-rich Pacific sites mostly    face waters, but likely also impacting the seabed preservation
represent pelagic deposition at water depths of ∼ 4–5 km.          of bio SiO2 (Berger, 1970).
Diatom dissolution is facilitated by longer times in transit           Diminished BN bio SiO2 fluxes indicate lower nutrient sup-
through the water column and longer times resting on the           ply from ∼ 42 to 38 Ma, i.e., through the interval span-
seafloor in slowly accumulating pelagic settings. The BN and       ning both the Late Lutetian Thermal Maximum (LLTM,
EEP records also differ in the magnitude of bio SiO2 fluxes: as    ∼ 41.5 Ma; Westerhold et al., 2018b) and Middle Eocene
discussed in Witkowski et al. (2014, 2020b), the BN area re-       Climatic Optimum (MECO, ∼ 40 Ma; Bohaty et al., 2009;
ceived large volumes of neritic plankton through the early Pa-     Henehan et al., 2020). Modern field observations indicate
leogene, which underwent offshore export likely by means of        that diminished supply of nutrients to the GSS may result
frontal eddies, and the resultant bio SiO2 fluxes are high. The    from weakened AMOC. Witkowski et al. (2020b) demon-
pelagic EEP sites likely record only local pelagic production      strate a reduced geographic range of biosiliceous accumu-
and deposition, with low bio SiO2 fluxes relative to the BN.       lation in the Atlantic between ∼ 42 and 38 Ma, which is
    Eocene EEP bio SiO2 accumulation rates are generally low,      also consistent with a diminished nutrient supply. Accord-
punctuated by a series of elevated flux events termed ESAEs        ingly, we propose a period of potentially weakened AMOC
(Eocene silica accumulation events – see Moore et al., 2008)       spanning both the LLTM and MECO events. In the EEP,
and CAEs (carbonate accumulation events – see Lyle et              the high rates of primary production are sustained by ad-
al., 2005) (Fig. 4c–d). Between ∼ 55 and 46 Ma, bio SiO2           vection of nutrient-rich sub-thermocline waters associated
fluxes in the EEP are low and appear to be decoupled from          with the equatorial divergence (Fiedler et al., 1991). We pro-
the BN records. ESAE 3 at ∼ 45.8 Ma marks the onset of             pose that the paleocirculation changes that led to the inter-
enhanced bio SiO2 flux in the EEP (Fig. 4c). Notably, ESAE         preted disruption to AMOC may have manifested themselves
3 appears to be age-equivalent to a prominent increase in          by nutrient enrichment in the EEP. Thus, alternating loci of
BN bio SiO2 and CaCO3 fluxes (Fig. 4a vs. c). ESAE 4 at            biosiliceous sedimentation between the Atlantic and Pacific
∼ 44.3 Ma is correlative with the peak in middle Eocene            during the middle Eocene likely resulted from circulation
bio SiO2 flux at BN (Fig. 4a vs. c). Following ESAE 4, how-        shifts that exerted control over bio SiO2 production and burial.
ever, trends in bio SiO2 flux again become decoupled between           The Pacific-to-Atlantic bio SiO2 flux shift at ∼ 38 Ma co-
the two regions. bio SiO2 fluxes diminish at BN between ∼ 42       incides with increased rates of radiolarian turnover and
and 38 Ma, and a concomitant reduction is observed in the          planktonic foraminiferal extinction designated as MLET by
geographic distribution of siliceous microfossils in the At-       Kamikuri and Wade (2012). Notably, the late Eocene is also
lantic Ocean (Witkowski et al., 2020b) (Fig. 4a vs. c). Thus,      believed to have been a period of pelagic diatom prolifer-
reduced bio SiO2 accumulation between ∼ 42 and 38 Ma is            ation, probably due to the radiation of holoplanktonic taxa
not a local phenomenon restricted to the BN area, but in-          (Sims et al., 2006; Egan et al., 2013). Thus, MLET may have
stead it is likely indicative of a major change in nutrient sup-   made a significant impact on siliceous microplankton evo-
ply or paleocirculation that affected the entire Atlantic basin.   lution and production globally. Most importantly, however,

Clim. Past, 17, 1937–1954, 2021                                                       https://doi.org/10.5194/cp-17-1937-2021
J. Witkowski et al.: Paleogene North Atlantic biogenic silica accumulation 1949
the abrupt increase in bio SiO2 flux at Site 1053 shortly af- native view (hereafter “variable feedback strength scenario”)
ter MLET took place in conjunction with shifts in benthic is that during the Eocene the feedback strength was at a min-
foraminiferal δ 13 C (Katz et al., 2011; Borrelli et al., 2014; imum level (Caves et al., 2016; van der Ploeg et al., 2018),
Coxall et al., 2018) interpreted to mark the onset of NCW with lowered silicate weathering intensity (and, hence, re-
export. duced weathering feedback strength) promoting high pCO2
Thus, the repeated shifts in bio SiO2 fluxes between NW levels and a warm climate (Misra and Froelich, 2012). As-
Atlantic and EEP through the late middle and late Eocene suming that the early to middle Paleogene silicon cycle al-
suggest that the “lagoonal” Atlantic (carbonate-burial- ready operated in its present-day form (Fontorbe et al., 2016;
favoring) vs. “estuarine” Pacific (SiO2 -burial-favoring) cir- Conley et al., 2017), these scenarios should lead to differ-
culation pattern proposed by Berger (1970) was established ent marine bio SiO2 flux responses. In the constant feedback
in the lead-up to LLTM and temporarily reversed at the strength scenario, bio SiO2 production and burial would be
MLET before its final re-establishment shortly before the expected to peak during the EECO, i.e., the warmest pe-
EOT. These shifts were likely driven by changes in deep- riod of the Cenozoic era (e.g., Kirtland-Turner et al., 2014;
sea circulation patterns arising from both tectonic evolution Cramwinckel et al., 2018; Westerhold et al., 2018a). In the
in the Northern and Southern Hemisphere (e.g., Norwegian– variable feedback strength scenario, the silicate weathering
Greenland Sea and Drake Passage region, respectively) and flux should decrease through the Eocene (Caves et al., 2016),
long-term Eocene climate change. Importantly, however, this leading to a decrease in dissolved silicon supply and bio SiO2
interpretation implies that the two scenarios for NCW export burial.
inception (at EOT: Borrelli et al., 2014; Coxall et al., 2018; In the BN composite, both %bio SiO2 and bio SiO2 flux
vs. at the end of the EECO: Hohbein et al., 2012; Boyle et values are high in the lead-up to the EECO (∼ 55 through
al., 2017; Vahlenkamp et al., 2018) are not mutually exclu- 53.5 Ma) and considerably lower in the final phases of the
sive. The patterns in Atlantic-to-Pacific bio SiO2 flux fraction- EECO (∼ 51 through 49 Ma). The hiatus spanning ∼ 53.5
ation outlined above suggest a ∼ 4 Myr period of the early through 52 Ma, however, precludes any definitive conclu-
AMOC disruption spanning the last of the Eocene green- sions on the behavior of the silicate weathering feedback
house warming events, i.e., LLTM and MECO. Moreover, through the entire EECO period, particularly with regard to
the evidence supporting NCW inception in the late Eocene the constant vs. variable strength of its link to climate. How-
or early Oligocene may in fact point to a re-invigoration of ever, bio SiO2 flux values through the middle Eocene are sim-
AMOC flow following a period of weakened overturning cir- ilar to or consistently higher than background Paleocene–
culation between 42 and 38 Ma. early Eocene values in both the Atlantic and the Pacific (see
also Moore et al., 2008, and Sect. 4.2), which cannot be
4.3 Implications for the silicate weathering feedback
easily reconciled with the linear feedback strength scenario.
operation mode
Thus, it appears that long-term trends in bio SiO2 flux are
more consistent with the variable feedback strength scenario,
The silicate weathering feedback has been proposed as suggesting that the strength of the link between climate and
the key mechanism for keeping the Earth surface tempera- terrestrial silicate weathering may indeed be variable through
tures within a habitable range over 105 –106 -year timescales time. Secondly, the high levels of bio SiO2 flux through the
(Walker et al., 1981; Kasting, 2019). By consuming atmo- middle Eocene cooling (Fig. 2b) point to enhanced nutrient
spheric CO2 and releasing alkalinity and dissolved silicon supply from invigorated ocean circulation as a major control
(Penman, 2016), this feedback mechanism also influences on bio SiO2 flux in the younger part of our study period.
key biogeochemical cycles within the ocean–atmosphere
system, resulting in a tight coupling between the marine car-
bon and silicon cycles (Tréguer and De La Rocha, 2013). In 5 Conclusions
recent years, however, the operation of the silicate weath-
ering feedback through the Cenozoic has been disputed, Deepwater temperatures, atmospheric greenhouse gas lev-
with a special focus on whether the strength of the link els, and continental weathering are identified as the main
between climate and continental weathering varies through drivers of bio SiO2 flux through the Paleocene and Eocene
time (Caves et al., 2016; van der Ploeg et al., 2018). One at Blake Nose in the western North Atlantic Ocean. Varia-
point of disagreement concerns the early Paleogene. In tions in bio SiO2 fluxes support an early export of NCW, but
the traditional view (hereafter “constant feedback strength also suggest a period of disruption due to diminished AMOC
scenario”), which assumes a linear relationship between between ∼ 42 and 38 Ma, as suggested by the Atlantic-to-
global temperature change and weathering, the early Pale- Pacific bio SiO2 flux fractionation. NCW export likely became
ogene greenhouse climates should facilitate increased rates re-invigorated in the late Eocene, as indicated by a pulse of
of chemical weathering on land directly proportional to the bio SiO2 flux and published paleocirculation proxy records.
magnitude of CO2 -driven warming (e.g., Misra and Froelich, Additionally, BN bio SiO2 fluxes indicate that the long-term
2012; Sluijs et al., 2013; Penman, 2016). An emerging alter- behavior of the silicate weathering thermostat conforms to
https://doi.org/10.5194/cp-17-1937-2021 Clim. Past, 17, 1937–1954, 2021You can also read


