Fine scale genetic structure in the critically endangered red fronted macaw in the absence of geographic and ecological barriers - Nature
←
→
Page content transcription
If your browser does not render page correctly, please read the page content below
www.nature.com/scientificreports
OPEN Fine‑scale genetic structure
in the critically endangered
red‑fronted macaw in the absence
of geographic and ecological
barriers
Guillermo Blanco1*, Francisco Morinha1, Séverine Roques2, Fernando Hiraldo3,
Abraham Rojas4 & José L. Tella3
Behavioural and socio-cultural traits are recognized in the restriction of gene flow in species with
high cognitive capacity and complex societies. This isolation by social barriers has been generally
overlooked in threatened species by assuming disrupted gene flow due to population fragmentation
and decline. We examine the genetic structure and ecology of the global population of the Critically
Endangered red-fronted macaw (Ara rubrogenys), an endemic species to the inter-Andean valleys
of Bolivia. We found a fine-scale genetic structuring in four genetic clusters. Genetic diversity was
higher in wild compared to captive-bred macaws, but similar to that of captive wild-caught macaws.
We found no clear evidence of severe genetic erosion in the population in recent decades, but it
was patent in historic times, overlapping with drastic human habitat transformation and macaw
persecution over millennia. We found no evidence of geographical and ecological barriers, owing to
the high dispersal ability, nesting and foraging habits between genetic clusters. The lack of genetic
intermixing despite long-distance foraging and seasonal movements suggests recruitment in natal
colonies and other social factors reinforcing philopatry-related genetic structure. Conservation efforts
should be specifically focussed on major threats in each genetic cluster as independent conservation
units, and also considered in ex-situ management.
Genetic structure of populations is the result of multiple ecological and evolutionary forces acting in concert1,2.
Limitations to gene flow by geographic barriers or limited dispersal ability are often highlighted as primary causes
of differentiation and genetic structure owing to distance among population n uclei3. This process is often linked
to geo-climatic features, which can also be a main source of ecological filters to gene flow leading to isolation
by adaptation1,4. Distinguishing between these major mechanisms by their contribution to genetic structure of
populations is often challenging for terrestrial birds with high dispersal capacity and generalised habitat use5.
Recently, behaviour and socio-cultural traits have become increasingly recognized in the restriction of gene
flow among populations of species with high cognitive capacity and complex societies, especially mammals like
cetaceans and primates including h umans6.
In birds, evidence of isolation by social barriers is still scarce and restricted to species with complex s ocieties7,8.
Crows, jays and other corvids (Corvidae, Passeriformes) and parrots and allies (Psittaciformes), are among the
birds with a recognised high cognitive capacity, evolving in parallel to complex patterns of social behaviour driv-
ing population organisation9,10. Social barriers to gene flow can act through recognition among individuals from
population nuclei showing particular social and behavioural identities11. For instance, socio-cultural factors may
have played a role in driving genetic structure associated with tool use even at small spatial s cales12,13. Complex
hierarchical, social and ritualised interactions among group members, high mate and site fidelity, and complex
1
Department of Evolutionary Ecology, National Museum of Natural Sciences (MNCN), Spanish National Research
Council (CSIC), José Gutiérrez Abascal 2, 28006 Madrid, Spain. 2Irstea-UR EABX, Ecosystèmes Aquatiques
et Changements Globaux, Equipe FREEMA, 50 avenue de Verdun, 33 612 Cestas, France. 3Department
of Conservation Biology, Estación Biológica de Doñana (CSIC), Avda. Américo Vespucio, 41092 Sevilla,
Spain. 4Zoológico Municipal de Fauna Sudamericana, Radial 27, Tercer Anillo Interno, Santa Cruz de la Sierra,
Bolivia. *email: g.blanco@csic.es
Scientific Reports | (2021) 11:556 | https://doi.org/10.1038/s41598-020-79575-6 1
Vol.:(0123456789)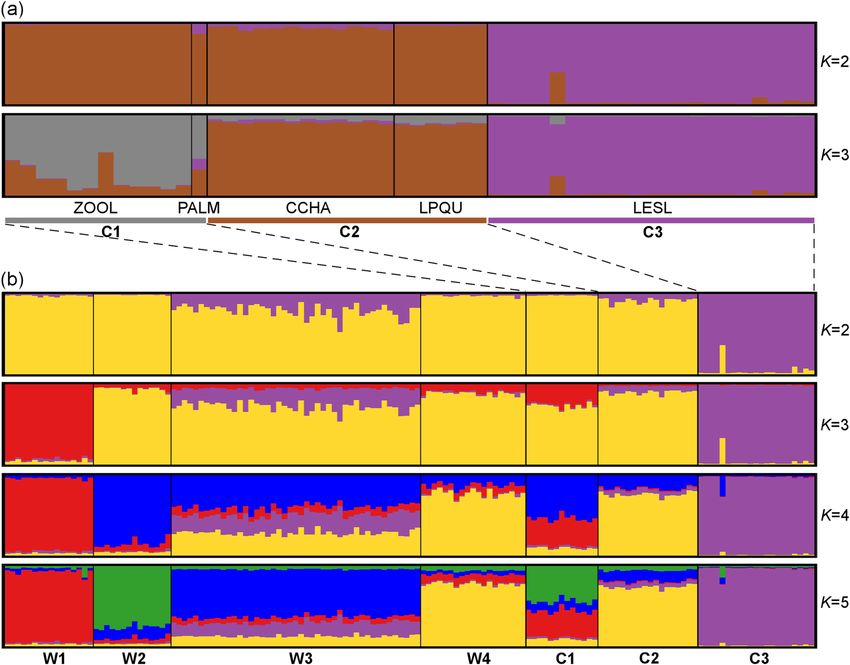
www.nature.com/scientificreports/
vocalisations have been suggested to be involved in the extreme genetic structure in the Red-billed chough (Pyr-
rhocorax pyrrhocorax) despite high dispersal ability and large population s ize8. Evidence of these social traits
and population organisation patterns also exists for p arrots14,15, especially linked to complex vocalisations and
dialects16,17. However, the contribution of geographical, ecological and social barriers to genetic structure of
parrot populations has been poorly investigated at large population scales.
Evaluating the processes and mechanisms that determine the genetic structure of populations is essential
to understand their demographic and ecological d ynamics18. In general, emigration and immigration between
breeding nuclei have been highlighted as key factors driving the genetic structure of populations, since even a
small number of these exchanges per generation can have a great influence on population homogenisation due to
the mixture of different genetic p ools19. Depending on the magnitude of connectivity between populations and
on the reproductive outcomes of dispersers, the genetic structure and diversity can be more or less pronounced.
This variability can be further modulated by historical trends due to past and ongoing threats eroding the viability
of isolated nuclei and of highly fragmented and small populations of threatened species20–22. The influence of
isolation by social barriers on the genetic structure of threatened species has been generally overlooked, often
through assumptions that connectivity is generally disrupted due to population fragmentation associated with
habitat loss and population declines. However, fine-scale genetic structure can be an intrinsic feature evolving in
particular species23,24, as promoted by socio-cultural forces driving pairing, dispersal and group cohesion even
in large and widely distributed populations of social s pecies8,25. A comprehensive evaluation of these traits is
paramount to understanding the structure and functioning of metapopulations and for adequate conservation
management, including captive breeding and reintroduction of threatened s pecies26,27.
Here, we examine the global population genetic structure of the Critically Endangered red-fronted macaw
(Ara rubrogenys). This species represents a suitable study model to investigate the potential drivers of genetic
structuration of rare social species distributed in discrete population nuclei associated with breeding colonies
interconnected by long-distance movements28–30. We inferred population structure from individual genotypes
at nine microsatellite loci from a large part of the main breeding areas throughout its restricted global distribu-
tion range in the inter-Andean valleys of Bolivia30. We focussed on genetic diversity, inbreeding, differentiation
and connectivity among population nuclei, and tested for patterns of contemporary demography through bot-
tleneck analysis. Our main goal is to explore potential mechanisms promoting and limiting gene flow between
subpopulations and genetic clusters, and whether isolating processes related to geographic barriers to dispersal,
adaptation to particular habitats, and social organisation can explain the current genetic structure of the global
population. We also evaluated the genetic characteristics of several captive populations to assess their most likely
wild population nuclei of origin. We discuss ways to apply the information about genetic structure to the conser-
vation of the whole population or of particular genetic clusters, and how this should drive ex-situ conservation
management, including captive breeding and reintroduction.
Results
Sample inclusion criteria and population genetic structure. In total, 162 alleles were amplified to
estimate error rates, i.e. 9 samples typed for 9 alleles, but only 104 (64%) were considered in the analysis after
excluding alleles that did not amplify in at least one of the reactions. These unsuccessful amplifications are
related to low DNA quantities obtained from feather samples. No evidence of false alleles were detected and only
three allelic dropouts (one for locus AgGT90 and two for locus Peeμ11) were identified. The overall error rate
was low (2.9%) considering that low quality DNA samples are more prone to genotype errors. The cumulative
probabilities estimated for the nine microsatellite loci were P(ID) < 0.0001 and P(ID)sib = 0.0013 (Table S1, Fig. S1).
The analysis of genetic relatedness and/or molecular sexing identified 94 different wild individuals (genotypes
of each individual are shown in Appendix S1). Among them, a total of twelve full-sibs were identified in differ-
ent population groups (three in W1; one in W2; six in W3; two in W4). The analysis of genetic differentiation
with and without full-sibs did not affect the results of the clustering analysis. Thus, the full data set with 94 wild
individuals was used in all subsequent analyses. The complete data set includes 146 individuals (94 from wild
populations and 52 from captive birds) with low levels of missing data (one individual missing three loci; eight
individuals missing two loci; 18 individuals missing one locus) (Appendix S1).
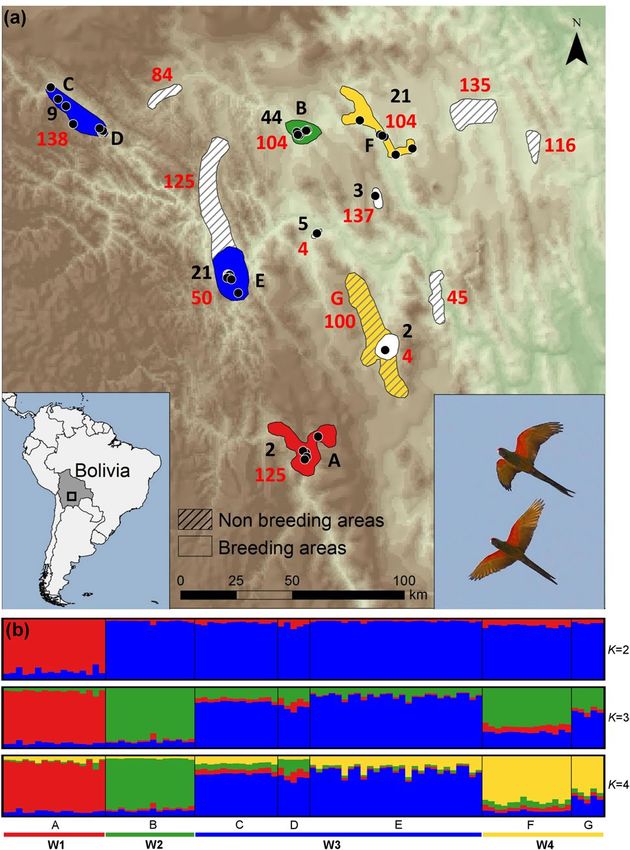
The Bayesian clustering analysis of multilocus genotypes using sample location prior clearly revealed a small-
scale genetic structure of four population nuclei, namely W1 (A), W2 (B), W3 (C, D, E) and W4 (F, G) (Fig. 1a,b).
The number of clusters was supported by both approaches used to estimate the optimal K value (Fig. 1b; Fig. S2a,
b). The hierarchical clustering performed in the second level of STRUCTURE did not detect evidence of popula-
tion differentiation between sites of clusters W3 and W4. No genetic differentiation was detected in the analysis
without sample location priors. All pairwise Fst and altitude estimates were significant (P < 0.01) and highly cor-
related (r = 0.99; P < 0.05) (Table 1). The highest values involved the comparisons between cluster W1 and the
other clusters. The lowest values involved adjacent clusters, W2-W4 and W3-W4 respectively. A PCoA analysis
among wild population groups also supports the STRUCTURE, Fst and Dest estimates (Supplementary Fig. S3a, b).
The captive individuals were clustered into three distinct genetic groups, namely C1 (ZOOL and PALM),
C2 (CCHA and LPQU) and C3 (LESL) (Fig. 2a). The Bayesian clustering analysis of the dataset including both
captive and wild individuals resulted in five different genetic clusters (Fig. 2b). The W4 wild population and C2
captive group belong to the same cluster. The C1 captive group showed a mixed ancestry from individuals belong-
ing to W1 and W2 wild populations (Fig. 2b). These cluster patterns were obtained using the LOCPRIOR option.
No genetic structure was observed in both analyses without sample location priors. The optimal K values were
estimated using the previous developed approach for complex and highly structured data sets. The ∆K method
underestimate the number of clusters in the first level of structure analysis when captive groups where included
(K = 2 for both clustering analysis, Fig. S2c–f).
Scientific Reports | (2021) 11:556 | https://doi.org/10.1038/s41598-020-79575-6 2
Vol:.(1234567890)www.nature.com/scientificreports/
Figure 1. (a) Distribution range of the red-fronted macaw showing the sampled population nuclei (represented
by letter codes: black letters for breeding nuclei, red letter for the single non-breeding area sampled) pooled in
genetic clusters (represented by colours). The number of breeding pairs in each population nucleus at the time
this study was conducted is represented by black numbers, while the maximum flock size in each breeding and
non-breeding areas is represented by red numbers. Black points represent breeding colonies. (b) Distinct genetic
clusters from the Bayesian clustering analysis with prior information on sampling location are shown for several
K clusters. Each vertical line corresponds to one individual and the different colours represent the assignment
to each cluster, with K = 4 as the optimal number of clusters estimated. Map was generated with ArcGIS 10.5
software (ESRI, Redland, USA, https://desktop.arcgis.com/en/) and modified with Microsoft PowerPoint 2010
(Microsoft Corporation, Redmond, WA, USA, https://www.microsoft.com/pt-pt/microsoft-365/previous-versi
ons/office-2010), both software under CSIC Organizational License. Background was generated from Digital
Elevation Model available from USGS (Global 30 Arc-Second Elevation, GTOPO30), freely available at https://
www.usgs.gov/centers/eros/science/usgs-eros-archive-digital-elevation-global-30-arc-second-elevation-gtopo
30?qt-science_center_objects=0#qt-science_center_objects. Author of the photograph: José L. Tella.
Genetic cluster
W1 W2 W3 W4
W1 – 0.157 0.086 0.114
W2 0.106 – 0.083 0.058
W3 0.059 0.049 – 0.055
W4 0.074 0.030 0.036 –
Table 1. Pairwise values of Fst (below diagonal) and Dest (above diagonal) among genetic clusters of red-
fronted macaw in the wild. All estimated values are significant (P < 0.01).
PCoA including both captive and wild individuals also indicated that the genetic composition of those groups
is close, with the exception of the C3 group, which is genetically differentiated from the rest (Supplementary
Fig. S3c, d).
Genetic diversity and demographic events. The polymorphic microsatellite loci selected for this study
(Table S2) allowed the amplification of 62 different alleles, ranging from 3 (MmGT057 and UnaCT74) to 13
Scientific Reports | (2021) 11:556 | https://doi.org/10.1038/s41598-020-79575-6 3
Vol.:(0123456789)www.nature.com/scientificreports/
Figure 2. (a) Distinct genetic clusters from the Bayesian clustering analysis with prior information on sampling
location are shown for several K clusters for captive red-fronted macaws, where the optimal number of clusters
was estimated for K = 3. (b) Clustering analysis combining captive and wild individuals, where the optimal
number of clusters was estimated for K = 5. Each vertical line corresponds to one individual and the different
colours represent the assignment to each cluster. Colours assigned to each cluster correspond to the genetic
clusters obtained for the wild population (see Fig. 1), except for the cluster C3 that cannot be assigned to any
cluster in the wild.
(AgGT21), with an average of 6.89 alleles. At a locus level, average values of allelic richness ranged between
2.04 (UnaCT74) and 6.56 (AgGT21), mean observed heterozygosity ranged between 0.25 (UnaCT74) and 0.81
(UnaCT43), and the mean expected heterozygosity ranged between 0.23 (UnaCT74) and 0.74 (UnaCT43 and
AgGT90) (Supplementary Table S3). The power of discrimination of most markers is supported by PIC val-
ues (global mean of 0.52 ± 0.22), although low PIC values were obtained for MmGT057 (0.25) and UnaCT74
(0.20). Average FIS values ranged between − 0.08 (UnaCT43 and UnaCT74) and 0.07 (AgGT90). Deviation from
Hardy–Weinberg equilibrium (HWE) after Bonferroni correction was detected only for locus (AgGT90) in the
W4 cluster (Supplementary Table S3). No significant evidence for linkage disequilibrium was found, suggesting
that the assayed loci assorted independently.
At a population level, no evidence of deviations from Hardy–Weinberg equilibrium (HWE) was detected in
the wild population, except for W1, which showed a significant heterozygote deficit (Table 2). This can be a result
biased by the substantially lower HO than HE of the locus Peeμ11 in cluster W1 (Table S3), probably influenced
by allelic dropout and some missing data at this locus. FIS for the cluster W1 (0.12) was the largest of all the wild
groups (Table 2). The presence of null alleles is unlikely given the strict selection of markers to discard such bias.
Captive groups were in HW equilibrium, except C3, which showed significant heterozygote excess (Table 2)
suggesting that breeding between individuals did not occur by chance.
A mean of 4.25 alleles per locus was detected among the 94 genotyped wild macaws. We found a similar
value (NA = 4.50) in captive samples from Bolivia, while in captive-bred individuals from Spain the diversity was
extremely low (NA = 2.7) (Table 3). Mean observed and expected heterozygosity in wild population clusters were
0.56 and 0.58, respectively. The heterozygosity value was the lowest in W1 (HO = 0.46) (Table 2). Mean diversity
values of captive groups C1 and C2 were similar to those found in the wild populations, but lower diversity
indices were found in C3 (Table 2). In captive clusters, mean values of observed and expected heterozygosity
were 0.63 and 0.55, respectively. In all captive groups, HO was higher than HE, what is expected after a recent
reduction in size and/or founder event. The magnitude of allelic richness values was similar across wild and
captive genetic clusters, except C3, which showed reduced values of allelic richness (2.92 ± 1.10) and number
Scientific Reports | (2021) 11:556 | https://doi.org/10.1038/s41598-020-79575-6 4
Vol:.(1234567890)www.nature.com/scientificreports/
Genetic cluster HW P value HW P value
(code) n NA AR HO HE (Heterozyg. Deficit) (Heterozyg. Excess) FIS
W1 (A) 16 4.44 (2.07) 4.17 (2.00) 0.46 (0.26) 0.50 (0.30) < 0.01** 0.99 0.12*
W2 (B) 14 4.44 (2.07) 4.18 (1.83) 0.56 (0.20) 0.58 (0.18) 0.09 0.91 0.07
W3 (C, D, E) 45 5.78 (2.68) 4.47 (1.78) 0.59 (0.26) 0.59 (0.24) 0.29 0.71 0.01
W4 (F, G) 19 5.00 (2.18) 4.60 (1.98) 0.61 (0.18) 0.63 (0.18) 0.05 0.95 0.07
C1 (ZOOL, PALM) 13 4.22 (1.56) 4.05 (1.42) 0.61 (0.23) 0.54 (0.19) 0.89 0.11 -0.09
C2 (CCHA, LPQU) 18 5.11 (3.10) 4.67 (2.46) 0.65 (0.29) 0.61 (0.23) 0.88 0.12 -0.05
C3 (LESL) 21 3.22 (1.39) 2.92 (1.10) 0.63 (0.28) 0.49 (0.21) 1.00 < 0.01** -0.27
Table 2. Genetic diversity for each cluster of wild and captive red-fronted macaw. Codes represent the
sampling sites as shown in Table 3. n number of samples, NA number of alleles, AR allelic richness, HO observed
heterozygosity, HE expected heterozygosity, FIS inbreeding coefficients. *p < 0.05; **p < 0.01.
Country Area (code) Origin Sample type na Sample collection NA HO HE
Bolivia Icla (A) Wild Feather 16 Beneath the trees used as main communal roost 4.44 (2.07) 0.46 (0.26) 0.50 (0.30)
Bolivia Omereque (B) Wild Feather 14 Beneath the cliffs with breeding colonies 4.44 (2.07) 0.56 (0.20) 0.58 (0.18)
Foraging areas of pairs with offspring close to the breeding
Bolivia Río Caine (C) Wild Feather 13 4.33 (2.06) 0.57 (0.33) 0.54 (0.26)
colonies
Bolivia Torotoro (D) Wild Blood 5 Local nestlings poached from a particular locality (Torotoro) 3.33 (1.32) 0.51 (0.39) 0.50 (0.26)
Bolivia Río Chico (E) Wild Feather 27 Beneath the cliffs with breeding colonies 4.89 (2.15) 0.61 (0.24) 0.59 (0.21)
Bolivia Anamal (F) Wild Feather 14 Beneath the cliffs with breeding colonies 4.78 (1.99) 0.60 (0.16) 0.63 (0.17)
Adults kept as pets, illegally trapped in foraging areas far from the
Bolivia Tomina (G) Wild Blood 5 3.56 (1.88) 0.62 (0.34) 0.56 (0.21)
breeding colonies
Zoological Park of Santa Cruz de la Sierra; Exposed to the public,
Bolivia Sta. Cruz Zoo (ZOOL) Captive Blood 12 4.00 (1.41) 0.62 (0.22) 0.54 (0.19)
not breeding; Unknown wild origin from poaching
Private owner in Cochabamba; Mostly poached nestlings, not
Bolivia Cochabamba (CCHA) Captive Blood 12 1.44 (0.53) 0.44 (0.53) 0.22 (0.26)
reproducing in captivity
Individuals legally purchased at Loro Parque, a zoological park in
Spain Loro Parque (LPQU) Captive Blood 6 5.00 (2.83) 0.62 (0.26) 0.61 (0.22)
Santa Cruz de Tenerife, Canary Islands
Individual legally purchased at Palmitos Park, a zoological park in
Spain Palmitos Park (PALM) Captive Blood 1 3.44 (1.33) 0.72 (0.38) 0.54 (0.28)
Gran Canaria, Canary Islands
Private collection breeding in captivity; Originated from six wild
Spain Málaga (LESL) Captive Feather/blood 21 macaws internationally traded and legally purchased 30 years ago 3.22 (1.39) 0.63 (0.28) 0.49 (0.21)
in England
Table 3. Sampling characterisation, circumstances around sample collection and microsatellite genetic
diversity indices for all localities. NA number of alleles, HO observed heterozygosity, HE expected
heterozygosity. a Number of samples included in the final data set considering only one sample per individual
and the missing data threshold.
of alleles (3.22 ± 1.39) (Table 2). Only six private alleles were found in both wild (W1 and W2) and captive (C2
and C3) genetic clusters (Table S4).
The results of the analysis with BOTTLENECK suggested historical population contraction events in popula-
tions W3 and W4 only when assuming an infinite allele model (IAM; Table 4). No evidence of bottlenecks was
found using the two-phase model (TPM), stepwise-mutation model (SMM) or the mode-shift test, although a
significant value for heterozygote deficiency was obtained for population W3 using TPM (Table 4). The M-ratio
test consistently suggests population contractions (values of M < Mc) in all clusters considering all pre-bottleneck
Ne values (Table 4).
Migration rates, relatedness and gene flow. Migration rates (m) among genetic clusters were gen-
erally low, with a global mean value of 0.056 (ranging from 0.016 to 0.192) (Table 5, Supplementary Fig. S4).
Moderate values were obtained only for population W3, with a mean value of 0.130 ± 0.063. Assignment tests
implemented in GENECLASS2 identified only 3 potential migrants with a p-value < 0.01. One migrant from
population W2 was found in populations W1 and W4, and one migrant from W4 was found in W2.
Results from the 2MOD analysis in wild macaws supported a gene flow-drift equilibrium model over a drift-
alone model [p (gene flow) = 0.969]. The cluster W1 showed the largest identity by descent value (F-value = 0.104)
under this model and the lowest estimates of immigrants per generation (M = 4.10), which can be inferred as the
product of drift given its higher geographic isolation. Different F-values and immigrants per generation were
estimated for the other three populations, namely W2 (F-value = 0.090; M = 5.06), W3 (F-value = 0.034; M = 13.38)
and W4 (F-value = 0.048; M = 9.92).
Scientific Reports | (2021) 11:556 | https://doi.org/10.1038/s41598-020-79575-6 5
Vol.:(0123456789)www.nature.com/scientificreports/
Bottleneck M-ratio (Mc)
TPM SMM IAM
Genetic cluster P-values P-values P-values Mode-shift M θ = 0.1 θ=1 θ = 10
W1 0.180 0.180 0.410 Normal L-shaped 0.421 0.763 0.693 0.590
W2 0.545 0.633 0.082 Normal L-shaped 0.528 0.767 0.695 0.575
W3 0.936 0.986* 0.009 Normal L-shaped 0.265 0.767 0.706 0.669
W4 0.248 0.500 0.005 Normal L-shaped 0.272 0.761 0.698 0.605
Table 4. Results of the bottleneck analysis. P-values of the one-tail Wilcoxon test for heterozygote excess are
shown for the Two-Phase Model (TPM), Stepwise Mutation Model (SMM) and Infinite Allele Model (IAM).
For the Mode-shift test, modes obtained for each population are indicated. Values of the observed M-ratio
(M) and critical ratio (Mc) were estimated for three values of pre-bottleneck θ that correspond to Ne values
of 50, 500 and 5000, respectively. Values in bold suggest historic bottleneck events. *Significant p-values were
obtained for heterozygote deficiency (p < 0.05).
Population To
From W1 W2 W3 W4
W1 0.8812 (0.0477) 0.0248 (0.0251) 0.0654 (0.0394) 0.0286(0.0280)
W2 0.0314 (0.0290) 0.7293 (0.0542) 0.1920 (0.0491) 0.0473(0.0413)
W3 0.0348 (0.0228) 0.0155 (0.0155) 0.9281 (0.0274) 0.0216(0.0173)
W4 0.0288 (0.0270) 0.0495 (0.0509) 0.1311 (0.0446) 0.7907(0.0565)
Table 5. Contemporary gene flow (m, migration rate, results from BAYESASS) estimated between the four
wild genetic clusters of the red-fronted macaw in the wild. Standard deviation of the marginal posterior
distribution for each estimate is noted in parentheses. Migration rates indicate the fraction of individuals in the
population of destination that are migrants derived from the source population (per generation).
The cluster W1 showed the highest relatedness values (0.25 ± 0.24) among wild samples (Supplementary
Fig. S5, Appendix S2). The highest values of r in captive groups were obtained for C1 (0.17 ± 0.25) and C3
(0.39 ± 0.22). The remaining wild and captive groups have mean r values ranging from -0.03 ± 0.24 (W4) to
0.10 ± 0.24 (W2) (Supplementary Fig. S5, Appendix S2). Estimates of effective population size (Ne) for each
population group were 57 (CI = 14-inf) for W1, 105 (CI = 17-inf) for W2, 81 (CI = 35–2698) for W3 and 38
(CI = 16-inf) for W4. The value of Ne considering all individuals as a single population was 87 (CI = 52–188).
The analysis of IBD showed a tendency of lower genetic differences at higher geographic proximity, although
the correlation between genetic and geographic distances was not significant (Mantel test; Z = 109.12, r = 0.55,
P = 0.15). The RMA regression line for Fst explained 28.14% of the variation (Supplementary Fig. S6a). The results
were also not significant when the population further south (A-W1) was excluded from the analysis (Mantel
test; Z = 42.19, r = 0.08, P = 0.86), where the RMA explained only 3.6% of the variation (Supplementary Fig. S6b).
Breeding colonies, flock size and diet. Overall, we recorded the characteristics of the 42 breeding colo-
nies located within the four genetic clusters (Supplementary Table S5), plus one colony from a population nuclei
not sampled for genetic analyses. All sampled colonies were located on rocky cliffs of variable size and orienta-
tion along the main rivers at elevations ranging from 1300 to 2600 m a.s.l. (Supplementary Table S5). Univariate
comparisons showed that elevation of the breeding colonies differed between genetic clusters, with colonies
within genetic cluster W1 located at the highest elevations and those in the genetic cluster W4 at the lowest
elevations (Supplementary Table S5). Length and width of the nesting cliffs, their orientation and distance to the
nearest river did not differ between genetic clusters (Supplementary Table S5).
Maximum flock size in each breeding and non-breeding area was higher than the number of breeding indi-
viduals in each breeding area (Fig. 1a). Non-breeding areas were located at variable distances from the nearest
breeding areas, and often at intermediate distances between breeding areas corresponding to different genetic
clusters. Maximum flock size in non-breeding areas were also generally higher than those in the nearest breeding
area and genetic cluster (Fig. 1a).
The foraging activity of 197 macaw flocks comprising 2180 individuals was recorded in the breeding areas,
while 23 foraging flocks comprising 361 macaws were observed in the non-breeding areas (Table 6). The size of
foraging flocks in the breeding areas did not differ between genetic clusters (Kruskal–Wallis test, H = 3.69, df = 3,
P = 0.29, n = 177), or between breeding areas (mean ± SD = 11.1 ± 17.0, n = 197, pooling all genetic clusters plus
the breeding area not sampled for genetic samples) and non-breeding areas (15.7 ± 17.8, n = 23) (Kruskal–Wallis
test, H = 3.36, df = 1, P = 0.07, n = 220).
A total of 19 plant species were recorded being consumed by red-fronted macaws (Table 6). Diet composi-
tion showed no clear differences among genetic clusters, mainly because three vegetal species, namely Palo
Borracho (Jatropha hieronymi, Euphorbiaceae), Soto (Schinopsis marginata, Anacardiaceae) and cultivated
maize (Zea mays, Poaceae), were dominantly exploited by flocks and individuals in all areas (Table 6). Peanut
(Arachis hypogaea) crops were also exploited frequently in all clusters (especially in W1) except cluster W4. The
Scientific Reports | (2021) 11:556 | https://doi.org/10.1038/s41598-020-79575-6 6
Vol:.(1234567890)www.nature.com/scientificreports/
Genetic cluster Breeding areas Non-breeding areas
W1 W2 W3 W4 Total Total
Species F/I F/I F/I F/I F (%) I (%) F (%) I (%)
Jatropha hieronymi 4/14 21/139 5/36 4/18 45 (22.8) 402 (18.4) 2 (8.7) 12 (3.3)
Schinopsis marginata 2/8 5/17 14/166 23/260 44 (22.3) 451 (20.7) 5 (21.7) 42 (11.6)
Zea mays 1/2 10/69 10/213 6/212 27 (13.7) 496 (22.8) 10 (43.5) 246 (68.1)
Prosopis kuntzei 3/30 17/69 20 (10.2) 99 (4.5)
Arachis hypogaea 4/92 1/4 8/145 13 (6.6) 241 (11.1) 5 (21.7) 59 (16.3)
Prosopis alba 7/139 2/5 9 (4.6) 144 (6.6)
Ziziphus mistol 1/24 9 (4.6) 84 (3.9)
Schinus molle 1/1 1/4 6/78 8 (4.1) 83 (3.8)
Anadenanthera colubrina 1/6 4/17 5 (2.5) 23 (1.1)
Loxopterygium grisebachii 2/11 2/12 4 (2.0) 23 (1.1)
Cnidoscolus sp. 3/11 4 (2.0) 23 (1.1)
Cenchrus sp. 2/13 2 (1.0) 13 (0.6)
Neoraimondia herzogiana 1/11 1/2 2 (1.0) 13 (0.6)
Anisocapparis speciosa 1/22 1 (0.5) 22 (1.0)
Aspidosperma quebracho-blanco 1 (4.3) 2 (0.6)
Celtis ehrenbergiana 1/6 1 (0.5) 6 (0.3)
Parkinsonia praecox 1/3 1 (0.5) 3 (0.1)
Selaginella sellowii 1/42 1 (0.5) 42 (1.9)
Senegalia visco 1/12 1 (0.5) 12 (0.6)
Total 12/117 49/349 71/879 45/568 197 (100) 2180 (100) 23 (100) 361 (100)
n plant species 5 12 9 10 18 5
Table 6. Diet composition of the red-fronted macaw in each genetic cluster, and pooled breeding and non-
breeding areas, according to flocks (F) and individuals (I). Cultivated species are shown in bold.
exploitation of these four vegetal species accounts for about 52–92% of foraging flocks and 64–99% of foraging
individuals in the areas corresponding to each genetic cluster. All the remaining vegetal species sum > 10.2% of
flocks or > 6.6% of foraging individuals in the breeding areas. Foraging flocks outside the breeding areas were
recorded feeding on the same four plant species, although the sample size was lower than in the breeding areas
(Table 6). One species, Quebracho Blanco (Aspidosperma quebracho-blanco, Apocynaceae), was infrequently
consumed in the non-breeding areas and not consumed in the breeding areas. The exploitation of crops was
lower in the breeding areas (20.3% of flocks and 33.8% of individuals) than in the non-breeding areas (65.2%
of flocks and 84.5% of individuals) (Fisher exact test, both P < 0.0001). The size of flocks exploiting crops was
similar between breeding and non-breeding areas (Mann–Whitney U-test, z = 1.09, P = 0.27). Pooling breeding
and non-breeding areas and plant species, the size of flocks feeding on crops (mean ± SD = 18.9 ± 24.9, n = 55)
was larger than that of flocks feeding on non-cultivated plants (9.1 ± 12.8, n = 165) (z = 2.96, P = 0.003).
Discussion
Genetic structure and diversity. In this study, we found evidence for a fine-scale genetic structuring
across the whole population of the red-fronted macaw. Four genetic clusters were defined, corresponding to dif-
ferent breeding colonies spatially grouped along main rivers. The genetic structure over a much smaller spatial
scale than that observed for other large parrot species with high dispersal a bility31–33 is unexpected given the
short distances between population nuclei and the great dispersal potential of the red-fronted m acaw28–30.
Our genetic assay successfully identified a total of 94 wild individuals, which represent about 10% of the extant
world population estimated in the last published s urvey30, when our genetic survey was also conducted. Despite
the successful cross-species transfer of the nine microsatellites markers selected for this study, we cannot exclude
a potential effect of ascertainment bias (i.e. microsatellite repeats tend to be longer and more polymorphic in the
source species than in the new target species)34. Therefore, the comparison of our microsatellite data with results
obtained for other species should be done cautiously. PIC values indicated a good informative level of these
microsatellites, including five highly informative (PIC > 0.5), three reasonably informative (0.5 > PIC > 0.25) and
only one slightly informative (PIC < 0.25). The cumulative probability of identity of our microsatellite data set was
less than 0.01, as recommended for population studies using noninvasive sampling35. The collection of moulted
feathers in the colonies and their close surroundings was relatively precise in assigning individuals to their actual
population nuclei of breeding and natal origin, although this could only be ensured by sampling nestlings in their
colonies. While the genetic heterogeneity of the whole population may reflect biologically relevant differences
between population nuclei, low gene exchanges among sampling sites were also detected, as shown by clustering
analysis, mean assignment values and estimates of migration rates. Therefore, the apparently low gene flow among
genetic clusters may simply indicate the inclusion in the analysis of a few transient individuals moving from
Scientific Reports | (2021) 11:556 | https://doi.org/10.1038/s41598-020-79575-6 7
Vol.:(0123456789)www.nature.com/scientificreports/
adjacent colonies, rather than actual genetic intermixing across generations that would have resulted in a lack
of genetic s tructure19,36. The genetic clusters grouped nearby breeding colonies across geographically continu-
ous cliffs along major water courses, although one of the clusters (W3) included discontinuous breeding areas
separated by about 100 km. This suggests that macaws may not necessarily disperse to the nearest colonies over
more distant ones. This may also be the consequence of population fragmentation, as several distinct genetic
clusters were located within shorter distances of each other (e.g. W2–W4) compared to population nuclei cor-
responding to the same genetic cluster (e.g. W3). The effect of geographic isolation on genetic isolation appears
to be more evident for the southernmost and geographically isolated genetic cluster (W1), which was supported
by high assignment values. This was also supported by the lowest number of breeding pairs, a high proportion
of non-breeding individuals30, and a low effective population size in this population nucleus. Furthermore,
while coalescent-based simulations supported a model of drift-gene flow equilibrium for the whole population,
the largest identity by descent value, the lowest estimates of contemporary gene flow, and high inbreeding and
relatedness indices supported the effects of genetic erosion in the southernmost genetic cluster. These processes
can exert a clear influence on a reduction in effective population size and contribute to unequal genetic erosion
among population n uclei37,38. While a complete divergence among populations should translate into pronounced
genetic differences, many private alleles and highly distinct gene clusters, a secondary contact of populations with
a rather recent common ancestry should translate to weak differentiation and some level of gene fl ow39,40. This
generally occurs because even a small number of individual exchanges may prompt genetic h omogenisation19.
Therefore, the low level of private allelic richness in each genetic cluster, together with some degree of admixture,
suggests that the current genetic structure is most likely not the result of genetic fragmentation from a single
homogeneous genetic unit in the past. This is supported by the inclusion in the same genetic cluster of breeding
colonies separated by relatively large distance. The genetic differentiation observed is only supported by clustering
analysis with sample location priors, which may suggest a weak population structure. However, the clustering
algorithm with sample location priors assumes that the assignment probabilities to a population of origin vary
among locations, not being biased to detect population structure where it does not e xist41.
Results support that genetic diversity has been probably more affected by historical events than contemporary
ones. The lack of a clear significant influence of bottlenecks on heterozygosity-excess tests, except in particular
clusters, further indicates a population structure that is not severely affected by genetic diversity loss due to recent
demographic processes42. On the contrary, the strong evidence of bottlenecks in M-ratio tests clearly support
historical (distant past) population contractions eroding genetic diversity across the whole p opulation43,44. The
M-ratio can detect population size reductions up to approximately 125 generations if the population rebounded
quickly after a severe bottleneck event, and up to 500 generations if the population size remains r educed45. This
suggests that the genetic structure currently observed may likely not be a consequence of genetic erosion in the
long-term, because even a reduced gene flow from individuals moving between clusters could have contributed
to diluting any structure subsequently, at least during the historical time scale than can be inferred from the study
of nuclear markers. Given the approximate generation length estimated for this species (12.7 years according to
the IUCN46), the historic bottlenecks coincided with drastic habitat fragmentation and transformation in the
inter-Andean dry forest of Bolivia by humans during the last Holocene (4000 cal BP—Present), rather than with
climatic conditions that were relatively stable during this p eriod47–49. Habitat transformation by humans began
3000 years ago and was especially intense during the expansion of the Inca Empire in the fifteenth century, when
the inter-Andean valleys were a main source of maize, pasture for llama (Lama glama) used for transport, and
firewood47,50,51. During this period, the persecution of macaws because of their impact on maize crops, and their
capture for trade as “prestige goods” and for colourful feathers used in decorative objects and as tributes52–56,
could have contributed to the historic bottlenecks. Rather than due to human impact, older bottlenecks should
be linked to geo-climatic events, which could be inferred by future analysis of mitochondrial DNA.
Overall, the genetic diversity was higher in wild macaws than in captive-bred ones in Spain, but was similar to
that observed in individuals maintained in captivity in Bolivia. This was expected, because wild-caught macaws
maintained in captivity in Bolivia were captured over the whole range of the species, and founder events should
have been limited. Since these individuals do not reproduce in captivity in Bolivia, they cannot be affected
by additional inbreeding due to artificial pairing between close relatives, as often occurs in captive-breeding
groups57,58. In contrast, diversity indices in the captive groups in Spain were particularly low, which suggest
that the founder effect due to introduction of only a few individuals 30 years ago in the pet market resulted in a
reduced diversity and higher inbreeding levels. In particular, the continued breeding between close relatives in
the captive group in Malaga promoted the lowest genetic diversity and its classification in a single genetic cluster
(C3), whose origin in wild populations cannot be identified among the sampled nuclei. This population shows
the lowest allelic richness value but a high heterozygosity value, which is expected in the first generations after
a founder event with a reduced number of individuals and absence of random m ating59,60. Whether this cluster
corresponds to an unsampled population in the wild or emerged as the result of artificial cross-pairing between
relatives, it reveals that genetic identity can be maintained even under conditions of high inbreeding. On the
contrary, the Bayesian clustering analysis classified captive individuals from a private owner in Cochabamba
and those from Loro Parque as corresponding to the wild cluster W4. The captive group in the Zoological Park
of Santa Cruz de la Sierra showed a mixed ancestry from two of the genetic clusters in the wild, which indi-
cates that individuals from these clusters were simply maintained together. Our microsatellite panel allowing
differentiation and assignment of both wild and captive groups could be a powerful tool for conservation and
management actions. Further development of new nuclear markers and the analysis of mitochondrial markers
are necessary to improve individual assignment tests and to deepen the knowledge on the diversity and structure
of red-fronted macaw populations.
Scientific Reports | (2021) 11:556 | https://doi.org/10.1038/s41598-020-79575-6 8
Vol:.(1234567890)www.nature.com/scientificreports/
Drivers of population genetic structure. Genetic structure generally arises as a consequence of spe-
cies-specific life history traits and their interactions with environmental features like habitat fragmentation and
heterogeneity2,61, and population characteristics like density and d emography62. Dispersal patterns have been
highlighted to greatly contribute to the distribution of genotypes across geographical areas and distribution
ranges1. However, even highly mobile terrestrial birds can show low levels of gene flow leading to strong genetic
structure8. In general, parrots are generalist plant consumers able to make daily, seasonal, and altitudinal long-
distance movements by tracking the abundance or preference of food resources63. Red-fronted macaws disperse
over large areas through long-distance daily flights, including altitudinal movements during the breeding season,
and longer seasonal movements to occupy distant foraging areas during the non-breeding s eason28–30. Distances
between breeding nuclei forming the genetic clusters observed in the wild population were relatively short for
precluding the genetic intermixing of individuals of this vagile s pecies29,30. In fact, the analysis of isolation by
distance showed a tendency of lower genetic differences at higher geographic proximity, although this was very
influenced by the effect of the southernmost isolated genetic cluster. The extent of the altitudinal movements30
and the lack of high mountains or unsuitable habitat between genetic clusters indicate that isolation by distance
or physical barriers are not important mechanisms limiting gene flow leading to the observed genetic structure.
This is further supported by the use of non-breeding areas by flocks larger than those observed in each respec-
tively nearest breeding area or genetic cluster. This suggests the intermixing of individuals from different popu-
lation nuclei and genetic clusters during temporary associations in large flocks at non-breeding areas, mainly
to exploit maize and peanut crops28–30. This intermixing should be confirmed by future genetic identification of
individuals foraging and communally roosting in each non-breeding area, which would be useful to determine
the importance of foraging and roosting sites for each genetic cluster.
Other studies have described a similarly unexpected fine-scale genetic structure not related to dispersal
capabilities, but to a combination of ecological, behavioural and/or evolutionary mechanisms1. Among drivers
of population genetic structure, landscape and ecological features can be major barriers to gene flow between
populations64,65. This mechanism of isolation by adaptation to specific local conditions does not seem to influence
the genetic heterogeneity of the red-fronted macaw population. This is based on the lack of important differences
in the location and physical features of the cliffs with breeding colonies and their close surroundings in each
genetic cluster. Only altitude of the colonies differed between genetic clusters, although the range of variation is
lower than that of the daily and altitudinal movements of m acaws30. This indicates an effect of the location of cliffs
available for colonial nesting in the geographic location of genetic clusters, rather than actual ecological adapta-
tion leading to genetic differentiation. However, among the nuclei not sampled for genetic analysis was a small
population of red-fronted macaw nesting on p alms66, which constitutes an exception that deserves future research
for its implications on potential genetic identity associated with nesting habits. In addition, foraging habitat did
not differ between population nuclei, and individuals from each particular genetic cluster can extensively move
to exploit distant regional and seasonal r esources29,30,67. In fact, diet composition showed no differences among
genetic clusters, as four vegetal species were dominantly exploited across genetic clusters and non-breeding areas
throughout the year, while a variety of food species are exploited seasonally at lower f requencies28,67. Differences
in the frequency of different plants in the diet were even greater between breeding and non-breeding areas than
among the breeding areas comprising the genetic clusters, mainly due to the primary exploitation of crops by
large flocks in the non-breeding areas. Published models on foraging and habitat selection showed preference
for humanized areas (degraded forest patches with crops), but not affected by densities of houses and livestock
as proxies of human presence and d isturbance30. In addition, this species is relatively tolerant in terms of human
presence, since it frequently nests and forages in very accessible places and agricultural areas with constant human
presence. Therefore, the ecology of macaws in each genetic cluster, as a filter to dispersal and effective interchange
between population nuclei, does not support the hypothesis that adaptations to specific local conditions (affected
or not by human activities) would reduce performance of dispersers elsewhere.
In the absence of geographical and ecological barriers, isolation by socio-cultural and behavioural factors
arises as a reliable mechanism driving fine-scale genetic structure in highly social s pecies68. In this context,
the spatial distribution of breeding populations is an important social factor in shaping the patterns of genetic
diversity throughout a species’ range69,70, often associated with and maintained by coloniality, natal or breed-
ing philopatry, and coordinated dispersal of r elatives71. Several highly vagile and colonial species are faithful
to their natal area, which may determine strong genetic structure over small spatial scales despite large-scale
movements8,72,73. The red-fronted macaw nests in colonies that are repeatedly used across y ears28,30,74, which may
favour a patchy distribution of suitable nesting habitat and potential philopatric behaviour of breeding pairs, as
is common among parrots32,75. Social imprinting to natal colonies may also reinforce philopatry-related genetic
structure32, but it may act to the detriment of genetic variability by promoting i nbreeding76. As occurs in other
long-lived and highly social species8,77, red-fronted macaws from different genetic nuclei can likely flock together
in foraging areas and roosting sites used across daily, seasonal and annual long-distance m ovements28–30. The
lack of actual genetic intermixing thus arises despite possible intermixing of flocks from different genetic clusters
in non-breeding areas used temporarily, which indicates very limited effective dispersal leading to recruitment
into non-natal genetic clusters. This can arise by individual recognition within social groups strongly attached to
natal and breeding colonies in this species, which may be achieved through complex organisation and behaviour
facilitated by informative v ocalisations78 and dialects common among parrots16,17,79.
Evidence of isolation by social behaviour has been suggested in bird species with complex societies, includ-
ing cooperative breeding and lekking mating systems7,71. A combination of strong natal philopatry, close bonds
among group members sharing social identity, within-group reproductive skew and kin-cooperation could
provide the strong group stability behind pronounced genetic structure observed in these s pecies7,8,68,71. A similar
combination of factors may concur to explain the genetic structure in the red-fronted macaw irrespective of the
Scientific Reports | (2021) 11:556 | https://doi.org/10.1038/s41598-020-79575-6 9
Vol.:(0123456789)www.nature.com/scientificreports/
potential loss of genetic diversity in particular genetic clusters due to population decline and inbreeding. Few
studies have considered this mechanism to explain the unexpected fine-scale genetic structure despite the high
mobility of parrots. For instance, social barriers could influence the unexpected fine-scale genetic structure of
the cooperative-breeding El Oro parakeet (Pyrrhura orcesi)21, as complex social organisation in birds can drive
decisions about dispersal from family flocks, and the skewed acceptance of dispersers into other g roups7,71.
Remarkably, the breeding pairs (about 100 in the last census) represent a small proportion (c. 20%) of the
whole red-fronted macaw p opulation30, as is the case of other colonial cliff-nesting macaw s pecies80, which may
be indicative of restricted breeding opportunities linked to unfavourable environmental conditions and delayed
breeding81–83. A non-mutually exclusive hypothesis states that, regardless of environmental limitations, a high
proportion of non-breeding individuals can be a consequence of the within-group reproductive skew necessary
to maintain the genetic identity of each cluster without losing genetic diversity. In fact, a high proportion of non-
breeding individuals is typical of long-lived species with complex societies and pronounced genetic structure,
where access to reproduction can depend on familiar and social f actors8,71,82,84. Therefore, a high proportion of
non-breeding individuals in long-lived species with no cooperative breeding could be a species-specific trait
evolved to attain enough genetic variability allowing specific pairings among group members of extended family
networks, which deserves further research. Inbreeding depression due to artificial pairing between close relatives
in captivity represents the opposite process, as it can lead to a specific genetic signature associated with a patent
loss of genetic diversity (e.g. cluster C3). More research on genetic diversity and structure of wild and captive
populations is required to support this hypothesis, since high inbreeding levels can introduce biased inferences
ethods85,86.
in clustering m
Concluding remarks and implications for conservation. Evolutionary history under isolation has
been argued to be a major driver of genetic diversity and effective population size especially in rare and threat-
ened species38 with geographically-restricted ranges87. Factors generally promoting these kinds of genetic and
population patterns include geo-climatic events like glaciations isolating small populations in geographically-
restricted refugia and habitats88,89, as well as the founder effect and extreme population isolation in oceanic
islands90. The red-fronted macaw adjusts to this evolutionary pattern, as it evolved in isolation in the tropical
inter-Andean dry-forest since the rapid uplift that occurred about 10 million years ago in this sector of the
Andes range91. This event meant the isolation of the relatively small extension of the dry-valleys of Bolivia from
the Gran Chaco region, and it was the origin of the high level of plant endemism present in the region92,93 with
which the red-fronted macaw coevolved67,94. The genetic and population characteristics (including the high non-
breeder proportion) currently observed in the global population of the red-fronted macaw represent intrinsic
features that have evolved as adaptations increasing fitness and population performance under these particular
eco-evolutionary conditions. If this hypothesis can be demonstrated as true, this would imply a specific attention
on the singular genetic and population structure of this species as key targets for its conservation.
Evidence for a fine-scale structuring in four relatively independent genetic clusters has important implications
in the conservation of the whole population of the red-fronted macaw. This species currently shows variable levels
of genetic diversity depending on the genetic cluster. However, there is no clear evidence of strong genetic erosion
in the population as a whole in the last decades, but rather in the last centuries or millennia. Genetic diversity,
reflected in heterozygosity values, is lower than that observed for widely distributed p arrots95, but similar or
higher than those reported for endangered parrot species with restricted distribution ranges or recent popula-
tion declines96–98. However, these results should be interpreted with caution when different markers were used
to estimate genetic diversity indices99. In addition, low heterozygosity is not always derived from a reduction in
effective population s ize60, as demonstrated by the relatively high heterozygosity of the captive cluster C3 despite
high actual inbreeding and low allelic richness.
Recent declines due to habitat transformation and human-mediated mortality by persecution of adult birds
in agricultural areas and nestling poaching for the local pet trade30 have reduced the population size, and could
have contributed to the reduction of genetic diversity in some breeding nuclei. The persecution outside breeding
areas may further exert an important effect in the reduction of the total and non-breeding population buffering
breeder mortality. Of concern is the loss of breeding pairs by direct persecution in the colonies and their sur-
roundings, and by alterations in the nesting habitats, which may exert especially detrimental effects on the effec-
tive population size. This is based on the expected concerning effects on population viability and dynamics from
adult mortality in long-lived species with deferred maturity and low reproductive rates, as in large macaws80,100.
In addition, the impact on breeders may greatly reduce genetic diversity under the hypothesis that they harbour
most of it as enhanced by highly selective pairings in each genetic cluster. Future investigation should be directed
to confirm or reject this hypothesis.
This study emphasises that conservation efforts for the Critically Endangered red-fronted macaw should be
focussed on multiple fronts30, but especially on the particularly more detrimental threats in each genetic cluster
as independent conservation units101,102. The restricted range composed of relatively homogeneous habitats may
increase extinction risk for the whole population more rapidly through environmental c orrelation103 than due
to genetic depression on each particular cluster26,104. Therefore, to implement a global conservation strategy
preserving these evolutionary units as components of the overall genetic integrity, a comprehensive evaluation
is required on the key habitats, home ranges and availability of food resources in each genetic cluster. Special
attention should be directed to avoid nestling poaching for the local pet trade and persecution of adults, as key
threats with a high impact shared by all population nuclei30. Finally, our genetic approach is sufficiently reliable
to serve as a reference for future estimations on genetic diversity and potential current or future demographic
bottlenecks in each genetic cluster. Future genetic analysis of the three wild breeding nuclei not sampled in this
study will serve to determine the potential existence of additional clusters with a singular genetic identity. This
Scientific Reports | (2021) 11:556 | https://doi.org/10.1038/s41598-020-79575-6 10
Vol:.(1234567890)www.nature.com/scientificreports/
will also help to better identify the origin of captive individuals, and those admitted in recovery centres after
seizure from illegal trade. The assignment of captive individuals to each genetic cluster may be useful to form
suitable captive-breeding nuclei for future potential reinforcement programs and reintroduction of individuals
in their corresponding genetic nuclei in the wild.
Materials and methods
Study area and study species. The red-fronted macaw is a colonial, cliff-nesting species endemic to the
inter-Andean valleys of Bolivia. This is a wide, rugged and dry area located on the eastern slopes of the central
Bolivian Andes at altitudes from 900 to 3500 m, in the departments of Santa Cruz, Cochabamba, Chuquisaca,
and Potosi30. The habitat is dominated by tropical dry forest with a high proportion of endemism, transformed
by long-term human activities to thorn and cactus scrub with scattered trees in hillsides and riverine forest and
crops in valley bottoms92.
The small population size, reduced distribution range, and recent decline led to the listing of the species as
“Critically Endangered” according to the IUCN Red L ist46. Population estimates varied from 5000 individuals
in the 1980s to 2000–4000 or as few as 700–800 individuals and less than 100 breeding pairs in recent years30,46.
Forest loss and degradation due to agriculture expansion, overgrazing and firewood cutting, and poaching of
nestlings for local pets, are considered the major threats to the s pecies30,46.
Fieldwork. This genetic approach benefits from previous fieldwork conducted for assessing the global dis-
tribution and population size of the species, its seasonal movements, diet and foraging habits as detailed in our
previous publications30,67,94. Briefly, all known breeding colonies and another found for first time, as well as com-
munal roosting sites, were simultaneously monitored in 2011, allowing us to estimate the global population size
(c. 800 individuals), with c. 100 pairs breeding in 8 discrete areas (summing 1298 k m2, 114–300 k m2 each, see
Fig. 1a), and a non-breeding population reaching c. 80% of the t otal30. To characterise the breeding colonies, we
recorded the nesting substrate, height, width (in m), orientation (transformed to radians for statistical analysis),
altitude (in m above sea level), and distance (in m) to the nearest river of the cliffs holding breeding c olonies30.
Breeding nuclei are located in river cliffs. The population size was much larger in the recent past30, and thus in
the last decades some breeding cliffs have been abandoned. For instance, in the first more complete census of
the species, it had already disappeared as breeder of six cliff areas, while it was found breeding in 12 new cliffs
where its reproductive presence was not known b efore30. This species nests in a wide altitude range, where we
found another 81 cliffs not occupied by the species, while in 41 of them nested up four other parrot species that
usually nest coexisting with the red-fronted macaw in the same cliffs. Therefore, we can assume that at least a
proportion of these cliffs could be suitable for macaws according to their features, similar to those of used cliffs.
Therefore, the availability of cliffs is apparently not a limiting factor, although there is no more data on breeding
areas than known after intensive searching by us, other research teams, and personnel of local governments,
especially in protected areas.
Seasonal movements were studied in 2011–2012 (588 flocks recorded), showing changes in flock size and
movements of macaws between 953 and 3094 m a.s.l. that increased after the breeding season to occupy six
non-breeding foraging areas (summing 1329 k m2, each range 61–459 k m2, see Fig. 1a)30. The foraging ecology
and diet of the species was studied year-round during 2011–2013, through roadside surveys (totalling 6823 km)
conducted during 153 fieldwork days in eight expeditions, which allowed us to record 220 foraging flocks (sum-
ming c. 2500 individuals) and the plant species they were c onsuming67,94.
Samples of blood and feathers were collected from both wild and captive individuals in Bolivia and from
captive individuals in Spain (Table 3). The sampling area covered the whole distribution of the species in the
wild, although colonies from a few areas were not sampled due to very difficult access (Fig. 1). Field surveys
were optimised in space to ensure the sampling of individuals from previously undetected p opulations30. A
total of 114 wing and tail feathers were collected from five areas (Table 3) during field surveys conducted in
2012. All feathers were sampled at the end of the breeding period beneath the cliffs with breeding colonies and
their surroundings, and in communal roosts close to the colonies (Table 3). Blood samples were obtained from
five nestlings poached in a breeding area (code D in Table 3, Fig. 1) and five adults recently captured in a non-
breeding area (code G in Table 3, Fig. 1).
Regarding the captive populations, blood samples were obtained in 2012 from the Zoo of Santa Cruz de la
Sierra (ZOOL, n = 12) and from a private owner in Cochamamba (COCH, n = 12) in Bolivia. These macaws were
captured within the last ten years from the wild population (pers. comm. from the keepers). Feathers (n = 36) and
blood (n = 37) samples from captive individuals in Spain were obtained from different private owners (Table 3).
All captive macaws in Malaga originated from six individuals from the pet trade 30 years ago in England (Lesley
Munns, pers. comm.), while the rest were purchased at two public zoos (Loro Parque and Palmitos Park).
Microsatellite genotyping and individual identification. Genomic DNA was extracted from blood
and feather samples. All individuals were genotyped using a microsatellite panel of 9 polymorphic loci (UnaCT21,
UnaCT32, UnaCT43, UnaCT74, AgGT17, AgGT21, AgGT90, MmGT057 and Peeμ11) specifically selected for
this study (see Supplementary Methods S1 for details; Table S2). Error rates were estimate from replicates of nine
low quality DNA samples extracted from feathers. Samples were amplified two or three times (the third amplifi-
cation was only performed when validation of allele sizes was needed) and only alleles with at least two success-
fully amplifications were included in analysis. Individuals missing four or more loci were excluded from the final
data set. Probability of identity values (PID) for each locus were estimated using the program GIMLET 1.3.3105.
To detect samples of the same individual and potential family relatives, individuals from each sampling site
were screened for close genetic relatedness (i.e. total match of all alleles or presence of full-sibs) using COLONY
Scientific Reports | (2021) 11:556 | https://doi.org/10.1038/s41598-020-79575-6 11
Vol.:(0123456789)You can also read