Key drivers of pyrogenic carbon redistribution during a simulated rainfall event
←
→
Page content transcription
If your browser does not render page correctly, please read the page content below
Biogeosciences, 18, 1105–1126, 2021
https://doi.org/10.5194/bg-18-1105-2021
© Author(s) 2021. This work is distributed under
the Creative Commons Attribution 4.0 License.

Key drivers of pyrogenic carbon redistribution during
a simulated rainfall event
Severin-Luca Bellè1 , Asmeret Asefaw Berhe2 , Frank Hagedorn3 , Cristina Santin4,5 , Marcus Schiedung1 ,
Ilja van Meerveld1 , and Samuel Abiven1,6,7
1 Department   of Geography, University of Zurich, Winterthurerstrasse 190, 8057 Zurich, Switzerland
2 School  of Natural Sciences, University of California, Merced, CA 95340, USA
3 Forest soils and Biogeochemistry, Swiss Federal Research Institute WSL, Zürcherstrasse 111,

8903 Birmensdorf, Switzerland
4 Department of Biosciences, College of Science, Swansea University, Swansea, UK
5 Research of Biodiversity (CSIC, UO, PA), University of Oviedo, Mieres, Spain
6 Laboratoire de Géologie, Département de Géosciences, CNRS – École normale supérieure, PSL University, Institut Pierre

Simon Laplace, Rue Lhomond 24, 75005 Paris, France
7 CEREEP-Ecotron Ile De France, ENS, CNRS, PSL University, Chemin de busseau 11,

77140 St-Pierre-lès-Nemours, France

Correspondence: Samuel Abiven (abiven@biotite.ens.fr)

Received: 30 September 2020 – Discussion started: 2 November 2020
Revised: 4 January 2021 – Accepted: 7 January 2021 – Published: 15 February 2021

Abstract. Pyrogenic carbon (PyC) is produced by the in-         PyC feedstock had a clear but contrasting effect on PyC re-
complete combustion of vegetation during wildfires and is       distribution: relocation in the runoff and splashed material
a major and persistent pool of the global carbon (C) cy-        was greater for wood PyC (43.4 % of total added PyC) than
cle. However, its redistribution in the landscape after fires   grass PyC (28.4 %). However, more wood PyC (11.5 %; frac-
remains largely unknown. Therefore, we conducted rainfall       tion of organic C derived from the PyC) remained where it
simulation experiments on 0.25 m2 plots with two distinct       was initially applied compared to grass PyC (7.4 %). The re-
Swiss forest soils (Cambisol (clay loam) and Luvisol (sandy     sults further suggest that the effect of PyC characteristics on
silt)). We applied PyC produced from wood (Picea abies)         its mobility can be highly variable and depend not only on
labeled under FACE conditions and C4 grass (Miscanthus          the material from which it was derived, but also on other fac-
sinensis) to the soil surface to study PyC redistribution by    tors (e.g., particle size, porosity, density). In particular, the
runoff and splash and the vertical mobility of PyC in a 10 cm   mobility of PyC was almost twice as large for fine-grained
unsaturated soil column based on the differences in δ 13 C of   PyC (< 63 µm) than for coarse PyC (63 µm–2 mm). Vertical
soils and PyC. We assessed the effect of soil texture, slope    mobility of PyC up to 10 cm depth was greater in the clay-
angle and PyC characteristics (feedstock and particle size)     rich, well-aggregated Cambisol but limited in the physically
on the mobility of PyC during 30 min of intense rainfall        instable Luvisol, likely due to quick aggregate breakdown
(102 mm h−1 ). Our results highlight that PyC is highly mo-     and surface sealing. The addition of PyC to the surface of the
bile. Surface runoff transported between 0.2 % and 36.0 % of    studied soils further induced changes in the export of native
the total added PyC. Erosion by splash further redistributed    soil organic carbon (nSOC) after the 30 min rainfall event.
10.3 % to 25.3 % of the added PyC. Soil type had a substan-     Our study shows that large quantities of PyC can be redis-
tial impact on the redistribution of PyC by both runoff and     tributed by water erosion over short timescales and that the
splash: on average, we recovered 10.5 % of the added PyC in     mobility of PyC depends to a great extent on the response
runoff and splashed material for the clay-rich Cambisol and     of soils to rainfall. Moreover, the addition and redistribution
61.3 % of the added PyC for the sandy silt Luvisol combined.

Published by Copernicus Publications on behalf of the European Geosciences Union.
1106                                                          S.-L. Bellè et al.: Key drivers of pyrogenic carbon redistribution

of PyC affects the export of nSOC and thus the C budget of           al., 2017) and 29 to 87 Tg yr−1 based on modeling of global
fire-affected soils and catchments.                                  PyC dynamics (Bird et al., 2015). The diverse methods used
                                                                     to quantify PyC contribute to the large variability in reported
                                                                     values of PyC erosion. Physical (based on size and density of
                                                                     PyC), chemical (based on the oxidation resistance of PyC),
1   Introduction                                                     thermal (based on temperature resistance of PyC), spectro-
                                                                     scopic (based on magnetic or photonic response of PyC to
Wildfires burn 345 to 464 Mha, i.e., 4 % of vegetated land           input signal) and molecular marker (based on identification
area, annually and are thus a major disturbance for terres-          of PyC specific compounds) methods cover different win-
trial ecosystems (Giglio et al., 2013; Randerson et al., 2012).      dows of the PyC continuum, and, therefore, estimates of PyC
The associated carbon (C) flux of 2.2 Pg to the atmosphere           movement in the landscape can vary substantially (Bird et al.,
affects the global C cycle and the Earth’s climate (Bowman           2015; Hammes and Abiven, 2013).
et al., 2009; van der Werf et al., 2017). It is predicted that          Erosion by water can have a profound impact on the persis-
fire frequencies will increase in many regions around the            tence and fate of SOC and PyC as it can transfer these forms
world due to climate change. This amplifies the importance           of OC from eroding landscapes to depositional sites where
of fires for key biogeochemical and climate processes and            they can be preserved for a long time (Abney et al., 2017;
its correct representation in Earth system models (Conard            Abney and Berhe, 2018). However, it can also accelerate de-
and Solomon, 2008; Lasslop et al., 2019; Westerling et al.,          composition of SOC and PyC by physical disintegration (Ab-
2006). In addition to the impact on atmospheric C emissions,         ney et al., 2019b; Pignatello et al., 2015) and biochemical
wildfires also affect the global C cycle through the impact          degradation during and after transport (Hilscher and Knicker,
on the Earth’s surface processes (Lasslop et al., 2019). The         2011; Singh et al., 2012). Although it was debated in the past
incomplete combustion of vegetation during fires produces            if erosion by water is a net C sink or source (Doetterl et al.,
a continuum of C-rich materials with polycyclic, condensed           2016), it is today considered to be a C sink. However, the
aromatic molecular structures, ranging from soot to macro-           size of the erosion-induced C sink still needs to be assessed
scopic charcoal (Bird et al., 2015; Hammes and Abiven,               (Abney and Berhe, 2018; Berhe et al., 2018).
2013). The global production of this fire-derived or pyro-              In post-fire landscapes erosion by water is very often sub-
genic C (PyC) is estimated to be 192 to 340 Tg PyC annu-             stantially enhanced (Abney and Berhe, 2018; Masiello and
ally (Jones et al., 2019; Santín et al., 2016). PyC is environ-      Berhe, 2020; Vieira et al., 2018). The removal of the pro-
mentally more resistant than its unburnt precursors and can          tective vegetation cover during wildfires increases the im-
remain in terrestrial and aquatic ecosystems for decades to          pact of raindrops on the soil surface (Certini, 2005; Johansen
millennia (Abiven and Santín, 2019; Coppola and Druffel,             et al., 2001; Pierson et al., 2013), which can cause aggre-
2016; Santín et al., 2016). It is one of the largest and oldest C    gate breakdown and surface sealing (Moody et al., 2013;
pools on Earth (Bird et al., 2015) and globally accounts for         Shakesby, 2011). The effects of fire-induced changes on the
around 15 % of organic carbon (OC) in soils (Reisser et al.,         structural and hydrological properties of soils and erosion de-
2016). However, we currently have little knowledge about the         pend on the fire regime (frequency, severity, intensity and ex-
fate of PyC in the landscape, and the dominant processes that        tent), precipitation pattern (timing, frequency, intensity, wa-
lead to its mobilization, degradation and stabilization at dif-      tershed hydrology), vegetation (fuel load, ground cover, re-
ferent landscape positions and at the interface between land         growth dynamics), topography (slope steepness, aspect, and
and ocean still need to be clarified (Abiven and Santín, 2019;       length, micro-topography) and soil properties (texture, ag-
Abney and Berhe, 2018; Masiello and Berhe, 2020).                    gregation, saturation) (Abney and Berhe, 2018; Archibald et
   Erosion by water represents a fundamental transport pro-          al., 2013; Berhe et al., 2012; Moody et al., 2013; Rumpel et
cess for soil organic carbon (SOC) and PyC in terrestrial            al., 2015; Shakesby and Doerr, 2006). Soil type determines
sloping landscapes and determines its export to aquatic sys-         the extent to which erodible materials are susceptible to de-
tems (Abney and Berhe, 2018; Berhe et al., 2018). Water              tachment and mobilization and, together with the local ge-
erosion refers here to the detachment of particles by rain-          omorphology, governs soil physical stability and therefore
drop impact, subsequent transport by water and final deposi-         erodibility (Moody et al., 2013; Vieira et al., 2015).
tion (Berhe et al., 2018; Doetterl et al., 2016). It takes place        The PyC particles produced during a fire that remain on
as splash erosion, interrill erosion, and rill–gully erosion (de     the soil surface may be more redistributed by water erosion
Nijs and Cammeraat, 2020). Erosion globally causes the re-           during the first rainfall than other soil particles (Abney et al.,
distribution of 10 to 140 Pg of soil per year (Berhe et al.,         2019a; Rumpel et al., 2006, 2009). This high mobilization
2018; Doetterl et al., 2016). Estimates of global SOC ero-           of PyC is partially caused by its physical properties, in par-
sion range between 0.3 and 5 Pg yr−1 (Berhe et al., 2007;            ticular its low density and high porosity, but also due to the
Chappell et al., 2016; Lal, 2004; Stallard, 1998). For PyC           lack of organo-mineral interactions between the PyC and soil
it has been estimated to be between 3 and 5 Tg yr−1 based            matrix that prevent either washout (surface erosion by inter-
on field investigations in Mediterranean climate (Abney et           rill or splash) or washin (to deeper soil horizons) during ini-

Biogeosciences, 18, 1105–1126, 2021                                                     https://doi.org/10.5194/bg-18-1105-2021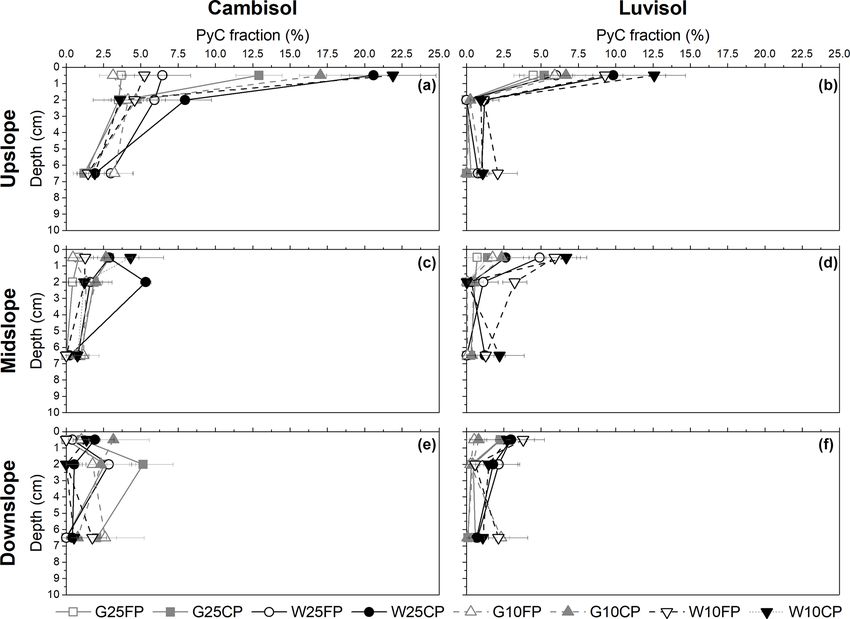
S.-L. Bellè et al.: Key drivers of pyrogenic carbon redistribution                                                               1107

tial rainfall (Brewer et al., 2014; Masiello and Berhe, 2020;       2     Material and methods
Pyle et al., 2017). Most PyC materials have a high initial hy-
drophobicity, which can promote floating and transport by           2.1    General approach
water (Abney and Berhe, 2018; Rumpel et al., 2015). The
transport of PyC also depends on the material from which it         We used rainfall simulation experiments to study PyC ero-
was derived, with grass-derived PyC being perceived to be           sion and transport on soil plots. We used two forest soils
more mobile than wood PyC (Saiz et al., 2018). Here, the            with different properties (Sect. 2.2 and Table 1) that had been
physical stability of PyC plays a role: PyC that can be frag-       unburnt for at least 20 years and added wood or grass PyC
mented more easily will produce smaller particles (Pignatello       (Sect. 2.3 and Table 2) to the surface of the uppermost third
et al., 2015; Saiz et al., 2018) that are more mobile (Masiello,    of the 0.25 m2 plot. We used a multi-factorial experimen-
2004; Saiz et al., 2018; Santín et al., 2016). This fragmenta-      tal design that included two elements of four key drivers of
tion depends on the transformation of cell structures during        PyC relocation based on literature evidence. These included
pyrolysis, and it is usually higher for grass than for wood         soil texture (clayey loam (Cambisol) vs. sandy silt (Luvisol)),
materials (Chrzazvez et al., 2014).                                 slope angle (10◦ vs. 25◦ ), PyC feedstock (wood PyC vs. grass
   The combined effects of climate, vegetation, fire, catch-        PyC) and PyC particle size (< 63 µm vs. 63 µm–2 mm). Each
ment topography and hydrology, soils, and PyC properties            of the two elements of the four drivers were combined and
will result in spatially variable post-fire redistribution of PyC   assessed in triplicates (48 plots). In addition, for soil texture
(Abney and Berhe, 2018; Berhe et al., 2018; Moody et al.,           and slope we also used four replicate control plots (16 plots)
2013). However, to which extent these drivers affect the mag-       where no PyC was added (hereafter labeled as “CT”). Dur-
nitude of post-fire PyC erosion and deposition still needs to       ing each experimental run, rainfall was applied for 30 min to
be elucidated (Abney and Berhe, 2018; Berhe et al., 2018;           one control plot and three plots where PyC was added. These
Santín et al., 2016). It is difficult to assess the redistribu-     were randomly selected (total 16 runs). The applied rainfall
tion of PyC directly after a fire because substantial redistribu-   had an intensity of 102.8 mm h−1 (51.4 ± 1.4 mm of applied
tion occurs during the first major rainfall event (Masiello and     rainfall in total). After the rainfall simulation ended, we col-
Berhe, 2020). Rainfall simulation experiments allow con-            lected the sediment that was transported by the runoff and
trollability and comparability between drivers, so that a di-       the sediment that was splashed to the sides and, also, took
verse set of drivers can be repeatedly studied from a mech-         soil cores to determine the redistribution of PyC across the
anistic point of view under the same conditions (Doetterl et        plots and the vertical transport of PyC in the soil. We used
al., 2016; Rumpel et al., 2015). Furthermore, it is crucial to      the δ 13 C signal of the added PyC materials as a direct tracer
study individual transport processes of PyC in closed systems       of PyC in this study to overcome methodological limitations
where PyC redistribution can be assessed fully with a single,       of other PyC detection methods.
direct tracer method that allows for sufficient replication un-
der the same controlled conditions.                                 2.2    Soils
   The objectives of this study were to assess the initial redis-
tribution of PyC during major rainfall events on soils through      We used the top 20 cm (without vegetation and litter) of two
splash and runoff as well as its vertical movement in the soil      Swiss forest soils that differ in soil texture, soil stability, SOC
column and how this depends on soil texture, slope angle and        content and soil hydrological properties (Table 1). The first
PyC characteristics (feedstock and particle size). Therefore,       soil is a Cambisol (IUSS Working Group WRB, 2015), col-
we conducted a simulated rainfall experiment on 0.25 m2 soil        lected from the Lägern site, next to the CarboEurope forest
plots on which wood and grass PyC with a different isotopic         flux site (CH-LAE, 47◦ 280 42.000 N, 8◦ 210 51.800 E), which is
signal (δ 13 C) than the soils was applied. We estimated PyC        a site of the Long-term Forest Ecosystem Research (LWF)
redistribution by collecting it in the runoff sediment, splashed    of the Swiss Federal Institute for Forest, Snow and Land-
sediment, floating particles and soil cores and by measuring        scape Research (WSL). The site is located at 700 m a.s.l.
the relative contribution of PyC to the δ 13 C signal of the sed-   on the Lägern mountain, which belongs to the Swiss Jura
iments, floating particles and soil cores. Specifically, we de-     and is a mixed mountain forest dominated by beech, ash,
termined (a) the effect of soil texture, slope angle and PyC        fir, lime and spruce (Ruehr et al., 2010). It has a clayey
characteristics on the transport of PyC by surface runoff (i.e.,    loam texture, high aggregate stability (mean weight diame-
overland flow); (b) the effect of soil texture, slope angle and     ter (MWD) = 1.74 ± 0.03) and SOC content of 3.6 ± 0.4 %
PyC characteristics on PyC redistribution by splash; (c) the        (Table 1). The second soil is a Haplic Luvisol that was col-
effect of soil texture, slope angle and PyC characteristics on      lected from the Möhlin site (Intercantonal Forest Observa-
the washin of PyC into the soil; and (d) the effect of the ap-      tion Program in Switzerland). The Möhlin site is located on
plication of PyC on the redistribution of native soil organic       an alluvial deposit close to the river Rhine (47◦ 350 06.000 N,
carbon (nSOC).                                                      7◦ 520 34.300 E) at an elevation of 290 m a.s.l. and is domi-
                                                                    nated by a woodruff beech forest stand (Braun et al., 2020).
                                                                    The soil has a sandy silt texture, medium aggregate stabil-

https://doi.org/10.5194/bg-18-1105-2021                                                     Biogeosciences, 18, 1105–1126, 2021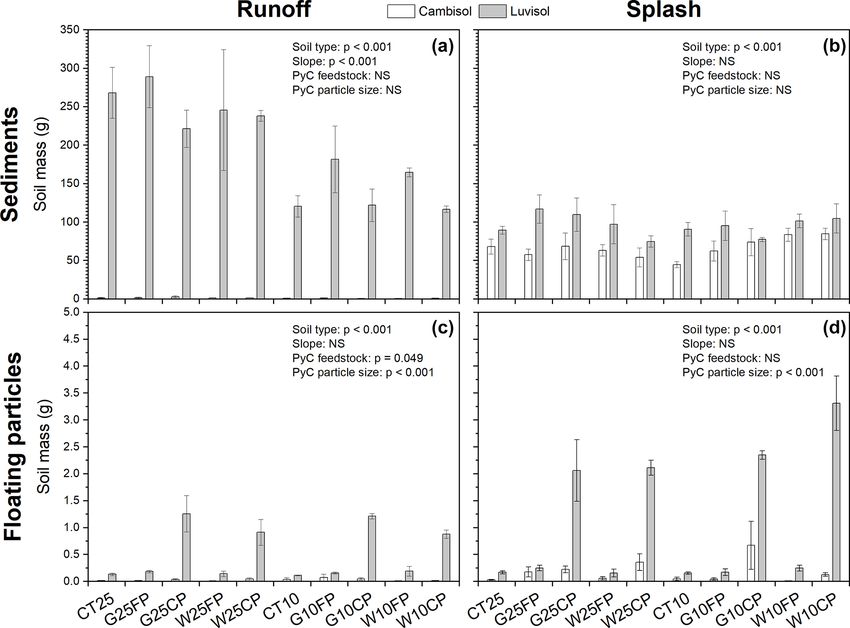
1108                                                                            S.-L. Bellè et al.: Key drivers of pyrogenic carbon redistribution

Table 1. Total organic carbon (TOC), soil organic carbon stock (SOC), δ 13 C, bulk density, soil texture, pH, aggregate stability (mean weight
diameter (MWD)), runoff ratio (runoff / rainfall), and soil water repellency of the Cambisol and Luvisol. Average values ± 1 standard error.

                                                                         Cambisol                                              Haplic Luvisol
           TOC [%]                                                 3.6 ± 0.4 (n = 72)                                       2.24 ± 0.02 (n = 72)
           SOC stock [Mg ha−1 ]1                                  36.0 ± 4.0 (n = 72)                                       23.4 ± 0.2 (n = 72)
           δ 13 C [‰]                                           −29.07 ± 0.05 (n = 72)                                   −29.87 ± 0.03 (n = 72)
           Bulk density [g cm−3 ]                   Before rainfall              After rainfall               Before rainfall              After rainfall
                                                    0.94 ± 0.03 (n = 4)          1.01 ± 0.03 (n = 4)          0.97 ± 0.01(n = 4)           1.11 ± 0.03 (n = 4)
           Texture [%]                                                 Clay loam2                                                 Sandy silt3
                                                                    Sand: 45.5 ± 3.5                                               Sand: 40
                                                                     Silt: 24.2 ± 4.4                                               Silt: 40
                                                                    Clay: 31.5 ± 2.4                                               Clay: 20
           pH [–]                                                       5.9 ± 0.52                                                    3.93
           Aggregate stability [MWD]                              1.74 ± 0.03 (n = 6)                                       0.89 ± 0.03 (n = 6)
           Runoff ratio [%]4                                      13.2 ± 0.8 (n = 32)                                       88.5 ± 2.3 (n = 32)
           [Runoff (L) /rainfall (mm)]                           (1.7 ± 0.1/51.4 ± 1.4)                                  (11.4 ± 0.3 / 51.4 ± 1.4)
           Water repellency5                         Very hydrophilic to hydrophilic (n = 5)                             Very hydrophilic (n = 5)

         1 Calculated after M4 in Poeplau et al. (2017). 2 Maestrini et al. (2014). 3 Braun et al. (2020). 4 Recorded runoff (L) was converted to runoff (m3 ). Runoff
         (m3 ) was divided by the soil plot area (0.25 m2 ) to calculate runoff depth (m). The runoff depth (mm) was then divided by the rainfall depth (mm) to
         calculate the runoff ratio (%). 5 According to the classification by Doerr (1998).

Table 2. Total C, δ 13 C and water repellency of wood PyC (derived from Picea abies) and grass PyC (derived from Miscanthus sinensis).
Average values ± 1 standard error.

                                                           Wood PyC                                    Grass PyC
                                                           (Picea abies)                               (Miscanthus sinensis)
                              Total C [%]                  64.9 ± 1.3 (n = 5)                          68.6 ± 1.8 (n = 5)
                              δ 13 C [‰]                   −38.2 ± 0.2 (n = 5)                         −13.8 ± 0.1 (n = 5)
                              Water repellency∗            Extremely hydrophobic (n = 5)               Extremely hydrophobic (n = 5)
                            ∗ According to classification by Doerr (1998).

ity (MWD = 0.89 ± 0.03) and SOC content of 2.24 ± 0.02 %                                      labeled with “W”) grown under FACE conditions (Free Air
(Table 1). In the following, the soils are named “Cambisol”                                   Carbon Dioxide Enrichment; Hagedorn et al., 2003) and PyC
and “Luvisol”, respectively. The collected soils were kept                                    from Miscanthus grass (Miscanthus sinensis), a C4 plant
indoor under a protective foil and regularly rewetted with                                    (Hilber et al., 2012) (hereafter called grass PyC and labeled
deionized water prior to the experiments. The soils were not                                  with “G”). The PyC was produced in several batches through
sieved to < 2 mm due to the considerable amount of soil ma-                                   pyrolysis, following the established method described in
terial (approximately 1 metric ton of each soil). Even though                                 Hammes et al. (2006). Briefly, the biomass was loaded in
a soil that had been burned on the surface would have been                                    a quartz tube (small chips of wood and grass of several
more realistic, we used unburnt soils for practical reasons                                   centimeters in size), heated to 450 ◦ C in a pyrolysis oven
(large volume of soils, homogeneity of the surface, repro-                                    and charred for 4 h under a continuous N2 stream, and col-
ducibility of fire conditions, control of initial PyC amount).                                lected after cooling. Pyrolysis has little effect on the δ 13 C
                                                                                              of PyC (−38.0 ± 0.2 ‰ for spruce wood vs. −38.2 ± 0.2 ‰
2.3    Pyrogenic carbon (PyC) material: production and                                        for wood PyC, and −12.7 ± 0.1 ‰ for Miscanthus grass
       characterization                                                                       vs. −13.8 ± 0.1 ‰ for grass PyC). Mean mass recovery
                                                                                              was 31.0 ± 0.5 %, which is in line with yields reported by
We used two types of PyC material (Table 2): PyC from                                         Keiluweit et al. (2010) for both grass and wood PyC at com-
spruce wood (Picea abies, hereafter called wood PyC and

Biogeosciences, 18, 1105–1126, 2021                                                                                  https://doi.org/10.5194/bg-18-1105-2021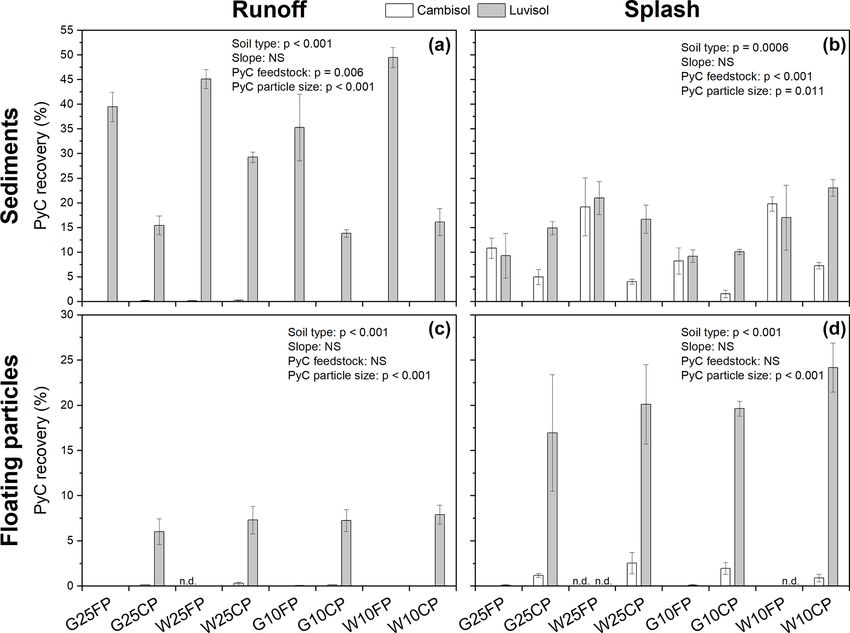
S.-L. Bellè et al.: Key drivers of pyrogenic carbon redistribution                                                           1109

parable charring temperatures (400 to 500 ◦ C). Afterwards,        moisture in each plot with a Decagon Em50 (inserted at 5 cm
we homogenized the PyC of all batches by carefully mixing          depth). Finally, we installed the splash shelter (corrugated
them in a bowl. To produce two sizes of PyC particles, we          panel) around each plot to ensure a closed system (Fig. 1a).
first passed the PyC through a 2 mm sieve and retained it on       We are aware that the setup used in our study will under-
a 63 µm sieve to obtain the coarse particles (63 µm–2 mm,          estimate the splash erosion component. Splash erosion will
hereafter labeled with “CP”). Afterwards, a subsample was          not only occur to the sides of the soil plots (captured with
milled and passed through the 63 µm sieve (hereafter labeled       the shelter around it), but also on the plots themselves. This
with “FP”). Each of the two PyC particle size fractions was        latter component of splash erosion will be counted as either
homogenized by mixing, and aliquots were sampled for char-         runoff erosion if the material leaves the plot in the direction
acterization.                                                      of slope or distribution of soil, SOC and PyC within the soil
   We determined PyC water repellency using the ethanol            surface and plot mid- and downslope. Since the processes of
droplet test, as described in Doerr (1998). The wood and           splash and runoff erosion are linked, we need to bear in mind
grass PyC were both extremely hydrophobic, with no de-             that part of the eroded material by runoff may be attributable
tectable differences between them (Table 2). We character-         to splash erosion. Still, our results are the best estimation we
ized the PyC material by diffuse reflectance infrared Fourier-     could get for the two processes.
transformed spectroscopy (DRIFT) analysis (TENSOR 27
spectrophotometer, Bruker Fällanden, Switzerland). DRIFT           2.5   Rainfall simulation
spectra highlighted a higher aromaticity and condensation
for the wood PyC, as indicated through higher absorption at        We used the indoor, gravity-type rainfall simulator at the
1730–1680 cm−1 assigned to carbonyl / carboxyl C=O and             Swiss Federal Institute for Forest, Snow and Landscape Re-
at 1610–1570 cm−1 assigned to aromatic C=C (Fig. S1). Cell         search (WSL) for the rainfall simulation experiments. The
structures were also better preserved for the wood PyC than        simulator includes drop-producing needles with an inner di-
the grass PyC, as indicated by a higher absorption for cel-        ameter of 0.05 mm and a drop fall height of 7 to 8.5 m. The
lulose (C-O) at 1260–1210 cm−1 (Chatterjee et al., 2012;           setup and general principles of the simulator have been de-
Keiluweit et al., 2010).                                           scribed in detail in Berger et al. (2010), and basic data (i.e.,
                                                                   water pressure, flow, temperature, rainfall characteristics)
2.4   Plot preparation                                             can be found in the Supplement (Table S1 and Fig. S2). The
                                                                   simulator setup produced raindrops that reached terminal ve-
For the experiments, we used a soil plot (0.5 × 0.5 × 0.2 m;       locities and drop size distribution (determined using the oil
0.25 m2 flume) and added clean Styrofoam (so that water            method; Kathiravelu et al., 2016; data not shown) close to
can still drain) to the bottom 10 cm. We added the soil on         natural rainfalls (Abd Elbasit et al., 2010; Abudi et al., 2012;
top of the Styrofoam to reach a soil thickness of 10–12 cm         Aksoy et al., 2012). We used only one simulator element
and slightly compressed it to avoid any bagging of soil dur-       (1.05×3.25 m) and a designated area of 0.8×2.8 m under the
ing experiments (bulk density between 0.9 (Cambisol) and           simulator for the experiments. This allowed us to place four
1.0 g cm−3 (Luvisol)). We took particular care to also fill the    of the 0.25 m2 plots side by side below the simulator and ap-
edges of the plots and leveled the surface with a metal bar. We    ply rainfall to them simultaneously. The rainfall intensity in
then applied the PyC material evenly on the surface of the up-     the simulation area was measured three times using 56 small
permost third of the plot (upslope). The application rate was      (8.5 cm diameter) funnel gauges (Fig. S2). The simulator
118.7 g PyC m−2 (equal of 77.0 ± 1.5 g C for wood PyC (to-         produced constant rainfall of 102.8 mm h−1 (51.4 ± 1.4 mm
tal C = 64.9 ± 1.3 %) and 81.4 ± 2.1 g C for grass PyC (to-        in 30 min). The Christiansen uniformity coefficient of 84 %
tal C = 68.6 ± 1.8 %)) and we let it settle for at least 1 h to    indicates a uniform distribution of the rainfall over the sim-
simulate surface deposition (Fig. 1). We choose this appli-        ulation area (Aksoy et al., 2012; Christiansen, 1942; Lassu
cation rate based on literature estimates of standing biomass      and Seeger, 2015).
per square meter and PyC production and post-fire deposi-             Because we applied rainfall to four plots at a time, we pri-
tion (Proulx et al., 2015; Santín et al., 2015) and application    oritized homogeneous distribution of rainfall over the simu-
rates (106 g m−2 ) used in field plot studies on PyC erosion       lated area to ensure controlled and comparable conditions be-
(Rumpel et al., 2009).                                             tween the plots. The uniformity of the rainfall over the sim-
   The surface of the prepared plots were photographed with        ulation area decreased rapidly with intensities smaller than
a high-end Sony Alpha 7R III & Zeiss Batis 18 mm fixed             100 mm h−1 , and therefore this intensity was chosen. The
wide-angle lens (4K resolution with pixel-shift technology)        simulated rainfall depth of 51.4 mm for 30 min represents
attached to a tripod (fixed distance and angle to the floor)       a rainfall event with a return interval of 51–206 years for
(Fig. 1b). Prior to rainfall simulation, the plots were adjusted   three long-term meteorological stations near the Lägern site
to the respective slope angle (10◦ or 25◦ ) and an overflow        (Zurich Kloten: 206 (95 % confidence interval: 51 to > 300),
(metal plate) was added to the lowest sidewall and connected       Zurich Affoltern: 69 (21 to > 300) and Zurich Fluntern: 93
to a runoff channel and bucket (Fig. 1a). We monitored soil        (25.5 to > 300)). For the stations in close proximity to the

https://doi.org/10.5194/bg-18-1105-2021                                                   Biogeosciences, 18, 1105–1126, 2021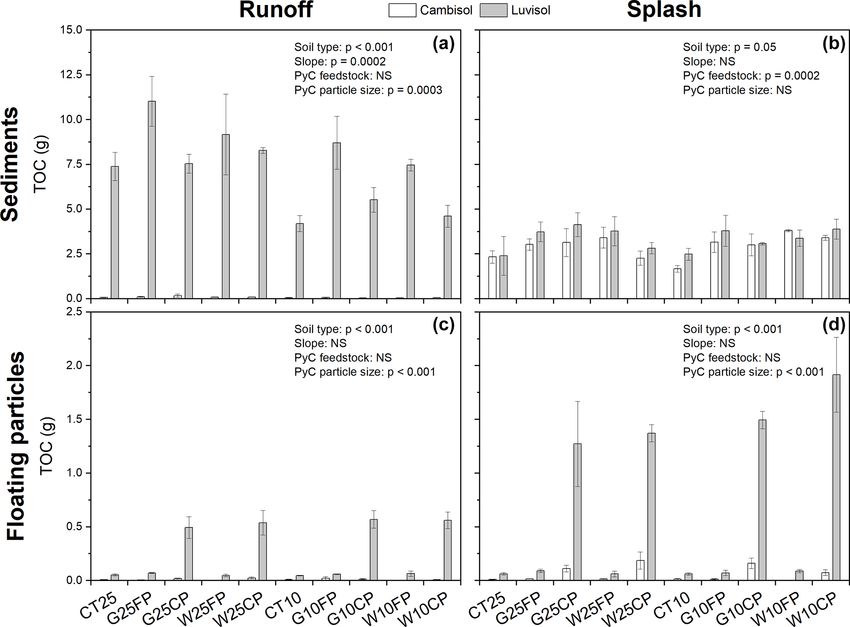
1110 S.-L. Bellè et al.: Key drivers of pyrogenic carbon redistribution
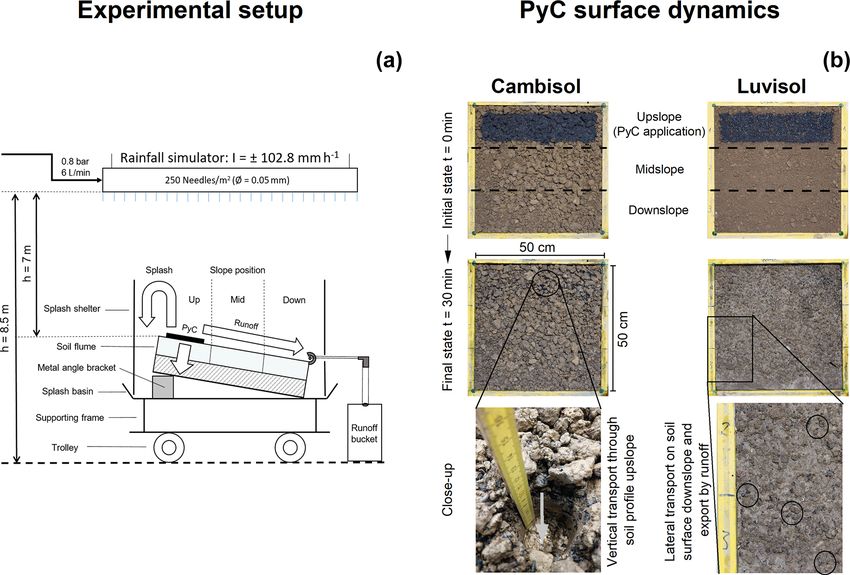
Figure 1. Experimental setup, including the rainfall simulator and an example of a 0.25 m2 soil plot (a) and visual assessment of the surface
of the Cambisol and Luvisol (25◦ slope and with coarse wood PyC) (b). Each 0.25 m2 soil plot was photographed before and after the
30 min rainfall simulation experiment. Visual assessment showed vertical movement of PyC in the Cambisol (white arrow in b) and surface
redistribution of PyC on the Luvisol (black circles in b).
Möhlin site, it represents an event with a return interval of and the splashed material were separately dried at 40 ◦ C and
99–117 years (Rünenberg: 98.5 (25 to > 300) and Basel: weighed. Finally, sediment samples of both the runoff and
116.5 (28 to > 300); 1982–2018 data, Federal Office of Me- splash were milled. The floating particles of both the runoff
teorology and Climatology MeteoSwiss, 2019). and splash were milled in a mortar by hand because of the
small amount of material. The collected sediment and float-
2.6 Sampling, sample preparation and analysis ing particles were analyzed for total organic carbon (TOC;
representing nSOC for control plots and nSOC + PyC for
After the rainfall simulation experiment, we flushed the plots where PyC was applied) and δ 13 C, relative to the inter-
runoff channel with a known volume of deionized water and national Vienna Pee Dee Belemnite (VPDB) standard, using
recorded the total weight of the bucket that already contained cavity ring-down spectroscopy with a dry combustion system
the surface runoff and the eroded material. To collect splash (CRDS Picarro, Inc. 2020).
sediment, we washed the splash panel with a known volume Prior to sampling the soil after the experiment, each plot
of deionized water and collected it in the splash basin that was photographed as described previously (i.e., similar to be-
already contained the eroded splash material. We transferred fore the rainfall simulation). We sampled the soil with a soil
all the collected splash material to a bucket and weighed it. corer (steel cylinder with 5 cm diameter and 10 cm length).
The buckets with the runoff and splashed material were set We took cores at three random locations in the three slope
aside for sedimentation for > 24 h before carefully collecting positions (upslope, midslope, downslope), cut the cores into
the particles floating on the water surface, pumping out the three depth increments (0–1, 1–3 and 3–10 cm) and homog-
water with a bell jar attached to a peristaltic pump and finally enized the material from the three cores per depth to obtain
collecting the sediment that settled at the bottom of the buck- one composite sample per slope position, depth and plot. Soil
ets. The sediment and floating particles of both the runoff samples were air-dried, sieved to < 2 mm and milled. The
Biogeosciences, 18, 1105–1126, 2021 https://doi.org/10.5194/bg-18-1105-2021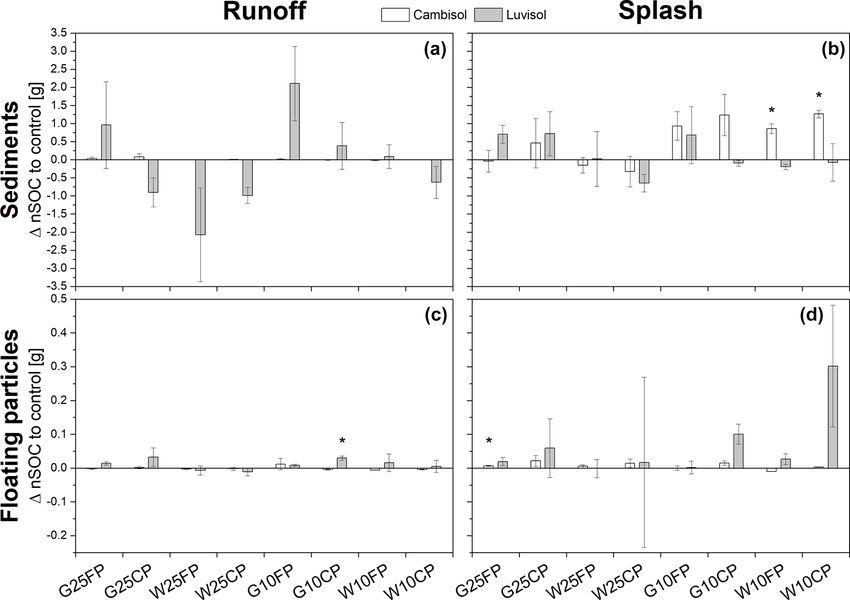
S.-L. Bellè et al.: Key drivers of pyrogenic carbon redistribution                                                              1111

soil samples were analyzed similarly as the collected sedi-           midslope and downslope) and depth increment (0–1, 1–3,
ment and floating particles for TOC and δ 13 C. Additionally,         3–10 cm) for the full dataset and subsequently for the in-
we took cores from control plots for each soil before and af-         dividual soil types. We used the Shapiro–Wilk tests on the
ter rainfall simulation and analyzed them for the bulk density.       ANOVA residuals to check the normality assumption and
We also tested the aggregate stability (mean weight diameter          Fisher’s least significant difference (LSD) post-hoc tests (al-
(MWD) calculation) of the soils with the fast wetting method          pha = 0.05, p.adj = Bonferroni) on the two elements of the
described in Le Bissonnais (2016). Using the same method as           four drivers. For changes in nSOC export after application of
for PyC materials, we tested soil water repellence according          PyC compared to corresponding controls, we used a Welch
to the ethanol droplet test of Doerr (1998).                          two-sample t-test (95 % confidence interval). All statistical
                                                                      analyses were completed using the R packages “agricolae”
2.7   Quantification of the PyC contribution to TOC                   and “car” in RStudio Version 3.5.2 (R Core Team, 2018).
      using δ 13 C and C recovery

To determine PyC redistribution during a rainfall event,
                                                                      3     Results
we used the differences in δ 13 C of the forest soils
(−29.1 ± 0.1 ‰ for the Cambisol and −29.9 ± 0.1 ‰ for the
                                                                      3.1     Redistribution of soil and total organic carbon
Luvisol) and the PyC materials (−38.2 ± 0.2 ‰ for the wood
                                                                              (TOC)
PyC and −13.8 ± 0.1 ‰ for the grass PyC). The δ 13 C dif-
ference of 8.3 ‰–16.1 ‰ between the soils and PyC mate-
                                                                      3.1.1    Amount of runoff and relocated quantities of soil
rials was much larger than the maximal drift of the CRDS
                                                                               and floating particles
analyzer (< 0.5 ‰) and allowed us to differentiate between
nSOC and PyC in the TOC. We used a two-pool isotope-                  The amount of surface runoff generated was much less for the
mixing model to calculate the contribution of the added PyC           Cambisol than the Luvisol plots, with average runoff ratios
to the δ 13 C signal of a sample (sediment, floating particles or     for all plots of 13.2 ± 0.8 % and 88.5 ± 2.3 %, respectively
soil cores) using Eq. (1):                                            (Table 1). Soil moisture was higher in the Cambisol and for
              δ 13 Csample − δ 13 CPyC_app
                                            !                        both soils for the 10◦ plots than the 25◦ plots (Fig. S3). For
f = 1−                                       × 100,          (1)     the Cambisol, initial soil moisture increased rapidly over the
              δ 13 Ccontrol − δ 13 CPyC_app                           first 5 min and then steadily increased until the end of the
where f is the fraction of OC derived from the PyC (or                rainfall simulation for both slope angles. For the Luvisol,
PyC fraction, %), δ 13 Csample is the δ 13 C value of the sample,     soil moisture increased rapidly but less pronouncedly during
δ 13 CPyC_app is the average δ 13 C value of the added PyC (Ta-       the first 10 min and remained stable after 15 min for the 10◦
ble 2) and δ 13 Ccontrol is the average δ 13 C value of the control   slope plots and after around 20 min for the 25◦ plots. The
plots for the runoff, splashed sediments, runoff and splash           relatively low moisture contents of both soils at the end of
floating particles (representing the nSOC of the TOC). The            the experiment and the flattening of the moisture curves to-
PyC fraction (%) was subsequently multiplied with the TOC             wards the end of the simulation indicate that the soils were
(nSOC + PyC, g), and finally the quantity of PyC (g C) was            not fully saturated, and infiltration rates dropped due to sur-
divided by the amount of added PyC (g C) to calculate PyC             face sealing, especially for the Luvisol (Fig. S3). This was
recovery (% of total added PyC). For the soil core calcula-           also visually observed during experiments.
tions (Fig. 6 and Table S2), we used the average δ 13 C value            The amount of soil that was transported by the runoff (i.e.,
of all control samples (Table 1) to ensure a stable background        the soil mass for control plots and soil + PyC mass for plots
signal to calculate the PyC fraction. For the soil core sam-          where PyC was applied) was significantly different for the
ples, we could not convert the PyC fraction to a reliable PyC         two soil types: on average 1.3 ± 0.2 g (= 5.2 ± 0.8 g m2 ) for
recovery value because both the soil mass and the TOC con-            the Cambisol and 196.7 ± 14.3 g (= 786.8 ± 57.2 g m2 ) for
tents of the soil core samples were too variable.                     the Luvisol (p < 0.001; Fig. 2a). Note that because PyC rep-
                                                                      resented < 2 % of total mass, its influence on the total mass of
2.8   Statistical analyses                                            transported soil could be neglected for this calculation. The
                                                                      runoff-driven erosion rates varied between 2.8 ± 0.3 g m−2
We ran Levene’s test to check the homogeneity of vari-                (Cambisol under 10◦ slope) and 1156.8 ± 160.8 g m−2 (Lu-
ance assumption (center is equal to the mean). We ran a               visol under 25◦ slope) for the 30 min rainfall simulation. The
two-way ANOVA model for the full dataset on eroded soil               sediment transport was about 2 times higher for plots under
mass, eroded TOC, PyC recovery (runoff and splash sedi-               steeper slopes (average for all 10◦ plots: 70.4 ± 13.6 g and all
ment, runoff and splash floating particles) and subsequently          25◦ plots: 127.6 ± 24.2 g). The effect of slope was significant
a two-way ANOVA model per soil type (Cambisol and Lu-                 for the Cambisol (p = 0.03) and Luvisol (p < 0.001).
visol) for the same datasets. For the soil core data, we used a          Soil type was also the main explanatory variable for
two-way ANOVA model for each slope position (upslope,                 the average amount of soil eroded by splash (Fig. 2b). It

https://doi.org/10.5194/bg-18-1105-2021                                                      Biogeosciences, 18, 1105–1126, 2021
1112 S.-L. Bellè et al.: Key drivers of pyrogenic carbon redistribution
Figure 2. Amount of sediment (g) transported by the runoff (a) and splash (b) as well as floating particles transported by runoff (c) and
splash (d) for each treatment after 30 min of rainfall (total: 51.4 ± 1.4 mm) (CT: control plots; G: grass PyC; W: wood PyC; 25: 25◦ slope;
10: 10◦ slope; FP: fine PyC (< 63 µm); CP: coarse PyC (63 µm to 2 mm)). Values are given as means (±1 standard error) and correspond to
the mass of soil for control plots (CT: n = 4) and mass of soil + PyC for plots where PyC was applied (n = 3; PyC only represented < 2 % of
total mass).
was 31 % less (p < 0.001) for the Cambisol (65.5 ± 3.6 g of the drivers “soil type × PyC particle size” in the ANOVA
(= 262.0 ± 14.4 g m−2 )) than the Luvisol (95.5 ± 4.5 g model: p < 0.001).
(= 382.0 ± 18.0 g m−2 )). Transport rates by splash ranged
between 178.8 ± 16.0 g m−2 (Cambisol under 10◦ slope) and 3.1.2 Transported TOC
468.4 ± 73.6 g m−2 (Luvisol under 25◦ slope) for the 30 min
rainfall simulation. Similar to the mass of soil that was transported, the amount
The total transport of floating particles (i.e., native SOC of TOC transported by runoff (i.e., native SOC (nSOC) for
(nSOC) for control plots and nSOC + PyC for plots where control plots and nSOC + PyC for plots where PyC was
PyC was applied) by runoff was different between soil types. added) was almost negligible for the Cambisol but notable
It was 0.03 ± 0.01 g for the Cambisol and 0.49 ± 0.09 g for the Luvisol (0.08 ± 0.01 g C and 7.3 ± 0.5 g C, respec-
for the Luvisol (p < 0.001). For PyC particle sizes, it was tively, p < 0.001, Fig. 3a). Steeper slope angles (25◦ ) re-
0.6 ± 0.1 g when PyC was applied as coarse particles (CP), sulted in 144 % more TOC transport by the runoff but did
0.09 ± 0.02 g for fine particles (FP) and 0.08 ± 0.02 g for not change the proportions of eroded TOC / soil. This ef-
controls (CT, no PyC applied) (p < 0.001; Fig. 2c). The fect holds true for both soil types (Cambisol (p = 0.03) and
mass of floating particles eroded by splash was larger than Luvisol (p = 0.0005)). The strong interaction of soil type
for the runoff and also dependent on soil type (Cambisol: and slope in our model suggests that more TOC was trans-
0.17 ± 0.05 g and Luvisol: 1.0 ± 0.2 g, p < 0.001). It was fur- ported by runoff on steeper slopes on the Luvisol in abso-
ther also dependent on PyC particle size (CP: 1.4 ± 0.3 g, lute terms (p = 0.0003; Fig. 3a). Transport rates of TOC by
FP: 0.14 ± 0.02 g and CT: 0.10 ± 0.02 g, p < 0.001; Fig. 2d). runoff ranged between 0.08 ± 0.04 g C m−2 (Cambisol un-
However, the total mass of floating particles transported by der 10◦ slope) and 44.0 ± 5.6 g C m−2 (Luvisol under 25◦
runoff or splash was only significantly higher with the appli- slope) for the 30 min rainfall simulation. We found higher
cation of coarse PyC to the Luvisol (significant interaction export of TOC (nSOC + PyC) by runoff when fine PyC par-
ticles (FP) were applied but not when coarse PyC particles
Biogeosciences, 18, 1105–1126, 2021 https://doi.org/10.5194/bg-18-1105-2021S.-L. Bellè et al.: Key drivers of pyrogenic carbon redistribution 1113
Figure 3. Amount of TOC (g) transported by runoff (a) and splash sediment (b) as well as the floating particles in runoff (c) and splash
(d) for each treatment after 30 min of rainfall (total: 51.4 ± 1.4 mm) (CT: control plots; G: grass PyC; W: wood PyC; 25: 25◦ slope; 10:
10◦ slope; FP: fine PyC (< 63 µm); CP: coarse PyC (63 µm to 2 mm)). Values are given as means (±1 standard error), and the TOC values
represent native SOC (nSOC) for control plots (CT: n = 4) and nSOC + PyC for plots where PyC was applied (n = 3).
(CP) were applied, compared to control plots (CT). However, wood and grass PyC as coarse particles resulted in more
we identified this only for the Luvisol (FP: 9.1 ± 0.8 g C, transport of TOC in floating particles by runoff compared
CP: 6.5 ± 0.5 g C and CT (no PyC applied): 5.8 ± 0.7 g C; to the control plots, but this was not the case for the fine
p = 0.0009), indicating that fine PyC particles preferentially PyC particles. The particle size was significant for the Lu-
contributed to the transported TOC by runoff on the Luvisol visol, but not the Cambisol, which suggests that the coarse
(soil type × PyC particle size: p = 0.003; Fig. 3a). PyC contributed to the transported TOC of floating particles
Splash erosion of TOC was slightly higher for the Luvisol in the runoff for the Luvisol (soil type × PyC particle size:
(Cambisol: 2.9 ± 0.2 g C and Luvisol 3.3 ± 0.2 g C, p = 0.05; p < 0.001; Fig. 3c). The mass of TOC in floating particles
Fig. 3b). All plots of both soils receiving PyC showed higher relocated by splash erosion was 0.06 ± 0.01 g C for the Cam-
splash erosion of TOC irrespective of PyC feedstock or par- bisol and 0.6 ± 0.1 g C for the Luvisol (p < 0.001; Fig. 3d).
ticle size compared to control plots, but we found no differ- For both soils, application of wood and grass PyC as coarse
ence between either wood and grass PyC or fine and coarse particles resulted in more relocation of TOC in floating par-
PyC for any of the soils (Fig. 3b). Transport rates of TOC ticles by splash compared to the controls, and again this was
through splash ranged between 6.8 ± 0.8 g C m−2 (Cambisol not the case for the fine PyC particles (p < 0.001; Fig. 3d).
under 10◦ slope) and 16.4 ± 2.8 g C m−2 (Luvisol under 25◦
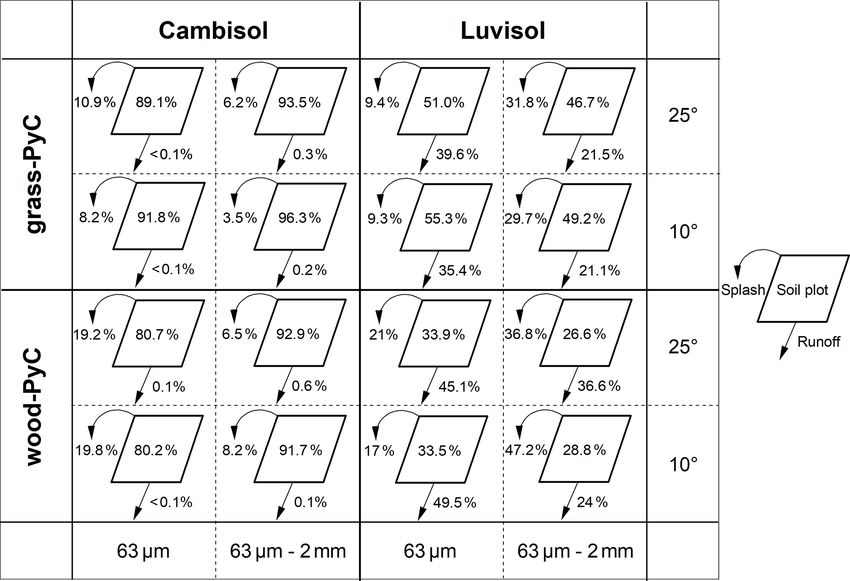
slope) for the 30 min rainfall simulation. 3.2 Redistribution of PyC by runoff and splash:
The transported quantities of TOC (i.e., nSOC for control recovery of added PyC
plots and nSOC + PyC for plots where PyC was applied) in
the floating particles for both the runoff and splash differed We observed similar trends for the redistribution of the added
between the soil types and PyC particle sizes (Fig. 3c–d). PyC as for the transported soil and TOC (Figs. 2–3), in-
The mass of relocated TOC by runoff of floating particles cluding clear differences between the two soil types (Fig. 7).
was 0.011 ± 0.002 g C for the Cambisol and 0.24 ± 0.04 g C PyC relocation (as a percentage of total added PyC) through
for the Luvisol (p < 0.001; Fig. 3c). Application of both runoff and splash erosion combined, for both sediment and
floating particles, varied between 10.5 ± 1.4 % for the Cam-
https://doi.org/10.5194/bg-18-1105-2021 Biogeosciences, 18, 1105–1126, 20211114 S.-L. Bellè et al.: Key drivers of pyrogenic carbon redistribution Figure 4. PyC recovery (% of total added PyC) in sediment transported by runoff (a) or splash (b), and floating particles transported by runoff (c) and splash (d) for each treatment after 30 min of rainfall (total: 51.4 ± 1.4 mm) (G: grass PyC; W: wood PyC; 25: 25◦ slope; 10: 10◦ slope; FP: fine PyC (< 63 µm); CP: coarse PyC (63 µm to 2 mm)). Average values ± 1 standard error (n = 3). bisol and 61.3 ± 3.4 % for the Luvisol (p < 0.001; Figs. 4 In accordance with the larger mass of splashed soil and 7). Moreover, we recovered much more of the added (Fig. 2b), we found greater PyC relocation (% of total PyC in the sediments and floating particles transported by added PyC) by splash for the Luvisol (15.2 ± 1.4 %) than runoff and splash combined after application of wood than the Cambisol (9.5 ± 1.5 %, p = 0.0006; Fig. 4b). When av- grass PyC (W: 43.4 ± 6.6 % and G: 28.4 ± 4.6 %, p < 0.001; eraged for the two soils, redistribution of PyC by splash was Fig. 4). twice as much when wood PyC (16.0 ± 1.7 %) was applied PyC in the runoff sediment (% of total added PyC) was compared to grass PyC (8.6 ± 1.0 %, p < 0.001). Reloca- approximately 300 times more for the Luvisol (32.4 ± 3.8 %) tion of PyC by splash was greater when fine PyC particles than the Cambisol (0.09 ± 0.02 %, p < 0.001; Fig. 4a). Ap- were applied compared to coarser ones (FP: 14.3 ± 1.6 % plication of wood PyC resulted in more PyC relocation in and CP: 10.3 ± 1.5 %), but this effect was only significant sediment by runoff (19.4 ± 5.0 %) compared to grass PyC for the Cambisol (soil type × PyC particle size: p < 0.0003; (13.1 ± 3.3 %), and this effect was significant for both soils Fig. 4b). (Cambisol: p = 0.04 and Luvisol: p = 0.009). Application of Redistributed quantities of PyC as floating particles were fine PyC (23.1 ± 5.3 %) resulted in more PyC redistribution significantly different for the two soil types and PyC particle of the sediment by runoff compared to coarse PyC particles sizes (Fig. 4c–d). Relocated PyC in floating particles in the (9.4 ± 2.2 %) in the full ANOVA model, but the effect dif- runoff was 0.07 ± 0.03 % of initially added PyC for the Cam- fered for the two soils (Fig. 4a). There was more PyC relo- bisol and 3.6 ± 0.8 % for the Luvisol (p < 0.001; Fig. 4c). cation for coarse particles for the Cambisol (p = 0.01; less Application of coarse PyC particles resulted in significantly than < 0.13 ± 0.03 % for both particle sizes), but, for the Lu- higher relocation of PyC in floating particles in runoff com- visol, there was more PyC relocation for the fine particles pared to finer PyC (CP: 3.6 ± 0.8 % and FP: 0.02 ± 0.01 %; (FP: 46.1 ± 4.6 % and CP: 18.7 ± 2.0 %, p < 0.001). In con- Cambisol (p = 0.001) and Luvisol (p < 0.001); Fig. 4c). Re- trast to the amount of transported soil and TOC by the runoff located PyC in floating particles of splash accounted for (Figs. 2a and 3a), slope angle did not affect PyC redistribu- 0.8 ± 0.2 % (Cambisol) and 10.1 ± 2.3 % (Luvisol) of the tion (p = 0.09; Fig. 4a). recovered PyC (p < 0.001; Fig. 4d). The amount of relo- Biogeosciences, 18, 1105–1126, 2021 https://doi.org/10.5194/bg-18-1105-2021
S.-L. Bellè et al.: Key drivers of pyrogenic carbon redistribution                                                                       1115

Figure 5. Differences in native SOC export (1 nSOC to control in grams) between the PyC treatments (nSOC = TOC − PyC) and the
corresponding controls (nSOC = TOC) in sediment transported by runoff (a), splash (b) and floating particles in runoff (c) and splash (d) after
30 min of rainfall (total 51.4 ± 1.4 mm) (G: grass PyC; W: wood PyC; 25: 25◦ slope; 10: 10◦ slope; FP: fine PyC (< 63 µm); CP: coarse PyC
(63 µm to 2 mm)). Average values ± 1 standard error (n = 3). Significant changes at p < 0.05 are marked with an asterisk (∗ ).

cated PyC in floating particles by splash was higher for                  for the control plots in the range of 3.6 ± 1.6 g C m−2 (fine-
coarser particles than finer ones (CP: 10.9 ± 2.2 % and FP:               grained grass PyC; p = 0.13) to 5.2 ± 0.4 g C m−2 (fine-
0.03 ± 0.01 %), and this effect was significant for the Cam-              grained wood PyC). For the wood PyC application, higher
bisol (p = 0.0003) and Luvisol (p < 0.001; Fig. 4d).                      exports were significant for fine (p = 0.01) and coarse PyC
                                                                          particles (p = 0.002). Changes in nSOC export as floating
3.3   Changes of nSOC dynamics after application of                       particles through runoff and splash after PyC application
      PyC                                                                 were small and highly variable (Fig. 5c–d).

Our δ 13 C approach (using 13 C-labeled PyC material) and                 3.4     Distribution of PyC on the soil surface and in the
the mass balance of TOC and PyC allowed us to estimate                            soil
the effect of PyC application on the transport of native
SOC (nSOC). We compared the transport of nSOC for con-                    3.4.1    Upslope position
trol plots (nSOC = TOC) with plots where we added PyC
(nSOC = TOC − PyC). Changes in nSOC export through                        For the upslope position (i.e., uppermost third where PyC
runoff after application of PyC were negligible for the Cam-              was initially added), the distribution of PyC on the soil sur-
bisol (< 0.5 ± 0.1 g C m−2 ) but important for the Luvisol                face and in the soil after the rainfall simulation differed
(Fig. 5a). For the Luvisol, the changes varied from reduced               strongly for the two soil types (here reported as the frac-
export of the order of 8.4 ± 5.2 g C m−2 (fine-grained wood               tion of OC derived from the PyC in percent (or PyC frac-
PyC on 25◦ slope; p = 0.25) to higher export of the order                 tion)). We found more PyC at all three depths (0–1, 1–3 and
of 8.4 ± 4.0 g C m−2 (fine-grained grass PyC on 10◦ slope;                3–10 cm) in the Cambisol than the Luvisol (Fig. 6a–b and Ta-
p = 0.16) compared to controls (Fig. 5a). Changes of nSOC                 ble S2). For the surface layer (0–1 cm), the PyC fraction was
export through splash after application of PyC were im-                   11.4 ± 1.6 % for the Cambisol and 7.5 ± 0.9 % for the Lu-
portant for the Cambisol at the 10◦ slope but small for                   visol (p = 0.0009). At 1–3 cm depth, it was 4.8 ± 0.5 % for
the Luvisol (Fig. 5b). For the 10◦ Cambisol plots, we ob-                 the Cambisol and 0.5 ± 0.2 % for the Luvisol (p < 0.001). At
served a higher export of nSOC after PyC application than                 3–10 cm depth, the difference was 2.0 ± 0.3 % for the Cam-

https://doi.org/10.5194/bg-18-1105-2021                                                            Biogeosciences, 18, 1105–1126, 2021
1116 S.-L. Bellè et al.: Key drivers of pyrogenic carbon redistribution
Figure 6. Distribution of PyC (PyC fraction is the fraction of OC derived from the PyC in percent) in soil cores for the Cambisol (a, c, e)
and Luvisol (b, d, f) along the 0.25 m2 plot (upslope: a–b; midslope; c–d and downslope: e–f) and with depth (0–1, 1–3, 3–10 cm) for each
treatment after 30 min rainfall (total: 51.4 ± 1.4 mm) (G: grass PyC; W: wood PyC; 25: 25◦ slope; 10: 10◦ slope; FP: fine PyC (< 63 µm);
CP: coarse PyC (63 µm to 2 mm)). Average values ± 1 standard error (n = 3).
bisol and 0.8 ± 0.2 % for the Luvisol (p = 0.007). The visual wood PyC (5.0 ± 0.9 %) was applied than for grass PyC
assessment of the soil surface and vertical profile confirmed (1.6 ± 0.3 %; p = 0.002). This was also the case at 1–3 cm
that more PyC remained on the surface or was washed in for depth (1.2 ± 0.5 % for wood PyC compared to 0.3 ± 0.2 %
the Cambisol than the Luvisol (Fig. 1b). for grass PyC; p = 0.02). In addition, there was significantly
In addition to soil type, the distribution of PyC on the more PyC at 1–3 cm depth in the midslope position for the
soil surface (0–1 cm) of the upper slope depended on PyC Cambisol than the Luvisol (PyC fraction: 1.9 ± 0.4 % for the
feedstock (Fig. 6a–b and Table S2). A larger PyC fraction Cambisol and 0.7 ± 0.3 % for the Luvisol; p = 0.002). This
remained on the surface when wood PyC (11.5 ± 1.5 %) difference was also seen for the downslope cores (Cambisol:
was applied than when grass PyC (7.4 ± 1.0 %) was applied, 1.9 ± 0.5 % and Luvisol: 0.9 ± 0.3 %) but was not significant
and this effect was significant for the Cambisol (p = 0.005) (p = 0.11). The PyC fraction on the soil surface (0–1 cm) at
and Luvisol (p = 0.03). Furthermore, significantly more PyC the mid- and downslope positions was higher for the Luvi-
remained on the surface of the Cambisol when coarser sol than the Cambisol (Figs. 6c–f and 1b): 2.3 ± 0.5 % for
PyC particles (18.1 ± 1.5 %) were applied than finer ones the Cambisol and 3.3 ± 0.6 % for the Luvisol at the midslope
(4.6 ± 0.7 %; p < 0.001). The strong interaction of soil type position (p = 0.14). Downslope, it was 1.1 ± 0.4 % for the
and PyC particle size in our model suggests that coarse PyC Cambisol and 2.3 ± 0.5 % for the Luvisol (p = 0.058).
remained on the soil surface of the Cambisol in the upslope
position (p < 0.001; Fig. 6a and Table S2).
4 Discussion
3.4.2 Mid- and downslope 4.1 PyC redistribution by rainfall
In the midslope position, significant differences were only Our study provides evidence for a quick redistribution of PyC
found for the Luvisol and were mainly related to PyC by intense rainfall. Between 0.18 ± 0.05 % and 36.0 ± 4.6 %
feedstock (Fig. 6c–d and Table S2). There was more PyC of the initially added PyC was transported by runoff (both as
fraction on the surface (0–1 cm) of the Luvisol when sediment and floating particles), and between 10.3 ± 1.7 %
Biogeosciences, 18, 1105–1126, 2021 https://doi.org/10.5194/bg-18-1105-2021S.-L. Bellè et al.: Key drivers of pyrogenic carbon redistribution 1117
and 25.3 ± 3.7 % of the initially added PyC was transported 4.2 Effect of PyC application on nSOC redistribution
as splash (both as sediment and floating particles) during
30 min rainfall events (51.4 mm) on 0.25 m2 plots (Figs. 4 By using 13 C-labeled PyC, we were able to show for the first
and 7). Therefore, our data confirm that the fate and mobil- time (to our knowledge) that the application of PyC to the
ity of PyC on short timescales depends to a great extent on soil surface and its subsequent redistribution affect the fate
its initial interaction with water (Masiello and Berhe, 2020). and redistribution of native SOC (nSOC). The changes in
The portions of PyC relocated by runoff (% of total added nSOC export by runoff and splash after application of PyC
PyC; Fig. 4a and c) are of the same order of magnitude as ob- were of the same order of magnitude as the PyC flux af-
served for post-fire, plot-scale erosion field studies. Rumpel ter the rainfall event but highly variable, and the underlying
et al. (2009) reported that between 7 % and 29 % of initially processes are not fully clear and need further investigation
applied PyC was transported by runoff. Cotrufo et al. (2016) (Fig. 5). These changes could be related to the sorption and
found that 11 % of PyC present in the organic layer was ex- stabilization of nSOC to PyC surfaces (Jiang et al., 2019;
ported during the first year after a fire, and Major et al. (2010) Singh et al., 2014), or the strong affinity of PyC to sorb to
estimated that around 20 % to 53 % of applied PyC must mineral surfaces, which can promote the mobilization of less
be relocated by erosion. In addition, Rumpel et al. (2009) effectively adsorbed nSOC through desorption (Jiang et al.,
reported PyC erosion by splash of 31.2 ± 21.3 %, and our 2016). However, it seems unlikely that these processes take
values of PyC recovery are well within this range (Fig. 4b place within minutes. Another possible explanation could be
and d). However, it has to be mentioned that other studies that PyC particles on the soil surface increase the soil hy-
have also reported limited transport of PyC (< 2 % of TOC drophobicity and lead to a longer contact time between water
in runoff) after 62 years after a fire (Güereña et al., 2015). and nSOC, which may promote its export. However, it is still
Initial rainfall determines not only the redistribution of surprising that such a process would result in such a large ex-
PyC on the surface, but also the quantity of PyC that moves port flux of nSOC. More specific experiments are needed to
into the soil (Masiello and Berhe, 2020). We recovered part fully understand these processes.
of the initially added PyC (PyC fraction) at 1–3 and 3–10 cm
depth at the upslope position where it was initially applied, 4.3 Key drivers of soil, TOC and PyC redistribution
especially for the Cambisol (6.8 % (Cambisol) and 1.3 %
(Luvisol); Fig. 6a–b). This shows that PyC moved through 4.3.1 Soil type
the soil profile within 30 min under unsaturated conditions.
Due to the small amounts of PyC compared to the total mass Soil type was the main explanatory variable that influenced
of soil in our plots (on average 26.0 ± 0.2 kg soil per plot), soil, TOC and PyC redistribution by surface runoff (Figs. 2a,
we could only calculate the fraction of OC that is PyC (PyC 3a and 4a). This can be related to the soils’ physical and
fraction) in the soil column, but no PyC recovery (% of to- hydrological properties. The higher runoff (7 times higher
tal added PyC). This limits the comparison with literature for the Luvisol than the Cambisol; Table 1) and reduced in-
values. We chose larger quantities of soil (larger plot size) to filtration rates (Fig. S3) for the Luvisol, despite its sandy
eliminate possible boundary effects of the plots on PyC redis- silty texture, can be explained by its lower aggregate stabil-
tribution. However, in accordance with our findings, vertical ity (Table 1). Runoff ratios between 13.2 ± 0.8 % (Cambisol)
movement of 13 C-labeled wood PyC (3 % to 4 % of applied and 88.5 ± 2.3 % (Luvisol) for a 102.8 mm h−1 rainfall on
PyC) up to 10–15 cm depth in soil cylinders after 10 months 0.25 m2 plots are comparable to those reported from rainfall
under field conditions has been reported for one of the sites simulation experiments (80–85 mm h−1 rainfall on 0.28 m2
from which we took the soil for our plots (Cambisol at the plots) in Portugal, with runoff coefficients of 7 % to 55 % on
Lägern site) (Singh et al., 2014). In other studies conducted Leptosols and Umbrisols (Malvar et al., 2013). Difference
on soil plots or soil microcosms (between 8 and 20 cm long in runoff amount for the two soil types was only by a fac-
and 10 cm in diameter) in the field or in the laboratory, re- tor of 7 but the erosion differed by a factor of 150 (Fig. 2a),
located quantities by vertical movement up to 10 cm depth which indicates that the higher erosion on the Luvisol is a
after 1–2 years varied between < 1 % and 2.3 % of initially result of the Luvisols’ physical instability and susceptibil-
applied PyC (in particulate or dissolved form) (Hilscher and ity to erosion (i.e., the low aggregate stability and SOC con-
Knicker, 2011; Maestrini et al., 2014; Major et al., 2010). tent) and not only a result of the higher water flow (Koiter
Even larger amounts (23 % to 46 % of initially applied PyC) et al., 2017). Surface sealing is generally stronger for soils
have been reported for plot-scale rainfall simulations in the with a coarser soil texture and lower organic matter con-
tropics, but this vertical transport was limited to 1 cm depth tent (Armenise et al., 2018). In contrast, clay-rich soils with
(Rumpel et al., 2009). a high physical stability (i.e., high aggregate stability) and
higher TOC content are less prone to erosion, as they do not
lead to rapid surface sealing and therefore slow down runoff
generation and erosion (Berhe and Kleber, 2013; de Nijs
and Cammeraat, 2020; Thomaz, 2018). The eroded quan-
https://doi.org/10.5194/bg-18-1105-2021 Biogeosciences, 18, 1105–1126, 2021You can also read


