The preserved plume of the Caribbean Large Igneous Plateau revealed by 3D data-integrative models - GFZpublic
←
→
Page content transcription
If your browser does not render page correctly, please read the page content below
Solid Earth, 12, 275–298, 2021
https://doi.org/10.5194/se-12-275-2021
© Author(s) 2021. This work is distributed under
the Creative Commons Attribution 4.0 License.

The preserved plume of the Caribbean Large Igneous Plateau
revealed by 3D data-integrative models
Ángela María Gómez-García1,2,3,z , Eline Le Breton4 , Magdalena Scheck-Wenderoth1 , Gaspar Monsalve2 , and
Denis Anikiev1
1 GFZ   German Research Centre for Geosciences, 14473 Potsdam, Germany
2 Facultad  de Minas, Universidad Nacional de Colombia, Medellín, Colombia
3 CEMarin – Corporation Center of Excellence in Marine Sciences, Bogotá, Colombia
4 Institute of Geological Sciences, Freie Universität Berlin, 12249 Berlin, Germany
z Invited contribution by Ángela María Gómez-García, recipient of the EGU Seismology Outstanding Student Poster and

PICO Award 2019.

Correspondence: Ángela María Gómez-García (angela@gfz-potsdam.de)

Received: 4 September 2020 – Discussion started: 28 September 2020
Revised: 19 November 2020 – Accepted: 4 December 2020 – Published: 29 January 2021

Abstract. Remnants of the Caribbean Large Igneous Plateau        tomography, at least down to 75 km depth. The interpreted
(C-LIP) are found as thicker than normal oceanic crust in        plume conduits spatially correlate with the thinner crustal re-
the Caribbean Sea that formed during rapid pulses of mag-        gions present in both basins; therefore, we propose a mod-
matic activity at ∼ 91–88 and ∼ 76 Ma. Strong geochemi-          ification to the commonly accepted tectonic model of the
cal evidence supports the hypothesis that the C-LIP formed       Caribbean, suggesting that the thinner domains correspond
due to melting of the plume head of the Galápagos hotspot,       to the centres of uplift due to the inflow of the hot, buoyant
which interacted with the Farallon (Proto-Caribbean) plate       plume head. Finally, using six different kinematic models,
in the eastern Pacific. Considering plate tectonics theory,      we test the hypothesis that the C-LIP originated above the
it is expected that the lithospheric portion of the plume-       Galápagos hotspot; however, misfits of up to ∼ 3000 km are
related material migrated within the Proto-Caribbean plate in    found between the present-day hotspot location and the man-
a north–north-eastward direction, developing the present-day     tle anomalies, reconstructed back to 90 Ma. Therefore, we
Caribbean plate. In this research, we used 3D lithospheric-      shed light on possible sources of error responsible for this
scale, data-integrative models of the current Caribbean plate    offset and discuss two possible interpretations: (1) the Galá-
setting to reveal, for the first time, the presence of posi-     pagos hotspot migrated (∼ 1200–3000 km) westward while
tive density anomalies in the uppermost lithospheric man-        the Caribbean plate moved to the north, or (2) the C-LIP was
tle. These models are based on the integration of up-to-         formed by a different plume, which – if considered fixed –
date geophysical datasets from the Earth’s surface down          would be nowadays located below the South American con-
to 200 km depth, which are validated using high-resolution       tinent.
free-air gravity measurements. Based on the gravity resid-
uals (modelled minus observed gravity), we derive density
heterogeneities both in the crystalline crust and the upper-
most oceanic mantle (< 50 km). Our results reveal the pres-      1   Introduction
ence of two positive mantle density anomalies beneath the
                                                                 Oceanic plateaus are vast areas characterized by a thicker
Colombian and the Venezuelan basins, interpreted as the pre-
                                                                 than “normal” oceanic crust, which might reach up to 38 km
served fossil plume conduits associated with the C-LIP for-
                                                                 (Kerr and Mahoney, 2007). Although about 12 different
mation. Such mantle bodies have never been identified be-
                                                                 oceanic plateaus have been recognized worldwide, they rep-
fore, but a positive density trend is also indicated by S-wave
                                                                 resent one of the least well-known of Earth’s magmatic pro-

Published by Copernicus Publications on behalf of the European Geosciences Union.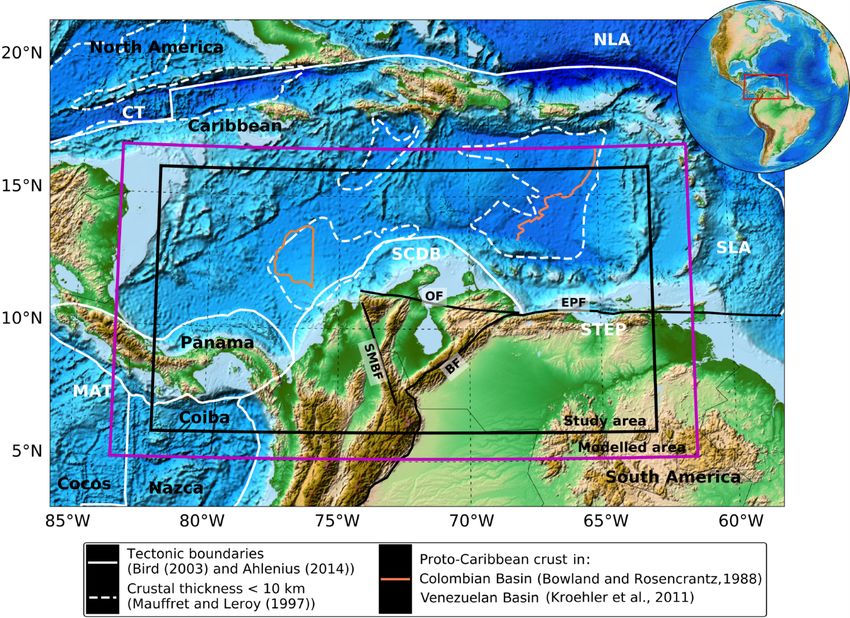
276                            A. M. Gómez-García et al.: The preserved plume of the Caribbean Large Igneous Plateau

cesses (Kerr, 2014). In the early 1970s, Edgar et al. (1971)     the eastern Pacific. The present-day Caribbean plate is com-
and Donnelly (1973) discovered the Caribbean Large Ig-           posed of different accreted crustal domains (e.g. volcanic
neous Plateau, which corresponds to the second largest           arcs, continental and oceanic realms) that have migrated
plateau (by area) after the Ontong Java Plateau, with an ap-     since the Late Jurassic to Early Cretaceous period, including
proximated extent of 1.1 × 10⁶ km2 and an estimated excess       the igneous plateau materials that affected the oceanic crust
magma volume of 4.4 × 10⁶ km3 (Kerr, 2014).                      of the former Farallon plate (Boschman et al., 2014; Montes
   The origin of such a vast volume of basalt is widely rec-     et al., 2019a).
ognized as the interaction of a mantle plume with the over-         Different regions of the Caribbean have been the target of
riding, mobile lithosphere. With time, the plume-related ma-     relatively extensive seismic reflection and refraction, sonar,
terial suffers physical and chemical changes, which at the       and drilling campaigns (e.g. Diebold and Driscoll, 1999;
same time are associated with a diversification in the way       Edgar et al., 1971; Kroehler et al., 2011; Mauffret and Leroy,
the plume interacts with the overriding plate. During the        1997; Rosencrantz, 1990); some of which were undertaken
lifespan of a plume it is expected to first create extensive     with the limitations of early seismic acquisition technol-
oceanic plateaus, followed by aseismic ridges, due to melt-      ogy. Nonetheless, the coverage of these measurements is
ing of the large plume head or the narrower plume tail, re-      poor when compared with the complexity of most of the
spectively (Campbell, 2005). The initial stages of the plume–    Caribbean morphological structures.
lithosphere interaction include the uplift and weakening of         In this paper, the main goal is to evaluate the present-
the overlying lithosphere due to the inflow of hot, highly       day 3D lithospheric structure of the South Caribbean mar-
buoyant mantle material. At a later stage, when the plume        gin (continental and oceanic domains – black box in Fig. 1)
is no longer active, geodynamic models show that the frozen      by means of modelling of the gravity anomalies (Gz), which
plume material can be preserved into the lithosphere, form-      are especially sensitive to deep density distributions (Ál-
ing high-density and therefore high-velocity bodies (François    varez et al., 2014, 2015) and are therefore a potential tool
et al., 2018).                                                   for analysing the upper 200 km of the Earth. Here, the high
   Successful detections of present-day mantle plumes us-        spatial resolution EIGEN6C-4 dataset is used (Förste et al.,
ing P-wave and/or S-wave velocity anomalies include the          2014; Ince et al., 2019), which includes a spherical harmonic
work of, for example, Montelli et al. (2004) and Civiero         solution of up to a degree and order of Nmax = 2190, equiv-
et al. (2019). These results suggest that the currently active   alent to a topographic wavelength of ∼ 18 km.
plumes are characterized by negative velocity anomalies, as-        Due to the fact that the gravity response of a system is the
sociated with the presence of high-temperature material. The     superposition of the gravity effects caused by all the density
plume conduct shows a variety of shapes, some of which           contrasts within it, we considered the gravitational effects
include the interconnection of branches at different depths      caused by the heterogeneous lithospheric mantle in the South
(e.g. Civiero et al., 2019, and references therein). Imaging     Caribbean and north-western South American plates. There-
these complex systems, however, has posed a large challenge      fore, the geometries of both the Nazca and the Caribbean flat
in the scientific community, especially for the correct inter-   slabs were included in the gravity models.
pretation of tomographic images (Campbell, 2005; Civiero            Previous studies in this region include few 3D
et al., 2019).                                                   lithospheric-scale, gravity-validated models (Gómez-
   The oceanic plateaus are normally difficult to subduct due    García et al., 2019b; Sanchez-Rojas and Palma, 2014).
to their abnormal thickness and positive thermal imprint in-     However, some limitations of these attempts include, for
herited from their mantle plume origin. Thus, fragments of       instance, a spatially heterogeneous gravity dataset, a mantle
the Caribbean plateau have been accreted along continental       that is considered to have a uniform and constant density,
margins, such as in Ecuador, Colombia, Panama, Costa Rica,       and that the analysis is of only the shallow density contrasts.
Curaçao, and Hispaniola (Hastie and Kerr, 2010; Thomp-              The results of the gravity inversion not only highlight
son et al., 2004). Using accreted material and relatively few    crustal areas heavily affected by the high-density plume ma-
drilled or dragged submarine rock samples, the geochemistry      terial but also suggest the presence of a high-density trend
of the Caribbean Large Igneous Plateau (C-LIP) has been re-      in the oceanic mantle of the Caribbean plate. This trend can
constructed (e.g. Geldmacher et al., 2003; Hastie and Kerr,      be followed from the Moho down to 75 km depth, as sup-
2010; Kerr and Tarney, 2005; Thompson et al., 2004). In-         ported by high S-wave velocities in the tomographic model
deed, strong geochemical evidence suggests that the C-LIP        SL2013sv (Schaeffer and Lebedev, 2013). These results are
corresponds to melting of the plume head of the Galápagos        interpreted as the preserved, lithospheric fossil plume con-
hotspot (Geldmacher et al., 2003; Thompson et al., 2004),        duits, responsible for the development of the C-LIP, which
although recent kinematic reconstructions of the Caribbean       migrated as the Proto-Caribbean lithosphere moved from the
do not allow us to trace back the location of the plate above    eastern Pacific.
the present-day location of the Galápagos plume (Boschman           Finally, taking advantage of the more precise spatial loca-
et al., 2014). Nevertheless, diverse evidence exists about the   tion of the C-LIP fossil plume conduits, different kinematic
north–north-eastward migration of the Caribbean plate from       reconstructions are explored, aiming to evaluate the hypoth-

Solid Earth, 12, 275–298, 2021                                                       https://doi.org/10.5194/se-12-275-2021
A. M. Gómez-García et al.: The preserved plume of the Caribbean Large Igneous Plateau                                                  277

Figure 1. Location of the regions for models (magenta box) and interpretations (black box). The modelled area involves four tectonic plates:
Caribbean, Panama, Nazca (Coiba microplate), and the north of South American plate. Black lines represent the main faults. BF is the Boconó
Fault, CB is the Colombian Basin, CT is the Cayman Trough, EPF is the El Pilar Fault, NLA is the northern Lesser Antilles subduction,
MAT is the Middle American Trench, OF is the Oca Fault, SCDB is the South Caribbean Deformed Belt, SLA is the southern Lesser Antilles
subduction, SMBF is the Santa Marta-Bucaramanga Fault, STEP is the Subduction–Transform–Edge–Propagator fault system, and VB is the
Venezuelan Basin. Shade relief image from Amante and Eakins (2009).

esis that the C-LIP formed above the Galápagos hotspot.                 Tarney, 2005; Van Der Lelij et al., 2010). In summary, the
However, offsets of ∼ 1200–3000 km are obtained between                 accreted fragments consist of basaltic and picritic lavas and
the present-day Galápagos hotspot location and the plume                sills, with gabbros and ultramafic cumulates (Kerr, 2014).
conduits back to 90 Ma, as previously reported by Pindell                  Diebold and Driscoll (1999) and Driscoll and Diebold
et al. (2006) and Boschman et al. (2014).                               (1999) presented the most detailed model of the formation
                                                                        of the C-LIP, which they based on seismic reflection pro-
                                                                        files. According to their model, the Proto-Caribbean crust
2     Tectonic setting of the Caribbean and north-western               formed in the eastern Pacific by seafloor-spreading in the
      South America                                                     Late Jurassic–Early Cretaceous. This crust had a normal
                                                                        thickness (∼ 6 km) that later on during the pre-Senonian in-
2.1    The Caribbean Large Igneous Plateau                              teracted with a mantle plume. As a result, a widespread erup-
                                                                        tion of the first basaltic flows, accompanied by extension
The Caribbean oceanic crust is the complex product of the               and thinning of the Proto-Caribbean crust took place. Ad-
interaction of a mantle plume with the Proto-Caribbean (Far-            ditionally, the intrusion of igneous material and underplating
allon) plate 90 Ma ago, forming the second largest plateau              of residual mantle and ultramafic cumulates contributed to
after the Ontong Java (Kerr, 2014). Melt modelling of the               the formation of the thicker portions of the Caribbean plate,
high-MgO plateau lavas found in Curaçao suggest that the                which in some places can reach up to 20 km. Following this,
primary magmas contained up to 24 wt % MgO and that they                during the Senonian additional extension and underplating
correspond to a 30 %–32 % partial melting of a fertile, het-            occurred, causing the uplift and rotation of the Beata Ridge,
erogeneous peridotite, with a potential temperature of 1564–            accompanied by the late stage of basaltic flows. Thus, at least
1614 ◦ C (Hastie and Kerr, 2010; Kerr, 2014).                           two main pulses of magmatic activity have been identified: at
   Due to the fact that most of the plateau is currently sub-           ∼ 91–88 and ∼ 76 Ma (Diebold and Driscoll, 1999; Sinton
merged below large water depths, its structure and geochem-             et al., 1998).
istry has been mainly constrained from accreted material                   Nowadays, it is possible to recognize anomalously thin,
along the Caribbean margins, including Colombia, Ecuador,               extended Proto-Caribbean crust, where crustal thickness
Costa Rica, Jamaica, and Hispaniola (Kerr, 2014; Kerr and

https://doi.org/10.5194/se-12-275-2021                                                                  Solid Earth, 12, 275–298, 2021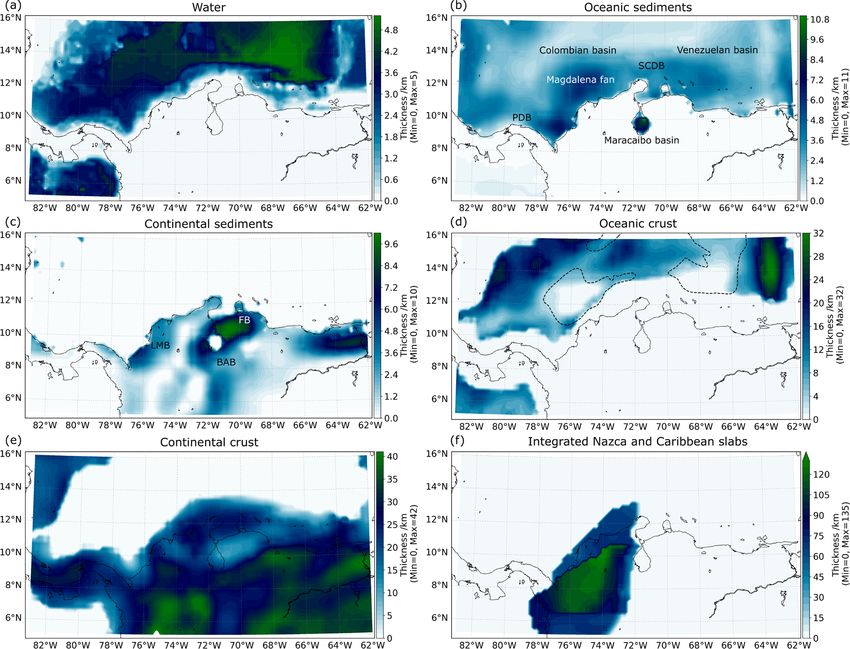
278                             A. M. Gómez-García et al.: The preserved plume of the Caribbean Large Igneous Plateau

ranges between 2.8 and 5 km, in the south-eastern Venezue-            From the Pacific, the subduction of the Nazca plate shapes
lan Basin and in some regions of the Colombian Basin. These        the western margin of the South American continent. In
thin areas are characterized by a rough basement (B00 hori-        Colombia, north of the Caldas tear (∼ 5◦ N) the subduction
zon), suggesting that no basalt flows covered these domains.       becomes flat (Chiarabba et al., 2015; Vargas and Mann, 2013;
The Moho depth also shows a spatial variation: it shallows         Wagner et al., 2017) and is likely associated with the down-
abruptly below the rough B00 basement and deepens in ar-           going Coiba microplate (Fig. 1). This flat-slab subduction is
eas where the B00 horizon is smooth (Driscoll and Diebold,         characterized by a buoyant oceanic crust, which Chiarabba
1999). Figure 1 depicts the areas of thinned Proto-Caribbean       et al. (2015) associated with a volcanic ridge.
crust as orange lines in the Colombian Basin (Bowland and
Rosencrantz, 1988) (closed polygon) and in the Venezuelan
Basin (Kroehler et al., 2011) (eastward of the orange line).
   Although there is strong geochemical evidence that sup-         3     Modelling approach
ports the origin of the C-LIP as melting of the paleo-
Galápagos plume head (Geldmacher et al., 2003; Hastie              The first steps in the modelling workflow were to define a
and Kerr, 2010; Kerr and Tarney, 2005; Thompson et al.,            structural starting model and to assign the densities to the up-
2004), recent kinematic reconstructions back to 90 Ma by           per most lithospheric layers. Following this, different mantle
Boschman et al. (2014) showed an offset of up to 3000 km           density configurations were tested (Sect. S1 in the Supple-
between the present-day Galápagos hotspot and the location         ment). The gravity response of these 3D lithospheric-scale
of the Caribbean plate.                                            structural and density models were computed with the soft-
                                                                   ware IGMAS+ (Schmidt et al., 2011) at 10 km calculation
2.2   Nazca and Caribbean subductions                              height. The modelled results were compared with the free-
                                                                   air gravity anomalies of EIGEN-6C4 (Förste et al., 2014),
The northern margin of the South American plate is an ac-          available at the Calculation Service of the International Cen-
tive zone with two flat-slab subductions that interact at depth:   tre for Global Earth Models (ICGEM; Ince et al., 2019). The
the Nazca (Coiba microplate) plate from the west and the           modelled area is shown as a magenta box in Fig. 1 and ranges
Caribbean plate from the north (some recent references in-         between approximately 5 and 16◦ N and 62 and 83◦ W.
clude Bernal-Olaya et al., 2015; Chiarabba et al., 2015; Mon-         In the following subsections, the datasets used to constrain
salve et al., 2019; Porritt et al., 2014; Siravo et al., 2019;     the initial structural model are presented (Sect. 3.1). Addi-
Syracuse et al., 2016; Vargas and Mann, 2013; Wagner et al.,       tionally, because the gravity anomalies of larger wavelengths
2017; Yarce et al., 2014). This complex interaction defines a      are especially sensitive to deep density contrasts, the initial
poorly understood tectonic setting. Indeed, the geometry of        density configuration took into account the evaluation of the
these subductions is not well constrained yet, although differ-    mantle density effect in the gravity model (Sect. 3.2). Finally,
ent attempts have been made (e.g. Van Benthem et al., 2013;        Sect. 3.3 provides the details about the forward-modelling
Bezada et al., 2010; Hayes et al., 2018; Mora et al., 2017).       of the gravity residuals of the initial lithospheric configura-
   Since the Late Cretaceous, the oblique collision of the         tion, which includes the definition of two high-density bodies
Caribbean plate due to its east–north-east migration from the      in the uppermost lithospheric mantle (< 50 km). The general
Pacific Ocean has shaped the South Caribbean margin. As            methodological workflow is shown in Fig. 2.
a consequence, several foreland basins have been formed in
the north of the South American continent, following the di-       3.1    Input data
achronous displacement of the collision front (Escalona and
Mann, 2011 and references therein).                                The lithospheric structural starting model includes the thick-
   Along this margin, the Caribbean plate has subducted be-        nesses of eight interfaces: (1) seawater (Fig. 3a), obtained as
neath the continental South American plate and the Mara-           the difference between sea level and the General Bathymetric
caibo block since the Late Cretaceous (Kroehler et al., 2011),     Chart of the Oceans (GEBCO) (Weatherall et al., 2015); (2)
forming the South Caribbean Deformed Belt (SCDB; see               oceanic and (3) continental sediments (Fig. 3b and c) taken
Fig. 1). However, the lateral extension of this subduction has     from the CRUST1.0 dataset (Laske et al., 2013); (4) oceanic
been actively debated. For instance, the tomographic model         and (5) continental crystalline crust (Fig. 3d and e) consid-
of Van Benthem et al. (2013) showed positive P-wave ve-            ering the Moho depth from the GEMMA model (Reguz-
locity anomalies from 76 to 67◦ W that were only traced in         zoni and Sampietro, 2015); (6) the slab shapes of the Nazca
the upper mantle, suggesting that the subduction is ongoing        (Hayes et al., 2018) and (7) Caribbean (Mora et al., 2017)
along most of the margin, excluding the southwestern edges         flat-slab subductions (Fig. 3f); and finally (8) the lithospheric
with the South American plate and the Panama microplate.           mantle, which was subdivided into seven layers using the
According to Kroehler et al. (2011), in the southeast portion      SL2013sv S-wave velocity model (Schaeffer and Lebedev,
of the Caribbean plate an incipient subduction might be de-        2013) from 50 to 200 km depth. The integration of the differ-
veloping at present.                                               ent datasets was made after interpolating to a homogeneous

Solid Earth, 12, 275–298, 2021                                                          https://doi.org/10.5194/se-12-275-2021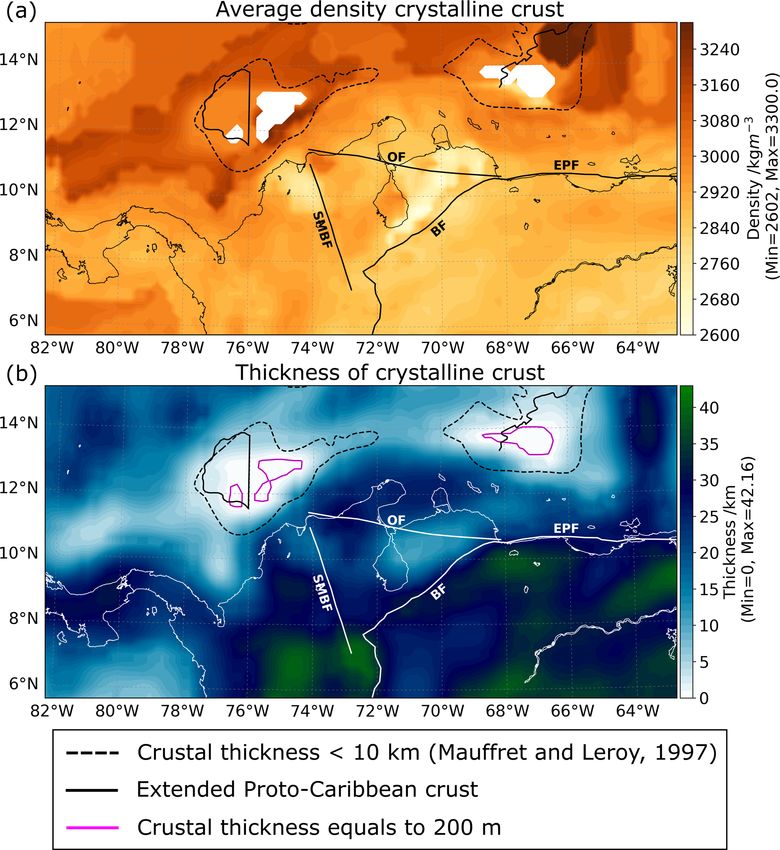
A. M. Gómez-García et al.: The preserved plume of the Caribbean Large Igneous Plateau                                             279

Figure 2. Methodological scheme used in this research. 1 Schmidt et al. (2011). 2 Förste et al. (2014) and Ince et al. (2019). 3 Uieda
et al. (2013).

spatial resolution of 25 km, using the minimum curvature al-         On the other hand, the Caribbean slab was defined following
gorithm with the software Petrel (© Schlumberger Ltd).               the hypocentral distribution (Mora et al., 2017). Figure 3f
   The sediment thickness from CRUST1.0 was selected not             presents the integrated thickness of both flat slabs. In the re-
only because it includes the continental regions but also be-        gion where both subducting plates interact at depth the inte-
cause it takes into account information from broadly dis-            grated thickness reaches more than 120 km. While the Slab2
tributed seismic profiles of EXXON (1985) that allow the             dataset includes the Nazca slab thickness, in the Caribbean
recognition of the main sedimentary features without disre-          case a thickness of ∼ 70 km was assumed a priori (see Fig. S2
garding the spatial connection between both inland and off-          in the Supplement).
shore sedimentary systems. The sea level was used as the
boundary zone between the oceanic and the continental de-            3.2   Initial lithospheric configuration and the mantle
pocentres.                                                                 density effect on the gravity signal
   Additionally, the continent–ocean transition (COT) de-
fined by Gómez-García et al. (2019a, b) was used to sep-             The lithospheric mantle density is one of the most influen-
arate both oceanic and continental crustal types. The black          tial parameters in the modelling of the gravity anomalies
dashed lines in the oceanic crust map (Fig. 3d) depict re-           because of its massive volume compared to the other litho-
gions where the crust has a thickness smaller than 10 km ac-         spheric layers. The mantle density effect on the gravity sig-
cording to Mauffret and Leroy (1997). Most of these regions          nal was explored by testing four different mantle configura-
coincide with places where the calculated crustal thickness is       tions (see Sect. S1). The model with the minimum RMSE
extremely thin, with values lower than 4 km.                         compared with EIGEN-6C4 was selected as the initial litho-
   Finally, even though the 3D mantle densities published            spheric configuration. This model includes the 3D mantle
by Gómez-García et al. (2019a, b) were considered (see               densities obtained from the conversion of the S-wave velocity
Sect. 3.2), whose approach takes into account the miner-             anomalies of the SL2013sv model (Schaeffer and Lebedev,
alogical composition of the mantle and the S-wave veloci-            2013), from 50 to 200 km depth, published by Gómez-García
ties of Schaeffer and Lebedev (2013), the gravity signal of          et al. (2019a, b). In this approach, the density conversion is
the Nazca and Caribbean slabs was also tested. The Nazca             performed following a modified version of Goes et al. (2000)
subduction was taken from the Slab2 dataset (Hayes et al.,           method, using a pressure- and temperature-dependent expan-
2018), which integrates diverse geophysical information into         sion coefficient (Hacker and Abers, 2004; Meeßen, 2017).
the definition of the slab’s 3D structure, including active-            Figures S3 and S4 present the S-wave velocities at differ-
source seismic data, receiver functions, seismicity catalogues       ent depths (from 50 to 200 km, every 25 km) and their asso-
from local and regional networks, and tomographic models.            ciated densities, respectively. In general, with this approach
                                                                     it is possible to establish a relation between high-velocity

https://doi.org/10.5194/se-12-275-2021                                                             Solid Earth, 12, 275–298, 2021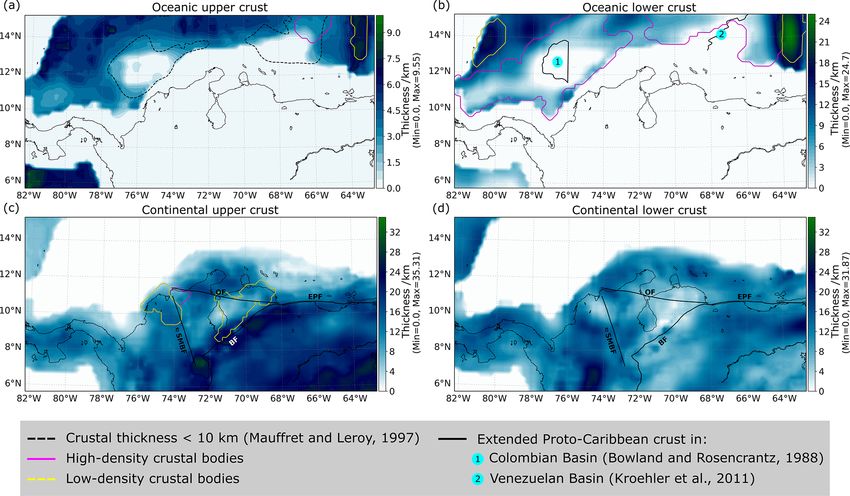
280                               A. M. Gómez-García et al.: The preserved plume of the Caribbean Large Igneous Plateau

Figure 3. Structural layers used in the starting model: (a) water thickness from GEBCO (Weatherall et al., 2015), (b, c) unconsolidated
oceanic and continental sediments based on CRUST1.0 (Laske et al., 2013), (d, e) oceanic and continental crystalline crust thicknesses (the
dashed lines in d represent places where the oceanic crust is thinner than 10 km; Mauffret and Leroy, 1997); (f) integrated slab thickness from
the Nazca (Hayes et al., 2018) and Caribbean (Mora et al., 2017) subductions. The independent thickness maps of the slabs are presented in
Fig. S2. BAB is the Barinas-Apure basin. FB is the Falcón Basin. LMB is the Lower Magdalena Basin. PDB is the Panamá Deformed Belt.
SCDB is the South Caribbean Deformed Belt.

anomalies and high mantle densities (blue and dark blue re-                  Based on the spatial distribution of both parameters (ve-
gions in Fig. S3 and S4, respectively) and vice versa with low            locity and density), it is not easy to differentiate which
velocities and low mantle densities. Figure 4 summarizes the              portions of the mantle belong to either the Caribbean or
conversion results as described hereafter.                                the Nazca slabs. Nevertheless, the fastest velocities (up to
   The mantle structure shows two different trends. At depths             4580 m s−1 ) are concentrated between 68 and 77◦ W, from
shallower than 75 km, in the Caribbean Sea the mantle is                  125 down to 200 km depth (Figs. 4b and S3).
denser compared with the one below the South American                        Because at depths shallower than 125 km the observed pat-
continent, with differences up to 40 kg m−3 at 50 km depth.               terns do not allow us to make a reliable interpretation about
Although the mantle density increases with depth, it is pos-              the slabs, it was necessary to explore the gravity effect of
sible to distinguish a subduction-like behaviour from 125                 both subducting slabs using additional datasets. Figure 5a
to 200 km below the surface: denser (colder) material be-                 shows the spatial distribution of the depth to the top of the
low the South American continent, in contrast with a lighter              Nazca (Coiba) slab, as published by Hayes et al. (2018).
(warmer) mantle below the ocean. These two trends are sum-                Two main factors can be highlighted from this geometry:
marized in Fig. 4a and c for depths shallower than 75 km and              (1) even though it has been published as the Nazca subduc-
in Fig. 4b and d for those deeper than 125 km depth.                      tion, it is very likely that it also includes an important frac-
                                                                          tion of the Caribbean slab because of its northward exten-

Solid Earth, 12, 275–298, 2021                                                                  https://doi.org/10.5194/se-12-275-2021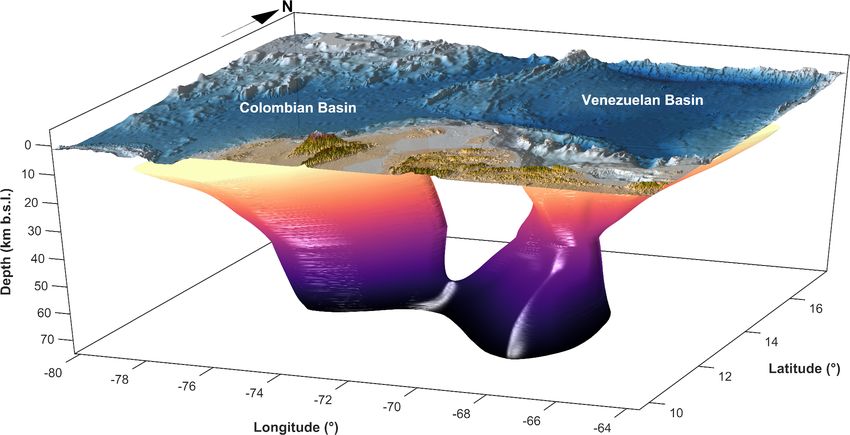
A. M. Gómez-García et al.: The preserved plume of the Caribbean Large Igneous Plateau                                                  281

Figure 4. Relation between the S-wave velocities from the SL2013sv model (Schaeffer and Lebedev, 2013) and the calculated mantle
densities. (a, b) S-wave velocities at 75 and 150 km depth, respectively. The original cell size of the tomographic data is 0.5◦ × 0.5◦ .
(c, d) Corresponding densities at 75 and 150 km depth following Goes et al. (2000) and Meeßen (2017) (see the text for details of the
conversion). In this case the S-wave velocities were interpolated to a spatial resolution of 25 km to make them consistent with the spatial
resolution of the rest of the lithospheric layers.

Figure 5. Depth to the top of the slabs tested in the lithospheric-scale gravity models. (a) Nazca geometry from the Slab2 dataset (Hayes
et al., 2018). Note that this geometry does not differentiate the Nazca (Coiba) and the Caribbean components in the slab. (b) Caribbean slab
as published by Mora et al. (2017).

sion, and (2) it is possible to distinguish its flat shape, which       the Caribbean subduction is not entirely flat, but a sharp in-
widens towards the east, in the region north of the Caldas              crease in its angle is present towards the south and south-east.
tear (∼ 5◦ N), as previously reported by other authors (e.g.               Table 1 summarizes the densities assumed in the initial 3D
Chiarabba et al., 2015; Vargas and Mann, 2013). Similarly,              lithospheric model for the different layers considered. This
Fig. 5b depicts the depth to the top of the Caribbean slab              model includes the gravity response of the 3D mantle densi-
by Mora et al. (2017), which according to these authors is              ties in addition to the integration of the Nazca and Caribbean
present westward of ∼ 72◦ W. This geometry suggests that                slabs geometries, as represented in Fig. 3f. When both slabs
                                                                        are integrated into the model, a density of 3163 kg m−3 is ob-

https://doi.org/10.5194/se-12-275-2021                                                                  Solid Earth, 12, 275–298, 2021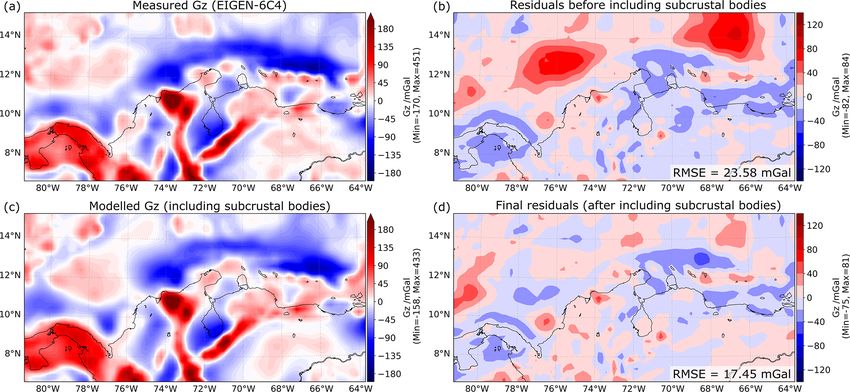
282                              A. M. Gómez-García et al.: The preserved plume of the Caribbean Large Igneous Plateau

Table 1. Summary of the datasets used to constrain the initial 3D lithospheric-scale model of the South Caribbean and north-western South
American plate and the density values (kg m−3 ) assumed for each layer.

      Layer                                                 Density    Reference of structural layer
      Water                                                   1040     GEBCO (Weatherall et al., 2015)
      Oceanic sediments                                       2350     CRUST1.0 (Laske et al., 2013)
      Continental sediment                                    2500     CRUST1.0 (Laske et al., 2013)
      Oceanic crust                                           2900     Moho depth from GEMMA model
      Continental crust                                       2800     Reguzzoni and Sampietro (2015)
      Nazca slab                                              3163     Slab2 (Hayes et al., 2018)
      Caribbean slab                                          3163     (Mora et al., 2017)
      Mantle from Moho down to 50 km depth                    3200     –
      Mantle from 50 down to 200 km depth       3D density solution    SL2013sv tomographic model (Schaeffer and Lebedev, 2013)

tained with the IGMAS+ inversion algorithm (Sæther, 1997;                 Finally, after implementing the previously mentioned two
Schmidt et al., 2011).                                                 steps, large gravity residuals of medium-size wavelengths
                                                                       were still present in the oceanic domain of the Caribbean,
3.3   Forward-modelling of the gravity residuals                       which led us to define two high-density bodies in the upper-
                                                                       most oceanic lithospheric mantle (< 50 km) of the Colom-
After the analysis of the mantle density effect on the mod-            bian and the Venezuelan basins. At shallow depths, trade-offs
elled gravity was performed, the model which had the mini-             between the crust and the shallow mantle may occur, affect-
mum RMSE compared with the observed gravity anomalies                  ing the reliability of the tomographic data.
of the EIGEN-6C4 dataset (Förste et al., 2014) was selected
as the initial lithospheric configuration (Sect. 3.2).
   The relatively short wavelengths of the still-remaining             4     Results
gravity residuals (observed gravity minus modelled grav-
ity) associated to this model account for rather shallow den-          After testing the gravity response to different mantle con-
sity heterogeneities. Indeed, the initial model considered             figurations, the model that integrates all the regional scale
the oceanic and continental crusts as homogeneous layers               observations was selected as the initial lithospheric config-
with constant densities (see Table 1). Therefore, in order to          uration (Table 1). The residuals associated with this model
have a better representation of the crustal heterogeneities,           are depicted in Fig. 6 and have an RMSE of 28.84 mGal, the
the forward-modelling of the gravity residuals of the initial          minimum value of all tested models (Sect. S1). The wave-
model was performed in three main steps. First, the code               length of these residuals indicates that they are mainly due to
“Harvester” of the Fatiando a Terra geophysical Python tool            shallow heterogeneities that were not considered in the ini-
(Uieda et al., 2013) was used for defining the boundary be-            tial set up of the model. Therefore, the forward-modelling
tween the upper and lower continental and oceanic crusts.              of these residuals was used to derive density heterogeneities
Harvester plants “density seeds” at the base of the crust and          on a regional scale that are present within the continental
makes them grow vertically until the gravity residuals are             and oceanic crystalline crusts and in the uppermost (< 50 km
minimized, defining the top of the lower crust. In our case,           depth) lithospheric mantle, as described in the following sub-
a density contrast of 300 kg m−3 was assumed between the               sections.
upper and lower crust for this inversion.
   Second, in the regions where the residuals (after the in-           4.1    Crustal structure of the Caribbean and
version with Harvester) were still considerably large (> 30                   north-western South American plates
and < −30 mGal), bodies in the upper and lower crust
                                                                       Figure 7a depicts the observed free-air gravity of EIGEN-
within the oceanic and continental domains were defined (see
                                                                       6C4 at 10 km calculation height. This field has large positive
Sect. 4.1). The delimitation of these bodies took into account
                                                                       values (> 180 mGal) over the topographic highs of the An-
the geologic evolution of the C-LIP and the tectonics of the
                                                                       des, as well as over the Santa Marta massif and the Panama
Caribbean provinces in general (e.g. well-known volcanic
                                                                       microplate (Fig. 1). In contrast, negative gravity anomalies
arcs, previously reported underplated material, or extended
                                                                       lie over the thick depocentres of the South Caribbean mar-
proto-Caribbean crustal domains). Their densities were as-
                                                                       gin (Panama Deformed Belt, Magdalena Fan, and South
signed depending on whether they matched a positive or neg-
                                                                       Caribbean Deformed Belt; Fig. 3b), as well as over most
ative residual, which suggest a mass deficit or excess in the
                                                                       of the continental basins (Lower Magdalena, Barinas-Apure,
initial model, respectively.
                                                                       and Maracaibo; Fig. 3b, c).

Solid Earth, 12, 275–298, 2021                                                               https://doi.org/10.5194/se-12-275-2021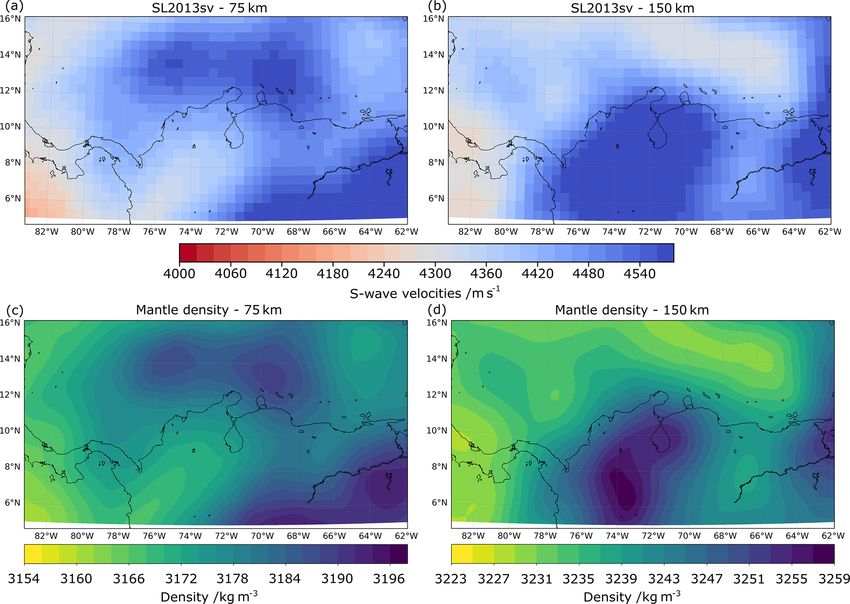
A. M. Gómez-García et al.: The preserved plume of the Caribbean Large Igneous Plateau                                                283

                                                                            As can be seen in Fig. 7c, after forward-modelling the
                                                                         gravity residuals including the subcrustal bodies, the mod-
                                                                         elled gravity response resembles the features previously de-
                                                                         scribed for the EIGEN-6C4 field. The new residuals have an
                                                                         RMSE of 17.45 mGal and have been minimized for the en-
                                                                         tire study area (Figs. 7d and S5f) compared with the residuals
                                                                         of the initial model (Figs. 6 and S5d). With the new litho-
                                                                         spheric configuration, a decrease of approximately 39.5 % in
                                                                         the RMSE is reached.
                                                                            This new lithospheric configuration aims to represent the
Figure 6. Gravity residuals of the initial lithospheric configuration,   complex tectonic setting of the Caribbean crust by includ-
assuming the densities in Table 1. Here, large misfits with a domi-      ing six different oceanic layers, with low- and high-density
nance of short (few kilometres) and medium (hundreds of kilome-          bodies (Fig. 8) as summarized in Table 2. The oceanic
tres) wavelengths suggest density heterogeneities in the shallower       upper crust has been modelled with an average density
domains of the lithosphere that were not considered in the initial       of 3000 kg m−3 and its maximum thickness reaches up to
set-up of the model.
                                                                         9.55 km (Fig. 8a). Moreover, low- and high-density bod-
                                                                         ies were defined within this layer. A low-density domain
Table 2. Summary of the layers and density values that integrate         is present below the Aves Ridge (yellow polygon), with an
the final structural model of the South Caribbean and north-western      average density of 2900 kg m−3 , while a high-density body
South American lithosphere.                                              was found below the Venezuelan Basin (magenta polygon),
                                                                         whose average density is 3300 kg m−3 .
 Layer                                                Modelled density
                                                                            The oceanic lower crust (Fig. 8b) has been modelled with
                                                             (kg m−3 )
                                                                         an average density of 3100 kg m−3 . Within this layer, widely
 Water                                                           1040    distributed high-density bodies are required to fit the grav-
 Oceanic sediments                                               2350
 Continental sediments                                           2500
                                                                         ity field both for the Colombian and the Venezuelan basins
 Oceanic upper crust                                             3000    (magenta polygons), with an average density of 3250 kg m−3 .
 Low-density upper crustal body (Aves Ridge)                     2900    The density assigned to the low-density bodies located in the
 High-density upper crustal body (Venezuelan Basin)              3300    Aves Ridge and the South Nicaraguan Rise is 3000 kg m−3 .
 Oceanic lower crust                                             3100
 Low-density lower crustal bodies                                3000
                                                                         The maximum thickness of this layer is 24.7 km, towards the
 (Aves Ridge and South Nicaraguan Rise)                                  west of the Aves Ridge.
 High-density lower crustal bodies                               3250       As a reference, Fig. 8a includes the places where Mauffret
 (Colombian and Venezuelan basins)                                       and Leroy (1997) reported a thinner oceanic crust (< 10 km,
 Continental upper crust                                        2750
 Low-density bodies upper continental crust                2600–2650
                                                                         dashed black lines). Similarly, Fig. 8b depicts the areas where
 (eastern cordillera and Lower Magdalena Basin)                          extended Proto-Caribbean crust has been reported in the
 High-density body upper continental crust                       3000    Colombian and the Venezuelan basins (black lines, numbers
 (Santa Marta Massif)                                                    1 and 2). Note the relation between these extended domains
 Continental lower crust                                        3070
                                                                         and the thin (< 1 km) or almost non-existent crust present in
 High-density subcrustal bodies down to 50 km depth             3242
 Mantle down to 50 km                                           3200     the structural model.
 Nazca and Caribbean slabs                                      3163        The continental crust has been split into four different sub-
 Mantle from 50 to 200 km                                  3D density    layers. The continental upper crust (Fig. 8c) has the max-
                                                             solution    imum thickness (up to 35.3 km) and an average density of
                                                                         2750 kg m−3 . Two low-density bodies were defined within
                                                                         this layer in order to improve the gravity fit. These areas in-
   As described in Sect. 3.3 the first two steps of the forward-         clude parts of the Lower Magdalena, Maracaibo, and Fal-
modelling process consisted of including crustal hetero-                 con basins (yellow polygons). Such bodies have an aver-
geneities that aim to fit the gravity field. Figure 7b shows             age density of 2600–2650 kg m−3 . Additionally, one high-
the residuals associated to a model in which the gravity sig-            density body has been integrated into the structure of the
nal of the water, sediments, heterogeneous crystalline crust,            upper continental crust (magenta polygon). It has been mod-
and mantle (deeper than 50 km) were considered. Here, two                elled with an average density of 3000 kg m−3 and is located
positive anomalies remain in the Colombian and Venezue-                  below the Santa Marta massif, bounded by the Oca and the
lan basins. Thus, the third step on the forward-modelling re-            Santa Marta-Bucaramanga faults.
quired the addition of two subcrustal bodies to compensate                  Finally, the lower continental crust has been defined as a
the gravity misfit in these domains. These bodies are located            complete unit, with an average density of 3070 kg m−3 and a
between the Moho and 50 km depth and have an average den-                maximum thickness of 31.8 km reached in the southern part
sity of 3242 kg m−3 .                                                    of the eastern cordillera.

https://doi.org/10.5194/se-12-275-2021                                                                Solid Earth, 12, 275–298, 2021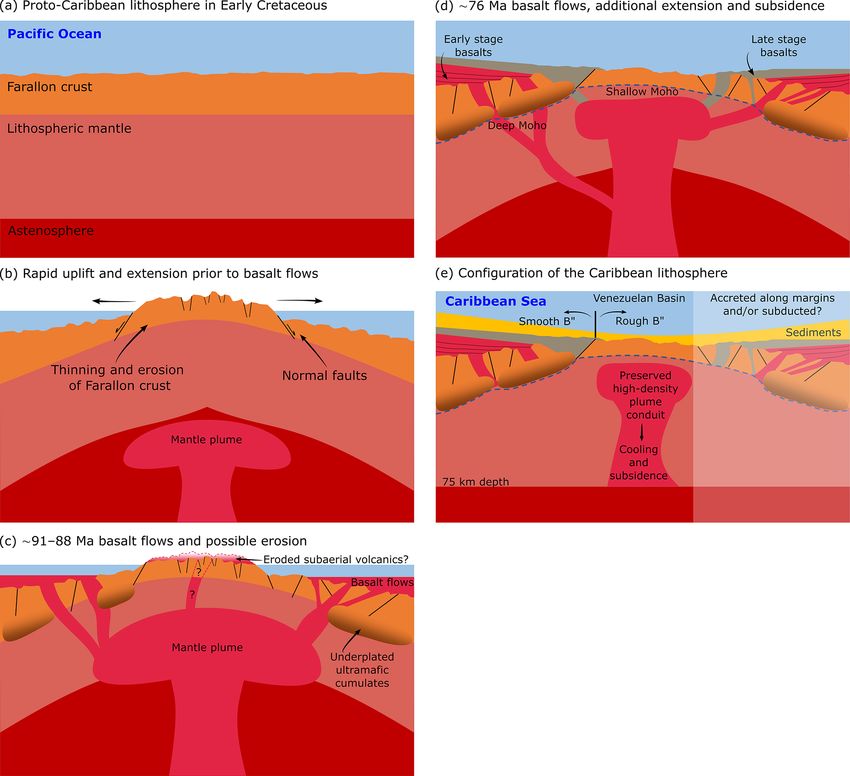
284                                A. M. Gómez-García et al.: The preserved plume of the Caribbean Large Igneous Plateau

Figure 7. Gravity anomalies (Gz) with (a) measurements available in the EIGEN-6C4 dataset at 10 km height (Förste et al., 2014; Ince et al.,
2019). (b) Residuals of a model in which the subcrustal bodies are not included. (c) Gz after forward-modelling the gravity residuals of the
initial lithospheric configuration. The modelling included the definition of crustal and subcrustal bodies (see the text for details). (d) Final
residuals obtained with the lithospheric structure described in Table 2.

Figure 8. Thickness of the (a) oceanic upper crust, (b) oceanic lower crust, (c) continental upper crust, and (d) continental lower crust.
Dashed polygons in (a) represent places where the oceanic crust is thinner than 10 km (Mauffret and Leroy, 1997). Black polygons in (b)
depict areas with smooth basement (B00 horizon), associated with extended Proto-Caribbean crust in the Colombian Basin (Bowland and
Rosencrantz, 1988) (number 1) and in the Venezuelan Basin (Kroehler et al., 2011) (eastward of the black line, number 2). Main continental
faults are shown as thick black lines in (c) and (d). The final lithospheric model includes different high- and low-density bodies in the oceanic
and continental crusts, depicted as magenta and yellow polygons, respectively. Acronyms are the same as in Fig. 1.

Solid Earth, 12, 275–298, 2021                                                                    https://doi.org/10.5194/se-12-275-2021
A. M. Gómez-García et al.: The preserved plume of the Caribbean Large Igneous Plateau                                                    285

                                                                         Figure 10. Two high-density subcrustal bodies are required to fit the
                                                                         gravity field. These bodies have a spatial correlation with the thin
                                                                         crust in the Colombian and the Venezuelan basins. Polygons are as
                                                                         described in Fig. 8. Acronyms are the same as in Fig. 1.

                                                                         a thin crust ranging between ∼ 10 and 20 km (Fig. 9b). In
                                                                         contrast, the crust of the Santa Marta massif has an average
                                                                         density of ∼ 3000 kg m−3 , which is in agreement with a cra-
                                                                         tonic origin with igneous intrusions, as described by Montes
                                                                         et al. (2019a).

                                                                         4.2   Oceanic upper mantle structures
Figure 9. The average density of the crystalline crust obtained after
                                                                         In order to fit the gravity, two subcrustal bodies were ad-
forward-modelling the gravity residuals highlights areas where the
                                                                         ditionally required and integrated into the oceanic upper
high-density material of the C-LIP formation strongly affected the
Proto-Caribbean crust. (a) Average density of the South Caribbean        mantle (< 50 km depth) (Fig. 10). According to the model
and north-western South American crusts based on the forward-            results, these bodies might reach an average density of
modelling of the gravity residuals. The crustal domains summarized       ∼ 3300 kg m−3 if they are placed from the Moho down to
in Table 2 have been included. White domains represent areas were        25 km depth (see Fig. S6). Alternatively, an average den-
the thickness of the oceanic crust is virtually zero, according to the   sity of 3242 kg m−3 is required if they extend down to 50 km
integrated datasets. (b) Thickness of the crystalline crust used in      depth. Due to the fact that a similar high-velocity trend – that
the data-integrative 3D model (see Sect. 3.1). Magenta polygons are      would convert to comparable densities – can be followed in
contours of 200 m thickness. Other polygons as depicted in Fig. 10.      the tomographic data integrated into the lithospheric model,
Acronyms are the same as in Fig. 1.                                      down to 75 km depth, the last scenario is selected hereafter as
                                                                         the final lithospheric configuration. These high-density bod-
                                                                         ies spatially correlate with the areas of thin crust according
   Assuming this new lithospheric configuration, the average             to Mauffret and Leroy (1997) (dashed lines in Fig. 10) but
crustal density highlights high- and low-density domains that            also include the regions where original Proto-Caribbean crust
correspond with thin and thick crystalline crust, respectively           has been identified by Bowland and Rosencrantz (1988) in
(Fig. 9). In general, it is possible to recognize that lighter           the Colombian Basin and by Kroehler et al. (2011) in the
crust (Fig. 9a) is associated with the continental domains, as           Venezuelan Basin (black lines in Fig. 10 – number 1 and 2,
well as with portions of the oceanic arc-like Nicaraguan Rise            respectively). Thus, the high-density bodies are placed in ar-
(Lewis et al., 2011), and the extinct arc of the Aves Ridge              eas where the already shallow crust–mantle boundary is in-
(Christeson et al., 2008). On the other hand, the highest den-           sufficient to account for the excess mass needed to fit the
sities are concentrated in the Colombian and the Venezue-                observed gravity.
lan basins. Two regions where the calculated thickness of the               A summary of the final lithospheric structural and density
oceanic crust is “virtually zero” are depicted as white areas            model is presented in Table 2. As mentioned in Sect. 3.3,
in Fig. 9a and as magenta polygons in Fig. 9b and will be                the gravity inversion was focused on improving the struc-
discussed in Sect. 5.2.                                                  tural resolution for the oceanic and continental crust and the
   Within the continental domain, two low-density regions                uppermost oceanic mantle; therefore, the remaining litho-
(< 2700 kg m−3 ) are inferred based on the model results:                spheric layers were preserved as in the initial (reference)
the Lower Magdalena Valley Basin, whose basement has                     model.
been described as mainly felsic (Mora-Bohórquez et al.,
2017), as well as parts of the Falcon and Maracaibo fore-
land basins. These continental basins are characterized by

https://doi.org/10.5194/se-12-275-2021                                                                   Solid Earth, 12, 275–298, 2021
286 A. M. Gómez-García et al.: The preserved plume of the Caribbean Large Igneous Plateau
5 Discussion Nevertheless, it is necessary to point out that the density
of these subcrustal domains might not necessarily be exactly
The gravity response of a 3D lithospheric-scale model of 3242 kg m−3 . In fact, if their vertical extension is assumed
the Caribbean and northern South American plates – in- from the Moho down to 25 km depth, the density required to
cluding up-to-date geophysical information – provides ad- fit the gravity increases to 3300 kg m−3 , resulting in similar
ditional constrains regarding density heterogeneities in the gravity residuals (see Fig. S6) to the ones shown in Fig. 7d.
lithosphere. Although a heterogeneous crust was integrated This illustrates the range of non-uniqueness inherent to grav-
into the model in order to reduce the misfits between mod- ity modelling but also clearly demonstrates that the need for
elled and observed gravity, two large positive residuals in an excess of mass in these domains is robust.
the oceanic domain (Fig. 7b) suggest additional density het- In both scenarios, the subcrustal bodies might have seis-
erogeneities in the oceanic upper mantle (< 50 km depth), mic velocities similar to that of a normal mantle, making
which was initially modelled with a constant density. Our ap- their interpretation as mantle plume-related bodies difficult,
proach indicates that the results of the gravity inversion are especially in the context of early seismic experiments carried
beyond the non-uniqueness of gravity because (1) the (het- out in the past. For example, Mauffret and Leroy (1997) in-
erogeneous) crustal densities cannot be further increased, (2) terpreted seismic velocities of 8.1 km s−1 as normal mantle
a sensitivity analysis to different mantle distributions was ini- velocities, based on isolated sonobuoy measurements both in
tially performed (Sect. S1), and (3) a high-density trend is the Colombian and the Venezuelan basins (see Fig. 22a in
also evidenced in the tomographic data down to 75 km depth their publication).
in the Caribbean region. The presence of shallow subcrustal bodies has been iden-
In the following subsections, the implications of the high- tified for different plateaus and regions where plume interac-
density upper-mantle bodies are discussed, as possible plume tion with old crust is inferred (see McNutt and Caress, 2007).
conduits of the C-LIP currently preserved in the Caribbean Some examples include a 4 km thick and 200 km wide sub-
upper mantle (Sect. 5.1). Additionally, different kinematic crustal body found in the Hawaiian–Emperor seamount chain
reconstructions back to 90 Ma were explored to evaluate by Watts et al. (1985). According to their interpretation,
the hypothesis that the C-LIP formed above the Galápagos this body has unusually high seismic velocities for a nor-
hotspot. Remaining implications of the general crustal con- mal lower oceanic crust, ranging between 7.4 and 7.8 km s−1 .
figuration are tackled in Sect. 5.2. More recently, Deng et al. (2014) reconstructed a preserved,
lithospheric-scale magmatic intrusion associated with the
5.1 High-density mantle trend: preserved material of evolution of the Emeishan Large Igneous Province down to
the C-LIP plume? 120 km depth.
In the Caribbean region, underplated material associated
In the Caribbean oceanic upper mantle, two high-velocity with picritic and ultramafic cumulates with seismic veloci-
(and therefore high-density) domains can be followed, at ties of up to 8 km s−1 have been previously identified (e.g.
least down to 75 km depth, according to the S-wave tomo- Driscoll and Diebold, 1999; Mauffret and Leroy, 1997).
graphic model of Schaeffer and Lebedev (2013) (Figs. 4, S3 However, the high-density (and thus high-velocity) mate-
and S4) that has been integrated in the initial (reference) rial as represented in Fig. 11 was never mapped before with
density model of the Caribbean. After forward-modelling such detail and to points so deep beneath the Colombian and
the gravity residuals to identify density heterogeneities in Venezuela basins. In the presence of a mantle plume, intru-
the crystalline crust, the residuals were still large enough to sion of high-density material on the overriding plate is ex-
call for density variations on the uppermost oceanic mantle pected. When the plume ceases, the new lithospheric sys-
(< 50 km depth), which was initially modelled with a con- tem starts to cool down, and therefore high-density bodies
stant density of 3200 kg m−3 (Table 1). Accordingly, the re- can “freeze” (François et al., 2018) and become part of the
sults suggest that two subcrustal bodies with positive density mobile lithosphere that moves over the hot asthenospheric
anomalies are present from the Moho down to 50 km depth. mantle, as expected by the plate tectonics theory. Therefore,
These bodies spatially correspond with a fast velocity mantle we interpret these subcrustal bodies as preserved magmatic
trend observed in the tomographic data (Fig. 11). plume material responsible for the C-LIP formation.
Assuming the thickness and spatial distribution shown in Figure 11 shows a 3D perspective view of the preserved
Fig. 10, an average density of ∼ 3242 kg m−3 is required to fit plume material assuming an S-wave velocity of 4540 m s−1
the gravity field. These bodies, approximately 440 km wide, as the boundary of the high-density domains. The veloc-
show a strong spatial correlation with the thinner crust of ity contours at depths of 25, 50, and 75 km were taken as
Mauffret and Leroy (1997) (dashed black polygons) and also main constraints, and the form of the body in between was
with the stretched original Proto-Caribbean crust reported by obtained by morphing of these contours following Brunet
Bowland and Rosencrantz (1988) in the Colombian Basin (2020) and Brunet and Sills (2015). A total volume of ∼ 12×
(number 1) and by Kroehler et al. (2011) in the Venezuelan 106 km3 is calculated for what is interpreted as the C-LIP
Basin (eastward of the black line, number 2). fossil plume conduits. Figure S7 shows the vertical relation
Solid Earth, 12, 275–298, 2021 https://doi.org/10.5194/se-12-275-2021A. M. Gómez-García et al.: The preserved plume of the Caribbean Large Igneous Plateau 287
Figure 11. A 3D visualization of the interpreted preserved plume conduits, assuming an S-wave velocity of 4540 m s−1 as the boundary of
the high-density material.
between the subcrustal bodies (if a density of 3242 kg m−3 poles from Doubrovine et al. (2012) (global moving refer-
is assumed for them) and the high-density trend at each ence model) for the motion of the Pacific and African plates.
depth of the tomographic model. The presence of this high- However, shortly afterwards Boschman et al. (2014) pub-
density trend down to 75 km depth suggests that it travelled lished an updated kinematic reconstruction of the Caribbean
with the mobile Caribbean lithosphere. Accordingly, Blanco region based on an extensive compilation of geological data
et al. (2017) reported the lithosphere–asthenosphere bound- from the entire region, which shows a very different mo-
ary in the Caribbean region around 75–80 km depth. tion path of the Caribbean plateau relative to South America
Recently, Civiero et al. (2019) used Rayleigh–Taylor mod- (cyan line in Fig. 12) than the model of Nerlich et al. (2014)
els to simulate the 3D mantle convection for Newtonian and (green line). A clear offset of the plateau to the east of the
non-Newtonian rheologies. Their results predict the develop- modern Galápagos hotspot at the time of C-LIP formation
ment of plumelets in different stages of evolution, creating a (90 Ma) is observed in the model of Boschman et al. (2014),
complex structure that is sometimes difficult to image using as previously reported by other authors (e.g. Pindell et al.,
seismic waves. Thus, the observed positive density anomalies 2006). More recently, Montes et al. (2019a) reconstructed
in the Caribbean lithospheric mantle might be related with the tectonic evolution of the northern Andes-Caribbean mar-
the fossil plume conduits of these type of Rayleigh–Taylor- gin and showed similar results to Boschman et al. (2014)
style instabilities, similar to the ones observed in the northern (magenta line in Fig. 12), although a considerable differ-
East African Rift by Civiero et al. (2019). ence in motion and rotation of the C-LIP between 90 and
60 Ma is evident. This difference is due to the fact the
5.2 Kinematic reconstructions of the Caribbean Montes et al. (2019a) reconstructions are based on tectonic
plateau and origin of the C-LIP units in Panama and north-western Andes terrains, while the
Caribbean plate moves, bends, and deforms internally to fit
those inland proxies.
Previous studies based on geochemical analyses of C-LIP-
Most importantly, the absolute motion of the lithospheric
related magmatic rocks have proposed the present-day Galá-
plates relative to the Earth’s deep interior is crucial to
pagos hotspot as the origin of the thermal anomaly respon-
assess whether the C-LIP formed above the Galápagos
sible for the development of the C-LIP (e.g. Duncan and
hotspot 90 Ma ago or not. Several absolute reference mod-
Hargraves, 1984; Geldmacher et al., 2003; Kerr and Tarney,
els have been proposed over the last few decades, e.g.
2005; Pindell and Barrett, 1990; Thompson et al., 2004).
the moving Indian–Atlantic hotspots model (O’Neill et al.,
From a kinematic perspective, Nerlich et al. (2014) obtained
2005), the fixed Pacific hotspots model (e.g. Wessel and
a good fit between the paleo-position of the Caribbean plate
Kroenke, 2008), the true polar wander-corrected paleo-
and the present-day position of the Galápagos hotspot at the
magnetic model (Steinberger and Torsvik, 2008), the sub-
time of plateau formation (ca. 90 Ma). In their approach,
duction reference frame linking surface plate motions to sub-
the Caribbean plateau is assumed to have detached from
ducted slab remnants mapped from seismic tomography (Van
the Farallon plate and to be fixed relative to South America
Der Meer et al., 2010), and the global hotspot moving model
at 54.5 Ma (“docking” age), while using the finite-rotation
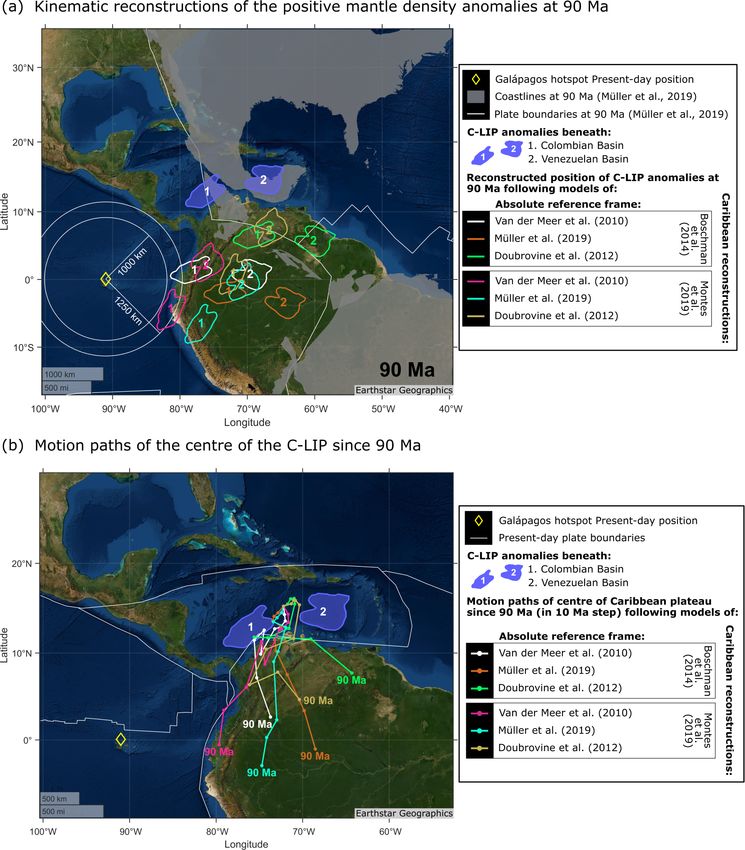
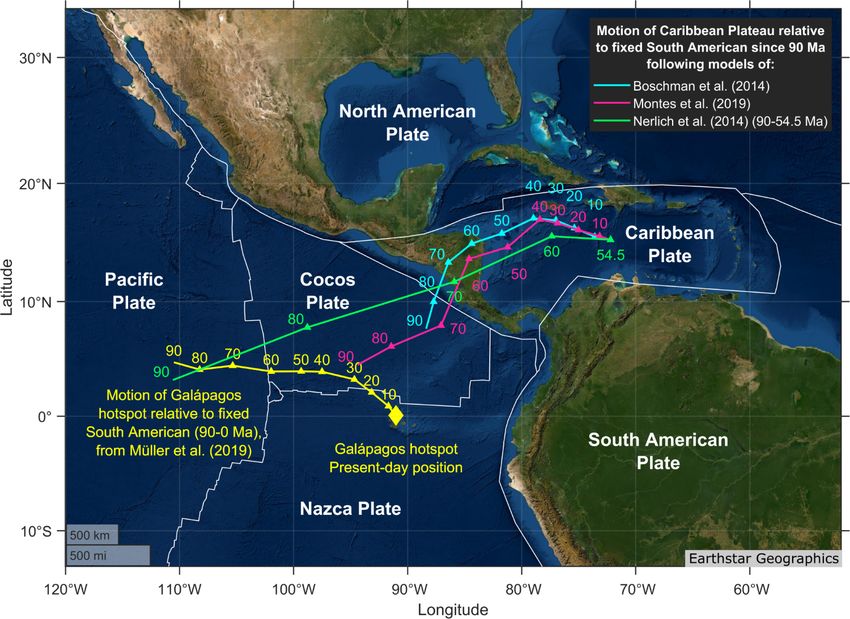
https://doi.org/10.5194/se-12-275-2021 Solid Earth, 12, 275–298, 2021288 A. M. Gómez-García et al.: The preserved plume of the Caribbean Large Igneous Plateau Figure 12. Motion paths of the Caribbean plate relative to the South American plate (SAM) for three recently proposed reconstructions. Motion of present-day Galápagos hotspot relative to a fixed SAM is shown in yellow. A fit with Galápagos hotspot at time of plateau formation (90 Ma) is only obtained by Nerlich et al. (2014), assuming the Caribbean plate moving with Farallon plate from 90 to 54.5 Ma and fixed to SAM since 54.5 Ma. Regional reconstructions based on geological and geophysical datasets from the entire Caribbean region (Boschman et al., 2014) and the north-western Andes (Montes et al., 2019a, b), however, show very different motion paths for the Caribbean plate relative to SAM and a clear offset with the Galápagos hotspot at 90 Ma. (Doubrovine et al., 2012). However, the geodynamic consis- most recent “optimized global reference model” of Müller tency of those models has been recently questioned, as they et al. (2019), as summarized in Table 3. The rotation files yield unreasonable velocities of slab advance and retreat and of all tested models are available as Supplement in Gómez- of global net rotation of the lithospheric plates (Müller et al., García et al. (2020) (see the data availability section below). 2016; Schellart et al., 2008; Williams et al., 2015). Tetley Figure 13a presents the results of the different kinematic et al. (2019) developed a data-optimized global absolute ref- reconstructions back to 90 Ma, using the polygons of the sub- erence frame back to the Triassic that includes global hotspot crustal bodies in the Colombian and the Venezuelan basins track observations and estimates of net lithospheric rotation (number 1 and 2, respectively). Here, white circles represent and paleo-trench migration. This geodynamically consistent the plausible diameter of the plume head: 2000 km (Camp- absolute plate model is implemented in the latest global plate bell, 2005) and 2500 km (Mauffret et al., 2001). Addition- motion model of Müller et al. (2019), which also includes the ally, Fig. 13b depicts the motion paths of the centre of the detailed regional reconstructions of Boschman et al. (2014) Caribbean plateau since 90 Ma in absolute reference frame. for the Caribbean region, and thus corresponds to our “se- In both figures, the present location of the Galápagos hotspot lected model” in the discussion below. is represented by a yellow diamond at 0◦ N, 91◦ W (Nolet In this section, we aim to re-evaluate the hypothesis that et al., 2019). The main outcome of these reconstructions is the C-LIP (and interpreted preserved plume conduits) formed the clear offset between the C-LIP and the location of the above the Galápagos hotspot by testing six different plate hotspot at time of plateau formation (90 Ma) for all models, motion configurations using the GPlates software (Müller as previously reported by Boschman et al. (2014). In our se- et al., 2018). We used the recently published regional plate lected model (Müller et al., 2019), the C-LIP centre was lo- kinematic models of Boschman et al. (2014) and Montes cated ca. 2500 km to the east of the present-day Galápagos et al. (2019a), for which the rotation files are available, and hotspot 90 Ma ago. three different absolute reference frames, i.e. the “subduction To evaluate the reasons behind this misfit, three possible reference model” of Van Der Meer et al. (2010), the “Global sources of error should be discussed. Moving Hotspot model” of Doubrovine et al. (2012), and the Solid Earth, 12, 275–298, 2021 https://doi.org/10.5194/se-12-275-2021
You can also read