Health Impacts of Air Pollution in Canada - Estimates of premature deaths and nonfatal outcomes - HealthyDesign.city
←
→
Page content transcription
If your browser does not render page correctly, please read the page content below
Health Impacts of Air Pollution
in Canada
Estimates of premature deaths and
nonfatal outcomes
2021 Report
Health Canada is the federal department responsible for helping the people of Canada maintain and improve
their health. We assess the safety of drugs and many consumer products, help improve the safety of food, and
provide information to Canadians to help them make healthy decisions. We provide health services to First Nations
people and to Inuit communities. We work with the provinces to ensure our health care system serves the needs of
Canadians.

Également disponible en français sous le titre :
Les impacts sur la santé de la pollution de l'air au Canada - Estimation des décès prématurés et de la morbidité –
Rapport 2021

To obtain additional information, please contact:

Health Canada
Address Locator 0900C2
Ottawa, ON K1A 0K9
Toll-free: 1-833-223-1014
Fax: 613-941-5366
TTY: 1-800-465-7735
Email: hc.air.sc@canada.ca

This publication can be made available in alternative formats upon request.
© Her Majesty the Queen in Right of Canada, as represented by the Minister of Health, 2021
Publication date: March 2021

This publication may be reproduced for personal or internal use only, without permission, provided the source is fully
acknowledged.

Cat.: H144-51/2021E-PDF
ISBN: 978-0-660-37331-7
Pub: 200423

                 HEALTH IMPACTS OF AIR POLLUTION IN CANADA: ESTIMATES OF PREMATURE DEATHS AND NONFATAL OUTCOMES |        2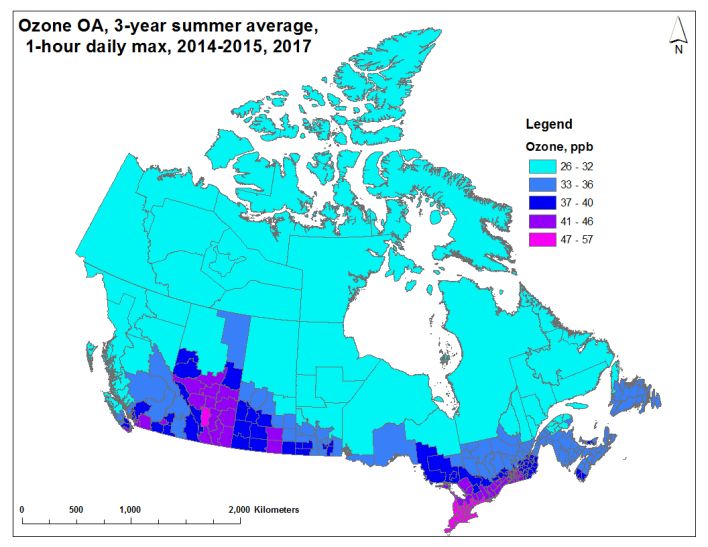
Table of contents
Summary ......................................................................................................................................... 4
1. Introduction ............................................................................................................................. 6
2. Methods ................................................................................................................................... 7
   2.1 Pollutants included in the estimate .................................................................................................... 7
   2.2 Estimating population exposures to above-background air pollution................................................ 7
   2.3 Estimating premature deaths and nonfatal outcomes from air pollution ........................................ 11
   2.4 Estimating the economic value of health outcomes from air pollution ........................................... 15
3. Results ....................................................................................................................................... 17
4. Discussion.................................................................................................................................. 20
   4.1 Sensitivity analysis............................................................................................................................. 23
   4.2 Uncertainties and limitations ............................................................................................................ 23
5. Conclusions ............................................................................................................................... 26
6. References ................................................................................................................................ 27
Appendix A. Information on air emissions levels and sources associated with ambient
concentrations of PM2.5, ozone and NO2 in Canada ..................................................................... 32
   Particulate matter ................................................................................................................................... 32
   Ground-level ozone ................................................................................................................................. 34
   Nitrogen dioxide...................................................................................................................................... 35
   Volatile organic compounds ................................................................................................................... 36
   References............................................................................................................................................... 37
Appendix B. NO2, ozone and PM2.5 concentration-response functions in AQBAT version 3.0 .... 39
   References............................................................................................................................................... 49
Appendix C. Baseline incidence rates for key health endpoints by geographic area, in annual
events per million population – 2011 estimates included in AQBAT version 3.0 ........................ 51
Appendix D. Additional air pollution and health impact estimates ............................................. 52

                      HEALTH IMPACTS OF AIR POLLUTION IN CANADA: ESTIMATES OF PREMATURE DEATHS AND NONFATAL OUTCOMES |                                            3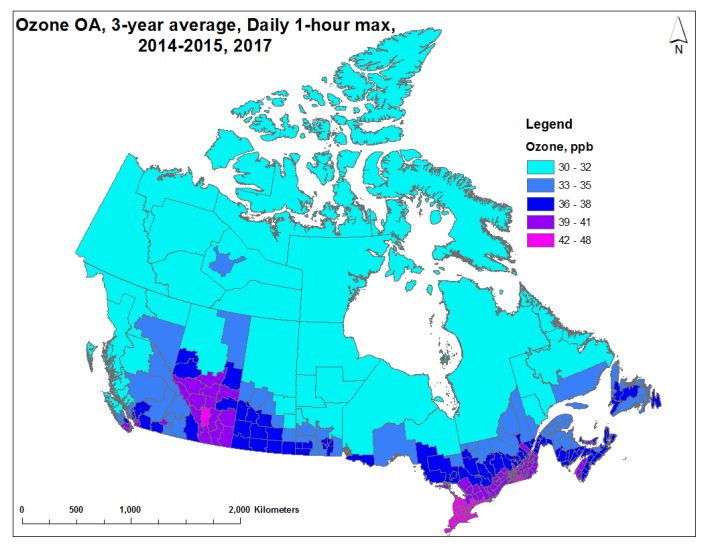
Summary
A large body of scientific evidence has accumulated over the past 25 years attributing a wide range of
adverse health effects to ambient (outdoor) air pollution exposure. These effects range in severity from
respiratory symptoms to the development of disease and premature death. Significant advances in the health
and atmospheric sciences over the last two decades have also made it possible to estimate the number of
deaths and illnesses associated with air pollution. In Canada and internationally, health impact assessments
identify air pollution as one of the largest risk factors for premature death and disability.
In this report, air pollution is defined as pollutants that scientific studies have associated with wide-ranging
health effects and to which the population is ubiquitously exposed in the outdoor environment. These
pollutants include fine particulate matter (PM2.5), ground-level ozone, and nitrogen dioxide (NO2). This is an
update to previous health impacts of air pollution reports published by Health Canada. It relies on data and
scientific knowledge, including ambient air pollution exposure estimates and demographic data from 2014 to
2017. The approach for quantitatively estimating the population health impacts of air pollution is well
established by international health science organizations. In alignment with established approaches, Health
Canada estimated 1) exposures to ambient air pollution across Canada, 2) the associated adverse health
impacts in the population and 3) the corresponding economic costs of these health impacts. This analysis
accounts for national demographics, including population counts, age profiles and baseline health status.
Health impacts are presented nationally, as well as by province and territory (using 2016 population data).
This report considers Canadians’ exposure to above-background levels. Above-background levels correspond
to the difference between ambient concentrations and background concentrations. Background
concentrations are equivalent to minimum ambient air pollution levels, such as those present in remote
areas uninfluenced by human activity. The above-background air pollution is comprised mostly of human-
source (anthropogenic) emissions, but it also includes emissions from natural events such as forest fires.
Exposure to air pollutants in indoor environments was not considered. The focus on above-background air
pollution is relevant to air quality management in Canada because policies and regulations to improve air
quality generally target anthropogenic emissions. The national average exposure to above-background air
pollution estimates were 4.3 µg/m3 for PM2.5, 7.2 ppb for NO2, 13.2 ppb for annual ozone and 14.4 ppb for
summer ozone. These averages are population-weighted to account for the geographic distribution of the
Canadian population.
Health Canada estimates that above-background air pollution, including air pollution from human sources in
North America, contributes to 15,300 premature deaths per year in Canada.1 This includes an estimated
6,600 premature deaths in Ontario, 4,000 in Quebec, 1,900 in British Columbia and 1,400 in Alberta. National
morbidity or nonfatal health outcomes include 2.7 million asthma symptom days and 35 million acute
respiratory symptom days per year, with the total economic cost of all health impacts attributable to air
pollution for the year being $120 billion (2016 CAD). This is equivalent to approximately 6% of Canada’s 2016
real gross domestic product.
The mortality estimates reported in this assessment are based on risk information from epidemiological
studies deemed to be the most relevant to Canada. The mortality endpoints include all-cause mortality2
associated with long-term exposure to ambient PM2.5, and short-term exposure to NO2 and annual ozone, as
well as respiratory mortality associated with long-term exposure to warm-season ozone. All risk information
contributing to Health Canada’s mortality estimates was derived from Canadian cohort and time-series
studies, with the exception of chronic exposure respiratory mortality associated with ozone that was derived
from an American cohort. In the context of this analysis, short-term exposure is related to effects that occur a
few days after an elevation in ambient air pollution (i.e. acute health effects), while long-term exposure
refers to exposures averaged over the years preceding the development of disease or death (i.e. chronic
health effects).

1   The reference year for the health impact estimates is 2016 and corresponds with the population data considered for analysis.
2   All-cause nonaccidental mortality

                     HEALTH IMPACTS OF AIR POLLUTION IN CANADA: ESTIMATES OF PREMATURE DEATHS AND NONFATAL OUTCOMES |              4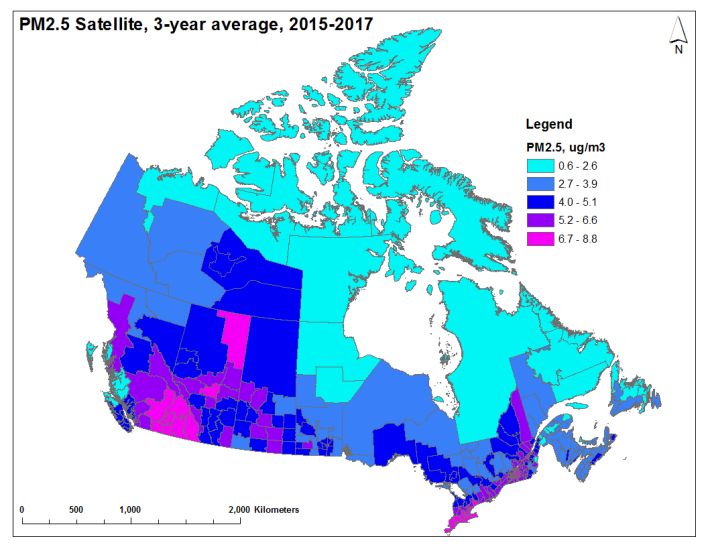
In addition to the effects of changes in air pollution exposure over time, population growth also influences
the overall health burden of air pollution, leading to a greater number of exposed individuals and resulting in
an overall net increase in premature deaths attributable to air pollution. These variations in population can
be standardized by presenting the death rates per 100,000 population. The current estimate of 15,300
premature deaths is equivalent to 42 premature deaths per 100,000 Canadians. Health Canada estimated, in
2017, 14,400 premature deaths per year, and, in 2019, 14,600 premature deaths per year, which were
equivalent to 41–42 deaths per 100,000 Canadians.3
In this analysis, the air pollution-associated premature death and nonfatal effect counts are based on
exposure to ambient concentrations of PM2.5, NO2 and ozone exclusively. These pollutants are included
because there is robust epidemiological evidence of their adverse health impacts as well as the ability to
accurately estimate the spatial distribution of their ambient concentrations across Canada. However, owing
to data limitations and knowledge gaps, not all health effects that have been associated with exposure to
PM2.5, NO2 and ozone in the scientific literature can currently be quantified. Further, there are other air
contaminants that contribute to air pollution health impacts, but they are beyond the scope of this work. The
quantitative estimates of population health effects provided in this report are therefore assumed to
underestimate the full impact of exposure to air pollution in Canada. Overall, this analysis indicates that
despite the relatively low levels of air pollutants in Canada compared to other regions of the world, air
pollution continues to impact population health.

3The population reference year was 2011 for the Health Canada report published in 2017, 2015 for the report published in
2019, and 2016 for the current analysis.

                  HEALTH IMPACTS OF AIR POLLUTION IN CANADA: ESTIMATES OF PREMATURE DEATHS AND NONFATAL OUTCOMES |         5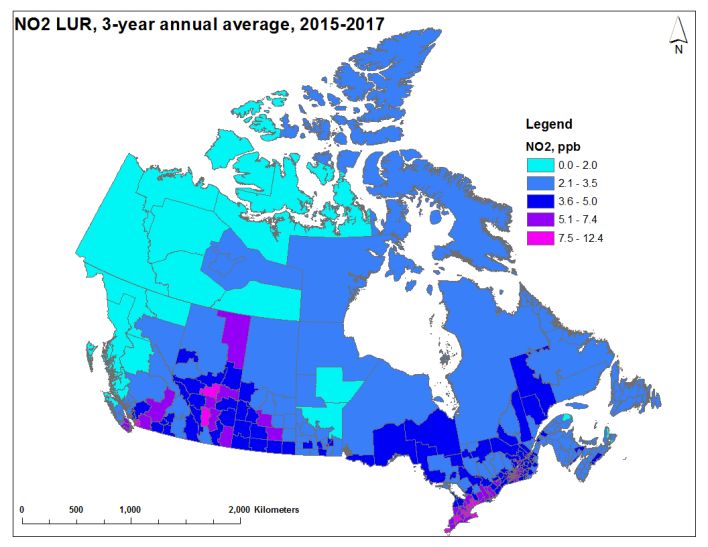
1. Introduction
Air pollution is recognized globally as a major contributor to the development of disease and premature
death and represents the largest environmental risk factor to human health (WHO 2016). Exposure to air
pollution increases the risk of premature mortality from heart disease, stroke and lung cancer.4 The health
and atmospheric sciences have advanced significantly in the past two decades, making it possible to estimate
the number of deaths and illnesses associated with air pollution. These values are estimated using
information from the peer-reviewed scientific literature, which relates population-level pollution exposure
(both short-term and long-term) to the risk of adverse health outcomes, including premature death and
hospital visits. The quantitative relationship between exposure and increased risk of adverse health
outcomes is referred to as the concentration-response function (CRF). Estimates of air pollution-attributable
deaths and other adverse health outcomes have been developed globally and for many individual countries,
including by Cohen et al. (2017), the Institute for Health Metrics and Evaluation (IHME) and the Health Effects
Institute (HEI) (2018), and the World Health Organization (WHO) (2016).
According to the Global Burden of Disease (GBD) project, air pollution is the fifth leading mortality risk in the
world and was responsible for 8.7% of deaths globally in 2017 (or 4.9 million premature deaths worldwide)
(IHME and HEI 2019). Internationally, Canada is among the top 10 countries with the lowest national PM2.5
exposure levels (IHME and HEI 2019). According to the GBD analyses, air pollution ranks as the 11th largest
risk factor overall for premature death and disability in Canada, and is the top environmental risk.5
Estimates of air pollution-attributable mortality in Canada have previously been developed by Health Canada
(2017, 2019), Stieb et al. (2015), the Canadian Medical Association (2008), and as part of the GBD project.6
The previous edition of this report (Health Canada 2019) estimated that 14,600 premature deaths were
associated with ambient air pollution exposure in 2015. In this context, air pollution is defined as pollutants
that scientific studies have associated with wide-ranging health effects and to which the population is
ubiquitously exposed. These pollutants include PM2.5, ground-level ozone, and NO2. While both sulphur
dioxide and carbon monoxide are also ubiquitous in Canada and have also been associated with such effects
in some studies, they appear to have far less important impact than the three pollutants listed above.
Estimates of air pollution-attributable fatal and nonfatal outcomes are expected to change over time as a
result of our improving understanding of the relationship between exposure and risk and the spatial
representation of air pollution exposure. For example, new scientific information may support or confirm the
inclusion of additional causes of death associated with air pollution. In addition, new air pollution exposure
data and modelling tools provide more accurate air pollution level estimates with improved spatial and
temporal resolution for all regions of Canada. Changes in population health and demographics, including the
aging population, will influence the number of health outcomes attributable to air pollution exposure.
The objective of this analysis is to draw on the most recent data and scientific knowledge to provide
comprehensive and up-to-date estimates of morbidity and mortality outcomes in Canada related to ambient
levels of PM2.5, ozone and NO2. These pollutants were included because there is robust epidemiological
evidence of their adverse health impacts as well as the ability to accurately estimate the spatial distribution
of their ambient concentrations across Canada. Estimates are provided at the national, provincial and
territorial levels. In addition, an economic valuation of health impacts is presented. The methods described
here are considered to be comprehensive and appropriate for the Canadian context. Exposure to air
pollutants in indoor environments was not considered.

4 It must be noted that multiple risk factors are involved in the development or worsening of adverse health effects. While air
pollution can contribute to increased risk of population health impacts, this does not necessarily imply that air pollution is the
sole cause. Exposure to air pollution is a contributing risk factor to the development of adverse health effects.
5 Institute for Health Metrics and Evaluation (IHME). GBD Country profiles – 2017. http://www.healthdata.org/canada

(accessed December 12, 2019)
6 Ibid.

                   HEALTH IMPACTS OF AIR POLLUTION IN CANADA: ESTIMATES OF PREMATURE DEATHS AND NONFATAL OUTCOMES |                  6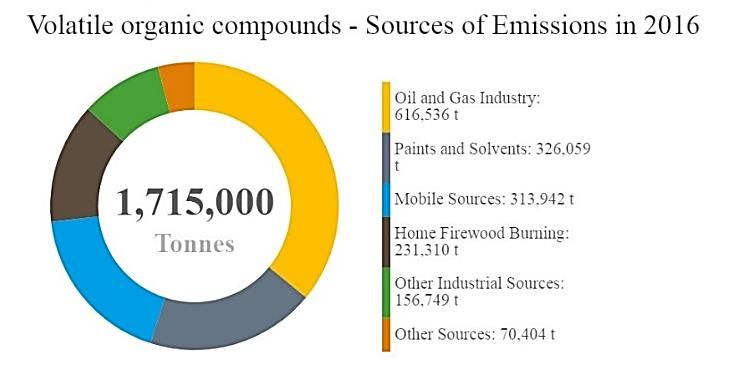
2. Methods
2.1 Pollutants included in the estimate
This analysis of air pollution health impacts in Canada focuses on PM2.5, NO2, and ozone. Emissions from local,
regional, national and international sources directly (primary emissions) and indirectly (secondary formation)
contribute to the presence of these pollutants in the country’s ambient air. Fuel combustion, including from
mobile (e.g. on-road vehicles and off-road equipment) and power generation (e.g. coal or natural gas)
sources, directly releases particles and nitrogen oxides (NOx) into the air. In addition, combustion emits a
suite of organic and inorganic compounds that contribute to secondary PM2.5 and ozone. Ozone is not
emitted directly, but formed from precursors such as NOx and volatile organic compounds (VOCs) via
secondary reactions in the atmosphere and reactions with sunlight. Health Canada and other international
agencies have concluded that PM2.5, NO2 and ozone cause or are likely to cause premature mortality based
on extensive evidence from epidemiological studies (e.g. Health Canada 2013, 2016; US EPA 2019). These
three pollutants also account for the majority of population health impacts from air pollution. There is robust
scientific evidence of health effects at very low concentrations of these pollutants, and no evidence of an
exposure threshold in the population. In other words, any incremental increase in air pollutant concentration
is associated with an increased risk of adverse health outcomes. General information on emissions and
ambient concentrations of NO2, ozone, and PM2.5 in Canada as well as the associated adverse health effects
are presented in Appendix A.

2.2 Estimating population exposures to above-background air pollution
The current analysis estimates the mortality and morbidity outcomes associated with ambient air pollution
corresponding to above-background levels. While most of the above-background increment is linked to
human source (anthropogenic) emissions originating from North America, natural emissions are also
included, notably from wildfires. Health impacts associated with “background” pollutant concentrations
(which include emissions from other natural sources and sources beyond North America) were not included.7
This measurement of above-background air pollution is relevant to air quality management in Canada, as
policies and regulations generally target anthropogenic emissions to improve air quality. High-resolution
estimates of ambient concentrations of PM2.5, NO2, and ozone were used to estimate population-level
exposures across Canada. These estimates, which are presented graphically in Figures 1–3, were generated
using a combination of ground-level measurements, satellite data, geographic and land-use information, as
well as computer model simulations. Background concentrations were then subtracted to obtain the
exposure data included in this analysis.
2.2.1 Background concentrations of air pollution
Background concentrations of PM2.5, NO2 and ozone were estimated in collaboration with Environment and
Climate Change Canada (Judek et al. 2004). This complex initiative involved a combination of qualitative (i.e.
expert judgment) and quantitative (i.e. data-driven) approaches to evaluate concentration measurements at
rural and remote monitoring sites. Background concentrations were estimated using either one of the
following methods:
    1. The data from rural and remote monitoring sites were separated into sectors of different air mass
       origin, and the background concentrations were selected as the monthly or annual average
       concentrations for the sectors containing no major anthropogenic sources; or

7Although some authors make a distinction between baseline (natural and long-range air pollution contributions) and
background (natural contributions only) conditions (TFHTAP 2010), the term “background” is used herein to represent all
contributions other than those from North American anthropogenic sources or large natural events such as forest fires. This is
comparable to the term “North American Background” (formerly “policy relevant background”) used by the United States
Environmental Protection Agency (CRS 2019).

                  HEALTH IMPACTS OF AIR POLLUTION IN CANADA: ESTIMATES OF PREMATURE DEATHS AND NONFATAL OUTCOMES |               7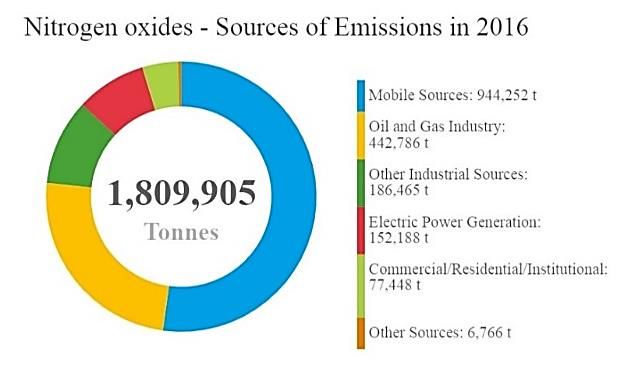
2. Many years of rural and remote measurement data were plotted in a time series allowing a
       qualitative selection of the lowest values that are considered to be the most representative of
       background air masses.
This resulted in annual average background concentrations for NO2 and PM2.5. A set of monthly-average
background concentrations were derived for ozone, for which the ambient concentrations have a strongly
seasonal cycle. These monthly averages were then combined into summer and annual average
concentrations to be consistent with those used to quantify health risks. Regional differences in background
concentrations are likely, but for the purposes of this analysis, a single background concentration was applied
across Canada for each pollutant.8 The estimated background concentrations for Canada are as follows:
    o    1.8 micrograms per cubic metre (µg/m3) for PM2.5 (annual average).
    o    0.15 parts per billion by volume (ppb) for NO2 (annual average).
    o    26 ppb for annual ozone (annual average of daily 1-h maximum) and 28 ppb for summer ozone
         (May–September average of daily 1-h maximum).

2.2.2 Above-background air pollution
To estimate the population health impacts attributable to above background air pollution, it is necessary to
calculate the above-background air pollution increment. Air pollution levels are known to vary geographically
and can be estimated using a combination of observed and simulated concentrations. Routine ground-level
air pollution monitoring in Canada occurs at discrete monitoring stations across the country, which limits the
geographic coverage of air pollution exposure estimates that rely solely on direct measurements. For this
assessment, we relied on spatially resolved estimates of ambient air pollution levels (including both
anthropogenic and natural sources, and non–North American contributions) for PM2.5, NO2 and ozone,
produced through a combination of data sources, including ambient monitoring, as described below. In
contrast, a single background concentration for each pollutant was developed and was assumed to apply
across Canada (as described in the previous section).
2.2.3 Assignment of concentrations to populations
Air pollution concentration estimates for NO2, PM2.5 and ozone were generated and mapped to the Canadian
population (using the 2011 census, with population counts for 2016). Ambient concentrations were averaged
over three years of available data (between 2014 and 2017) to ensure that results were not influenced by any
interannual variations in concentrations. Abnormal weather patterns and air pollution events, including
wildfires and stay-at-home orders, are possible causes of interannual variations (Griffin et al. 2020; Matz et
al. 2020; Zangari et al. 2020). Air pollution concentrations were estimated for up to 293 census divisions
(CDs).9 Figures 1 to 3 present maps of population-weighted ambient air pollutant concentrations for annual
average PM2.5, annual 1-h daily maximum ozone, summer 1-h daily maximum ozone (i.e. May–September),
and annual average NO2. The data displayed in these maps represent the estimated distribution of ambient
air concentrations from all natural and anthropogenic sources. Canadian background concentrations were
then subtracted to estimate exposures to above-background ambient air pollution concentrations. The
methods used to estimate air pollutant levels are detailed in the following subsections.
2.2.3.1 Fine particulate matter
Annual average PM2.5 concentrations for 2015–2017 were derived from optimal estimation methods
combining remote-sensing observations, chemical transport modelling and ground-based observations (van
Donkelaar et al. 2015a). Aerosol optical depth (AOD) data were obtained from three satellite instruments:
Multi-angle Imaging SpectroRadiometer (MISR), Moderate Resolution Imaging Spectroradiometer (MODIS),
and Sea-viewing Wide Field-of-view Sensor (SeaWiFS) (Boys et al. 2014; Crouse et al. 2015; Stieb et al. 2015;
van Donkelaar et al. 2010, 2013, 2015a). AOD is a vertically integrated measurement of light extinction in the

8 Estimates of background concentrations are revisited periodically by Environment and Climate Change Canada scientists. An
assessment conducted in 2018 determined that the original estimates provided by Judek et al. (2004) were still representative
of Canadian background concentrations (Bob Vet, Environment and Climate Change Canada; personal communications).
9 Missing data are associated with a small number of census divisions in remote and low-population areas in the North.

                  HEALTH IMPACTS OF AIR POLLUTION IN CANADA: ESTIMATES OF PREMATURE DEATHS AND NONFATAL OUTCOMES |              8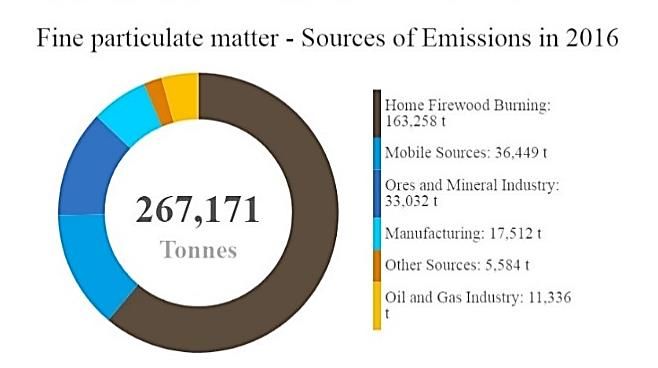
atmosphere, which is associated with aerosols. Factors such as the vertical distribution and composition of
aerosols, as well as humidity and other meteorological conditions, can influence estimates of ground-level
PM2.5 concentrations based on AOD measurements. To account for these factors, AOD values can be
normalized or adjusted using output from chemical transport models and ground-based observations. For the
current assessment, AOD data were combined with information obtained from the Goddard Earth Observing
System chemical transport model (GEOS-Chem) and Canada’s National Air Pollution Surveillance (NAPS)
network (ground-based air pollutant monitoring) to provide final national estimates of PM2.5 levels (van
Donkelaar et al. 2015b).
The annual average PM2.5 concentration estimates were generated as a gridded surface with a spatial
resolution of approximately 1 km × 1 km. The grid cell values were then converted to a point dataset and
merged with a dataset representing postal code areas. The nearest point was assigned to each postal code.
The postal code results were then combined with dissemination area (DA) population data to calculate
population-weighted concentrations for each CD.
Figure 1 shows the distribution of annual average PM2.5 concentrations for the years 2015 to 2017. The
national population-weighted average ambient PM2.5 concentration is 6.1 µg/m3 during the period of
interest. As expected, higher PM2.5 concentrations are observed in many of the more populous CDs, such as
those in the Lower Fraser Valley of British Columbia, the Calgary–Edmonton Corridor in Alberta, and along
the Windsor–Quebec City Corridor in Ontario and Quebec (Figure 1).
Figure 1. Three-year population-weighted average of daily PM2.5 concentrations across Canadian census
divisions – 2015–2017 (includes air pollution from all sources)

2.2.3.2 Ozone
Estimates of both the (1) annual ozone average and (2) summer ozone average (May–September) were
derived from daily 1-h maximum concentrations for 2014, 2015 and 2017. Data for 2016 were not available
owing to operational considerations for the underlying model. These estimates were produced by
Environment and Climate Change Canada using objective analysis, an interpolation technique that weighs
and combines modelled ozone forecasts with observations of ozone (Robichaud and Ménard 2014; Kalnay
2003). The model led ozone forecast was provided by the Global Environmental Multiscale - Modelling Air
quality and Chemistry (GEM-MACH) system, Environment and Climate Change Canada’s operational regional
air quality forecast model (e.g. Makar et al. 2018; Moran et al. 2010; Whaley et al. 2018). Ozone
measurements were obtained from the Canadian Air and Precipitation Monitoring Network (CAPMoN) and
the Canadian NAPS network. In objective analysis, the optimal combination of modelled and observed values
improves the coverage and accuracy of air pollution patterns (Robichaud et al. 2016). Objective analysis leads
to better estimates of ambient ozone concentrations in areas lacking monitoring data compared to standard
interpolation techniques (such as spatial kriging). Estimates for Canada are available for 2014, 2015 and 2017,

                HEALTH IMPACTS OF AIR POLLUTION IN CANADA: ESTIMATES OF PREMATURE DEATHS AND NONFATAL OUTCOMES |   9
on a grid point surface with a horizontal resolution of 10 km x 10 km. The grid point estimates were then
interpolated to CD polygons (using a normalized conservative approach). All grid points within and bordering
CD polygons were included, wholly or partially, to estimate the average ozone concentration values by CD.
Figure 2 (top panel) shows the distribution of the annual average of daily 1-h maximum ozone concentrations
for the years 2014, 2015 and 2017. The distribution of summer-average daily 1-h maximum ozone is similar
(Figure 2–bottom panel). Higher ozone concentrations are observed in the Lower Fraser Valley of British
Columbia, in southern Alberta and along the Windsor–Quebec City Corridor, including many of the more
populous CDs in Canada. As environmental and meteorological conditions in warmer months promote the
formation of ozone, higher concentrations are also observed in the summer: The national population-
weighted average ambient concentrations are 39.2 ppb for annual ozone and 42.4 ppb for summer ozone.
Figure 2. Three-year population-weighted annual (top panel) and summer (bottom panel) average of the
daily 1-h maximum ozone concentrations across Canadian census divisions – 2014, 2015 and 2017 (includes
air pollution from all sources)
                                Annual ozone

                                 Summer ozone

2.2.3.3 Nitrogen dioxide
Annual average NO2 concentrations were estimated using a national land-use regression (LUR) model for
2015–2017 (Larkin and Hystad 2020). The LUR model predictors included three-year annual average NO2
concentrations for 2015, 2016, and 2017 using NO2 vertical column densities (NASA Earth Observations

              HEALTH IMPACTS OF AIR POLLUTION IN CANADA: ESTIMATES OF PREMATURE DEATHS AND NONFATAL OUTCOMES |   10
database10) from the Ozone Monitoring Instrument (OMI), as well as land use and meteorological descriptors
(e.g. Boersma et al. 2011; Hystad et al. 2011; Lamsal et al. 2008). In addition to the OMI data, the model
predictors were population density, railways, temperature, industrial use, highways and expressways, and
the normalized difference vegetation index (NDVI). The NO2 estimates were developed on a high-resolution
grid (30 m) in order to best capture the fine spatial gradients in NO2 concentrations. The LUR model
performance was assessed by comparing predicted and observed NO2 concentrations. Observations
corresponded with the three-year annual average NO2 data from the NAPS network for 2015, 2016, and 2017
(180 monitoring stations). A coefficient of determination (R2) of 0.68 was reported between the NO2 model
results and the corresponding NAPS data (Larkin and Hystad 2020).
In this analysis, the 2015–2017 annual average NO2 estimates were derived for dissemination block (DB)
centroids (or nearest valid location). Estimates were available for 486,676 DBs (2016 Census). DB estimates
ranged from 0 to 20 ppb, with a mean of 5.4 ppb. The DB results were used to calculate population-weighted
concentrations for each CD. Figure 3 shows the distribution of annual average NO2 concentrations, averaged
over 2015 to 2017. The national population-weighted average ambient concentration is 7.4 ppb for NO2. As is
the case for PM2.5 and ozone, higher NO2 concentrations were observed in southwestern British Columbia,
around the Calgary–Edmonton Corridor in Alberta, in southern Saskatchewan, and along the Windsor–
Quebec City Corridor in Ontario and Quebec.
Figure 3. Three-year population-weighted average of daily NO2 concentrations across Canadian census
divisions – 2015–2017 (includes air pollution from all sources)
2.3 Estimating premature deaths and nonfatal outcomes from air pollution
This analysis used Health Canada’s Air Quality Benefits Assessment Tool (AQBAT) version 3.0 (Judek et al.
2019; Xu and Stieb11) to link population-level above-background air pollution exposure to health outcomes.
The AQBAT model estimates the number of premature deaths and other health outcomes associated with
specified changes in air pollution concentrations across geographic units (i.e. CDs) in Canada. Outcomes can
then be aggregated to provincial, territorial and national health impact estimates, as was done here. Health
effect information for the three air pollutants is included in the form of CRFs. A CRF represents the excess
health risk for a given endpoint, such as asthma symptoms, chronic bronchitis, and mortality, that follows a
unit increase in ambient pollutant concentration. For example, an increase in PM2.5 chronic exposure of
10 µg/m3 leads to a corresponding 10% increase in the risk of premature mortality from nonaccidental
causes. A CRF is a statistically derived estimate, from a single study or a meta-analysis of multiple studies.
10 [NASA] National Aeronautics and Space Administration. Aura Satellite.
11 Guoliang Xu and Dave Stieb; personal communications, Health Canada, 2019
HEALTH IMPACTS OF AIR POLLUTION IN CANADA: ESTIMATES OF PREMATURE DEATHS AND NONFATAL OUTCOMES | 11Health endpoints (related to acute or chronic exposure), the associated CRFs and the applicable population
group(s) (e.g. age-specific groups) are predefined in AQBAT. In the context of this analysis, short-term
exposure contributes to effects that occur within a few days of an increase in ambient air pollution (acute
health effects), while long-term exposure refers to exposures averaged over the years preceding the
development of disease or death (chronic health effects). Pollutant-specific CRFs for individual adverse health
outcomes are drawn from the health science literature and are the consensus selection of a panel of Health
Canada experts. They are therefore Health Canada-endorsed values. Table 1 presents the pollutants and their
associated health effects considered by this analysis. Previous studies (e.g. Crouse et al. 2012; Judek et al.
2019; Shin et al. 2013; Stieb et al. 2015) contain background information on the CRF estimates used in this
analysis (i.e. references to the scientific literature upon which the risk estimates are based) and the analysis
undertaken to produce the estimates within AQBAT. This information is also summarized in Appendix B.
Health outcomes were considered to have no threshold for effect (i.e. effects were assumed to occur at all
levels of exposure), which is consistent with Health Canada’s conclusions upon evaluation of the overall
literature on each of these pollutants (Health Canada 2013, 2016).
Table 1. Averaging periods and associated acute and chronic health endpoints for NO2, ozone and PM2.5 CRFs
in AQBAT version 3.0
Pollutanta Averaging Health endpoint Causality Reference
period determinationd
NO2 24-h Acute exposure mortalityb,c Likely causal Health Canada 2016
Ozone 1-h maximum Acute exposure mortalityb Likely causal Health Canada 2013
Summer 1-h maximum Acute respiratory symptom days Causal Health Canada 2013
ozone Asthma symptom days Causal Health Canada 2013
Chronic exposure respiratory mortality Suggestive to be causal Health Canada 2013
Minor restricted activity days Causal Health Canada 2013
Respiratory emergency room visits Causal Health Canada 2013
Respiratory hospital admissions Causal Health Canada 2013
PM2.5 24-h Acute respiratory symptom days Causal Health Canada 2013
Adult chronic bronchitis cases Suggestive to be causal Health Canada 2013
Asthma symptom days Causal Health Canada 2013
Cardiac emergency room visits Causal Health Canada 2013
Cardiac hospital admissions Causal Health Canada 2013
Child acute bronchitis episodes Causal Health Canada 2013
Chronic exposure mortality Causal Health Canada 2013
Respiratory emergency room visits Causal Health Canada 2013
Respiratory hospital admissions Causal Health Canada 2013
Restricted activity days Causal Health Canada 2013
AQBAT: Air Quality Benefits Assessment Tool; CRF: concentration–response function; NO2: nitrogen dioxide; ozone: ozone;
PM2.5: fine particulate matter or particulate matter with a diameter of 2.5 µm or less
a Unless otherwise specified, CRFs reflect an exposure to the pollutant at any time during the year.
b CRFs relating acute exposure mortality and gaseous pollutants are from a copollutant model including CO, NO2, ozone and
SO2 and may not precisely reflect the true attribution of risk to individual pollutants.
c It is recognized that the CRF for NO2-related acute exposure mortality may reflect a likely causal relationship with NO2, or
NO2 may be acting as a surrogate for a specific component of the air pollution mixture, such as vehicle exhaust emissions.
d Causal: Evidence is sufficient to conclude that there is a causal relationship with relevant pollutant exposures; Likely to be
causal: Evidence is sufficient to conclude that a causal relationship is likely to exist with relevant pollutant exposures, but
important uncertainties remain; Suggestive to be causal: Evidence is suggestive of a causal relationship with relevant
pollutant exposures, but is limited.
HEALTH IMPACTS OF AIR POLLUTION IN CANADA: ESTIMATES OF PREMATURE DEATHS AND NONFATAL OUTCOMES | 12Population-level premature deaths were estimated using the following CRFs and health endpoints:
o Nonaccidental causes of death12 associated with long-term exposure to PM2.5 from a Canadian
cohort (Crouse et al. 2012).
o Nonaccidental causes of deaths associated with short-term exposure to NO2 and ozone from a
Canadian time-series analysis (Burnett et al. 2004).
o Death from respiratory causes associated with long-term exposure to summer ozone from an
American cohort (Jerrett et al. 2009).
CRF values for premature deaths are shown in Table 2 and for all health endpoints in Appendix B. Table 2 also
summarizes methodological considerations for the current health impact assessment, including a list of fatal
and nonfatal health effects associated with each air pollutant, data sources for estimating exposures to air
pollution, and national population-weighted average exposure estimates.
CRFs can be input as a distribution function in the calculations, accounting for inherent uncertainty in the CRF
estimates. Monte Carlo simulations employing 10,000 iterations were used to propagate this uncertainty in
the CRFs. The model generates a central estimate of the most likely health impacts equal to the median of
the output distribution, as well as low- and high-end estimates equal to the 2.5 and 97.5 percentiles of the
output distribution.
CRF values for PM2.5 mortality from ischemic heart disease (IHD), cerebrovascular disease (CVD), lung cancer
and chronic obstructive pulmonary disease (COPD) for adults 25 years and over, are also included in AQBAT
(Shin et al. 2013).13 These four individual causes correspond to the approach employed by the IHME and the
WHO in the GBD analyses (Cohen et al. 2017; Lim et al. 2012; www.healthdata.org/gbd), which include
estimates of air quality and health impacts across the world. IHD, CVD, lung cancer and COPD are a subset of
nonaccidental chronic exposure mortality (i.e. nonaccidental deaths), which are reported herein. For the
purposes of this report, nonaccidental causes of death is considered the most appropriate premature
mortality metric associated with chronic exposure to PM2.5; it generally leads to higher mortality estimates
than the sum of specific causes of death.
12 Nonaccidental causes of death are referred to as (all) internal causes of death in previous Health Canada publications on the
health impacts of air pollution in Canada (2017, 2019).
13 The user has the option of using the “all-cause” nonaccidental mortality endpoint or the four individual causes.
HEALTH IMPACTS OF AIR POLLUTION IN CANADA: ESTIMATES OF PREMATURE DEATHS AND NONFATAL OUTCOMES | 13Table 2. Summary of health effects and exposure estimates considered in the health impacts analysis
Health effects PM2.5 NO2 Annual ozone Summer ozone
a a a
Cause of death and exposure type All – chronic All – acute All – acute Respiratory – chronic
% increase per change 10% per 10 µg/m3 1.5% per 20 ppb 1.7% per 20 ppb 8.2% per 20 ppb
[key reference] [Crouse et al. 2012] [Burnett et al. 2004c] [Burnett et al. 2004] [Jerrett et al. 2009]
Morbidity outcomes Acute Respiratory Symptom Days; Adult None None Acute Respiratory
Chronic Bronchitis Cases; Asthma Symptom Days; Asthma
Symptom Days; Cardiac ER Visits; Symptom Days; Minor
Cardiac HA; Child Acute Bronchitis Restricted Activity Days;
Episodes; Respiratory ER Visits; Respiratory ER Visits;
Respiratory HA; Restricted Activity Days Respiratory HA
National exposure estimates PM2.5 NO2 Annual ozone Summer ozone
Years of exposure data 2015–2017 2015–2017 2014, 2015, 2017
Type of exposure data Satellite observations, ground Satellite observations, ground Objective analysis of ground observations (NAPS)
[key reference] observations (NAPS), and chemical observations (NAPS), and chemical transport model (GEM-MACH)
transport models (GEOS-Chem) [van geographic data (e.g. land [Robichaud and Ménard 2014]. Annual and
Donkelaar et al. 2015a,b] use, distance to roadways) summer (May–September) averages
[Larkin and Hystad 2020]
Average ambient concentrationb 6.1 µg/m3 7.4 ppb 39.2 ppb 42.4 ppb
3
Natural background concentration 1.8 µg/m 0.15 ppb 26 ppb 28 ppb
b,c 3
Average air pollution concentration 4.3 µg/m 7.2 ppb 13.2 ppb 14.4 ppb
CRF: concentration-response function; ER: emergency room; GEM-MACH: Global Environmental Multiscale - Modelling Air quality and CHemistry; GEOS-Chem: Goddard Earth
Observing System chemical transport model; HA: hospital admissions; µg/m3: micrograms per cubic metre; NAPS: National Air Pollutant Surveillance network; ppb: parts per billion by
volume
a All – nonaccidental causes
b National population-weighted concentrations
c Above-background air pollution
HEALTH IMPACTS OF AIR POLLUTION IN CANADA: ESTIMATES OF PREMATURE DEATHS AND NONFATAL OUTCOMES | 142.3.1 Baseline incidence rates
Baseline incidence rates of the health endpoints considered are a key factor in estimating the count of health
outcomes associated with a change in pollutant concentration. Baseline incidence rates are pre-defined in
AQBAT as a model parameter. These rates are estimated through detection, observation and formal means
of reporting (e.g. death certificates, hospital admission records) based on data provided by Statistics Canada
or epidemiological studies (e.g. Abbey et al. 1995; Hoek et al. 2012; Krupnick et al. 1990; Ostro 1987; Osto
and Rothschild 1989; Weinmayr et al. 2010). They are expressed in annual events per million people. Details
regarding the source data, formulas, and algorithms used to estimate annual baseline health endpoint
incidence rates are provided in the AQBAT user guide (Judek et al. 2019).
Baseline cause- and age-specific mortality rates were derived from counts of mortality obtained for each CD
outside of Québec, where these data were not available. Rates are averaged over the three most recent
years of available data to improve stability (Stieb et al. 2015). For Quebec, mortality counts were derived for
each CD by applying national age- and cause-specific rates to the CDs’ individual population age distribution.
For each morbidity and mortality health endpoint in AQBAT, a data file contains estimated annual events per
million specified people for every geographic area, age group, scenario year and population projection. The
national, provincial and territorial baseline rates for health endpoints associated with NO2, ozone and PM2.5
in the current version of AQBAT are summarized in Appendix C.14
Incidence rates are generally associated with many factors, such as age, gender, race, education, income,
environmental factors and lifestyle habits. Age-specific baseline incidence rates (for the health endpoints in
question) for the target population were included to estimate the number of excess health outcomes
associated with the increased risk following a change in air pollutant concentration. Annual baseline health
endpoint rates of events are assigned to specific populations that correspond to those examined in the
underlying epidemiologic studies. For example, the Restricted Activity Days endpoint is assigned to 94% of
people aged 20 years and older (i.e. nonasthmatics). Exposure to pollutants typically has a minor influence on
the baseline incidence rates. Additional details and references on the process of deriving baseline rates have
previously been published (Judek et al. 2019; Stieb et al. 2015).
2.4 Estimating the economic value of health outcomes from air pollution
Estimating the economic value (or valuation) of air pollution-related health impacts monetizes health
outcomes, allowing impacts to be expressed in monetary units. In doing so, the potential social, economic
and public welfare consequences of a health endpoint are considered, including medical costs, reduced
workplace productivity, pain and suffering, and the other effects of increased health risks. Expressing impacts
in monetary terms provides a common metric across health endpoints to estimate the overall benefits or
damages in order to inform air quality management strategies. The sum provides an indication of the relative
benefits or damages to society resulting from reduced or increased risks to health.
In AQBAT, each health endpoint is assigned a monetary value, typically derived from surveys, accounting or
economic or actuarial data. The valuation estimates used in the model, along with references to the studies
from which they are derived, are provided in Table 3. Endpoint valuations have inherent uncertainties, which
are captured by a distribution of possible values within the model and defined by a distribution form and a
set of parameters (Table 3). Endpoint valuations are expressed in Canadian dollars and can be temporally
adjusted from the source years of the underlying studies based on the consumer price index, as defined by
Statistics Canada (Judek et al. 2019; Statistics Canada, annual). In the current analysis, the currency year 2016
(2016 CAD) was used.
14The full list of baseline rates is provided with the AQBAT model package or can be obtained upon request from Health Canada
at hc.air.sc@canada.ca.
HEALTH IMPACTS OF AIR POLLUTION IN CANADA: ESTIMATES OF PREMATURE DEATHS AND NONFATAL OUTCOMES | 15Table 3. Economic value of health endpoints used in Health Canada’s AQBAT model
Currency year
Source Parameter Parameter Parameter
Endpoint [reference] of original Forma
type 1 (prob.) 2 (prob.) 3 (prob.)
study
Mortality 2007 WTP/ Discrete $3,500,000 $6,500,000 $9,500,000
[Chestnut and De Civita 2009] WR (25%) (50%) (25%)
Acute respiratory symptom days 1997 WTP Normal $13 $7 –
[Stieb et al. 2002]
Adult chronic bronchitis cases 1996 WTP Discrete $175,000 $266,000 $465,000
[Krupnick and Cropper 1992; Viscusi et (33%) (34%) (33%)
al. 1991]
Asthma symptom days 1997 WTP Triangular $7 $28 $120
[Stieb et al. 2002]
Cardiac emergency room visitsb 1997 WTP Normal $4,400 $590 –
[Stieb et al. 2002]
Child acute bronchitis episodes 1996 WTP Discrete $150 $310 $460
[Krupnick and Cropper 1989] (33%) (34%) (33%)
Elderly cardiac hospital admissions 1997 WTP Normal $5,200 $610 –
[Stieb et al. 2002]
Minor restricted activity days 1997 WTP Normal $22 $9 –
[Stieb et al. 2002]
Respiratory emergency room visitsb 1997 WTP Normal $2,000 $210 –
[Stieb et al. 2002]
Restricted activity days 1997 WTP Normal $48 $18 –
[Stieb et al. 2002]
Adapted from Judek et al. (2019)
prob.: probability of value being selected in the analysis; WR: wage risk; WTP: willingness to pay
a For valuations represented by discrete values, parameters 1, 2 and 3 represent low, medium and high estimates respectively.
For valuations represented by normal distributions, parameters 1 and 2 represent the mean and standard error of the
estimates respectively. For valuations represented by triangular distributions, parameters 1, 2 and 3 represent minimum,
most likely and maximum values respectively.
b Respiratory and cardiac emergency room visits include the costs of subsequent hospital admissions, which are calculated
based on the proportion of emergency room visits that result in admission to hospital. Hospital admissions are assigned a
value of zero to avoid double-counting of costs.
As evident in Table 3, the monetary value of mortality is considerably higher than that of any other health
endpoint. For the purposes of policy analysis, the recommended central estimate of an avoided premature
death is $6.5 million (CAD 2007) based on a review of Canadian studies by Chestnut and De Civita (2009). The
underlying data indicate that an average Canadian would be willing to pay approximately $65 in order to
reduce the risk of premature death by 1 out of 100,000. The aggregate willingness to pay (WTP) of 100,000
Canadians ($65 each) equals the value of the one avoided death. The uncertainty in this estimate is
addressed by a recommended low value of $3.5 million and a high value of $9.5 million (Table 3). These
values provide a reasonable range of WTP but should not be considered as lower and upper bounds
(Chestnut and De Civita 2009). The above values are not equivalent to the economic worth of an identified
person’s life, but rather an aggregation of individual values people are willing to pay for small changes in
risk.15 Following adjustments based on the consumer price index, the value of an avoided premature death in
2016 CAD is $7.5 million.
15 Empirical studies of willingness to pay (WTP) for mortality risk reductions provide estimates of the average monetary
amounts that individuals are willing to pay for small reductions in premature mortality. The valuation context or individual
circumstances influence WTP values; that is, they may vary for the same amount of risk reduction in different contexts and for
different individuals. WTP reflects all the reasons individuals put a value on the reduction of their own risk of death. Therefore,
it can exceed the value of the financial impact on an individual associated with the change in risk.
HEALTH IMPACTS OF AIR POLLUTION IN CANADA: ESTIMATES OF PREMATURE DEATHS AND NONFATAL OUTCOMES | 163. Results
Table 4 presents the health impact and economic value results for mortality endpoints associated with PM2.5,
ozone and NO2 air pollution for national, provincial and territorial geographies. Metrics in Table 4 include the
count of incidences and normalized values per 100,000 population. The latter metric allows for comparisons
of health impact estimates among geographic regions of different population sizes. All results represent the
health impacts attributable to above-background concentrations, as outlined in the Methods section. The
Canadian values presented herein have not previously been published.
Overall, the total mortality attributable to above-background air pollution in Canada was estimated to be
15,300 premature deaths per year, based on population data for 2016 and air pollutant concentrations from
2014 to 2017.16 More specifically, the following population health impacts of PM2.5, ozone and NO2 were
estimated:17
o Chronic exposure to PM2.5 air pollution contributed to 8.0% of all-cause nonaccidental mortality
among Canadians over 25 years of age, equivalent to 10,000 deaths per year or 27 deaths per
100,000 population.
o Acute exposure to NO2 air pollution contributed to 0.9% of all-cause nonaccidental mortality among
Canadians of all ages, equivalent to 1,300 deaths per year or 4 deaths per 100,000 population.
o Acute exposure to ozone was associated with 2.7% of all-cause nonaccidental mortality among
Canadians of all ages, equivalent to 2,800 deaths per year or 8 deaths per 100,000 population. This
estimate was derived using the annual average of daily 1-h maximum ozone concentrations.
o Chronic exposure to ozone was associated with 10% of respiratory-related mortality among
Canadians over 30 years of age, equivalent to 1,300 deaths per year or 4 deaths per 100,000
population. This estimate was derived using the summer average of daily 1-h maximum ozone
concentrations.
The economic cost of the 15,300 premature deaths associated with air pollution is estimated at $114 billion
per year (2016 CAD). Health Canada recognizes the possibility of overlap or double counting of endpoints;
this is addressed in the Uncertainties and limitations section.
Large variations in premature death counts and normalized risks are observed across geographic regions
(Table 4). Higher mortality counts are estimated for the provinces of Ontario, Quebec, British Columbia and
Alberta, which are the most populous provinces and those with the highest projected air pollution levels
(Figures 1 to 3). Reported premature deaths per 100,000 population indicate that air pollution mortality risks
are highest in Ontario and Quebec, reflecting the confluence of high population density and air pollution
levels, and lowest in Nunavut and the Northwest Territories. There are also variations between regions with
populations of comparable size. For example, the death rate per 100,000 population in British Columbia (40)
is somewhat higher than in Alberta (33). Results at the CD level, discussed below, underline potential reasons
for these differences.
16 PM : 2015–2017;ozone: 2014, 2015 and 2017; NO : 2015–2017
2.5 2
17 Values for individual pollutants may not match total because of rounding.
HEALTH IMPACTS OF AIR POLLUTION IN CANADA: ESTIMATES OF PREMATURE DEATHS AND NONFATAL OUTCOMES | 17Table 4. Annual premature deaths attributable to air pollution by province and territory in 2016
Counts of premature deathsa Valuation
per (2016 CAD)
Region—population Pollutant × $1,000,000a
100,000
Ozon Ozon Alld Alld
NO2 PM2.5 Alld
eb ec
Canada—36,229,449 1,300 10,000 2,800 1,300 15,300 42 114,000
Alberta—4,286,341 120 850 290 140 1,400 33 10,400
British Columbia—4,689,131 170 1,200 310 160 1,900 40 13,900
Manitoba—1,307,764 35 300 72 28 430 33 3,300
New Brunswick—760,167 14 110 52 14 190 25 1,400
Newfoundland and Labrador—521,209 10 35 37 9 92 18 690
Northwest Territories—44,648 0 3 1 0 4 9 32
Nova Scotia—946,936 20 150 74 24 270 29 2,000
Nunavut—37,382 0 0 1 0 1 3 6
Ontario—13,979,393 570 4,200 1,200 580 6,600 47 49,200
Prince Edward Island—149,904 3 10 12 4 30 20 220
Québec—8,348,780 330 2,800 640 280 4,000 48 30,200
Saskatchewan—1,120,939 29 280 67 30 410 36 3,000
Yukon—36,855 0 3 1 0 4 11 31
a Values represent median estimates of health outcome counts and economic valuation. Values are rounded to the nearest
integer and given to a maximum of two significant figures for values below 10,000, and three significant figures if equal to or
above 10,000.
b Acute exposure premature deaths; annual ozone.
c Chronic exposure premature deaths; summer ozone.
d NO2, ozone, and PM2.5; totals may not match because of rounding.
National estimates for all health endpoints, both fatal and nonfatal, are provided in Table 5. Air pollution is
associated with a considerable number of morbidity or nonfatal outcomes; the highest counts are predicted
for the following outcomes: acute respiratory symptom days, restricted activity days, and asthma symptom
days. However, the annual costs associated with morbidity outcomes, which total $5.6 billion (2016 CAD), are
much less than those for mortality, owing to the large monetary value assigned to increased risk of death
(Table 3).
The 2.5 and 97.5 percentiles reported in Table 5 represent the low- and high-range estimates. They are
generally within a factor of two to three of the central estimate, except for minor restricted activity days. The
estimates for this health endpoint have a broader range owing to the associated CRF. Specifically, the
regression coefficient used to derive the CRF is not statistically significant, and the distribution overlaps 0 and
is truncated at 0 (Judek et al. 2019). It may also have wide confidence intervals. Nil values are also estimated
as the lower range for adult chronic bronchitis cases linked to exposure to PM2.5. The CRF parameters explain
this range in values (see Appendix B).
HEALTH IMPACTS OF AIR POLLUTION IN CANADA: ESTIMATES OF PREMATURE DEATHS AND NONFATAL OUTCOMES | 18You can also read