Auckland District Health Board Health Needs Assessment
←
→
Page content transcription
If your browser does not render page correctly, please read the page content below
Auckland District Health Board Health Needs Assessment | 2020

Contents
1 Executive Summary ..................................................................................................................................................................................... 3
1.1        Our population is diverse and growing ............................................................................................................................................. 3
1.2        Our population is healthy and health is improving ........................................................................................................................... 3
1.3        Our key health challenges ................................................................................................................................................................. 4
    1.3.1         Reduce inequalities in health .................................................................................................................................................. 4
    1.3.2         Support healthier lifestyles ..................................................................................................................................................... 5
    1.3.3         Effective management of cardiovascular disease and diabetes .............................................................................................. 5
    1.3.4         Rapid identification and treatment of cancer ......................................................................................................................... 6
    1.3.5         Access to Mental Health services ............................................................................................................................................ 6
    1.3.6         Give children the best start to life........................................................................................................................................... 6
    1.3.7         Older people ........................................................................................................................................................................... 7
    1.3.8         Meeting future health needs .................................................................................................................................................. 7
2 Introduction ................................................................................................................................................................................................ 8
2.1        Equity ................................................................................................................................................................................................ 8
2.3        Needs assessment and Māori ........................................................................................................................................................... 9
3 Our Population .......................................................................................................................................................................................... 10
3.1        Migrants .......................................................................................................................................................................................... 12
4 Population Health Drivers ......................................................................................................................................................................... 13
4.1        Ethnicity .......................................................................................................................................................................................... 13
4.2        Deprivation ..................................................................................................................................................................................... 13
4.3        Income, Education and Employment .............................................................................................................................................. 15
4.4        Housing ........................................................................................................................................................................................... 15
4.5        Environmental factors ..................................................................................................................................................................... 16
4.6        Climate Breakdown ......................................................................................................................................................................... 16
    4.6.1         Rapid-onset climate breakdown events ................................................................................................................................ 16
    4.6.2         Slow-onset impacts ............................................................................................................................................................... 16
4.7        Social factors ................................................................................................................................................................................... 17
4.8        Violence and crime.......................................................................................................................................................................... 18
4.9        Cultural factors................................................................................................................................................................................ 18
5 Modifiable Risk Factors ............................................................................................................................................................................. 19
5.1        Smoking........................................................................................................................................................................................... 19
5.2        Diet and physical activity................................................................................................................................................................. 20
5.3        Alcohol and Drugs ........................................................................................................................................................................... 21
6 Health Status ............................................................................................................................................................................................. 22
6.1        Overall health .................................................................................................................................................................................. 22
    6.1.1         Life expectancy ..................................................................................................................................................................... 22
    6.1.2         Total mortality ...................................................................................................................................................................... 23
    6.1.3         Avoidable causes of mortality ............................................................................................................................................... 24
6.2        Specific conditions .......................................................................................................................................................................... 25
    6.2.1         Cardiovascular disease (CVD) ................................................................................................................................................ 25
    6.2.2         Stroke .................................................................................................................................................................................... 26
    6.2.3         Diabetes ................................................................................................................................................................................ 26
    6.2.4         Cancer ................................................................................................................................................................................... 27
    6.2.5         Respiratory disease ............................................................................................................................................................... 29
    6.2.6         Mental health and addictions ............................................................................................................................................... 29
    6.2.7         Injury ..................................................................................................................................................................................... 30
    6.2.8         Disability ............................................................................................................................................................................... 31
    6.2.9         Pandemic infectious disease ................................................................................................................................................. 32
    6.2.10        Sexual health......................................................................................................................................................................... 32
6.3        Infants, children and young people ................................................................................................................................................. 33
    6.3.1         Births ..................................................................................................................................................................................... 33
    6.3.2         Infants and children .............................................................................................................................................................. 33
    6.3.3         Young people ........................................................................................................................................................................ 35
6.4        Older people ................................................................................................................................................................................... 35
7 Health Services .......................................................................................................................................................................................... 38
7.1        Community health care ................................................................................................................................................................... 38
    7.1.1         Oral health ............................................................................................................................................................................ 38
7.2        Hospital-based health care ............................................................................................................................................................. 39
    7.2.1         Emergency Departments (EDs) ............................................................................................................................................. 39
    7.2.2         Outpatient services ............................................................................................................................................................... 40
    7.2.3         Admitted patients ................................................................................................................................................................. 40
    7.2.4         Access to publicly-funded elective surgery ........................................................................................................................... 41
    7.2.5         Hospital quality and safety.................................................................................................................................................... 42
    7.2.6         Avoidable causes of hospitalisation ...................................................................................................................................... 42
8 Data and Information Sources................................................................................................................................................................... 44
8.1        Major data sources ......................................................................................................................................................................... 44
8.2        References ...................................................................................................................................................................................... 45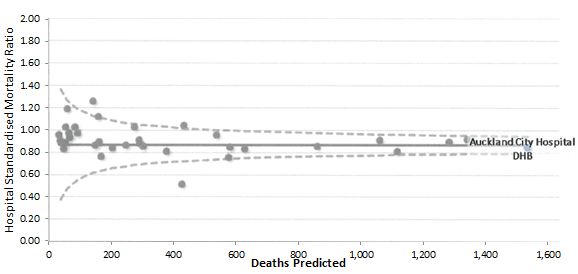
1         Executive Summary

DHBs are required to regularly investigate, assess and monitor the health status of their resident population, and their
need for services. The health needs assessment forms an integral part of the overall planning cycle, informing both
funding decisions and the strategic planning process. We used data from a wide range of sources to provide a picture
of the health status and needs of our population. With this information, the District Health Board (DHB) can plan future
health services and health programmes to ensure the best health outcomes for all the people in our region.

1.1 Our population is diverse and growing
Auckland DHB serves the population resident on the             requires a co-ordinated approach between many agencies
Auckland isthmus and the islands of Waiheke and Great          and services.
Barrier. It is an area of stunning natural beauty. Residents
enjoy easy access to green spaces, parks and beaches.          Significant population growth is expected in the future.
Auckland ranks highly among surveys of the world’s most        The population is projected to increase by 16%, reaching
liveable cities.                                               587,000 by 2040/41. The population will also be
                                                               considerably older, with the number of people aged 65
Auckland DHB contains approximately 507,370 people,            years and older expected to increase from the current
making it the fourth largest DHB in New Zealand. We            61,500 to approximately 105,000, and making up 18% of
have an ethnically diverse population, with 8% Māori,          our population, compared with 12% at present. Our
11% Pacific, 34% Asian and 47% European/Other. Almost          Māori and Asian populations will also grow: our Māori
half (45%) of our population were born overseas. The age       population by 14% and Pacific by 15%; our Asian
composition of Auckland residents is somewhat different        population is projected to grow by 50%. We need to plan
from the national picture, with 34% in the 25-44 year-old      and develop our services to meet the needs of this
group, compared with 27% in this age group nationally.         expanding and changing population. We also need to
Auckland has 12% of its population in the 65+ year-old         work with other public agencies and services to improve
group, compared with 16% nationally.                           the wider determinants of health, such as housing,
                                                               education and the physical environment, as well as
 Our population includes large numbers of young adults         improving access to health services.
    90+ years
 80-84 years      Male                         Female                                     Our population will grow
                                                                                           over the next 20 years
 70-74 years
                                               2040/41                         700,000
 60-64 years
                                               2020/21
 50-54 years                                                                   600,000

 40-44 years                                                                   500,000
                                                                  Population

 30-34 years                                                                   400,000
 20-24 years                                                                   300,000
 10-14 years                                                                   200,000
 00-04 years                                                                   100,000
            7%   5%    3%    1%    1%     3%    5%      7%
                                                                                    -
                                                                                                2020/21            2040/41
Many factors affect the health of individuals and
communities. Whether people are healthy or not is                                 Māori     Pacific   Asian   European /Other
determined for the most part by an individual’s socio-
economic circumstances and their environment. While
Auckland’s population enjoys a high median income,             1.2 Our population is healthy and health is
home ownership is increasingly unaffordable. Over-                 improving
crowding is more common than in New Zealand overall            We have similar health outcomes to New Zealand as a
and especially affects Māori, Pacific and Asian families.      whole, with a life expectancy of 82.9 years, 1.1 years
Our Māori and Pacific populations have lower rates of          longer than the national figure. The self-reported health
educational achievement and higher rates of                    status of our population is ‘excellent’ and we continue to
unemployment. Air pollution from motor vehicles and            see positive health outcomes overall. Our mortality rates
domestic fires causes around 100 premature deaths per          from cardiovascular disease and cancer, the two biggest
year. Improving the wider determinants of health
causes of avoidable deaths, have declined steadily over       develop health services to respond to the significant
the last decade.                                              growth and changes to the population in our district.

                     Life expectancy continues to increase    In 2020, the COVID-19 pandemic severely disrupted
                90                                            health services. As a result, the information in this
                                                              document is representative of historic patterns of service,
                85                                            but in 2020 the picture was very different.
  LEB (years)

                80                                                                           Avoidable deaths affect Māori and Pacific
                                                                                                        disproportionately
                75
                                                                                       350
                                                                                       300
                70

                                                                    Rate per 100,000
                                                                                       250
                65                                                                     200
                                                                                       150
                                                                                       100
                                                                                        50
                            Auckland DHB       New Zealand                               0
                                                                                                Mortality    Mortality    Mortality     Total
The children in our area experience a great start to life,                                    prevented by prevented by prevented by
                                                                                                avoiding       early     treatment
with infant mortality lower than the national rate and                                         occurrence detection of
very high immunisation rates, as 93% of our 8 month-old                                        of disease     disease
children and two year-old children are fully immunised.                                               Māori      Pacific   Asian     Other

We are seeing positive improvements in many lifestyle
risk factors, and identifying these risks earlier. Smoking,   1.3.1                          Reduce inequalities in health
the largest cause of preventable ill health, declined
substantially between 2006 and 2018, with rates falling       Although overall life expectancy is rising for Māori and
from 16.5% to 10% of adults. We now have the lowest           Pacific people, there remains a gap between Māori and
rate of smoking of any DHB in the country. This will          Pacific life expectancy and that of non-Māori non-Pacific
support improvements in health for many years to come.        people of 6.2 years for Māori and 7.3 years for Pacific
                                                              people. Māori and Pacific people have hospitalisation
Our population experiences more positive mental health        and mortality rates from many chronic diseases two to
than New Zealand as a whole, with our self-reported           three times higher than our European/Other population.
diagnosed rate of anxiety and depression lower than the       The main drivers of this equity gap are circulatory disease,
national rate. Our older population also experience           cancer, diabetes, respiratory disease and injuries.
positive health outcomes. The majority of our older
population are able to live unassisted in their own homes.        One in five of our people live in highly-deprived areas
Many older people continue to work after reaching the
age of 65 years, which is reflective of an overall positive                            50,000
                                                               Q5 population

health status.                                                                         40,000
                                                                                       30,000
1.3 Our key health challenges                                                          20,000

Although the majority of our people enjoy very good                                    10,000
health, particular population groups in our district                                         0
experience inequalities in health outcomes. With better
prevention of ill health, we could further reduce
avoidable deaths and increase the number of healthy
years of life for our residents. In 2018, there were 614                                         Māori   Pacific   Asian    European /Other
potentially avoidable deaths of Auckland residents (24%
of the total), 33% of which are among our Māori and           Nearly 20% of our population lives in areas ranked as
Pacific populations. Of these deaths, half could have         highly deprived (Quintile 5 of the NZ deprivation score),
been avoided through primary prevention, for example          concentrated in Rosebank/Avondale in the west, Mt
through adopting healthier lifestyles; a quarter could        Roskill and the CBD and the eastern and southern areas
have been prevented by identifying and managing               from Glen Innes to Mt Wellington and Otahuhu. These
problems like hypertension before they caused illness;        residents generally experience poorer health outcomes
and a quarter could have been avoided through prompt          than those living in more affluent areas.
identification and treatment. We also need to plan and

4
Health Needs Assessment 2020
1.3.2 Support healthier lifestyles 1.3.3 Effective management of cardiovascular
disease and diabetes
Although smoking rates are declining, 10% of our adult
population are regular smokers of cigarettes, with higher Cardiovascular diseases are the largest cause of death and
rates in our Māori (23%) and Pacific (20%) populations. as much as 70% of cardiovascular disease is avoidable.
Progress has been made with over 95% of all smokers Although our risk assessment rates are high (92% of
accessing health services receiving brief advice to quit; eligible adults), only 52% of eligible cardiovascular disease
however, more can be done to back this up with effective patients are on triple therapy. Although the rate of triple
support. therapy is increasing, many more patients could
potentially benefit from pharmacological treatment than
Smoking rates are low and declining is currently the case. We need to ensure that those
25% identified as being at high risk of disease, as well as those
with existing disease, are well-managed and receive
20% prompt treatment.
15% In 2019, nearly 800 Auckland residents were admitted to
hospital following a stroke. The mortality rate from
10%
stroke is 27 per 100,000, which is higher than the New
5% Zealand average (24). Prompt assessment together with
effective targeted treatment and rehabilitation is
0% essential in providing the best outcomes for these
2001 2006 2013 2018 patients.
census census census census
The number of people with diabetes has increased by
Auckland DHB NZ
8,000 since 2010 and this is now estimated to affect
26,500 (5.3%) of our population. There is room for
Data from the New Zealand Health Survey reports that improvement in supporting people with diabetes to
one in five of our adults are obese and over half are manage their key risk factors, such as blood pressure and
overweight, with very little change in the past ten years. blood sugar levels, and to attend retinal screening.
The rate of childhood obesity in our Pacific populations is Around 62% people with diabetes aged 15-74 years are
high, with 32% of Pacific 2-14 year olds considered to be known to be well-managed (defined as having an HbA1c
obese. Fewer than half of our population are meeting ofour population (17,000 people) are accessing secondary
1.3.4 Rapid identification and treatment of
mental health services with this rate increasing yearly.
cancer
Māori are particularly affected by mental health
conditions, being twice as likely as Europeans/Others to
There are 2,070 new cancer registrations in Auckland
access services. Pacific people report anxiety and distress
every year. Cancer causes 27% of all deaths with the
twice as often as Europeans/Others, but do not access
most significant being breast (in women), lung and
mental health services proportionately. While our suicide
colorectal cancers, and prostate cancer (in men). Around
rate is lower than the national rate, we lose 44 people
30-35% of cancers are caused by modifiable risk factors
each year to suicide.
and are avoidable. Early detection and prompt diagnosis
and treatment can reduce mortality and morbidity from Mental illness is also associated with reduced life
cancers. Our five-year survival rate from all cancers is expectancy, with sufferers at increased risk of other
69%, the highest in the country. However, if Auckland illnesses, particularly cancer and cardiovascular disease.
DHB had the same five-year survival rates as Australia, Even when these disorders are recognised, rates of
25% of women who die of breast cancer within five years intervention are lower for this population compared with
would survive for longer (7 per year). Similarly, 13% who people without mental illness.
die of bowel cancer within five years would survive for
longer (8 per year). For melanoma, the difference is 46%
(11 per year) and for non-Hodgkin lymphoma, it is 25% (5 1.3.6 Give children the best start to life
per year).
The well-being of children is critical to the well-being of
Public screening programmes for breast and cervical the population as a whole. Healthy children are more
cancer are well-established; despite this, one quarter of likely to become healthy adults. Our overall infant
all eligible women do not participate. Screening rates are mortality rate is lower than the national rate; however,
low in Māori with only 53% of eligible women rates in Māori and Pacific are higher than for
participating in cervical screening and 59% in breast European/Others. Four in ten of our pregnant mothers
screening. Asian women also have low rates of cervical are not enrolled with a lead maternity carer (LMC) at 12
screening at 51%. weeks of pregnancy and addressing this would improve
outcomes for both mothers and babies. The percentage
To support continued improvement in services and
of children enrolled with a PHO by three months of age
waiting times for people with cancer, accessing faster
(90%) is similar to the national figure (91%), but is lower
cancer treatment is a key priority. As at March 2019, 92%
in Māori children (75%).
of cancer patients waited less than 62 days for treatment
or other care to commence compared with the target of We are close to achieving our immunisation target of 95%
90%. at ages 8 and 24 months, with 93% of children fully
immunised at 8 months and 93% of children fully
Lung, colorectal, breast and prostate cancer are major
immunised at 24 months. We are below target for
killers
completion of core Well Child/Tamariki Ora checks in the
120 first year of life, but 89% of four-year-olds receive
ASR per 100,000 25+ years
100 comprehensive health checks before school entry.
80
60
40 Healthy children become healthy adults
20
- Enrolled with LMC at 12 wks
Pacific
Other
Pacific
Other
Pacific
Other
Pacific
Other
Asian
Asian
Asian
Asian
Māori
Māori
Māori
Māori
Enrolled with PHO at 3 mos
Fully immunised at 8 mos
Lung Colorectal Breast Prostate
Fully immunised at 2 yrs
WCTO checks completed
Auckland DHB NZ
B4 school checks completed
Aged 4 enrolled Oral Health
0% 50% 100%
1.3.5 Access to Mental Health services
NZ Auckland DHB
Mental ill-health affects one in five people each year and
the New Zealand health survey identified one in eight of Children are admitted to hospital most commonly for
our residents (equivalent to around 43,000 people) as injuries, gastroenteritis, asthma and infections. In
suffering from common mental illnesses. Around 3.5% of 2012/13, there were 21.5 admissions per 100,000
6
Health Needs Assessment 2020population aged 0-14 years for injuries resulting from
1.3.8 Meeting future health needs
domestic assault, neglect or maltreatment of children.
The incidence of rheumatic fever (3.9 per 100,000 Between 2007/08 and 2017/18, acute admissions
population) is higher than the national average, and remained the same and people attending ED increased by
significant inequalities are present for Māori and Pacific 8% for Auckland residents, after allowing for population
populations. ageing and growth. However, the absolute numbers
increased by 23% and 33%, respectively. Future
population growth and constraints on funding will place
1.3.7 Older people pressure on hospital services. Furthermore, climate
breakdown has serious implications for our health,
The large majority of older people in Auckland DHB are
wellbeing, livelihoods, and the structure of organised
able to live unassisted in their own homes. Over half
society. We therefore need to plan and develop hospital
(52%) of people who are 85 years or older receive no
services to manage this demand. Fully integrated services
funded living assistance, while 26% are funded to live in a
with a focus on prevention and good access to primary
rest home or private hospital and 22% have some funded
care services will be essential to meet the future health
support at home. Older people have greater needs for
needs of the population.
health services and hospital care and occupy about 45%
of our medical/surgical beds. With the projected increase Demand for emergency department services is
in the population aged 65 years and over, meeting the increasing
associated increase in demand for health care will be
challenging.
25
Over half of people aged 85+ years live with no funded 20
ASR per 100
support
15
10
5
52.3% 0
2007/08
2008/09
2009/10
2010/11
2011/12
2012/13
2013/14
2014/15
2015/16
2016/17
2017/18
15.7% 22.0%
10.0%
Māori Pacific Asian Other
7
Health Needs Assessment 20202 Introduction
DHBs are required to regularly investigate, assess and monitor the health status of their resident population, and their
need for services. The purpose of needs assessment is to bring about change beneficial to the health of the population.
The needs assessment forms an integral part of the overall planning cycle, informing both funding decisions and the
strategic planning process.
Te Tiriti o Waitangi
Government health priorities
Health Needs Prioritise work and
funding programme
Assessment
(statement of
intent and annual
plan)
Agree annual
Monitor and report
plan/funding
on outputs, impacts
agreement with
outcomes
Minister of Health
Manage provider Implement plans
relationships
(includes payment)
Purchase
It is envisaged that this needs assessment will be a living document and its content regularly updated as new data
become available. It forms part of a suite of resources that includes needs assessments and health plans for population
subgroups.
For key topic areas, we will undertake more detailed assessments and these will be published as separate documents.
For further information, contact the Planning and Health Intelligence Department, Auckland and Waitematā DHBs.
2.1 Equity
Through assessing the health needs of our population, we can identify and reduce inequalities, and produce better
health outcomes for the population as a whole. In this assessment, we concentrate on describing the health of
Auckland residents compared with that of New Zealand overall, and on highlighting inequalities within the district and
between particular groups of the population. This helps to guide the DHB’s equity framework, under which the DHB
selects high-level outcome measures where equity gaps exist and aims to reduce these gaps in the medium term.
8
Health Needs Assessment 20202.3 Needs assessment and Māori
Government health priorities guide health sector priorities specifically focus on addressing Māori health
development. These include acknowledging the special outcomes and reducing health inequalities.
relationship between Māori and the Crown under Te Tiriti
o Waitangi. In Auckland, this is particularly recognised in In partnership with Waitematā and Northland DHBs, we
the relationship between the DHB and Te Rūnanga o established a new Māori health committee with our iwi
Ngāti Whātua. The principles of Te Tiriti o Waitangi partners to collaboratively achieve Māori health equity
(partnership, participation and active protection) apply to and advance Māori health gain. The Northern Iwi-DHB
health and health service provision. Article 3 of Te Tiriti o Partnership Board is called Kōtui Hauora.
Waitangi provides for equal rights for Māori with non‐
Māori. While many Māori in Auckland enjoy better A Māori Health Pipeline was set up to accelerate projects
health than Māori in other parts of New Zealand, and that address inequities in life expectancy and/or have
Māori life expectancy in Auckland DHB is almost 78 years, significant potential for Māori health gain. While
1.9 years above the national average for Māori across primarily focused on projects in Auckland and Waitematā
New Zealand (76 years) at birth (2017-19), inequalities in DHBs, some extend to or are specific to Counties
health outcomes for Māori are still apparent in this DHB Manukau and Northland DHBs.
when compared with non-Māori. Government health
Undertaking health needs assessments has a number of implications:
Wherever possible, we provide information on Māori health needs as well as the health needs of the
general population.
We need to ensure that collection of data about Māori is as accurate as possible. In particular this means we
need to ensure that ethnicity recording is accurate. This is an area of ongoing work and improvement for
Auckland DHB.
We need to report information that describes health from a Māori world view as well as a mainstream world
view. This is very challenging because almost all of the information in this document is derived from routinely
collected data sources. These data sources have limited information on a broad perspective of health (rather
than disease) and even more limited information that describes some perspectives that are important to Māori.
We recognise this limitation and the need to attempt to address this in on-going work.
We need to specifically address Māori health needs rather than simply doing so in the context of assessing the
needs of the overall population. We need to involve the Māori community in the development of health needs
assessments. This was not done in the development of this document but development of Māori Health Needs
Assessment for Auckland DHB in the future will factor in the engagement and involvement of Māori in the
community.
9
Health Needs Assessment 20203 Our Population
Auckland DHB serves the population residing on the Auckland isthmus and the islands of Waiheke and Great Barrier. It
is an area of stunning natural beauty. Residents enjoy easy access to green spaces, parks and beaches, and Auckland
ranks highly among surveys of the world’s most liveable cities. At the same time, it ranks as the fourth least affordable
city in the world for housing (Demographia 2017). The Auckland Council divides the area between several local boards;
these are:
Waitematā, stretching from Westmere in the west to Parnell in the east and including the central business
district and the suburbs of Western Springs, Grey Lynn, Arch Hill, Newton, Herne Bay, Ponsonby, St Marys Bay,
Freemans Bay, Eden Terrace, Grafton and Newmarket;
Albert-Eden, covering from coastal Pt Chevalier in the west across to Greenlane and including Mt Albert,
Mt Eden, Waterview, St Lukes, Balmoral, Sandringham, Morningside, Kingsland, and Epsom;
Orakei, covering Remuera, Ellerslie, Meadowbank, St Johns, Ōrākei, Mission Bay, Kohimarama, Saint Heliers
and Glendowie;
Puketapapa, bordering the Manukau Harbour, including Three Kings, Mt Roskill, Hillsborough, Waikowhai,
Lynfield and Wesley;
Maungakiekie-Tāmaki, which covers an area from the Tamaki estuary west across to the inner Manukau
Harbour and includes Glen Innes, Point England, Tamaki, Panmure, Mount Wellington, Penrose,
Onehunga, Te Papapa and Royal Oak;
Whau (part) in the west of the isthmus, with the suburbs of Kelston, Rosebank, New Lynn, Avondale,
New Windsor, Blockhouse Bay and Green Bay;
Otahuhu, part of the Otahuhu-Mangere local board area;
Waiheke Island;
Great Barrier Island.
There are 507,370 people living in the Auckland district in 2020/21, accounting for just under 10% of the national
population. The age composition of Auckland residents is somewhat different from the national picture, with 34% in
the 25-44 year-old age group, compared with 27% in this age group nationally. Auckland has 12% of its population in
the 65+ year-old age group, compared with 16% nationally.
By ethnicity, our population is 8% Māori, 11% Pacific, 34% Asian and 47% European/Other. Just over one-third of Māori
and Pacific people live in the south-east of the district in Maungakiekie-Tamaki, with two-thirds spread across the
remainder of the district. Half of our Indian population lives in the south-west in Puketapapa and Whau, while our
Chinese and other Asian population is fairly evenly spread, although more sparse in the south-west. Seventy percent of
the European/Other population live in the north/central wards of Waitematā, Orakei and Albert/Eden. Our Pacific
population is predominantly Samoan (43%), Tongan (31%) and Cook Island Māori (13%). Our Asian population is
diverse, but is predominantly Chinese (39%) and Indian (34%). Auckland’s population is urban, with only 0.2% of our
population living in rural areas (Great Barrier Island). (Source: Statistics New Zealand, population projections, updated
2019, excluding results of 2018 census post-enumeration survey.)
Localities: these are geographic areas used by the DHB for service delivery and are groupings of Auckland Council local
boards. Owairaka = Albert-Eden board; Rangitoto = Waitematā + Waiheke + Great Barrier Island boards; Orakei =
Orakei board; Whau = Puketapapa board plus the part of Whau board that falls within Auckland DHB; Maungarei =
Maungakiekie-Tamaki board plus the part of Mangere-Otahuhu board that falls within Auckland DHB.
10
Health Needs Assessment 2020Figure 3.1: Ethnicity of our population 2020/21 Figure 3.3: Age structure of Auckland DHB in 2020/21
and 2040/41
Māori Pacific Asian European /Other
90+ years
80-84 years
Male Female
8.1% 70-74 years
2040/41
60-64 years
11% 50-54 years 2020/21
40-44 years
30-34 years
47% 20-24 years
10-14 years
00-04 years
7% 5% 3% 1% 1% 3% 5% 7%
34%
Source: Statistics NZ Population projections 2020 aligned to 2018
census
Figure 3.4: Projected change in Auckland DHB
By age group, our population is 16% children (aged population aged >65 years, 2040/41
under 15 years), 15% young people (15-24 years), and
120,000
12% older people (65 years or older). However, our
Māori, Pacific and Asian populations are considerably
100,000
younger, with 43% of Māori and Pacific and 31% of
Asians under the age of 25, compared with 25% for 80,000
European/Other people. These populations are also
notable for the small proportion of older people they 60,000
contain, at 8% or less of their total populations,
compared with 17% aged over 65 years for 40,000
European/Other people.
20,000
Figure 3.2: Age structure by ethnic group
-
100% 2020/21 2040/41
80% 65-74 75-84 85+
60%
40%
Figure 3.5: Projected change in Auckland DHB
20% population by ethnicity, 2040/41
0%
600,000
Māori Pacific Asian European
/Other 500,000
0-14 15-24 25-44 45-64 65+
400,000
Population
By 2040/41, Auckland’s population is projected to 300,000
increase by 79,000 people, making it 16% larger than it
is now. The population will also be considerably older, 200,000
with the number of people aged 65 years and older 100,000
expected to increase from the current 61,500 to
approximately 105,000, and making up 18% of our -
population, compared with 12% at present. Our Māori 2020/21 2040/41
and Asian populations will also grow; our Māori Māori Pacific Asian European /Other
population by 14% and Pacific by 15%; our Asian
population is projected to grow by 50%. We need to Source: Statistics NZ Population projections, 2020 set aligned to
plan and develop our services to meet the needs of our Census 2018
changing and expanding population.
11
Health Needs Assessment 2020Figure 3.6: Population by locality and age group, 2020 Figure 3.7: Population by locality and ethnic group,
estimated resident population incl. PES results 2018
120,000 120,000
100,000 100,000
Population
Population
80,000 80,000
60,000
60,000
40,000
40,000
20,000
20,000
0
-
Māori Pacific Peoples Asian European /Other
0-14 15-24 25-44 45-64 65+
3.1 Migrants
Auckland DHB has a large migrant population. Almost accessing health services include varied levels of
half of Auckland residents (45%) were born overseas resettlement support, difficulty accessing language
(compared with 31% nationally, and 20% for areas services, financial and transport stressors, lack of
outside of Auckland region). This includes 58,300 knowledge of the health system, cultural competence of
people of European/Other ethnicity, 21,000 Pacific the health workforce, discrimination and lack of
people and 119,000 Asian people; as a percentage, 81% awareness within health services of refugee and current
of Asian people, 41% of Pacific people and 27% of asylum seeker unique needs and experiences.
people of European/Other ethnicity were born
overseas. Of these migrants, 32% have lived in New
Zealand for less than 5 years. Figure 3.1.1: Number of migrants living in Auckland by
duration of residence, 2018
English language ability is important for participation in
New Zealand society. Among Auckland’s adults in 2018, 140,000
an estimated 4.5% (21,000 people) could not hold a 120,000
conversation in English about everyday things. Outside
100,000
of Auckland region, 10% of people speak both English
Population
and another language (other than Māori), but in 80,000
Auckland DHB this rises to 30%. The Auckland DHB 60,000
Interpreting Service provides face-to-face and
40,000
telephone conference call interpretation, appointment
confirmation and document translation, in both primary 20,000
and secondary health care settings, to assist this group -
to access health services. Pacific Asian European
/Other
Available evidence suggests that both former refugee Less than 5 years 5-10 years 11 years or more
and current asylum seekers including those from
transgender, non-binary and gender diverse Source: Census 2018 Usually Resident population
backgrounds face significant barriers to accessing
primary care, mental health and addiction, pharmacy,
oral health and maternity services. Key barriers to
12
Health Needs Assessment 20204 Population Health Drivers
Many factors affect the health of individuals and communities. Whether people are healthy is determined, for the
most part, by an individual’s socio-economic circumstances and their environment. To a large extent, factors such as
where we live, the state of our environment, genetics, our income and education level and our relationships with
friends and family all have considerable impact on health, whereas the more commonly considered factors such as
access and use of health care services often have less impact. Most of the information in this section is taken from the
2013 census, NZ Health Survey pooled results for 2011-2013, and from the Quality of Life (QoL) Survey 2012 (note: QoL
data includes all of Whau and Mangere-Otahuhu wards).
4.1 Ethnicity
Ethnicity is a critical component of health inequalities. Explanations for this include institutional racism
Māori and Pacific people have had consistently poorer (where organisations and structures discriminate
health than other ethnic groups since the 19th century. against certain ethnic groups, either overtly or
Although this is linked to socio-economic status, both unintentionally) and for Māori, the ongoing effects of
populations still have poorer health when factors such colonisation.
as income, occupation, education, neighbourhood and
personal behaviour are accounted for.
4.2 Deprivation
The index by which we measure the relative prosperity Figure 4.2.1: Deprivation by ethnicity
or deprivation of our population is calculated from
census information. It is based on averaged 100%
information about the households and individuals in 80%
% of population
the area and combines census data on income, Q1
employment, benefit dependence, educational 60%
Q2
qualifications, internet access, home ownership,
40% Q3
overcrowding, cold/mouldy housing and single parent
households. The ranked categories are calculated so 20% Q4
that, as nearly as possible, one-tenth of the population Q5
0%
of New Zealand falls into each. The index applies to
areas, not to individual people. The 1 to 10 scale is
ordinal, not interval, i.e. the difference between
adjacent points on the scale is not standard.
NZ Deprivation Quintiles; Q1 = least deprived
(University of Otago, NZDep18 deprivation index by
Statistical Area 1 based on 2018 census). The chart of deprivation by ethnicity is approximate only and
is calculated from SA2 data.
On this basis, Auckland has a similar profile to
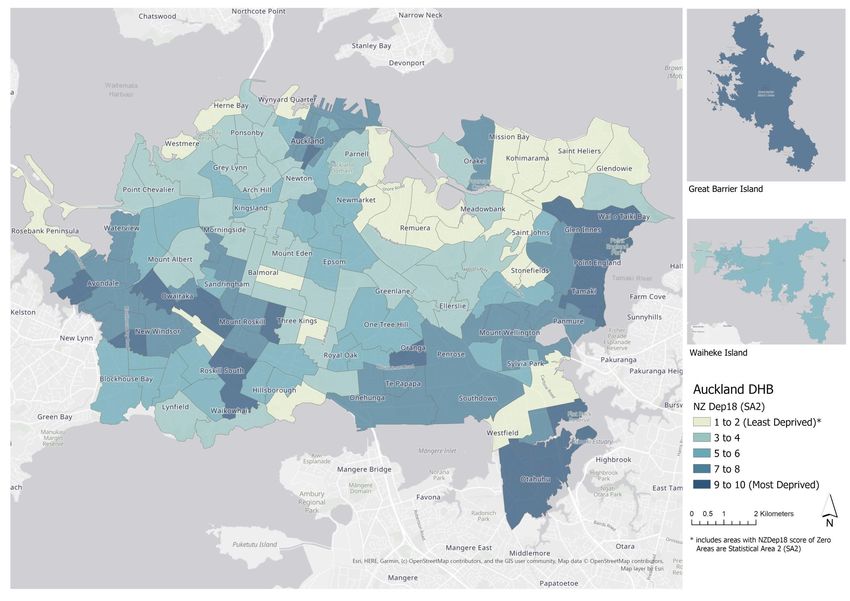
New Zealand as a whole. Almost one in five (18%) of Figure 4.2.2: Proportion in each NZ deprivation
our total population, and one in four (24%) of children quintile, by locality
aged under five years, live in the poorest areas
100%
(NZDep18 decile 9 and 10, or Quintile 5), and 18% of
our population live in areas of the wealthiest two
80%
deciles. Māori and Pacific people are much more likely
to live in NZDep18 Quintile 4 and 5 areas. The most
60% Q1
deprived areas are concentrated in Rosebank/
Avondale in the west, Mt Roskill and the CBD, and the Q2
40%
eastern and southern areas from Glen Innes to Mt Q3
Wellington and Otahuhu. The least deprived areas are Q4
20%
Orakei, Glendowie, Remuera, Herne Bay and Mt Eden.
Q5
0%
13
Health Needs Assessment 2020Figure 4.2.3: Geographic spread of deprived areas, Auckland DHB 2018
Health Needs Assessment 2020
144.3 Income, Education and Employment
Economic factors such as income, occupation and At the time of the 2018 census, Māori and Pacific
education are powerful determinants of health. The people were more than twice as likely to be
median annual income for Auckland individuals aged unemployed as other ethnicities, both at 10%,
15 years and over in 2018 was $36,500, higher than the compared with 4.1% of Europeans/Others and 6.6% of
national figure of $31,800. When the high cost of Asian people.
housing in the Auckland region is taken into account,
disposable income is lower than this figure suggests. Figure 4.3.1: Percentage of population aged 15+ years
Median income ranges from $56,400 for a European with income under $20,000 by ethnicity, 2018
male to $20,800 for an Asian female. While 27% of 50%
European/Other people have an income of under
$20,000 per year, the percentage is much higher for 40%
Māori (40%), Pacific (45%) and Asian people (43%).
% of population
The Quality of Life survey in 2012 found that almost 30%
one in four people (24%) felt that they did not have
enough income to meet their everyday needs. 20%
Overall, 11% of people in Auckland left school with no
10%
qualification, but this figure is much higher for Pacific
people (28%) and Māori (21%). In contrast, 9% of
0%
Asian people have no qualifications. At the high end of
Māori Pacific Asian Euro Total
educational achievement, 52% of Asian people have /Other
tertiary or higher qualifications and 48% of European/ Auckland DHB NZ
Other people, but only 26% of Māori and 12% of Pacific
people. (Census 2018.) Source: Census 2018
4.4 Housing
Poor quality housing, including poor physical living households in Rangitoto locality (21%) report using no
conditions, overcrowding and lack of heating fuel, possibly reflecting the large number of
constitutes a significant health risk, particularly for the apartments. There are also high proportions using no
young and old. In Auckland DHB, 16.4% of people live fuel in Maungerei (14%) and Whau (9%). Overall, one
in crowded households. Crowding is more common in four people (26%) report that their home is damp
among Māori (23%), Pacific (44%) and Asian people and 23% report mould, with higher proportions for
(22%) than European/Other (7%) (Census 2018). Māori (38% damp and 32% mould) and Pacific peoples
Overcrowding is most common in Maungarei (31%) (41% damp and 39% mould).
and Whau (20%), but in every locality except Orakei,
the overcrowding rate is higher than the national Auckland region has the least affordable housing for
average of 11%. Across the DHB, 22% of children aged purchase in New Zealand, with an affordability index
under 15 years live in crowded houses. (the ratio of cost to income) of 31.7, 43% higher than
the New Zealand average of 22.2 (Massey affordability
Figure 4.4.1: Proportion of people living in a crowded index report May 2019). Auckland region is also the
house by locality, 2018 least affordable region for renters, with households on
average paying 35% of income on rent, compared with
40% a national average of 31%. Renting is common in
Auckland, with 60% of people living in rented housing,
% of people
30%
compared with 48% nationally (Census 2018). The
20% 2013 census recorded 2,040 Auckland residents as
10%
homeless (living in mobile and improvised dwellings,
roofless or rough sleepers, or living in a boarding
0% house, night shelter or welfare institution). Combined
with data on household composition and crowding,
Amore (2016) estimated that 1.4% of Auckland region’s
population experience severe housing deprivation,
Nationally, 3.9% of households use no heating fuel defined as homelessness or insecure accommodation
versus 11.1% in Auckland DHB. A high proportion of (vs. 1.0% for New Zealand).
15
Health Needs Assessment 20204.5 Environmental factors
Auckland has relatively good air quality versus other 5-14 years. The General Social Survey 2018 found that
cities and towns in New Zealand. However, some parts 44% of Auckland residents considered air pollution to
experience quite high air pollution, primarily generated be a problem.
by motor vehicle emissions and indoor heating fires.
The Health and Air Pollution in New Zealand 2012 Greater public transport use would help to reduce air
report estimated that, in 2006, in adults aged over 30 pollution. Car transport remains the dominant mode
years, Auckland DHB had 56 premature deaths per year of travel to work in Auckland, at 83%. Bus or train is the
due to motor vehicle pollution and 37 due to pollution mode for 8% of people (Census 2013). Means of travel
from domestic fires. Māori made up 11% of these to work is relatively stable since 1996, although there
deaths (6 and 4, respectively). was a slight increase in the use of public transport and
a slight decrease (by 3%) in car use.
Air pollution also causes hospital admissions for cardiac
and respiratory problems. In Auckland in 2006, motor Most people living in Auckland DHB have access to safe
vehicle pollution caused 9 cardiac and 18 respiratory reticulated sources of drinking water. In the 2018
admissions; of the latter, 6 were for children aged census, 4% of households reported that they did not
under 5 years and 4 for those aged 5-14 years. Indoor have drinkable tap water, compared with 3.2%
heating fires caused 7 cardiac and 12 respiratory nationally. More than two-thirds of Auckland residents
admissions; of the latter 4 were for children aged felt that there was pollution of oceans, lakes, streams
under 5 years and 3 for those aged or the sea (GSS 2018).
4.6 Climate Breakdown
Climate change has serious implications for our health, and communication networks, and reduce access to
wellbeing, livelihoods, and the structure of organised health care. In 2017, an extreme rainfall event
society. Its direct effects result from rising disrupted water processing and reduced Auckland’s
temperatures and changes in the frequency and water supply by 20%; subsequently, a severe drought
strength of storms, floods, droughts, and heat waves, in 2020 necessitated water restrictions. A storm in
with physical and mental health consequences. The 2018 cut electricity to 180,000 homes and businesses.
impacts of climate change are also mediated through The displacement of ice at the poles and on mountains
less direct pathways, including changes in crop yields, into the sea, redistributing weight on the earth’s crust,
the burden and distribution of infectious disease, and is predicted to increase the number of earthquakes.
in climate-induced population displacement and
violent conflict. Many of these effects are already
4.6.2 Slow-onset impacts
evident (Lancet 2017).
Global average temperatures for the past three years Food production will become more difficult as
th
are more than 1°C higher than the 20 century average temperature and rainfall patterns change, pollinators
for the past three years. Temperature increase could reduce, and pests and diseases increase, resulting in
surpass 1.5°C, at least temporarily, in the next five reduced availability and affordability. This is likely to
years. Recent research suggests that a sustained impact more heavily on poorer people. Flooding and
increase of 2°C will result in a sea level rise of at least droughts already affect food production and prices.
6m. Efforts to reduce greenhouse gas emissions are likely
to reduce production of ruminant meats and dairy
products. Consumption of red meat has known
4.6.1 Rapid-onset climate breakdown events associations with adverse health outcomes and a
reduction in supply and consumption could benefit
Increased frequency of fires, floods, storm tides and
health in reducing colorectal cancer and heart disease.
extreme rainfall events affect public health. Apart
Warmer water, both sea and fresh, increases harmful
from risks of direct injury, these events can result in:
algal blooms with potential risks to drinking water
- disease outbreaks
supplies. Toxic marine algae can contaminate shellfish
- toxic chemical contamination
that cause gastrointestinal and neurological problems.
- effects of damp buildings
- mental health issues, particularly anxiety and Bacterial growth increases in warmer sea and fresh
depression. water, and can lead to infected wounds on contact.
Increased concentrations of salmonella and E. coli in
The impact will destroy infrastructure, including
freshwater streams, due to high runoff or low water
housing, roads, water supply, waste water, electricity
16
Health Needs Assessment 2020flow (drought), can cause illness ranging from nausea The number of organisms that transmit infectious
to renal failure. diseases, e.g. ticks, fleas and mosquitos, is likely to
A doubling in the number of hot days (above 25°C) is increase (although currently the number of flying
expected by 2100. Hotter weather will particularly insects is declining sharply). Warmer conditions may
affect people with diabetes, cardiovascular disease and increase the rates of breeding for disease carriers, and
mental health issues, increasing attendance at for the infectious agents themselves. Emerging
emergency departments and mortality rates. Outdoor diseases e.g. chikungunya and zika viruses are already
workers may experience more incidents of heat stroke present in the Pacific Islands and could become a risk
and kidney impairment. to New Zealand if warmer temperatures allow disease-
Outdoor air quality may be affected by reduced rainfall transmitting mosquitos to become established here.
and wind, leading to air stagnation, which allows The population of New Zealand, particularly of
pollutants to build up. This may be mitigated by a Auckland, will increase when the country begins to
reduction in emissions from vehicles as electrification receive climate change refugees. Several Pacific Islands
of the transport system continues. are experiencing problems with extreme weather
- NIWA predicts fewer cold nights and frosts, which events, which destroyed housing, crops, and fresh
may reduce emissions from wood-fired heating of water supply, and caused coastal flooding of farm land.
homes in winter, improving air quality. Fiji, Papua New Guinea and Bougainville, and the
- Drought may increase air-borne soil particles. Solomon Islands, collectively representing 85% of the
- Earlier growing seasons may increase the duration total Pacific population, struggle to manage internal
of high pollen counts in the air, increasing the climate-related displacement and resettlement.
period and rates of allergic illnesses, e.g. asthma.
4.7 Social factors
Social support and good social relations are important Figure 4.7.1: Proportion of people who feel isolated by
contributors to health. Social support provides ward, 2012
emotional and practical resources that people need.
60%
Belonging to a social network of communication and Always Most of the time Sometimes
mutual obligation makes people feel cared for, loved, 50%
esteemed and valued, and has a powerful protective 40%
effect on health. Supportive relationships may also
30%
encourage healthier behaviour patterns (WHO 2003).
20%
The Quality of Life survey reports that about half (48%)
10%
of people in Auckland feel a sense of community where
they live, and 62% feel that people can usually be 0%
trusted. Over one-third (38%) of people feel isolated
some of the time. Many older people and older
women in particular, live alone. Four out of five people
(80%) are happy with their quality of life, but only 58%
are happy with their work/life balance.
Source: NZ Quality of Life Survey 2012
Internet access, a cornerstone measure of opportunity,
information and communication, is available in 93% of Figure 4.7.2: Proportion of children living in single
people in Auckland DHB compared with 90% nationally. parent families, 2013
A mobile phone is available to 93% of people (Census
2018). 40%
Auckland DHB NZ
Single parenting affects almost every part of the 30%
population. While single-parent homes exist in
significant numbers across nearly all ethnicities (16%), 20%
some ethnicities have higher rates than others, for
10%
example, 33% of Māori children live in single parent
families. Single-parent homes often have lower socio-
0%
economic status, and children are at an increased risk Māori Pacific Asian Other Total
of emotional and behavioural problems, and poor
school performance. Source: Census 2013
17
Health Needs Assessment 2020You can also read