Central East Sub-Regional Economic Strategy - Prepared by RPS in collaboration with the Wheatbelt Development Commission Funded by Royalties for ...
←
→
Page content transcription
If your browser does not render page correctly, please read the page content below
Central East Sub-Regional Economic Strategy
Prepared by RPS in collaboration with the Wheatbelt Development Commission
Funded by Royalties for Regions, State Government of Western Australia

                                                                   rpsgroup.com.au
Valuable support and input to the project was provided by the Central East Local Governments
including:
Shire of Bruce Rock;
Shire of Kellerberrin;
Shire of Koorda (Avon);
Shire of Merredin;
Shire of Mount Marshall;
Shire of Mukinbudin;
Shire of Narembeen;
Shire of Nungarin;
Shire of Trayning;
Shire of Westonia; and
Shire of Yilgarn.
Prepared by: In partnership with:
RPS AUSTRALIA EAST PTY LTD THE WHEATBELT DEVELOPMENT
COMMISSION
38 Station Street 298 Fitzgerald Street
Subiaco, WA, 6008 NORTHAM WA 6401
T: +61 8 9211 1111 T: 08 9622 7222
F: +61 8 9211 1122 F: 08 9622 7406
E: mark.wallace@rpsgroup.com.au E: info@wheatbelt.wa.gov.au
W: www.wheatbelt.wa.gov.au
Client Manager: Mark Wallace
Report Number: 114878-1
Version / Date: April 2015_FINAL
rpsgroup.com.au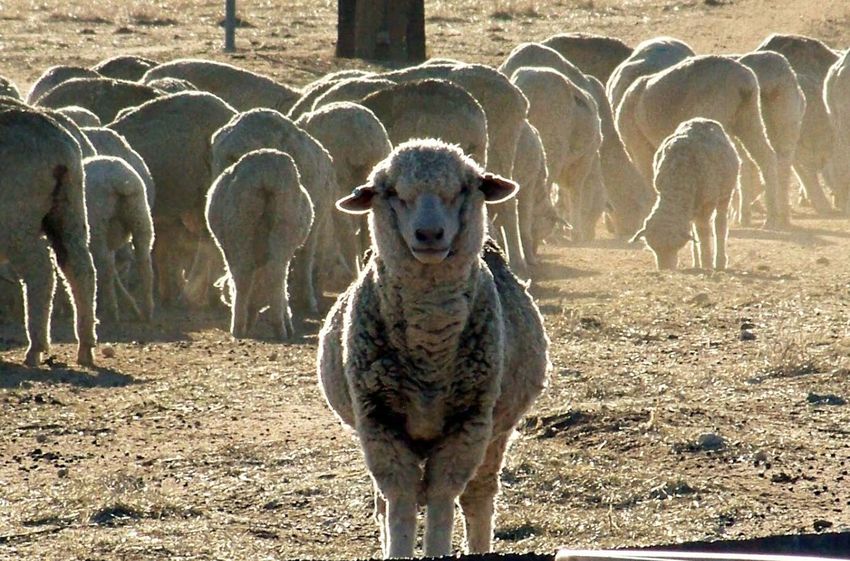
Central East Sub-Regional Economic Strategy

Document Status
 Version      Purpose of Document                       Orig                Review               Review Date
 Draft A      Draft Report for client review            SS                  MW                   7.11.2013
              Draft Report incorporating preliminary
 Draft B                                                MW                  TC                   23.06.2014
              client comments
              Draft Report incorporating final client
 Draft C                                                MW                  TC                   24.12.2014
              comments
              Draft Report incorporation minor
 Draft D                                                MW                  TC                   20.02.2015
              amendments
 Final        Final Report                              MW                  TC                   9.04.2015

Disclaimer

This document is and shall remain the property of RPS. The document may only be used for the purposes for which it
was commissioned and in accordance with the Terms of Engagement for the commission. Unauthorised copying or use
of this document in any form whatsoever is prohibited.

114878-1; April 2015_FINAL                                                                          Page iii
Central East Sub-Regional Economic Strategy

Summary
The Central East Sub-region represents the heart of dryland broadacre grain production in the Wheatbelt.
Home to 10,345 people in 2011, the Central East is the largest sub-region in the Wheatbelt by land area. Its
population is primarily concentrated in the major townships of Merredin, Southern Cross and Kellerberrin,
which act as service centres for the Sub-regional economy. The key findings of this Strategy, developed
collaboratively by RPS and the Wheatbelt Development Commission and in consultation with the Central
East Shires, are outlined on the following page.

The core competitiveness and strengths of the Central East economy in agriculture and food production have
been increasingly complemented in recent years by emerging mining and support services sectors. This
increase in economic diversity and dynamism, and the Sub-region’s strategic location adjacent the Goldfields
region, present considerable opportunities for major growth in local economic activity and prosperity.

This Sub-regional Economic Strategy for the Central East provides economic analysis and evidence based
guidance to assist in investment and decision making. It can therefore make a major contribution to sub-
regional and whole-of-region planning. This Strategy also establishes a framework for the promotion and
facilitation of economic and population growth across all Local Government Authorities (LGAs) of the Central
East.

114878-1; April 2015_FINAL                                                                      Page iv
Central East Sub-Regional Economic Strategy

114878-1; April 2015_FINAL                                Page v
Central East Sub-Regional Economic Strategy

Contents
SUMMARY ................................................................................................................................................. IV
1.0      INTRODUCTION ................................................................................................................................1
         1.1      Background .............................................................................................................................1
         1.2      Project Purpose.......................................................................................................................1
         1.3      Central East Sub-Region.........................................................................................................1
         1.4      Strategy Structure ...................................................................................................................2
         1.5      Approach .................................................................................................................................3
         1.6      Glossary and Abbreviations ...................................................................................................4
2.0      FUTURE CENTRAL EAST .................................................................................................................5
         2.1      Global Food Demand & Climate Change................................................................................5
         2.2      Mining & Support Services .....................................................................................................6
         2.3      Population Ageing...................................................................................................................7
3.0      PROFILE OF THE CENTRAL EAST ECONOMY................................................................................9
         3.1      Population and Socio-Demographics ....................................................................................9
         3.2      Labour Force and Skills ........................................................................................................10
         3.3      Employment, Industry and Investment ................................................................................ 11
         3.4      Housing and Affordability .....................................................................................................13
         3.5      Community Services and Facilities ...................................................................................... 15
4.0      KEY ECONOMIC OPPORTUNITIES.................................................................................................22
         4.1      Broadacre Agriculture...........................................................................................................22
         4.2      Mining & Support Services ...................................................................................................25
         4.3      Population Services ..............................................................................................................30
5.0      OPPORTUNITY NETWORK ANALYSIS........................................................................................... 37
         5.1      Outline ...................................................................................................................................37
         5.2      Network Matrix ......................................................................................................................37
         5.3      Spatial Analysis.....................................................................................................................39
6.0      ECONOMIC DEVELOPMENT ACTIONS .......................................................................................... 42
APPENDIX A – LOCAL GOVERNMENT PROFILES.................................................................................. 52
APPENDIX B – INDUSTRY VALUE ADD ...................................................................................................82
APPENDIX C – SOCIO-ECONOMIC INDICATORS MATRIX...................................................................... 83

114878-1; April 2015_FINAL                                                                                                                 Page vi
Central East Sub-Regional Economic Strategy

Tables
Table 1 Small Business Population and Rate, Central East LGAs, 2012 ...................................................... 12
Table 2 Economic Development Actions .....................................................................................................43

Figures
Figure 1 Sub-Regions and LGAs, Wheatbelt ............................................................................................2
Figure 2 Economic Strategy Structure ......................................................................................................3
Figure 3 Production per Hectare, Wheat, WA ...........................................................................................5
Figure 4 Share of Population aged 65+, Australia..................................................................................... 7
Figure 5 Employment by Industry, Western Australia, 2003-2014 ............................................................. 8
Figure 6 Current and Future Residential Population ................................................................................. 9
Figure 7 Unemployment and Participation Rate, Central East Sub-Region LGAs, 2011 .......................... 10
Figure 8 Share of Industry Value Add, Central East Sub-Region, 2012/13 .............................................. 11
Figure 9 Share of Locally Registered Businesses, Central East Sub-Region LGAs, 2009 to 2012........... 12
Figure 10 Median House Prices, Central East Sub-Region, 2006 and 2013 ............................................ 13
Figure 11 Median Multiples, Central East Sub-Region, 2011 .................................................................. 14
Figure 12 Fertility Rate, Central East Sub-Region and Greater Perth, 2011 ............................................ 16
Figure 13 Share of Residential Population Aged 0-14, Central East Sub-Region, Greater Perth and
         WA, 2011 ................................................................................................................................ 17
Figure 14 65+ Population and Aged Care Beds, LGA Share of Central East, 2012 ................................. 19
Figure 15 Annual Coarse Grain Delivered, Central East ......................................................................... 24
Figure 16 Cereal Crop Production and Hectares Sown, LGA Share of Central East, 2012/13 ................. 24
Figure 17 Outlook for Iron Ore and Gold Production, Australia, 2011-2018 ............................................. 26
Figure 18 Yilgarn Iron Province .............................................................................................................. 27
Figure 19 China Hanking Holdings Limited, Gold Mine, Yilgarn, 2013..................................................... 28
Figure 20 Mineral Production, Central East Sub-Region, 2001/02 to 2011/12 ......................................... 30
Figure 21 Proportion of Persons Aged 15-64 years Highest Level of Non-School Qualification,
         Australia, 2001, 2005 and 2009 ............................................................................................... 31
Figure 22 Breakdown of Visitors to Central East Sub-Region, by Type, 2008-12..................................... 32
Figure 23 Opportunity Network Matrix, Central East Sub-Region ............................................................ 38
Figure 24 Spatial Distribution, Broadacre Agriculture, Central East Sub-Region ..................................... 39
Figure 25 Spatial Distribution, Mining & Support Services, Central East Sub-Region .............................. 40
Figure 26 Spatial Distribution, Population Services, Central East Sub-Region ........................................ 41

114878-1; April 2015_FINAL                                                                                                           Page vii
Central East Sub-Regional Economic Strategy
1.0 Introduction
1.1 Background
The Central East Sub-region (the Central East) covers an expansive area in central Western Australia,
bordering the Midwest and Goldfields Esperance regions. It is home to a large number of small communities
supported by agriculture and mining sectors.
The Wheatbelt Development Commission sees merit in researching regional centres and their sub-regions in
context to each other, highlighting how the Central East functions as a distinct economic unit. Detailed
investigation at the sub-regional level is fundamental given the spatially-dispersed population and industry
profile of the Wheatbelt.
This Sub-regional plan is prepared by the Wheatbelt Development Commission and RPS for the Central
East. It will provide regional context and strategic planning to support economic and population growth in the
sub-region.
The findings in the sub-regional economic strategies undertaken in the Wheatbelt contribute to the inaugural
Regional Blueprint Investment Plan, prepared by Wheatbelt Development Commission in 2014. The
Blueprint Investment Plan outlines strategies, along with areas for intervention and investment that will drive
growth in the Wheatbelt.
1.2 Project Purpose
RPS has been engaged by the Wheatbelt Development Commission to prepare this Sub-regional Economic
Strategy for the Central East. This Strategy provides economic analysis and evidence based guidance to
assist in investment and decision making and will therefore make a major contribution to sub-regional and
whole-of-region planning. This Strategy also establishes a framework for the promotion and facilitation of
economic and population growth across all LGAs in the Sub-region.
1.3 Central East Sub-Region
For the purpose of this Strategy, the Central East Sub-region includes the following Local Government
Areas:
Bruce Rock;
Narembeen;
Kellerberrin;
Nungarin;
Koorda (Avon);
Trayning;
Merredin;
Westonia; and
Mount Marshall;
Yilgarn.
Mukinbudin;
This is illustrated in Figure 1.
Koorda, which is officially part of the Avon Sub-region, has been included in this analysis in response to the
recommendation of the Avon Sub-regional Economic Strategy. This reflects the economic, social and
environmental similarities of Koorda to the Local Government Areas of the Central East and that Koorda in
effect functions as part of the Central East economic area.
114878-1; April 2015_FINAL Page 1
Central East Sub-Regional Economic Strategy
Figure 1 Sub-Regions and LGAs, Wheatbelt 1
1.4 Strategy Structure
This Strategy is comprised of the following key sections:
Future Central East– an overview of key global and national macro-economic drivers relevant to
the Central East Sub-region;
Profile of the Central East Economy – detailed profile of the Central East Sub-regional economy
including population and socio-demographics, labour force and skills, employment and industry,
housing and affordability, and community services and facilities. Analysis covers each LGA and
the broader sub-region;
Key Economic Opportunities – identification and summary of key economic opportunities for the
sub-region including rationale, drivers and trends, and sub-regional characteristics; and
Opportunity Network Analysis – identification and analysis of the distribution of economic
competitive advantages and opportunities across towns and LGAs in the Central East.
1
WDC (2012), Provided by Wheatbelt Development Commission.
114878-1; April 2015_FINAL Page 2
Central East Sub-Regional Economic Strategy
In addition, concise Local Government profiles, distilling the results of the Strategy for each local area
have been developed and included in Appendix A.
The Strategy’s structure is illustrated in the following diagram.
FUTURE CENTRAL EAST
PROFILE OF THE CENTRAL EAST
ECONOMY
KEY ECONOMIC
OPPORTUNITIES
OPPORTUNITY NETWORK ANALYSIS
ACTION PLAN
LOCAL GOVERNMENT PROFILES
Figure 2 Economic Strategy Structure
This structure ensures the flexibility of the Strategy, recognising the various roles and audiences of
the document. These include:
Providing an overall strategy for the economic development of the sub-region;
Informing sub-regional and regional land use and strategic planning activities;
Providing an evidence base for investment prospectuses and funding business cases;
Providing content for marketing and branding material for the sub-region; and
Informing and guiding all levels of Government in major investment and expenditure decisions.
To meet the requirements of these various audiences, this Strategy has been structured to allow key
sections and analysis to be read and utilised independently of the broader document.
1.5 Approach
This Sub-regional Economic Strategy has been developed by RPS in partnership with the Wheatbelt
Development Commission. This project has applied the principles of “collaborative consulting” where
the project client is actively involved in the development of the report including data collection,
strategic overview and stakeholder consultation tasks.
This approach is highly advantageous for a number of reasons:
Draws upon the Wheatbelt Development Commission’s existing resources to support data
collection and consultation tasks;
Allows the Wheatbelt Development Commission’s unique understanding of the region to be
incorporated into the Strategy;
Ensures value for money for the client by allowing RPS to concentrate on more detailed modelling
114878-1; April 2015_FINAL Page 3Central East Sub-Regional Economic Strategy
and strategic analysis tasks; and
Enables strategic and objective analysis to be undertaken by RPS, ensuring the Strategy’s
evidence base is rigorous and suitable to inform investment decision and funding business cases.
1.6 Glossary and Abbreviations
Term/Abbreviation Definition
ABS Australian Bureau of Statistics
ABARES Australian Bureau of Agricultural and Resource Economics and Services
BREE Bureau of Resource and Energy Economics
BOM Bureau of Meteorology
DIDO Drive in, drive out – the commute of the mining sectors workforce by road.
FIFO Fly in, fly out – the commute of the mining sectors workforce by air.
GFC Global Financial Crisis
GRP Gross Regional Product
g/t Grams per tonne
LGA Local Government Area
Ratio measure of housing affordability. Represents the number of years of median
Median Multiple
household income required to equate to median house prices in an area.
MPS Mutlipurpose Service (Health)
Mt, Mtpa Million Tonnes Per Annum
RBA Reserve Bank of Australia
An episode of care for an admitted patient, which can be a total hospital stay (from
Separation admission to discharge, transfer or death), or a portion of a hospital stay beginning or
ending in a change of type of care (for example, from acute to rehabilitation)
T/Ha Tonnes per Hectare
WAPC Western Australian Planning Commission
WDC Wheatbelt Development Commission
114878-1; April 2015_FINAL Page 4Central East Sub-Regional Economic Strategy
2.0 Future Central East
The Central East Sub-region of Western Australia is home to 10,345 people in 20112, or some 2% of
Western Australia’s non-metropolitan population. It is primarily characterised as an agricultural Sub-
region with a large number of small towns and communities. The Central East’s sustainability and
prosperity in the future will be increasingly dependent on its connections with the global economy and
leveraging its natural advantages in a competitive environment.
2.1 Global Food Demand & Climate Change
Agriculture is the foundation industry of the Central East and broader Wheatbelt region. The Sub-
region includes 3,951,989 hectares of agricultural land in 2010/11 or some 4.0% of holdings in WA3.
Despite this, in 2013/14, the Central East produced over 2.15 million tonnes of coarse grains –
accounting for more than one eighth (13.7%) of total State grain production. This reflects the
comparatively large land holdings of Central East, offsetting lower per hectare yields.
Global food demand has increased in recent years in response to accelerating population growth and
growing incomes in developing countries4. This has led to a spike in food prices over the past 10
years following decades of real price declines in response to technology and land management-based
productivity increases 5. This productivity increase is evident in WA’s long term trend of wheat
production (tonnes per hectare). This is illustrated in the following figure.
2.5
2.0
Tonnes per Hectare
1.5
1.0
0.5
0.0
1901 1911 1921 1931 1941 1951 1961 1971 1981 1991 2001 2011
Figure 3 Production per Hectare, Wheat, WA6
Australia is the fifth largest exporter of wheat in the world 7 and Western Australia accounts for
approximately 18% of national production8. Australia’s competitive advantage in both broadacre crops
2
ABS (2012), Estimated Residential Population, Cat No 3218.0, Australian Bureau of Statistics, Canberra
3
ABS (2012) Agricultural Commodities, Small Area Data Cat No 7125.0, Australian Bureau of Statistics, Canberra.
4
RBA (2011), Bulletin March 2011, Reserve Bank of Australia, Melbourne
5
FOA (2012), OECD – FAO Agricultural Outlook 2012-2021, Food and Agricultural Organisation, Rome Italy
6
ABS (2012), Historical Selected Agricultural Commodities, Cat No 7124.0, Australian Bureau of Statistics, Canberra
114878-1; April 2015_FINAL Page 5Central East Sub-Regional Economic Strategy and horticulture production positions sub-regions like the Central East well to reap the reward of structural uplifts in global agricultural commodity prices. While livestock is currently run as a relatively small proportion of the broadacre agricultural enterprises in the Central East, there is the opportunity for further expansion of livestock production. Sheep numbers were at their highest in the Central East during 2004-05 at 2,113,837, from which numbers declined through to 2009-10. Sheep numbers have increased since this period and now represent almost 8% of the States flock. The trend from 2002-03 to 2012-13 indicates that this proportion is consistently high, varying between 7% and 8.3% of the State’s total sheep numbers reflecting changes in seasonal and market conditions 9. This provides an opportunity to build resilience into the farm business enterprise through livestock production in areas where the return on investment in livestock production is greater than that of broadacre agricultural production. The expansion of the livestock industry (sheep, wool) will be dependent on market conditions, access to markets, marketing, infrastructure, access to labour and pasture establishment. Underpinning any growth in the livestock industry will require the investment in upgrades to the State Barrier Fence to be completed to allow for greater stocking densities, and for some, the re-introduction of livestock into their farm enterprise. Agricultural production globally is expected to be significantly impacted by changes in global climatic conditions in the future. Analysis by the Australian Government indicates that south-west WA is likely to experience yield reductions in wheat in the long-term with other locations, particularly those in the dry margins expected to experience strong warming and significant reductions in rainfall 10. Projections indicate that wheat production in WA could decline by 8.9% by 2030 and 13.4% by 2050, with similar declines for sheep meat. Regional centres and economies dependent on agriculture may be adversely impacted. For this reason the development of innovation and technology to reduce or mitigate the impacts of seasonal variations and climate change on production is integral for the agricultural industry’s future. While seasonal variations in broadacre agricultural production occur from year to year, it is important for the industry to develop strategies to mitigate the impacts of medium- long term climate change. This combination of accelerating global food demand and agricultural production threatened by climate change will define the agricultural sector over the next 50 years. 2.2 Mining & Support Services The global economy continues to recover from the GFC, despite broader imbalances and underlying volatility in the short-term. This is expected to underpin continued structural demand for resource commodities and related services. The transformation of the Asian region into the economic powerhouse of the world is now an established trend, with Australia set to benefit from Asia’s appetite for raw materials and energy in the medium and long-term 11. 7 ABARES (2013), Agricultural Commodities Statistics, March 2013, Australian Bureau of Agricultural and Resource Economics and Sciences, Canberra. 8 ABS (2012), Historical Selected Agricultural Commodities, Cat No 7124.0, Australian Bureau of Statistics, Canberra. 9 DAFWA (2013), Unpublished Data, Western Australian Government, Perth 10 Australian Government (2013), Climate Change Impacts in Australia – WA accessed at http://www.climatechange.gov.au/climate-change/climate-science/climate-change-impacts/western-australia on 12 November 2013 11 Australian Government (2012), Australia In The Asian Century, Canberra 114878-1; April 2015_FINAL Page 6
Central East Sub-Regional Economic Strategy

While iron ore and gold has historically dominated Western Australia’s resource development profile,
this has diversified in recent years, to include offshore LNG, mineral sands, rare earths and
construction-related materials. The number of committed projects reflects Western Australia’s diverse
resource base and the increased resource demand as part of increasingly complex technological and
manufacturing processes. The emergence of mining activity in the Central East has seen the mining
industry overtake agriculture in terms of local value add 12. Similarly the proximity of the Sub-region to
the major mining area of the Goldfields, presents significant opportunities to capture investment in
machinery and equipment operations, services and labour force supply chains.

2.3           Population Ageing

Australia’s population is ageing. Over the next thirty years the share of the population aged 65 and
over is expected to increase from 12.5% in 2010 to over 20% in 2040 13. This is illustrated in the figure
below.
                           10                                                                                        25%

                                       9

                                       8                                                                             20%

                                       7

                                                                                                                          Share of Total Population
               Population (millions)

                                       6                                                                             15%

                                       5

                                       4                                                                             10%

                                       3

                                       2                                                                             5%

                                       1

                                       0                                                                             0%
                                           2010          2020              2030               2040         2050
                                                                65+   65+ Share of Total Population
                                                  Figure 4 Share of Population aged 65+, Australia

This trend is common across the Western World, with countries such as Japan and Italy experiencing
rapid ageing. This ageing is driving changes in Australia’s economy with health care and social
assistance overtaking retail in 2011 and again in 2014 as the largest employing industry Western
Australia.

12
     DSD (2013) Gross Value Added – by Industry, WA State Government, Perth
13
     IGR (2010) Intergenerational Report 2010, Australian Government, Canberra

114878-1; April 2015_FINAL                                                                                                                            Page 7
Central East Sub-Regional Economic Strategy
160
140
120
Jobs ('000) 100
80
60
40
20
0
Nov-2004 May-2006 Nov-2007 May-2009 Nov-2010 May-2012 Nov-2013
Mining Construction Retail Trade Health Care and Social Assistance
Figure 5 Employment by Industry, Western Australia, 2003-201414
This structural change reflects increased demand for health care, due to the ageing of the population.
However, health care is not readily accessible to all Australians with rural and regional communities
suffering from a deficit in health related services. This is further exacerbated by the fact that regional
Australia is ageing at a faster rate than the broader population. Initiatives including increased adoption
of telehealth and decentralised health care provision models are seeking to address this deficit. This
is expected to underpin growth of health care employment and activity in rural communities in regions
such as the Wheatbelt.
14
ABS (2013), Labour Force, Australia, Detailed, Quarterly, Cat No 6291.0.55.003, Australian Bureau of Statistics, Canberra
114878-1; April 2015_FINAL Page 8Central East Sub-Regional Economic Strategy
3.0 Profile of the Central East Economy
3.1 Population and Socio-Demographics
The Central East Sub-region was home to 10,345 people in 2011 15. This population is primarily
concentrated in the major townships of Merredin, Southern Cross and Kellerberrin; the Local
Government Areas (LGAs) of which collectively account for almost two in every three Central East
residents.
The Central East has experienced a moderate population decline over the past decade, averaging a
1.2% decrease per annum compared to growth of 2.2% for Western Australia as a whole. The WA
Tomorrow Population Estimates from the Western Australian Planning Commission project that this
trend will continue, with another 1,125 residents projected to leave the Central East by 202116.
However, this represents trend analysis, based on historical factors, and does not take into
consideration changing economic drivers and conditions of the sub-region and its relationship with the
broader national and global economies. Instead, an aspirational population of 12,500 by 2031 is
targeted for the Sub-region, representing a stabilisation and growth of local residents. This is
illustrated in the following figure.
14,000
12,000
10,000
8,000
Population
6,000
4,000
2,000
0
Population (2011) WAPC Projections (2021) Aspirational Target (2031)
Figure 6 Current and Future Residential Population
This aspirational growth target reflects the recent transformation of the Central East economy with the
establishment of mining activity. The mineral wealth of the Central East is expected to underpin long-
term mining investment and operations which will support the retention and growth of the sub-region’s
residential population.
The population of the Central East is expected to age rapidly over the next decade. This reflects the
fact that the sub-region and associated population centres already possess a comparatively older
15
ABS (2012) Estimated Residential Population, Cat Not 3218.0, Australian Bureau of Statistics, Canberra
16
WAPC (2012), WA Tomorrow Population Projections (Band C), Western Australian Planning Commission, Perth
114878-1; April 2015_FINAL Page 9Central East Sub-Regional Economic Strategy
population profile than State averages. According to the results of the 2011 Census of Population and
Housing, the residential populations of all LGAs in the Central East have higher proportions of people
aged 65+ (14.9%) than the State Average (12.3%). Towns such as Trayning (22.7%) and Kellerberrin
(20.7%) have more than one fifth of their current populations aged 65 and over17.
3.2 Labour Force and Skills
A significant driver of current and future residential population growth in the Central East will be the
increasingly constrained nature of local labour markets. In 2011, the Sub-region had an average
annual unemployment rate of 3.7%, below the comparative State average of 4.7% 18. This is illustrated
in the following figure.
100% 9%
90% 8%
80% 7%
Unemployment Rate
70%
Participation Rate
6%
60%
5%
50%
4%
40%
3%
30%
20% 2%
10% 1%
0% 0%
Bruce Rock
Kellerberrin
Koorda
Merredin
Mount Marshall
Mukinbudin
Narembeen
Nungarin
Trayning
Westonia
Yilgarn
Sub-Region
Greater Perth
WA
Particpation Rate (2011) Unemployment Rate (2011)
Figure 7 Unemployment and Participation Rate, Central East Sub-Region LGAs, 2011
Unemployment rates vary considerably across the Central East. This reflects differences in the
economic and social structures of individual communities and their role and function in the broader
sub-region. Mukinbudin, Mount Marshall, Narembeen and Yilgarn all have very low unemployment
rates and moderate to higher participation rates. This reflects the predominantly agricultural nature of
these locations, where employment opportunities are linked to farming activities. In contrast,
Nungarin, Trayning and Koorda all have higher unemployment rates, exceeding the State averages in
2011. These towns are characterised by lower levels of resident mobility with residents less likely and
able to migrate away for employment opportunities.
The low unemployment rate environment in the Central East has supported a labour force
participation rate that is higher (80.3%) than the State average (75.6%). Labour force participation
rate is the share of the population aged 15 and over actively participating in the workforce (either
employed or unemployed). A number of towns have rates above 70%, which is a common
characteristic among smaller, agricultural communities. With a low unemployment rate and solid
17
ABS (2012), Census of Population and Housing, 2011, Australian Bureau of Statistics, Canberra
18
ABS (2012) Census of Population and Housing, 2011, Australian Bureau of Statistics, Canberra
114878-1; April 2015_FINAL Page 10Central East Sub-Regional Economic Strategy
participation rate, any major employment growth in the Central East in the future will need to be
accommodated by migration and population growth.
3.3 Employment, Industry and Investment
The Central East Sub-region had a Gross Regional Product 19 in 2012/13 of approximately $1.32
billion 20. The economy has experienced rapid growth in recent years on the back of mining activity,
which is generating considerable industry value add to the economy. Other major drivers of economic
activity include construction, agriculture and transport, which collectively account for a further 22% of
the local economy. The economic structure of the Central East differs to the traditional understanding
of the sub-region’s economy, which is illustrated in the figure below.
Other
19%
Transport, postal &
warehousing
4%
Agriculture,
forestry & fishing
7%
Mining
Construction 59%
11%
Figure 8 Share of Industry Value Add21, Central East Sub-Region, 2012/13
This economic activity has underpinned local employment and business activity. In 2011, there were
5,259 jobs in the Central East, representing an employment self-sufficiency rate of 107%22. This high
employment self-sufficiency rate indicates that there are more jobs in the Central East than the local
workforce meaning labour is being sourced external to the Sub-region. This is typically seen in mining
region’s where FIFO or DIDO workforces are utilised and reflects the growing mining activity in the
sub-region. Employment in the Central East is highly concentrated with approximately 29% located in
Merredin and a further 27% in Yilgarn. This concentration of employment mirrors the distribution of the
population in the Central East.
19
Gross Regional Product is the value of the economic activity produced in the region, discounting for inputs produced in other
regions. It aligns with measures such as Gross State Product and Gross Domestic Product for States and Territories.
20
RPS (2013), RPS Economics Gross Regional Product Model, RPS, Gold Coast
21
Industry value added is the primary component of Gross Regional Product, excluding only the Ownership of Dwellings, Taxes
and Subsidies and Statistical Discrepancies. It represents the component of GRP associated with production and value added
by businesses and industries within the economy excluding inputs to product imported from other regions. Refer to Appendix B
for the Industry breakdown of Value Add in the Central East economy.
22
ABS (2007), Census of Population and Housing 2006, Australian Bureau of Statistics, Canberra
Employment self-sufficiency rate refers to the ratio of local jobs to local workers.
114878-1; April 2015_FINAL Page 11Central East Sub-Regional Economic Strategy
The number of business registrations has remained mostly stable between 2009 and 2012
(decreasing slightly by 5.2%). Despite being a period of global economic downturn, most businesses
in the Central East remained resilient and continued to operate at pre GFC levels. This is illustrated in
Figure 9.
1,500
1,200
Number of Businesses
900
600
300
0
2009 2010 2011 2012
Figure 9 Share of Locally Registered Businesses, Central East Sub-Region LGAs, 2009 to 2012
Note that this data covers locally registered businesses only. Major mining and other national
registered businesses located in the Central East are not captured as part of this data.
A review of small business numbers in the Central East reveals a concentration of business creation
in Merredin, with 450 small businesses in 2012. This is followed by Yilgarn with 260. However, when
adjusted for population size, Koorda has the highest rate of small business formation with 180 small
businesses per 1,000 residents, just ahead of Nungarin at 171. In contrast, Merredin had only 136
businesses, though this remains above the whole of Wheatbelt (134 businesses per 1,000 residents)
and Perth (85 businesses) averages. This is outlined in the table below.
Table 1 Small Business Population and Rate, Central East LGAs, 2012 23
LGAs Small Business Population Small Businesses per 1,000 Residents
Bruce Rock 130 134
Kellerberrin 150 123
Koorda 80 180
Merredin 450 136
Mount Marshall 80 165
Mukinbudin 80 158
Narembeen 110 135
Nungarin 40 171
Trayning 60 170
23
ABS (2013), Count of Businesses, Cat No 8165.0, Australian Bureau of Statistics, Canberra and ABS (2013) Estimated
Residential Population, Cat No 3218.0, Australian Bureau of Statistics, Canberra
114878-1; April 2015_FINAL Page 12Central East Sub-Regional Economic Strategy
LGAs Small Business Population Small Businesses per 1,000 Residents
Westonia 40 143
Yilgarn 260 157
Central East 1480 144
3.4 Housing and Affordability
The Central East housing market is comprised of almost 5,100 dwellings, of which approximately
73.8% are occupied24. This would suggest that the Sub-regional housing stock has excess capacity.
However, consultation with stakeholders indicates that a number of these unoccupied dwellings, at
the time of the Census in 2011, were no longer vacant. Similarly, stakeholders also indicated that
many of the unoccupied dwellings were vacant due to housing quality issues and that the ability for
new and existing residents to secure quality housing options is limited. The current housing stock is
predominantly comprised of detached housing, which accounted for 98.8% in 2011.
Over the past five years, the Central East Sub-region and the broader Western Australian housing
market has experienced price volatility due to the impact of the global financial crisis (GFC). This has
resulted in depressed levels of consumer confidence affecting median house prices and price growth.
While there has been volatility in the Central East housing market, the Sub-region’s median house
price has increased from $86,000 in 2006 to $150,000 in 2012 25. This is illustrated in the figure
below.
$160,000
$140,000
$120,000
$100,000
Median Price
$80,000
$60,000
$40,000
$20,000
$0
2006 2007 2008 2009 2010 2011 2012 2013
Figure 10 Median House Prices, Central East Sub-Region, 2006 and 2013
Individual median house price figures and growth for each of the Central East’s LGA’s to 2012 can be
reviewed within Appendix C. The small size of the real estate market within some LGA’s may impact
the median house price which is dependent on sales recorded during the period. Despite this, many
LGAs experienced positive price growth over the 6 years with Yilgarn, Bruce Rock, and Mount
Marshall experiencing the strongest growth.
24
ABS (2012), Census of Population and Housing 2011, Australian Bureau of Statistics, Canberra
25
RPData (2012), Online Data Subscription, RPData, Brisbane
114878-1; April 2015_FINAL Page 13Central East Sub-Regional Economic Strategy
Price growth is generally regarded as positive as it contributes to the wealth and affluence of a region.
However, for the Central East, maintaining affordable housing options is critical to underpinning
employment and lifestyle based migration required to increase local population critical mass. A simple
and effective measure of whole-of-market affordability is the Median Multiple – the ratio of median
house prices to median household income 26. In other words, the Median Multiple illustrates the
number of years of household income required to equal current prices. This approach is effective as it
allows for differences in local income levels within a region – like the Central East – to be considered,
ensuring that variations in purchasing power and relative affordability are determined.
7
6
5
Median Multiple
4
3
2
1
0
Bruce Rock
Kellerberrin
Koorda
Merredin
Mount Marshall
Mukinbudin
Narembeen
Nungarin
Trayning
Westonia
Yilgarn
WA
Figure 11 Median Multiples, Central East Sub-Region, 201127
RPS calculated the Median Multiple for LGA’s with available datasets in the Central East and found
their Median Multiple to be less than the WA average of 6.0. This reflects the fact that while house
prices are relatively low by State standards, local household incomes are more favourable, meaning
local buyers have relatively greater purchasing power in the market. Note that the current State
average is regarded as seriously unaffordable by international standards, with the Reserve Bank of
Australia considering a ratio of 4.0 to 4.5 affordable in Australia. Due to the lack of property sales
statistics for the 2011 period, the Shire’s of Nungarin, Trayning and Westonia lack median multiple
calculations for comparison against other Central East LGA’s.
Kellerberrin and Yilgarn had the highest median multiples in 2011, at or just below 3.0. This is
significantly higher than the Shires of Mount Marshall and Koorda, but is almost half the WA average
in 2011. The growth of mining activity, and associated employment generation is expected to place
increased pressure on certain towns and Shires in the region, which will likely see affordability
worsen. Managing and maintaining affordability in the Central East is critical to stabilising and
accelerating the population growth needed to underpin local economic prosperity.
26
Demographia (2013), International Affordable Housing Report 2013, Demgoraphia, USA
27
Note that data was not available in the 2006 and 2011 for a number of Local Government Areas. This reflects the small size
of these markets and the lack of critical mass of sales for median house prices to be calculated.
114878-1; April 2015_FINAL Page 14Central East Sub-Regional Economic Strategy
3.5 Community Services and Facilities
The residential population in the Central East has and will continue to underpin demand for
community services and facilities in the Sub-region. This includes, but is not limited to:
Child Care Services;
Primary, Secondary and Tertiary Education;
Community Resource Centres and Libraries;
Aged Care and Retirement Villages; and
Hospitals and Health Services.
The current offering and drivers of these community services and facilities are examined below.
3.5.1 Child Care
The provision of childcare and flexibility in delivery to suit rural areas is a critical component of service
delivery for the Central East. As outlined in Section 3.2 the Central East labour market is constrained.
Access to childcare allows greater parent participation in the workforce as well as offering early
learning opportunities for children and boosting human capital.
Fertility rate data is an effective leading indicator of the level of demand for child care services. In
2010, almost all towns in the Central East had fertility rates above replacement levels (2.1 children)
and were mostly well above the average for Greater Perth (1.828). Interestingly, the fertility rates of the
various towns varied quite significantly – Narembeen and Yilgarn – are among the lowest for the sub-
region. In contrast, Koorda, Trayning and Mukinbudin have the highest fertility rates, with Trayning
more than doubling that of Narembeen and Yilgarn, approaching 4.5. At over 6, Koorda’s rate is one
of the highest in the State and has been steadily climbing in recent years. This is illustrated in the
figure below.
28
ABS (2012), Births Australia, Cat No 3301.0, Australian Bureau of Statistics, Canberra
114878-1; April 2015_FINAL Page 15Central East Sub-Regional Economic Strategy
7
6
5
Fertility Rate
4
3
2
1
0
Bruce Rock
Kellerberrin
Koorda
Merredin
Mount Marshall
Mukinbudin
Narembeen
Nungarin
Trayning
Westonia
Yilgarn
Sub-Region
Greater Perth
WA
Figure 12 Fertility Rate, Central East Sub-Region and Greater Perth, 2011
This high fertility rate, coupled with low unemployment and strong labour force participation, will
generate demand for child care services. There are currently 5 Child Care centres in the Central East
Sub-region and 3 family day care operations:
Long Day Care (Centre Based Care)
» Bruce Rock, Merredin
Occasional Care (Flexible Centre Based Care)
» Mukinbudin, Narembeen and Southern Cross
Family Day Care (Individual Home Based Care)
» Merredin, Bencubbin and Mukinbudin
Fertility rates are calculated year by year, and then averaged over three years to the year of the
current release. When raw data numbers fall below 3 data is suppressed to protect individuals
identities. This is the case for the Shire’s of Mount Marshall, Nungarin and Westonia in 2011. As the
fertility rate is a ratio of births to population, low population sizes can produce large variations in the
fertility rate.
3.5.2 Primary, Secondary and Tertiary Education
Despite the ageing of the population in the Central East, many towns in the Sub-region also have
above average shares of residents aged 0-14 years. This reflects the long-term impact on the Central
East’s demographic profile of structurally high fertility rates. A review of the demographic data from
the ABS reveals that, with the exception of Narembeen, Trayning, Westonia and Yilgarn, all other
towns in the Central East have 0-14 shares above the average for Greater Perth29. This is illustrated
in the figure below.
29
ABS (2012) Population by Age and Sex, Cat No 3235.0 Australian Bureau of Statistics, Canberra
114878-1; April 2015_FINAL Page 16Central East Sub-Regional Economic Strategy
30%
25%
Share of Residential Population
20%
15%
10%
5%
0%
Bruce Rock
Kellerberrin
Koorda
Merredin
Mount Marshall
Mukinbudin
Narembeen
Nungarin
Trayning
Westonia
Yilgarn
Sub-Region
Greater Perth
WA
Figure 13 Share of Residential Population Aged 0-14, Central East Sub-Region, Greater Perth and WA,
2011
The Central East Sub-region has 15 schools, 9 primary schools (7 public schools and 2 private
schools), 5 district high schools (K-10) and one college (K-12) which offer primary and secondary
education. Primary education is evenly distributed with most towns having a primary school.
Secondary schooling is more concentrated with district high schools in 5 of the 11 LGA’s and one
college. As a result of the population distribution in the Sub-region, there is considerable variation in
school sizes (e.g. 24 students at Nungarin Primary School 30 to 563 students at Merredin College).
Merredin College provides the only formal K-12 education within the region although SIDE (School of
Isolated and Distant Education) curriculum is provided through some district high schools for year 10-
12 students. Merredin College also includes a residential boarding facility, providing access to high
quality education for students who are otherwise disadvantaged by distance.
Merredin College was formed through the amalgamation of Merredin North and Merredin South
Primary Schools and the Merredin Senior High School onto the redeveloped Merredin Senior High
School campus, in 2011-12. The redevelopment of the Merredin Residential College to complement
the Merredin College development has resulted in greater demand for student residential boarding.
Merredin Residential College is set to increase student boarding capacity from 48 to 72 students after
the State Government committed a further $3.9 million in the 2014-15 budget 31. The investment and
provision of secondary schooling and boarding in the Central East enhances education choice and is
critical to the attraction and retention of working age families necessary to support local economic
development. Education reform measures (e.g. Year 7 transition to Secondary Schooling from 2015)
and increased metropolitan education expenses may potentially impact families making education
decisions for their children.
The labour force in the Central East is characterised by an expected concentration of applied tertiary
education qualifications (i.e. formal training and TAFE). This is reflected both in the local employment
30
DET (2014) Schools Online accessed at http://www.det.wa.edu.au/schoolsonline/main_page.do on 27 August 2014
31
WA Government (2014) Media Statements access at
http://www.mediastatements.wa.gov.au/pages/StatementDetails.aspx?listName=StatementsBarnett&StatId=8340 on 21 July
2014
114878-1; April 2015_FINAL Page 17Central East Sub-Regional Economic Strategy
mix but also local tertiary education provision. The C.Y. O’Connor Institute is the primary tertiary
education and training facility in the Central East and the Wheatbelt region with locations in Northam,
Merredin, Moora, Narrogin and Muresk 32. A wide range of practical courses are offered with a strong
focus on administration, tourism, agricultural and manufacturing related qualifications. Opportunities
exist to strategically diversify offerings into mining-related occupations to support increased cross-
industry mobility of the Central East labour force in response to macro-economic opportunities and
decreased unemployment levels.
3.5.3 Libraries and Community Resource Centres
In 2011 in metropolitan Perth, there was one library for every 23,794 residents equating to a total
supply of 77 libraries. The provision of libraries and associated facilities in the Central East is more
considerable with one library for every 900 residents33. There are a number of potential explanations
for this apparent over-provision:
The decentralised and distributed population of the Central East has required a more dispersed
library network than in metropolitan Perth;
The number of libraries doesn’t comment on the size and service capabilities of those libraries.
Metropolitan libraries tend to be larger and therefore have the capacity to service larger population
catchments; and
Libraries are most often provided by local governments. Every LGA in Central East is home to a
library and or a Community Resource Centre.
Community Resource Centres (CRCs) are heavily relied on in the Central East for public internet
access, some government services such as Centrelink, library services and in some cases visitor
servicing. Ongoing utilisation of library and CRC facilities will enable communities to anchor
improvements in local technology and communication networks and ensure continued provision of
support for local community groups and associations and small businesses.
32
C.Y. O’Connor Institute accessed via http:// www.cyoc.wa.edu.au on 23 August 2012
33
SLWA (2012), List of Libraries in Western Australia, State Library WA, Perth
114878-1; April 2015_FINAL Page 18Central East Sub-Regional Economic Strategy
3.5.4 Aged Care, Hospitals and Health Services
The older age profile of the Central East will underpin continued demand for aged care and retirement
village offerings. In 2012, there were 7 registered Aged Care facilities offering 94 dedicated aged
care beds (residential high, low care and respite only). The distribution of these beds is concentrated
in Kellerberrin and Merredin, although Bruce Rock, Narembeen, Trayning (Kununoppin Hospital) and
Southern Cross also provide aged care services. This total figure includes Wyalkatchem-Koorda as it
is incorporated under the Eastern Wheatbelt MPS (Multipurpose Service) area34.
There appears to be some misalignment between the distribution of aged care facilities in the Central
East and the concentration of people aged 65+ in the sub-region. Figure 14 below highlights that
Kellerberrin currently plays a greater role in aged care facility distribution than its local 65+ population
would indicate, while Merredin which is home to 28% of people aged 65+ currently has local aged
care bed capacity for only 21.3%.
40%
35%
30%
Share of Sub-Region
25%
20%
15%
10%
5%
0%
Bruce Rock
Kellerberrin
Koorda
Merredin
Mount Marshall
Mukinbudin
Narembeen
Nungarin
Trayning
Westonia
Yilgarn
Population Aged 65+ Aged Care Beds
Figure 14 65+ Population and Aged Care Beds, LGA Share of Central East, 2012
In 2012, there were 78 public hospital beds in the Central East35, spread across Bruce Rock,
Kellerberrin, Merredin, Narembeen, Trayning (Kununoppin) and Yilgarn. Merredin is recognised as an
Integrated District Health Service whereas Bruce Rock, Kellerberrin, Narembeen, Kununoppin and
Yilgarn are all small hospitals.
Merredin Hospital supports the MPS sites/small hospitals and nursing posts to deliver services to the
Eastern Wheatbelt Health District 36. The Eastern Wheatbelt Health District Services Plan has
identified a number of reform measures to modernise and strengthen health service delivery for the
Eastern Wheatbelt to support the delivery of regional health services. This includes an extensive
capital works program funded through the Southern Inland Health Initiative to perform major works to
34
Verso Consulting, Central East Aged Care Needs Study, November 2012 pg. 40
35
AIHW (2012), Australian Hospital Report, 2010/11, Australian Institute of Health and Welfare, Canberra
36
DoH (2012), Services Plan Eastern Wheatbelt Health District, WACHS Wheatbelt 2011/12-2021/22 pg.2-3
114878-1; April 2015_FINAL Page 19Central East Sub-Regional Economic Strategy
37
Merredin Hospital and other works for small hospitals (Bruce Rock, Kellerberrin, Kununoppin,
Narembeen and Southern Cross 38) and nurses outposts.
38
Within the sub-region there are 94 dedicated aged care beds .There are no residential aged care
beds in Mt Marshall, Mukinbudin, Nungarin and Westonia. These LGA’s generally access aged care
beds within surrounding Shire’s (Trayning, Merredin and Kellerberrin). In the Aged Care sector,
Community Care Packages (CCP’s) are continuing to gain recognition as an effective delivery
mechanism to servicing regional populations. Operationally, they reduce hospital/residential inpatient
admissions and socially respect the aspirations of residents to maintain independence and remain in
their local community for as long as possible. Within this vision, it is imagined that older persons can
enter a system that supports a continuum of care, from basic home care through to palliative care in
the home. Service provision is likely to require collaboration across WACHS, and private providers.
The Central East Aged Care Alliance (CEACA) - a partnership that includes all LGA’s within the
Central East plus Koorda & Wyalkatchem - has played a critical role in identifying solutions to
accommodate an ageing population and enable people to remain living in the Central East as they
age. Their research focuses on four strategies and builds on existing community capacity,
infrastructure and services. The strategies include:
Continued development of age friendly communities;
Further development of older persons housing;
Broadening community aged care; and
Reshaping residential aged care.
The final report (Central East Wheatbelt Aged Support and Care Regional Solution/s, 2012) identifies
five recommendations that CEACA are working toward implementing. Suitable older persons housing
is a key element of the recommendations, and critical in enabling older people to remain living in the
community of their choice. CEACA have identified a critical shortage of suitable housing and are
investigating modern design concepts such as ‘universal design’ and ‘cluster housing’ to deliver
contemporary aged care provisions to communities in the Central East.
37
WA Government (2014) Media Statements accessed at
http://www.mediastatements.wa.gov.au/Pages/StatementDetails.aspx?listName=StatementsBarnett&StatId=8460 on 22 July
2014
38
WA Government (2014) Media Statement accessed at
http://www.mediastatements.wa.gov.au/Pages/StatementDetails.aspx?listName=MinisterialStatementsBarnett&StatId=288 on
22 July 2014
114878-1; April 2015_FINAL Page 20You can also read